Voter Identification Laws and Voter Turnout 1 Kyle A. Dropp 2 May 28, 2013 1 Please do not cite without the author’s permission. I would like to thank Jonathan Rodden, Paul Sniderman, Jowei Chen, Gary Cox, John Geer, Justin Grimmer, Bobby Gulotty, Shanto Iyengar, Alexander Lee, Avital Livny, Clayton Nall, Amanda Robinson, Arjun Wilkins, the Stanford Methods Workshop and the Stanford American Politics Workshop for helpful comments. 2 Ph.D. candidate, Department of Political Science, Stanford University, [email protected]1
Transcript
Voter Identification Laws and Voter Turnout1
Kyle A. Dropp2
May 28, 2013
1Please do not cite without the author’s permission.I would like to thank Jonathan Rodden, Paul Sniderman, Jowei Chen, Gary Cox, John Geer, JustinGrimmer, Bobby Gulotty, Shanto Iyengar, Alexander Lee, Avital Livny, Clayton Nall, AmandaRobinson, Arjun Wilkins, the Stanford Methods Workshop and the Stanford American PoliticsWorkshop for helpful comments.
2Ph.D. candidate, Department of Political Science, Stanford University, [email protected]
1
Do Voter Identification statutes reduce voter turnout? This paper demonstrates thatthe expansion of Voter ID statutes in the past decade has demobilized Democratic-leaning individuals including young adults, renters, the poor and African Americans.I assess millions of individual voting records over five general elections (2004-2012)and document that Voter ID’s demobilizing effects are larger during low saliencemidterm elections than during presidential contests. The study’s difference-in-differencesapproach compares voter turnout among voter subgroups in states that underwentVoter ID policy changes with turnout among voters in states with no election lawpolicy change.
2
Thirty states have enacted and adopted laws requiring voters to show an ID at the
polls before they may cast a ballot.3 In 2011 alone, 34 states introduced Voter ID
legislation and eight states adopted new policies.4 This paper examines whether the
expansion of Voter ID statutes has reduced voter turnout and whether these statutes
disproportionately demobilize certain subgroups of voters.
The scholarly literature on Voter ID has yielded puzzling, contradictory findings
because it suffers from methodological and data limitations – it has assessed earlier,
more lenient statutes, analyzed aggregate county or state-level data incapable of
detecting effects across voter subgroups and relied on survey-based studies containing
measurement and sampling error.5 My research examines both strict and lenient
policies over the past decade, minimizes sampling error and addresses (and dismisses)
many potential threats to validity.
My research aggregates tens of millions of individual level voting records over five
general elections (2004-2012) using a national voter database. I isolate groups with
low ID ownership rates such as the working class, renters, African Americans, young
3National Conference of State Legislatures http://www.ncsl.org/documents/legismgt/
elect/Canvass_Apr_2012_No_29.pdf4This expansion was driven by a U.S. Supreme Court decision upholding an Indiana statute,
Crawford v. Marion County Election Board, 553 U.S. 181 (2008), and widespread Republican gainsin 2010 in state houses. http://www.ncsl.org/legislatures-elections/elections/voter-id.aspx
5For a list of studies, see http://www.brennancenter.org/content/resource/research_on_
adults and Hispanics using demographic information contained in the voter files.
Then, I use a difference-in-differences approach to compare the turnout of these voter
subgroups before and after a Voter ID law change with turnout patterns among the
same subgroups in states with no policy change over the same time frame.
This paper has two principal findings. First, Voter ID statutes exert a modest but
meaningful demobilizing effect between one and three percentage points overall. My
research is among the first to demonstrate that Voter ID laws disproportionately
demobilize the poor, young adults, renters and African Americans, and these hetero-
geneous effects are robust to a series of data validity checks.6
Second, Voter ID laws are more likely to reduce turnout in lower salience midterm
elections. Political scientists have examined differential voting patterns between high
stimulus presidential elections and low stimulus midterms elections for decades. This
finding suggests that widespread mobilization and voter outreach efforts during pres-
idential contests can offset the impact of election laws and policies that impose costs
on voters.
The results discussed below indicate that Voter ID laws have modest effects that are
substantial enough to influence election outcomes in close races. Since the results
6See the Appendix for a fuller discussion that addresses estimation issues related to the non-random assignment of Voter ID policies to states, the Stable Unit Treatment Value Assumption(SUTVA) and more.
4
indicate that Voter ID demobilizes groups that disproportionately favor Democrats,
a decrease in voter turnout corresponds with a decline in Democratic vote share. A
one percent reduction in turnout among adults under 30 in 2008 corresponds with
a 0.4% decline in Democratic vote share because they supported Democrats by a
2-to-1 margin.7
Furthermore, modest declines in Democratic vote share can influence both top-of-
the-ballot contests, along with Congressional, mayoral and state legislative races.
The margin of victory has been less than two percentage points in four percent of
state legislative races between 1968 and 2010 and less than one percentage point in
two percent of contests.8
The study proceeds as follows. First, I describe the widespread adoption of Voter
Identification statutes in the past decade and assess the scholarly literature. Then,
I discuss hypotheses, research design, data sources and findings. The last section
concludes.
7A one percent reduction among African Americans in Ohio, who typically cast 95%+ of theirballots for Democrats, corresponds with a loss of more than 5,000 votes for Democrats in a presi-dential election.
8Source: Klarner, Carl, William Berry, Thomas Carsey, Malcolm Jewell, Richard Niemi, LyndaPowell, and James Snyder. State Legislative Election Returns (1967-2010). ICPSR34297-v1. AnnArbor, MI: Inter-university Consortium for Political and Social Research [distributor], 2013-01-11.doi:10.3886/ICPSR34297.v1.
5
The Expansion of Voter Identification Statutes
Figure 1 displays state-level Voter ID statutes from 2002 to the present. States
in white have adopted the Help America Vote Act (HAVA) minimum requirement,
whereby voters can present an range of IDs or the last four digits of their Social
Security Number to register and vote.9 States shaded light blue require a Non-Photo
ID (e.g., bank statement) and states shaded blue require a Photo ID (e.g., driver’s
license). Dark blue states require a Photo ID and provide limited alternatives for
casting a provisional ballot.10
Figure 1 exhibits at least three trends: Voter ID policies have spread across the
country, have become more stringent and have spread as a result of factors other
than simple diffusion to neighboring states.
9See the Appendix for more information on HAVA10Alvarez et al. (2007) use an 8-point coding scheme rather than a 4-point classification. They
assign states to the following Voter ID requirements: state name, signature, matching signature,request ID, require Non-Photo ID, require ID plus signature, request Photo ID, require Photo ID.The four point classification is more appropriate for illustrating the decade-long trend toward morestringent Voter ID policies. The 4-point classification scheme used in this paper is based on theNational Conference of State Legislatures’ methodology.
6
Figure 1: Voter ID statutes from 2002 to present. The shading corresponds withthe HAVA minimum (white), a Non-Photo ID requirement (light blue), a Photo-IDrequirement (blue) and a Photo-ID requirement with limited provisional balloting(dark blue).
7
First, Voter ID policies have spread from the South across the country in the past
decade. Since 2002, Voter ID statutes have spread from Conservative Southern states
to the Mountain West, the Southwest, the Midwest and even the Northeast. In 2011,
only three states without Voter ID statutes – Oregon, Vermont and Wyoming – did
not consider legislation to strengthen existing policy.11
Second, Voter ID statutes have become more restrictive. In 2001, no Voter ID states
turned away voters without a suitable ID. These early Voter ID statutes requested
a Non-Photo ID and provided voters with opportunities to cast provisional ballots.
Today there are Photo ID requirements in 11 states, compared with four in 2004 and
none in 2002. Since Indiana enacted the first strict Voter ID policy in 2006, at least
10 more state legislatures have passed strict policies.12 The trend is exemplified in
Indiana, where voters must present an ID issued by the state or federal government
that contains an individual’s name, a photo and an expiration date.
Third, the spread of Voter ID statutes has been driven by partisan factors. There is
a strong relationship between GOP control of state government and a state’s Voter
ID policy. Twenty-one of the 26 states where Republicans controlled both legislative
chambers after the 2010 elections have enacted Voter ID statutes above the HAVA
minimum, and Republicans have unified legislative control in all 11 states with the
most stringent Photo ID or Strict Photo ID requirements.13 On the other hand, only
4 out of 15 states with current unified Democratic legislative control have enacted
Voter ID statutes.14 Not surprisingly, these policies are supported or opposed along
party lines at both the state and federal level, with more than 95% of Republicans
supporting Voter ID legislation compared with fewer than 5% of Democrats at both
levels.15
The Scholarly Literature
A burgeoning research literature, summarized in Table 1, has yielded puzzling, mixed
findings on the impact of Voter ID statutes on voter turnout. Some scholars have
13They had unified Republican control after the 2010 midterm elections.14I obtained data on the party composition of state legislatures from 2000-2011 from the Na-
tional Conference of State Legislatures and merged it with the four-point classification of Voter IDstatutes (1 = HAVA minimum, 2 = Non-Photo ID, 3 = Photo ID, 4 = Strict Photo ID). Overall, thecorrelation between unified GOP control of state legislatures in 2011 and current Voter ID policyis .57. The four Democratic states with Voter ID laws are Arkansas, Connecticut, Delaware andWashington. Each implemented a relatively weak Voter ID statute. Biggers and Hanmer (2011)examine Voter Identification statutes from 1972-2011 and find that partisan factors are more im-portant than diffusion to neighboring states in predicting the passage of Voter ID statutes: “theswitch to a Republican governor has a large positive effect on this decision to require identificationat the polls” (Biggers and Hanmer, 2011, p. 27). The state legislative figures are valid for the statelegislatures after the 2010 midterm elections.
15For example, more than 95% of Republican legislators supported Voter ID laws introducedat the state level between 2005 and 2007, compared with just 2% of Democrats, (Brief of AmiciCuriae of Historians and Other Scholars in Support of Petitioners. Crawford et al. v. MarionCounty Election Board et al. Nos. 07-21, 07-25 (U.S., 2007) and there is a similar partisan gapamong Voter ID bills at the federal level. For instance, the“average difference between the percent ofRepublicans and Democrats voting yea on the eleven Senate votes relating to HAVA was ninety-onepercentage points” (Lee, 2009).
9
found that Voter ID laws exert a minimal impact on turnout because the laws are
inconsistently implemented, most Americans have valid forms of identification, few
voters would be turned away from the polls based on previous state-by-state require-
ments, adults without IDs are not likely to vote even in the absence of Voter ID
statutes and many states allow voters without IDs to cast provisional ballots (An-
solabehere, 2009; Lott, 2006; Milyo, 2007; Mycoff et al., 2009; Pastor et al., 2010).16
Ansolabehere (2009) examines Current Population Survey (CPS) data and concludes
that “[v]oter ID appears to present no real barrier to access” because poll workers
rarely ask for ID and individuals almost never say they did not vote because they
lacked an ID. Mycoff et al. (2009) analyze data from the Cooperative Congressional
Election Study (CCES) and similarly find that there is no relationship between the
strictness of Voter Identification laws and turnout after controlling for demographic
variables.
Other scholars have found that Voter ID statutes decrease turnout because they im-
pose a cost on Americans without valid forms of identification (Alvarez et al., 2007,
16Based on state-by-state requirements, few voters would be turned away from casting aballot because they lack an ID. One study estimates that .5% of respondents would beprevented from voting (Alvarez et al., 2008) http://www.american.edu/spa/cdem/upload/
VoterIDFinalReport1-9-08.pdf while another estimates that one tenth of one percent of vot-ers would be prevented from voting (Ansolabehere, 2007).
Fourth, studies of Voter ID statutes do not examine the full effect of requiring an ID versus askingfor no ID. The Help America Vote Act established minimum identification standards for first-timevoters and absentee voters, so any change in Voter ID policy is relative to those federal minimumstandards.
Table 1: Findings from Previous Voter ID StudiesTreatment
Authors Effect Data ElectionsAlvarez et al. 2011 -1 to -2% CPS 2000-06Ansolabehere 2009 No Effect CCES, CPS 2006Erikson and Minnite 2009 No Effect CPS 2002-06Milyo 2007 +2% Aggregate 2002-06Muhlhausen and Sikich 2007 No Effect CPS 2004Mycoff et al. 2009 No effect CCES 2000-06Vercellotti and Anderson 2004 -3 to -7% CPS, 2004
Aggregate
2011; Logan et al., 2007; Vercellotti and Anderson, 2006). Alvarez et al. (2011) ana-
lyze recent Current Population Survey data and find that stricter Voter ID require-
ments exert a larger, more negative effect on turnout compared with less stringent
policies.
These mixed findings result from both data and methodological limitations. First,
the available survey-based and aggregate data lacks statistical power to detect modest
treatment effects across voter subgroups. Aggregate level studies using counties or
states cannot document the impact of state-level interventions on voter subgroups
because these units of analysis have limited variation on background characteristics
such as race, age or gender. Survey data contains sampling error caused by small
samples and measurement error in self-reports of voter turnout.
Scholars have highlighted these data limitations: “[W]e see the existing science re-
11
garding voter suppression as incomplete and inconclusive. This is not because of any
reason to doubt the suppression effect but rather because the data that have been
analyzed do not allow a conclusive test” (Erikson and Minnite, 2009, p. 98).17
Overall, the previous research literature on the subject has yielded mixed findings
because it assesses earlier, more lenient statutes, aggregate level studies cannot detect
subgroup effects, sampling error in survey data may overwhelm treatment effect sizes
and survey data contains measurement error.
Hypotheses
Voter ID statutes may reduce turnout for at least three reasons: millions do not
have valid forms of identification, Americans with valid IDs may be confused by a
new statute’s requirements or concerned about the fairness of the law’s implemen-
tation18 and Voter Identification laws may reduce voter impersonation, one type of
17Similarly, previous studies may have yielded null findings because they examine only earlier,more lenient election law changes: “[S]ince the changes in voter identification requirements havereally only started since the passage of HAVA in 2002 and the law we are most interested in –photo identification requirements – was only implemented in 2006, we have only a small amountof information in the available data about how each of the voter identification requirements mightaffect participation” (Alvarez et al., 2011, p. 10).
18Cobb et al. (2012) administered an exit poll in Boston and find racial differences in the admin-istration of Voter ID policy: “We find strong evidence that Hispanic and black voters were askedfor IDs at higher rates than similarly situated white voters” (Cobb et al., 2012, p. 3). Ansolabehere(2009) also finds that minorities are more likely to report that they were asked to present an ID: “Inthe 2006 general election, 47% of white voters reported being asked to show photo identification atthe polls, compared with 54% of Hispanics and 55% of African Americans. In the 2008 Super Tues-day primary states, 53% of whites were asked to show photo ID, compared with 58% of Hispanics
12
voter fraud.20 I test these competing mechanisms in the findings section by identify-
ing situations where the identification and information hypotheses predict different
outcomes.
Identification Hypothesis. Voter ID statutes place an additional cost on citizens
because millions of Americans lack valid forms of identification. While registered
voters with valid IDs can show up at the polls on Election Day and cast a bal-
lot, Americans without suitable IDs must also acquire a valid form of identification
before Election Day. Research indicates that subgroups such as young adults, mi-
norities, the working-class, renters and the elderly are less likely to own a suitable
ID.21 These groups also disproportionately favor the Democratic Party22 and tend
and a staggering 73% of African Americans” (Ansolabehere, 2009, p. 128).1920According to the NCSL, “Little evidence exists that fraud by impersonation at the polls is
a common problem”http://www.ncsl.org/documents/legismgt/elect/Canvass_Apr_2012_No_29.pdf. Voter ID policies may reduce voter impersonation, but in-person voter fraud is onlyone of many types of voter fraud. In general, the potential for fraud is much higher with ab-sentee balloting than for in-person voting http://www.nytimes.com/2012/10/07/us/politics/
as-more-vote-by-mail-faulty-ballots-could-impact-elections.html?pagewanted=all21Racial differences: Twenty-five percent of African Americans, 18% of seniors and 18% of
adults under 25 lack the government-issued photo ID necessary to cast a ballot in stringentVoter ID states, compared with 8% of whites, according to the Brennan Center for Justice.http://www.brennancenter.org/page/-/d/download_file_39242.pdf. See also http://www.
Pawasarat (2005) finds that African Americans and Hispanics are less likely to have driverslicenses than whites in Wisconsin: “Less than half (47 percent) of Milwaukee County AfricanAmerican adults and 43 percent of Hispanic adults have a valid drivers license compared to 85percent of white adults” (Pawasarat, 2005, p. 1).
Age, income, rental status differences: “The population that changes residence frequently is mostlikely to have a drivers license address that differs from their current residence. This would includelower-income residents who rent and students and young adults living away from home”(Pawasarat,2005, p. 2). For additional evidence, see (Barreto et al., 2007; Sanchez et al., 2011; Pawasarat,2005)
22According to the 2008 National U.S. House Exit poll, 93% of African Americans voted for
to be less familiar with the electoral system.23 This hypothesis suggests, for in-
stance, that stricter Voter ID laws should demobilize more voter than less stringent
implementations.
Information Hypothesis. The second explanation, the information hypothesis,
focuses on how the requirements of a newly adopted statute are communicated to
voters. First, Voter ID policies can be exceedingly complex and it can be quite dif-
ficult for citizens to follow evolving legislation and court decisions. Second, citizens
with valid IDs may be deterred from voting because they are confused or mislead
about the provisions of a newly adopted statute. Advertisements sponsored by the
Pennsylvania state government, for instance, told voters they must present an ID
weeks after a court postponed a Voter ID law,24 polling places have incorrectly dis-
played signs asking voters to present specific IDs25 and campaign phone calls have
mislead voters about proper forms of identification. Third, studies have shown that
Democrats, along with 68% of Latinos, 63% of Asians, 63% of 18-29 year-olds. Adults 65 and oversplit about evenly, 49% Democrat to 48% Republican. Fifty-nine percent of renters identify asDemocrats or leaned Democrats, compared with 41% of home owners, according to a Gallup pollconducted January 5-8, 2012. In the same poll, 50% of home owners self-identified as Republicanor leaned Republicans, compared with 31% of renters.
23When there are changes in election administration policies, Americans with higher levels ofcivic skills, resources or flexibility in work schedule may adapt more readily than those without suchskills: “[The] presence or absence of resources contributes substantially to individual differences inparticipation. Resources are, in turn, not equally distributed; some socioeconomic groups are betterendowed than others” (Brady et al., 1995, p. 274).
Voter ID laws are inconsistently implemented at the polls – poll workers incorrectly
have told voters new laws require certain forms of identification and poll workers are
more likely to ask minority voters to present IDs (Cobb et al., 2012). This can reduce
turnout because it may cause voters to leave the polling place or force individuals to
cast a provisional ballot, which may or may not be counted in an official tally.
Cumulatively, this leads to the first prediction:
H1a: Voter ID laws will reduce turnout because they exclude voters with-
out valid IDs and alter the information environment.
We can adjudicate between these competing mechanisms by identifying situations
when the information environment changes dramatically but ID requirements remain
constant, such as courts overturning pending legislation, or vice versa.26
Voter ID statutes may not influence turnout if campaigns and interest groups devote
additional resources toward voter education and outreach aimed at Americans lack-
26 We can also identify situations when ID requirements shift dramatically but the informationenvironment remains similar, such as comparing the impact of a shift from no policy to a non-photopolicy versus a shift from no policy to a photo ID policy.
15
ing IDs,27 interest groups collaborate with traditional allies,28 or organized interests
shift their mission to focus on voter outreach and education campaigns rather than
persuasion efforts.29 When voter mobilization and outreach efforts are less compre-
hensive, however, policies that impose costs on voters can reduce turnout.
The political science literature on differential voting patterns across midterm and
presidential contests suggests that the impact of Voter ID laws depends on the type
of election (Campbell, 1960). During high stimulus presidential contests, campaigns
will have many more opportunities to help citizens obtain valid IDs and energized
citizens will be more accepting of the additional cost of obtaining an ID.30
H2: Voter ID statutes will reduce turnout during midterm elections but
have a limited impact on turnout during presidential elections.
27During the 2012 presidential election, the Obama campaign sent teams to educate Americans inVoter ID states: “Field workers for President Obama’s campaign fanned out across the country overthe weekend in an effort to confront a barrage of new voter identification laws that strategists saythreaten the campaign’s hopes for registering new voters ahead of the November election” (Shear,2012). Moreover, the AFL-CIO “vowed to mount their biggest voter registration and protectionefforts ever to counter these [Voter ID] laws” (Greenhouse, 2012).
28Election law changes increase interest groups’ coordination efforts with traditional ideologi-cal allies: “The federation’s [AFL-CIO] leaders said they would work closely with other groups,including the N.A.A.C.P. and the National Council of La Raza, to maximize voter turnout andprovide whatever help is needed to enable elderly, disabled and poor Americans to get voter IDs”(Greenhouse, 2012).
29During the 2008 presidential campaign, The National Association for the Advancement ofColored People (NAACP) chose to “focus on voter education and outreach ahead of this year’spresidential election in the wake of a U.S. Supreme Court ruling on voter identification laws”(Haines,2008).
30“An excited election situation...may bring these peripheral voters to the polls in large numbers.In an election of lesser apparent importance and weaker total stimulation the participation of theseperipheral voters decline, leaving the electoral decision largely to the high-interest core voters”(Campbell, 1960, p. 400).
16
Overall, I argue that Voter ID statutes impose a cost on citizens without suitable
forms of identification. These laws are likely to depress turnout when campaign
mobilization efforts are not intense, such as during midterm contests or off-cycle
elections.
Research Design
Difference-in-differences is a widely used identification strategy that combines within-
subjects comparisons over time and between-subjects comparisons across groups
(Ashenfelter and Card, 1985; Campbell and Ross, 1968; Card and Krueger, 1994;
Fisman, 2001).31
I compare the change in voter turnout among voter subgroups in states with a Voter
ID implementation and in states with no policy change. The difference-in-differences
estimator (DD) has two components
δ = (yst1 − ySt0)− (y∼st1 − y∼st0)
31Campbell and Ross (1968) studies the impact of a speeding crackdown in Connecticut onmortality rates by comparing change in turnout over time in Connecticut with neighboring states.Card and Krueger (1994) examine the impact of a minimum wage increase in New Jersey byassessing changes in employment in New Jersey, a treatment state, with changes in Pennsylvania, astate where minimum wages did not change. Fisman (2001) studies the impact of health incidentson the stock prices of politically connected firms.
17
δ = ∆ys −∆y∼s
where δ is the main effect, ∆y is change in mean turnout for a voter subgroup before
and after an intervention and a State is either S (policy change during the period)
or ∼S (no policy change). I calculate ∆y separately for changes in turnout between
Nov. 2004 and Nov. 2008, between Nov. 2006 and Nov. 2010, between Nov. 2004
and Nov. 2010 and between Nov. 2008 and Nov. 2012.32
The identification strategy assumes that the observed difference between treatment
and control groups should remain constant when there is no treatment. Estimates
from differences-in-differences are problematic if there are systematic changes in the
treatment and control group unrelated to the policy implementation.33
Data
I have assembled a database of Voter ID policies from 2002 to the present and have
placed states in one of four categories: No Voter ID law, Non-photo ID law, Photo
ID law and Strict Photo ID law.34 Overall, 13 states changed their Voter ID statutes
32See the appendix for a discussion of a difference-in-difference-in-differences estimator that alsoaccounts for state-level factors unrelated to Voter ID policy that may influence turnout.
33See Appendix for a discussion of potential threats to validity34I utilize the National Conference on State Legislatures’ methodology. http://www.ncsl.org/
legislatures-elections/elections/voter-id.aspx The strict photo option refers to states thatdo not allow voters to cast provisional ballots unless they present a photo ID.
between the 2002 and 2004 election, seven strengthened their laws between 2004 and
2006, two tightened their policies between 2006 and 2008, three adopted Voter ID
provisions between November 2008 and November 2010 and four strengthened their
policies between November 2010 and November 2012.35 By contrast, a few states
weakened their policies in the past decade.
My paper and previous Voter ID research examines how a relative change in the
strictness of Voter ID policy affects voter turnout because the majority of states
in the sample changed their Voter ID statute by one increment in the four-point
classification scheme described above.36
352002-04: AZ, MT, SD, ND, HI, CO, AR, LA, AL, FL, TN, SC, MD; 2004-06: WA, AZ, NM,FL, IN, OH, HI; 2006-08: MI, GA; 2008-10: ID, OK, UT. 2010-12: KS, NH, TN, PA
36See Erikson and Minnite (2009). The primary models treat each relative change in a Voter IDpolicy identically. For instance, an implementation from No ID law to a Strict Photo is coded thesame as a state that changes from a Photo ID law to a Strict Photo law. I run separate modelsexamining the impact of changes across each interval, along with the impact of large shifts. Plotsin the results section indicate these methodological choices do not affect substantive conclusions.Alvarez et al. (2011) have developed an eight point classification scale based on the strictness ofthe statute and have categorized each state from 2000 through 2006. Their scheme includes thefollowing categories, ranging from the least intrusive to the most stringent: 1) voter states name,2) voter signs name, 3) voter signs and signature match, 4) voter is requested to present proof ofidentification or registration card, 5) voter must present proof of ID or voter registration card, 6)voter must present proof of identification and signature match, 7) voter is requested to presentphoto id, and 8) voter is required to present photo id (Alvarez et al., 2011)
19
Voter File and Census Data
I analyze individual level data from Catalist, a national voter database containing
voter histories, demographic and commercial data for 180+ million registered vot-
ers.37 Several times a year, Catalist purchases publicly available voter registration
files and runs an extensive audit to identify movers, deceased voters or duplicate
records. Political scientists have administered extensive validation checks on this
data (Ansolabehere and Hersh, 2010; Hersh, 2011; Hersh and Nall, 2012).
The foregoing analysis examines the impact of Voter ID statutes during 2004, 2006,
2008, 2010 and 2012 and I have isolated individuals by race / ethnicity, age, gender,
family income, home ownership, party affiliation and length of residence. I calculate
voter turnout as total votes divided by the number of adults with an active voting
history38
Findings
This section presents and explains treatment effects separately for presidential and
midterm contests across age, race, family income, party registration and home own-
37I accessed Catalist through Stanford University’s Academic Subscription. See the Appendixfor more information on the Catalist database
38See the Appendix for more information on the Catalist voter subgroups and calculating popu-lation denominators.
20
ership status from 2004 to 2012. Each table compares the change in turnout among
voter subgroups before and after the policy intervention with turnout among similar
groups in states that underwent no election law change.
First, I assess the impact of Voter ID laws during presidential contests by estimating
the change in turnout between November 2004 and November 2008. During this
period, nine states tightened ID policies and one relaxed its policy. Then, I examine
treatment effects between November 2008 and November 2012, a period when seven
states strengthened their ballot security policies. Overall, I find that Voter ID policies
exerted a limited impact on turnout during these presidential election cycles.
Next, I assess the impact of Voter ID laws during midterm contests. I argued above
and find empirically that policies affecting the voting process may exert a larger
impact during low salience, low mobilization contests such as midterms. I begin
by estimating the change in turnout between November 2006 and November 2010.
During this period, five states tightened their ID policies and one relaxed its policy.
These states include Georgia, Idaho, Michigan, Oklahoma and Utah. Finally, I
conduct another estimate of the effect of Voter ID statutes during midterm elections
(November 2004 versus November 2010). This specification, which compares turnout
between 2004 and 2010, yields similar results to 2006 - 2010 comparisons.
The relative strictness of laws implemented between 2004 and 2008, and those adopted
21
between 2006 and 2010 were similar. Therefore, the differential effects sizes between
the two cycles likely are driven by changes in mobilization rather than the increased
strictness of election law policies. This section proceeds by analyzing the impact
of Voter ID statutes across age groups, income levels, length of residence, race and
home ownership.
Main Effects. Table 2 displays the main effects across each of the four general
election comparisons. This table displays voter turnout over two general election
cycles for states that strengthened their Voter ID policy (“Yes”) and states with no
policy change (“No”). Overall, Voter ID policies have a limited impact on turnout
during general elections. While the net effect is close to zero, this section will examine
whether these policies have heterogeneous effects across voter subgroups. During
midterm elections, voter turnout is approximately three percentage points lower in
states that strengthened their Voter ID policies compared with those that held their
policies constant. The next section examines which subgroups are demobilized by
Voter ID statutes across both midterm and presidential elections.
Subgroup Effects. Figure 2 displays the treatment effects across five age cohorts.39
The x-axis displays the percent change in voter turnout for individuals in states with
a policy change minus the percent change for individuals in states with no policy
39 collapsed the under 25 and 25-34 cohorts. The treatment effects sizes are similar for bothcohorts.
22
Table 2: Voter ID Main Effects. This table displays voter turnout over two generalelection cycles for states that strengthened their Voter ID policy (“Yes”) and stateswith no policy change (“No”)
ID Policy % Turnout % Turnout MainChange Pre- Post Effect
2004 to 2008 Yes 0.72 0.82 -0.002No 0.72 0.82
2008 to 2012 Yes 0.82 0.78 0.002No 0.82 0.78
2004 to 2010 Yes 0.75 0.55 -0.037No 0.71 0.56
2006 to 2010 Yes 0.54 0.53 -0.039No 0.52 0.56
change. The panels present four separate election models.
The treatment effects in the 2004 - 2008 comparison (left panel) are small and suggest
that Voter ID statutes have a limited impact on turnout across age cohorts during
presidential elections. The youngest age cohort is slightly less likely to vote, though
the results are not substantively large.
The midterm comparison (second panel) suggests that Voter ID laws reduce turnout
among young adults dramatically but do not cause a similar decline in turnout among
older adults. Voter ID laws reduced turnout among adults under 35 by five percent-
age points between 2006 and 2010, compared with no change among adults over
65. Since more than six in 10 young adults vote for Democrats, this increases the
Republican Party advantage. The third panel looks nearly identical to the center
23
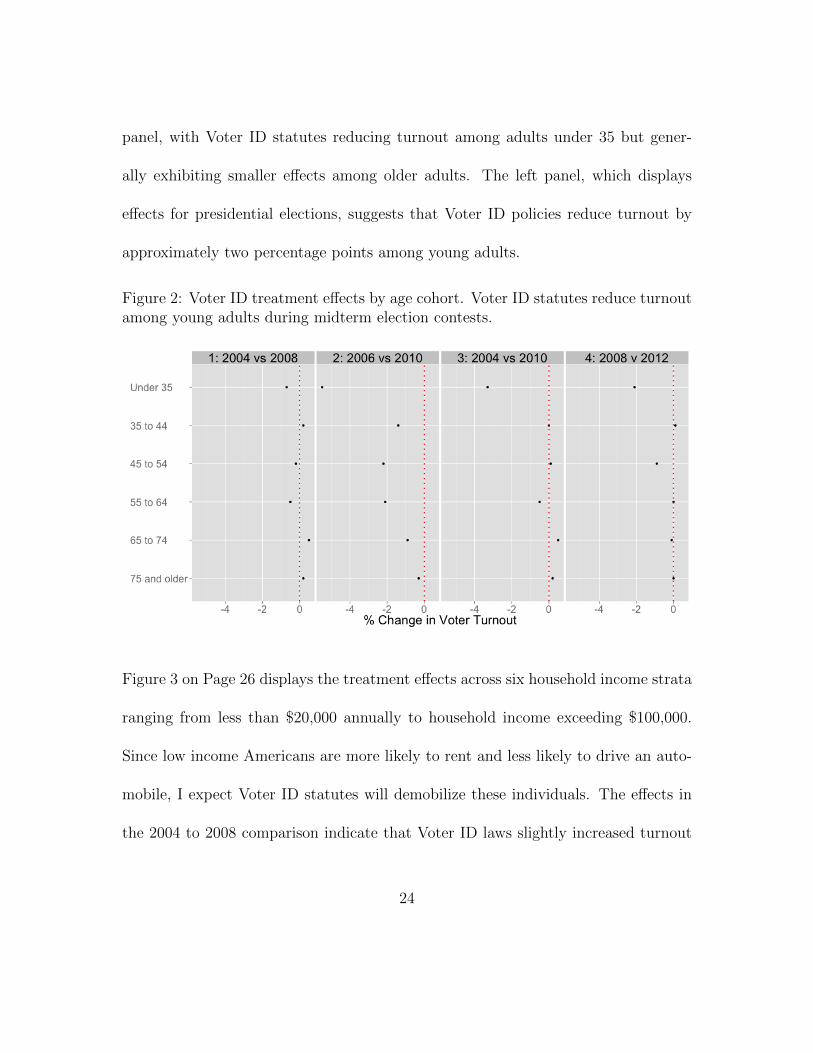
panel, with Voter ID statutes reducing turnout among adults under 35 but gener-
ally exhibiting smaller effects among older adults. The left panel, which displays
effects for presidential elections, suggests that Voter ID policies reduce turnout by
approximately two percentage points among young adults.
Figure 2: Voter ID treatment effects by age cohort. Voter ID statutes reduce turnoutamong young adults during midterm election contests.
Figure 3 on Page 26 displays the treatment effects across six household income strata
ranging from less than $20,000 annually to household income exceeding $100,000.
Since low income Americans are more likely to rent and less likely to drive an auto-
mobile, I expect Voter ID statutes will demobilize these individuals. The effects in
the 2004 to 2008 comparison indicate that Voter ID laws slightly increased turnout
24
among citizens in the lowest income strata but do not influence turnout among in-
dividuals in other strata. During this cycle, the campaigns may have targeted low
income voters in Voter ID states.
Among states that changed their policy between 2006 and 2010, Voter ID laws dis-
proportionately demobilize poor and working class voters. Americans in households
earning less than $20,000 annually are 4.5 percentage points less likely to cast a ballot
in Voter ID states. Voters in the highest income strata exhibit declines of 3.5 per-
centage points this same period, a small but statistically significant difference.
Low income voters residing in states that changed their Voter ID polices between 2004
and 2010 experience a three percentage point decline in turnout. Wealthier voters,
on the other hand, have no change in voter turnout. Among states that changed
their policy between 2008 and 2012, Voter ID laws disproportionately demobilize
working class voters. Americans in households earning less than $20,000 per year
are about two percentage points less likely to cast a ballot in states than strengthen
their Voter ID policies; by contrast, higher income individuals are not affected by
the policy implementations.
Figure 4 displays the impact of Voter ID statutes based on the length of time the
current resident has lived in his or her household. Individuals who have resided in
their household for many years are more likely to own an ID listing their current
25
Figure 3: Voter ID treatment effects by income strata and election. Voter ID statutesslightly reduce turnout among low income adults during midterm election contests.
address.
Individuals who have lived in their current residence for less than one year are neg-
atively affected by Voter ID statutes in all three panels, though the effects are most
negative among adults who have lived in their household for six to 10 years. Overall,
however, the plots suggest that Voter ID statutes depress turnout among residents
who have lived in their current household for a relatively short amount of time.
Across the three election comparisons, the declines in turnout among individuals
who have lived in their current residence for more than 10 years are always smaller
than the declines for short-term residents.
26
Figure 4: Voter ID treatment effects by length of residence and election. Short-termresidents are demobilized by Voter ID statutes.
Party registration directly examines the effect of Voter ID statutes on the partisan
composition of the electorate. Voters in seven states that strengthened their Voter
ID statutes between 2004 and 2012 registered by party. The results in Table 3 and
Figure 5 suggest that Voter ID laws demobilize Democrats more than Republicans.
The first two columns in Table 3 compare changes in voter turnout among partisan
voters in Arizona, Florida and New Mexico, three states that adopted Voter ID
policies, and partisans in the 28 states with party registration but no Voter ID policy
change. Between 2004 and 2006, Democratic voter turnout decreases 2.3 percentage
points more in Voter ID implementation states than in states with no statutory
27
changes. Yet, there is little difference in Republican turnout (-0.6 percent) during
this time period. Between the 2004 and 2008 presidential contests, Republican voter
turnout increases by 2.5 percentage points more in Voter ID implementation states
than in non-Voter ID states; however, Democratic turnout increases by one point,
significantly less.
Table 3: Effects of Voter ID statutes among registered Democrats and Republicans
4 %Turnout 4 %Turnout 4 %Turnout 4 %Turnout 4 %Turnout2004 to 2006 2004 to 2008 2006 to 2010 2008 to 2010 2008 to 2012
AZ, FL and NM are party registration states that implemented Voter ID between 2004and 2006. OK and UT implemented Voter ID between 2008 and 2010. KS, NH, OKand UT implemented Voter ID between 2008 and 2012.
28
Figure 5: Voter ID treatment effects by party registration.
Two states with party registration, Oklahoma and Utah, strengthened their Voter
ID policies between November 2006 and November 2010. Between 2006 and 2010,
Democratic voter turnout decreases 0.9 percentage points more in Voter ID imple-
mentation states than in states with no statutory changes. However, there is a
significant 4.6 percentage increase in Republican turnout in Voter ID states during
this time period. Turnout patterns between 2008 and 2010 suggest that Voter ID
laws mobilized Democrats more than Republicans.
Four states with party registration, Kansas, New Hampshire, Oklahoma and Utah,
strengthened their Voter ID statutes between November 2008 and November 2012.
29
Between 2008 and 2012, Democratic voter turnout decreases by 3.8 percentage points
more in Voter ID states than in states with no statutory changes. There is a signif-
icant 4.7 percentage point increase in Republican turnout during this time period.
That is, despite no main effect on turnout between these two time periods, hetero-
geneous effects by party registration appear in the data.40
Figure 6 displays the impact of Voter ID statutes for African Americans, Hispanics,
Whites and all non-whites. African Americans and Hispanics have extremely low ID
ownership rates, and I hypothesize that Voter ID statutes will reduce turnout among
these groups.
The effects of Voter ID across racial groups are small across the three panels. The
third panel suggests that Voter ID laws cause an approximately 2 percentage point
decrease among African Americans. Hispanic voter turnout is not affected in any of
the specifications.
40The party registration results must be interpreted with caution. Only seven of the states thatstrengthened Voter ID policies have party registration, and state-by-state party registration rulesmay vary across states and over time.
30
Figure 6: Voter ID treatment effects by racial group.
The negligible treatment effects among African Americans and Hispanics may result
from a number of factors. First, significant numbers of African Americans and His-
panics lacking IDs may have been mobilized in the 2008 campaign. Second, African
American and Hispanic voters may be easier to mobilize than low income voters or
renters because they exhibit very high levels of geographic clustering and they tend
to live in dense, urban areas.
I aggregated data based on respondents’ rental status. Figure 7 shows that Voter ID
statutes do not affect turnout for either group for the 2004, 2008 or 2012 presidential
elections; however, in the midterm comparison and the 2004-10 comparison, there
are significant differences between turnout patterns among renters and owners. The
31
data suggests that Voter ID policies decrease midterm turnout among renters by
about five percentage points and decrease turnout between 2004 and 2010 by three
percentage points.
Figure 7: Voter ID treatment effects by home ownership. Voter ID statutes reduceturnout among renters during midterm election contests.
Finally, between 2004 and 2012, two states eased their Voter ID statutes during the
period of inquiry. New Mexico changed from a Non-Photo ID to No ID between
2006 and 2008, and South Carolina changed from a Photo ID to a Non-Photo ID
policy between 2004 and 2006. After their Voter ID laws were loosened, the observed
increases in turnout among young adults, low income adults, renters and African
Americans were larger in these states than in the states where election law policy
32
stayed constant. This additional evidence suggests that Voter ID policies demobilize
Democratic leaning voter groups.
In summary, Voter ID statutes exhibit a negative effect on voters during midterm
election contests but have a limited impact on political participation during high
interest presidential elections. The demobilizing effects are largest among low income
adults, young adults, renters and Democrats.
Information versus Identification Hypotheses. The findings have shown that
Voter ID laws can reduce turnout, especially during midterm contests. Both hy-
potheses predict the subgroup effects observed in the previous section. That is,
voters without lower ID ownership rates and voters with less information are most
likely to be demobilized by Voter ID statutes.
We can distinguish between two competing mechanisms for this effect, the informa-
tion and identification hypotheses, by identifying situations when the information en-
vironment changes dramatically but ID requirements remain constant; alternatively,
we can identify cases when the ID requirements are modified but the information
environment does not.
In 2012, legislatures in Pennsylvania, South Carolina and Wisconsin passed laws
that were eventually placed on hold in the lead-up to the election. The Identification
33
Hypothesis predicts there should be no difference in turnout between these states
and other states with no policy change because the ID requirements stayed the same
between election cycles. The Information Hypothesis predicts that we should observe
turnout declines in these three states because surprise court decisions, confusing im-
plementation and partisan messaging may confuse voters. The analysis indicates
that between 2008 and 2012 subgroups in Pennsylvania, South Carolina and Wis-
consin saw larger declines in turnout than in the comparison states that kept policy
constant. Further, subgroups in these states saw similar, albeit modest, declines in
turnout as in the states that actually strengthened their Voter ID policies.41
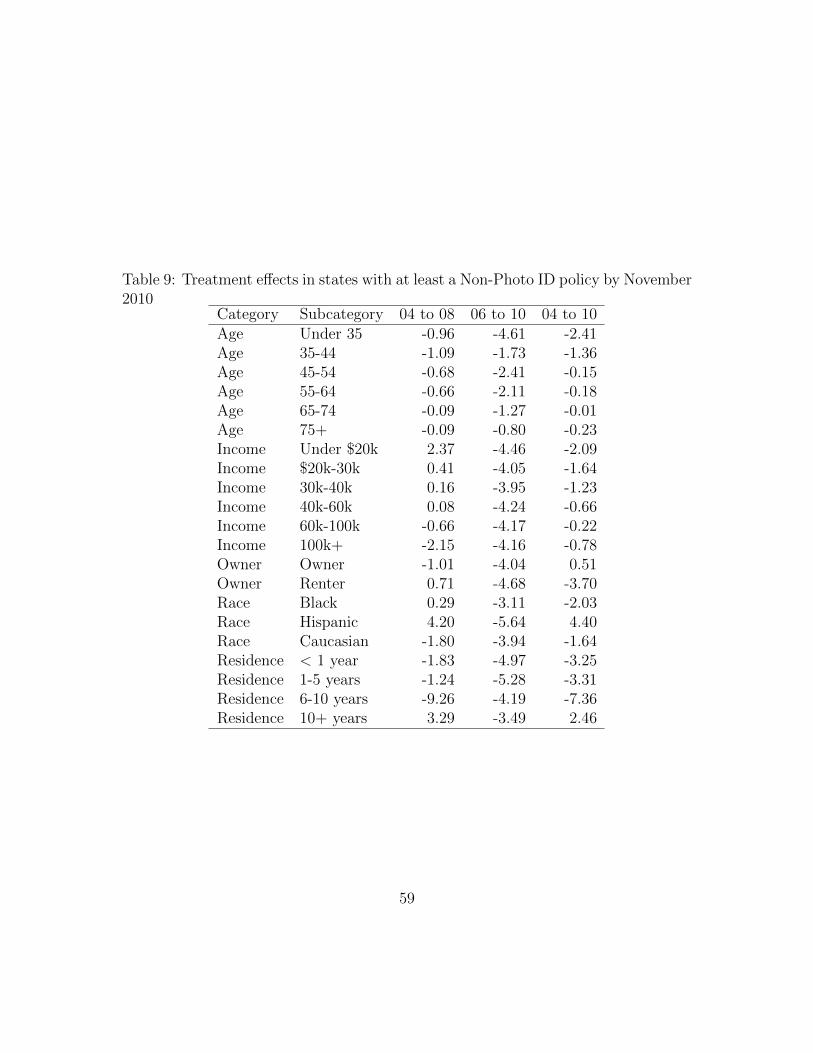
There are also scenarios where ID requirements shift dramatically but the informa-
tion environment holds constant. We can compare the impact of states with the Help
America Vote Act minimum implementing policies that are more or less inclusive.
The Identification Hypothesis predicts that we should observe larger, more negative
treatment effects when a state with no Voter ID policy adopts a strict photo ID law
compared with a Non-Photo ID law because more voters should be excluded in the
former. The Information Hypothesis, however, predicts that we should see no differ-
41I have also examined the impact of a neighboring state changing its Voter ID policy on turnoutin states next door with no policy change. The Identification Hypothesis predicts that individualsin states with no policy change should see no turnout declines, whereas the Information Hypothesispredicts that individuals in counties bordering states with policy implementation may be exposedto the confusion associated with a neighboring state’s Voter ID policy. The data suggests thatresidents living in the states with no policy change that border Voter ID states do not experienceturnout declines, suggestive evidence for the Identification Hypothesis.
34
ence between these two sets of states because the simple passage of legislation and
campaign dynamics cause confusion among voters. Tables 10 & 11, which examine
the impact of Voter ID laws in states that changed policy from No ID to Non-Photo
(Table 10) and Photo+ (Table 11), provide some support for the Identification Hy-
pothesis. Treatments effects among groups such as young adults and the working
class are larger and more negative in states that implemented a law requiring voters
to present a Photo ID.
Discussion
Progressive Era reforms of the early 20th Century such as amendments for the direct
election of senators, women’s suffrage and state-level direct democracy reforms trans-
formed the composition of the electorate and the representative-constituent linkage.
The Supreme Court’s landmark decision in Baker v. Carr (1962) sparked the Reap-
portionment Revolution – Congressional districts and state legislative districts had to
be redrawn to contain approximately equal populations.42. I study whether the burst
of legislative attention and widespread adoption of Voter Identification statutes at
the beginning of the 21st Century has the potential to transform the electorate.
42See Baker v. Carr (1962), Wesberry v. Sanders (1964) and Reynolds v. Sims (1964)
35
My research aggregates tens of millions of individual level voting records over five
general elections (2004-2012) using a national voter database. First, I isolate groups
with low ID ownership rates such as the working class, renters, African Americans,
young adults and Hispanics. Then, I use a difference-in-differences approach to
compare the turnout of these voter subgroups before and after a Voter ID law change
with turnout patterns among voter subgroups in states with no policy change.
Previous research has yielded puzzling, contradictory findings because it assesses
earlier, more lenient statutes, aggregate county or state-level studies are not able to
detect effects across voter subgroups and survey-based studies contain measurement
and sampling error. I find that Voter ID statutes exert a modest but politically
meaningful demobilizing effect, especially among the poor, young adults and renters.
The treatment effects are the largest and most negative during midterm contests;
however, the impact of these laws is negligible during high interest presidential con-
tests.
My research is among the first to demonstrate that Voter ID laws impact the par-
ticipation of a broad cross-section of the electorate. This research suggests that
the decade long strategic effort among Republicans shifted the composition of the
electorate in the GOP’s favor. Since state Voter ID laws are becoming increasingly
stringent, the findings here provide a floor for treatment effects estimates. Finally,
36
the study presents a template for future scholars to examine the effects of state-level
interventions across voter subgroups.
The results discussed below indicate that Voter ID laws have modest effects that are
substantial enough to influence election outcomes in close races. Since the results
indicate that Voter ID demobilizes groups that disproportionately favor Democrats,
a decrease in voter turnout corresponds with a decline in Democratic vote share. The
findings suggest that the winner in four states in the 2004 presidential election (NH,
NM, OH, WI), and two states in the 2008 presidential election (MO, NC), could have
been different based on Voter ID policy implementations.
Furthermore, modest declines in Democratic vote share can influence both top-of-
the-ballot contests and lower ballot contests such as U.S. House, mayor and state
legislative races. The margin of victory has been less than five percentage points in
10 percent of state legislative races between 1968 and 2010, less than two percentage
points in four percent of races and less than one percentage point in two percent of
contests.43
Voter ID laws will continue to receive attention as state legislatures enact new laws
and the Justice Department and courts hear challenges. The findings in this study
43Source: Klarner, Carl, William Berry, Thomas Carsey, Malcolm Jewell, Richard Niemi, LyndaPowell, and James Snyder. State Legislative Election Returns (1967-2010). ICPSR34297-v1. AnnArbor, MI: Inter-university Consortium for Political and Social Research [distributor], 2013-01-11.doi:10.3886/ICPSR34297.v1.
37
suggest that Voter ID laws have shifted the composition of the electorate in the
Republican Party’s favor, especially during low salience midterm elections.
38
References
Alvarez, R. M., S. Ansolabehere, A. Berinsky, G. Lenz, C. Stewart III, and T. Hall.
“2008 Survey of the Performance of American Elections.” Draft, May 5.
Alvarez, R. M., D. Bailey, and J. N. Katz. “The Effect of Voter Identification Laws
on Turnout.” Manuscript, California Institute of Technology and Washington Uni-
versity in St. Louis .
. “An Empirical Bayes Approach to Estimating Ordinal Treatment Effects.”
Political Analysis 19, 1: (2011) 20–31.
Ansolabehere, S. “Effects of Identification Requirements on Voting: Evidence from
the Experiences of Voters on Election Day.” PS: Political Science & Politics 42,
01: (2009) 127–130.
Ansolabehere, S., and E. Hersh. “The Quality of Voter Registration Records: A
State-By-State Analysis.” Cambridge, Mass.: Department of Government, Har-
vard University .
Ansolabehere, Stephen. “Ballot Bonanza.” Slate .
Ashenfelter, O., and D. Card. “Using the Longitudinal Structure of Earnings to
Estimate the Effect of Training Programs.” The Review of Economics and Statistics
39
648–660.
Barreto, M. A., S. A. Nuno, and G. R. Sanchez. “Voter ID Requirements and the
Disenfranchisements of Latino, Black and Asian Voters.” In Annual Meeting of the
American Political Science Association, Chicago, Illinois. 2007, volume 30.
Biggers, D. R., and M. J. Hanmer. “When Voting Gets Harder: Understanding the
Adoption of Voter Identification Laws in the American States.” Presented at the
2011 American Political Science Association Conference .
Brady, H. E., S. Verba, and K. L. Schlozman. “Beyond SES: A Resource Model of
Political Participation.” American Political Science Review 271–294.
Campbell, Angus. “Surge and Decline: A Study of Electoral Change.” The Public
Opinion Quarterly 24, 3: (1960) 397–418.
Campbell, D. T., and H. L. Ross. “The Connecticut Crackdown on Speeding: Time-
Series Data in Quasi-Experimental Analysis.” Law & Society Review 3, 1: (1968)
33–53.
Card, David, and Alan B. Krueger. “Minimum Wages and Employment: A Case
Study of the Fast-Food Industry in New Jersey and Pennsylvania.” The American
Economic Review 84, 4: (1994) 772–793.
Cobb, R., D. Greiner, and K. Quinn. “Can Voter ID Laws Be Administered in a
40
Race-Neutral Manner? Evidence from the City of Boston in 2008.” Quarterly
Journal of Political Science 7, 1: (2012) 1–33.
Erikson, R. S., and L. C. Minnite. “Modeling Problems in the Voter Identification-
Voter Turnout Debate.” Election Law Journal 8, 2: (2009) 85–101.
Fisman, R. “Estimating the value of political connections.” American Economic
Review 1095aAS1102.
Greenhouse, Steven. “A.F.L.-C.I.O. Takes On Voter ID Laws.” The New York Times
.
Haines, Errin. “Ga. NAACP focuses on voter outreach after voter ID ruling.” Asso-
ciated Press .
Hersh, E. “The Public Code of Racialized Electioneering.” Working Paper .
Lee, F. E. Beyond Ideology: Politics, Principles, and Partisanship in the US Senate.
Chicago: University of Chicago Press, 2009.
Logan, J. R., J. Darrah, and Brown University American Communities Project.
The Suppressive Effects of Voter ID Requirements on Naturalization and Political
Participation. American Communities Project, Brown University, 2007.
Lott, J. “Evidence of Voter Fraud and the Impact that Regulations to Reduce Fraud
41
Have on Voter Participation Rates.” .
Milyo, Jeffrey. “The Effects of Photographic Identification on Voter Turnout in
Indiana: A County-Level Analysis.” Technical report, Institute of Public Policy,
University of Missouri, 2007.
Mycoff, J. D., M. Wagner, and D. C. Wilson. “The Empirical Effect of Voter-ID Laws:
Present or Absent?” PS: Political Science & Politics 42, 1: (2009) 121–126.
Pastor, R. A., R. Santos, A. Prevost, and V. Stoilov. “Voting and ID Requirements:
A Survey of Registered Voters in Three States.” The American Review of Public
Administration 40, 4: (2010) 461–481.
Pawasarat, J. “The Driver License Status of the Voting Age Population in Wisconsin.”
Employment and Training Institute, University of Wisconsin-Milwaukee .
Sanchez, Gabriel R., Stephen A. Nuno, and Matt A. Barreto. “The Disproportionate
Impact of Photo-ID Laws on the Minority Electorate.” Technical report, Latino
Decisions, 2011.
Shear, Michael D. “Obama Campaign Confronts Voter ID Laws.” The New York
Times .
Vercellotti, T., and D. Anderson. “Protecting the Franchise, or Restricting it? The
42
Effects of Voter Identification Requirements on Turnout.” Manuscript, Rutgers
The widespread adoption of Voter ID statutes has been driven by the passage ofthe Help America Vote Act (HAVA) in 2002, an organized effort among Republicanstate legislators and governors to enhance ballot security, near unanimous publicsupport for ballot security measures and the perception of pervasive voter fraudamong Americans.44
The Help America Vote Act (HAVA) of 2002 established minimum federal stan-dards for first-time voters, established the Election Assistance Commission (EAC)and replaced outdated voting systems such as punch cards.45 The act passed withoverwhelming bipartisan majorities in both the U.S. Senate and U.S. House and wassigned into law by President George W. Bush in October 2002. The act providedvoters with a range of options to register to vote and to verify their identify. First-time voters could register to vote by providing the last four digits of their SocialSecurity Number, a current driver’s license number, a state identification number, aNon-Photo ID or a Photo ID.46 Many legislators and state officials, however, felt thatthe act did not go far enough to ensure ballot security and prevent voter fraud.
Voter ID laws receive widespread public support. Seventy-eight percent of Americanssaid voters should be required to show an official photo identification on Election Day,including 86 percent of Republicans and 71 percent of Democrats, according to a 2006Pew poll.47 Fully 48 percent of Americans say that voter fraud – people voting whoare not eligible or voters casting multiple ballots – is a major problem, according toa 2012 Washington Post poll.48
PLAW-107publ252.htm46First-time voters must provide either a Photo ID, Non-Photo ID, their current and valid driver’s
license number, a state identification number or the last four digits of their Social Security Num-ber.(Help America Vote Act, Section 303b http://www.fec.gov/hava/law_ext.txt). Individualswho cannot meet these requirements will be assigned a unique voter registration number.
47Survey by Pew Research Center for the People and the Press, October 17-22, 2006 based on2,006 telephone interviews.
48The poll was conducted July 18-29, 2012, and based on 2,047 telephone interviews. Thirty-three
Figure 8 displays the difference-in-differences estimates using voting data on lowincome voters. The figure displays voter turnout as a proportion of the voting eligiblepopulation (y-axis) for 2006 and 2010 (x-axis). The red line demonstrates that voterturnout among low income voters in states with no Voter ID change between 2006and 2010 stays about the same over the two periods, whereas the black, downwardsloping line exhibits the negative trend in voter turnout in states that underwent apolicy change.
The key assumption of difference-in-differences is that, without treatment, the dif-ference between treatment and control groups remains the same. This assumption isshown by the dotted counterfactual line. The low pre-treatment difference expandsto a large post-treatment difference of approximately four percentage points. We cancalculate the estimated treatment effect by comparing the expected voter turnout inthe counterfactual with observed turnout.
Potential threats to validity
The foregoing section addresses and evaluates potential threats to validity that arisebecause the study uses an observational approach.
The Assignment Process. Random assignment typically ensures that treatmentand control groups are similar across relevant covariates. The investigator, however,cannot control the assignment process in observational studies such as this one.
My study and previous research on Voter ID statutes have used difference-in-differencesestimators to address problems associated with non-random assignment (Alvarezet al., 2011). While states that are electorally competitive or political conservativemay be more likely to adopt Voter ID statutes, difference-in-differences sidestepsthe problem of non-random assignment by measuring turnout before and after anintervention.49
percent say it is a minor problem and 14 percent say it is not a problem.49Alvarez et al. (2011) use a difference-in-differences estimator with Current Population Survey
data to estimate the impact of Voter ID statutes: “[I]dentification requirements are not randomlyassigned across states. This is a problem if states with historically lower turnout also tend to adoptstricter identification requirements, then we will have trouble isolating whether the low level ofturnout is due to the identification requirement or to other factors that lead a given state to havelower turnout rates. The estimation strategy used exploits the temporal and geographic variability
46
Figure 8: Difference-in-differences estimate among low income voters
Campbell and Ross (1968) argue that scholars must find alternative explanationsplausible to dismiss the validity of difference-in-differences approaches: “[L]ack ofcontrol and lack of randomization are damaging to inferences of cause and effectonly to the extent that a systematic consideration of alternative explanations revealssome that are plausible” (Campbell and Ross, 1968, p. 34).
SUTVA. The stable unit treatment value assumption (SUTVA), a concern relevantto all observational studies, states that the assignment status of a given unit shouldnot affect others units’ potential outcomes.50
in voter identification requirements to sidestep the problem of non-random assignment. This isreferred to as a difference-in-differences estimator and our analysis is built on a generalization ofthis procedure” (Alvarez et al., 2011, p. 10). Future research can analyze the 1% voter samplefrom Catalist, a national voter file database. The file contains detailed information on more thantwo million voters. If we match across a series of covariates, we can assume that the sole differencebetween units is their treatment assignment.
50“The [potential outcome] observation on one unit should be unaffected by the particular as-
47
Voter ID is a newsworthy and salient topic, and voters in a state without VoterID might learn of a Voter ID policy in a neighboring state, believe the policy’sprovisions apply to them and not cast a ballot as a result. First, this phenomenonwould bias estimates in the opposite direction, complicating the argument that VoterID statutes decrease turnout among voter subgroups.51 Second, it is unlikely thatthe recent adoption of Voter ID laws influences the behavior of neighbors becauseVoter ID policies have widespread recognition and many states already have adoptedat least a lenient version of Voter ID. Third, I have compared the voting behavior ofindividuals who live in counties that neighbor states with a Voter ID policy change(e.g., Illinois residents on the Indiana border) with individuals who live in interiorcounties and have not found differences in voting behavior across election cycles.Individuals neighboring Voter ID states should be more likely to have heard about aVoter ID statute implementation, and, if SUTVA is relevant, their behavior shouldbe more affected than individuals who live in interior counties.
Nonetheless, it is difficult to compute an average treatment effect because states ad-minister multiple, complex policy treatments with varying minimum requirements,provisional ballot policies and more. Alvarez et al. (2011) address the variation intreatments: “[T]here are many methodological problems unique to this data, one ofwhich is the ordinality of voter identification requirements. As is apparent from thelisting of the types of regimes, it is not the case that a state either requires iden-tification to vote, or does not. States require many different levels of identificationfrom simply stating one’s name to showing a picture identification. This furthercomplicates the question, as we must determine not just one effect but several po-tentially incremental effects. Second, states may differ in their implementation ofsimilar requirements. While one state may consider a student identification card ordiscount club membership card to be valid photo identification, another state mayonly recognize government-issued photo identification cards” (Alvarez et al., 2011, p.9-10)
Clustered Standard Errors. Unlike a randomized experiment, we cannot assumethat errors are independently and identically distributed because the individual levelobservations are grouped within the states in which the Voter ID implementationoccurs. Estimates obtained without clustering observations result in downward bi-
signment of treatments to the other units” (Cox 1958). If assignment status influences potentialoutcomes, then there are several compound treatments, each of which involves a different assign-ment.
51Reports that voters are assigned to a Voter ID treatment may mobilize other voters in a non-policy state, leading to a biased estimate of the treatment effect.
48
ased standard errors because individual observations in clustered data contributeless information to a model than data without clustering.52 Voter ID studies usingrobust rather than clustered standard errors understate the size of standard errorsby up to a factor of seven and the computation of standard errors can determinewhether findings are highly statistically significant or not statistically different fromzero (Erikson and Minnite, 2009, p. 92).
The standard errors based on observed behavior from the tens of millions of voters inthe national voter file are miniscule. Multiplying the standard error of a proportionof 10 million individuals by a factor of 30 produces a statistically significant findingfor a one percentage point treatment effect at the 95 percent confidence level. Themain models in this study estimate standard errors utilizing a cluster bootstrap atthe state and county, which causes a modest increase in the size of the standarderrors.53
Catalist
Validation. Ansolabehere and Hersh (2010) describe Catalist’s basic data collectionprocess and the rigorous procedures they implement to validate the data: “Severaltimes a year, Catalist purchases the publicly available voter registration files madeavailable by each state or county election office...Catalist then cross-references theregistration lists with other public records, such as the National Change of Address(NCOA) database maintained by the Post Office and the Social Security death index.Movers and deceased voters are flagged. Catalist matches the registration files tocommercial records from data aggregation firms that compile lists from retailersand direct marketing companies. This allows the firm to correct the records ofindividuals who may have a typo in their registration record or may have registeredwith a nickname rather than their legal name” (Ansolabehere and Hersh 2010, p. 5).There may be a slight discrepancy between the official vote tally and the number ofvotes cast in the database due to voter purges: “A vote tally from a registration fileexcludes the votes cast by citizens who were purged from the file since the election.For instance, a person who voted in 2006 but was since removed from the rolls would
52Research in social science has shown that not accounting for clustering can bias standard errors(e.g., Carsey and Wright, 1998; Green and Vavreck, 2008)
53I compute standard errors by aggregating individual level data to the county level. Then, Iresample observations using a bootstrap at the state and county level. The bootstrap resamplesentire clusters of observations rather than individual observations and modestly increases the sizeof the standard errors.
49
not be included in the county on the registration list but would have an official ballotcounted. This presents a minor problem since it only applies to voters who confirmedwith the registrar that they moved” (Ansolabehere and Hersh, 2010, p. 15).
States vary in the discrepancy between vote tallies and official results, though thediscrepancy is less than 5% in most states: “The 2008 and 2006 vote history discrep-ancy rates vary considerably by states. In Oregon, North Carolina, Rhode Island,Delaware, and many other states, discrepancies are at a minimum, representing fewerthan 5% of all votes. However, in other states like Mississippi, New York, and Texas,the 2008 discrepancy rate is closer to 10%” (Ansolabehere and Hersh, 2010, p. 15).The worst performers are Colorado, Maine, Mississippi and North Dakota.
Catalist Voter Groups. Voters were divided into the following racial groups:African American, Hispanic, White and Nonwhite.54 Catalist acquires racial datafrom two sources: self-identified responses in voter files and CPM Ethnics race pre-diction software. The race variable in the database uses self-identified race in manySouthern states, where residents list their racial status when registering.55 Outsideof the South, CPM Ethnics assigns a race based on a highly accurate algorithm in-cluding the respondent’s first name, middle name, last name, age and characteristicsof their Census geography.56 Hersh (2011) finds that the race variable included inthe Catalist data file is accurate between 91% and 96% of the time in Southernstates.57
Voters were divided into the following age groups: Adults under 35, 35-44, 45-54,
54Nonwhite is the total number of votes minus the number of White votes.55Specifically, Catalist reports racial source data for each state: AL 69%, FL 76%, GA 74%, LA
76%, MS 44%, NC 78%, SC 76%, TN 47%56Given the geographic concentrations of Americans by race, the resulting predictions are highly
accurate, though, not without error. Here is a research notes from CPM Ethnics: “In external blindtesting against self-reported ethnicity identification, CPM Technologies solutions have shown over20% more coverage than other established ethnicity appending services...CPM Ethnics software canfind over 75% of the African Americans in lists and still maintains an accuracy of over 80%. CPM’salgorithms are based upon modern machine learning techniques and are built using tens of millionsof samples with known race.”http://cpm-technologies.com/cpmEthnics.html
57“The exact model Catalist uses to predict race is proprietary, but we can check the qualityof the prediction using survey responses that have been matched into the Catalist database. The2009 Cooperative Congressional Election Study (CCES) was matched into Catalist’s database. Forthe registrants with listed races, 96% of voters’ self-reported races were the same as the publiclylisted races. For the registrants whose races were predicted with confidence, 91% had the sameself-reported race as predicted by Catalist’s model. Though the match between self-reports and theCatalist data is not in perfect agreement, it is sufficiently accurate that each racial group in theCatalist database can be divided in two...” (Hersh, 2012, p. 9-10).
55-64, 65-74, 75+. An individual’s age was calculated separately for each of the fivegeneral elections under investigation. While nearly all records include a birth date,records with a missing birth date were supplemented using a model including thenumber of years the individual has been registered to vote, the age of the head ofhousehold and the individual’s first name.58
Adults who move frequently are less likely to have IDs with current addresses, andvoters were divided into the following groups based on how long they have lived intheir current residence: less than one year, one to five years, six to 10 years, 11 to20 years and more than 20 years. Similarly, I identified individuals who were eitherrenting or who owned their residence using household commercial data.
Scholars have hypothesized that Voter ID statutes will place an undue burden onworking class and poor Americans. I identified household incomes in the followingranges using household level commercial data: less than $20,000, $20,001 to $30,000,$30,001 to $40,000, $40,001 to $60,000, $60,001 to $100,000 and over $100,000.59
Party registration data can provide a direct test of the impact of Voter ID statutes onthe partisan composition of the electorate. Voters in five of 12 states that strength-ened their Voter ID statutes between 2004 and 2010 register by party.60
Calculating Voter Turnout with Catalist Data The Catalist data providesa numerator for the total number of votes cast by a subgroup. I estimate turnout
58 Future analyses can utilize a cohort analysis tracking turnout of the same group ofadults.Ansolabehere and Hersh (2010) find that “1 in 7 records does not have a listed birthdate,and for many voters who do have a listed birthdate, the date entered is inaccurate.” (Ansolabehereand Hersh, 2010, p. 2). The primary inaccuracy, however, is that the voter’s birthdate was enteredas the first of the month or as January 1.
59Both the household income data and the rental status data are largely based on Census blockgroup characteristics. There are more than 200,000 Census block groups, and there is a highlevel of spatial clustering of income and rental status. Since renters and low-income individualsare concentrated in urban areas, the estimates, though not based on individual data, are highlyaccurate.
60Voter ID policy change states with party registration include Arizona, Florida, New Mexico,Oklahoma and Utah. Since Arizona, Florida and New Mexico strengthened Voter ID policiesbetween November 2004 and November 2006, the analysis will compare changes in voter turnoutover this time period among partisan voters in these three states and partisans in the 28 stateswith party registration but no Voter ID policy change. Since Idaho and Oklahoma strengthenedtheir Voter ID policy between November 2008 and November 2010, the secondary analysis willcompare changes in voter turnout over this time period among partisan voters in these two stateswith partisans in the 29 states with party registration but no Voter ID policy change. Similarly,I can estimate the proportion of the electorate that is Republican and Democratic in each statebefore and after the Voter ID policy intervention.
51
models with a series of three population denominators. The substantive findings aresimilar across the denominators.
First, I use change in total votes cast in a subgroup over time. This approach haslimited sampling error but does not account for changes in state subgroup populationsbetween November 2004 and November 2010.61
Second, I divide the total votes cast by the number of registered voters in Catalist’snational database. This approach estimates the change in the percent of registeredvoters who cast a ballot and minimizes sampling error. However, across both statesand voter subgroups, there may be differential rates of inactive voters, ineligiblevoters, dead voters or purged voters on registration rolls.
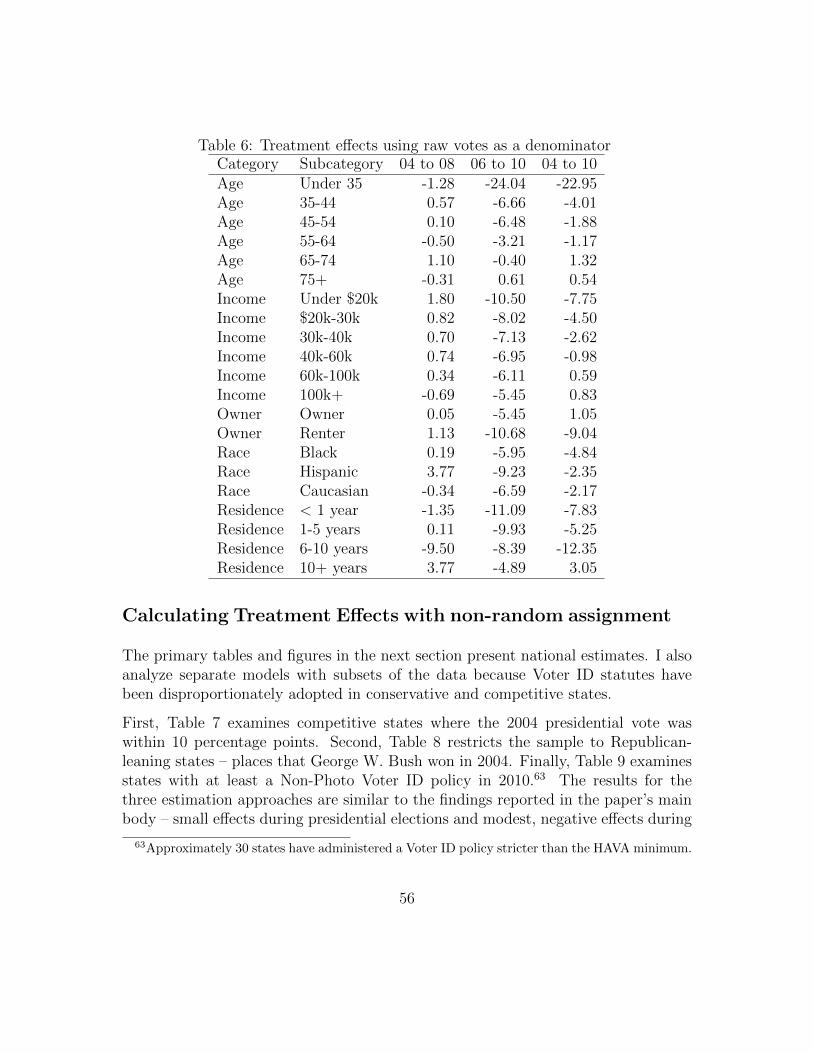
The final approach divides the total votes cast in a subgroup by the number ofindividuals in that subgroup in Catalist’s database with an active voter history.Active voters are individuals who voted at least once between January 1, 2004, andDecember 31, 2010. This more precise estimate reduces the amount of deadwood invoter registration files because we only include citizens who have voted at least oncesince 2004.62
Non-Voter ID explanations for the Treatment Effects
Ballot Access Policies. Voter ID statutes may disproportionately reduce turnoutduring midterm election cycles. Alternatively, states lacking Voter ID laws may beexhibiting higher levels of relative turnout because they are enacting laws to expandballot access. This ballot access explanation is unlikely because there has beenlimited expansion of election day registration in the past decade. Furthermore, therelationship between various types of absentee voting and the partisan compositionof a state legislature is weak.
Competitiveness. The largest treatment effects appear in November 2010, andit is plausible that Democratic groups in Voter ID states may have exhibited lower
61State subgroup populations change over time, largely due to people changing residence. If, forinstance, the number of African Americans in Voter ID states decreases at a higher rate than innon-policy states, we may erroneously conclude that Voter ID laws decrease turnout. For this toaffect treatment estimates, though, there have to be systematic differences in population changesacross Voter ID and non-policy states.
62As in the third approach, it is still possible that purging or removal of voters occurs at differentrates across states and voter subgroups. See the appendix for more information on voter purging.
52
turnout because these states were less competitive than the national average. How-ever, all five states that changed their Voter ID statutes between November 2006 andNovember 2010 held off cycle gubernatorial elections.
Voter Purging. Voter purging rates differ across states and municipalities. It ispossible that voter purges young adults, low income adults, renters or deceased votersare higher in Voter ID states than in non-Voter ID states. Federal law stipulatesthat voters cannot be purged from the voting rolls for at least two general electioncycles, so the number of adults purged in 2006 and beyond is likely quite low in theaggregate.
Placebo Tests
The figures displayed in the results section compare changes in voter turnout amongindividuals in Voter ID states with individuals in states that have no policy implemen-tation. I have estimated a series of placebo tests that report change in turnout amongvoter subgroups in the election cycles immediately preceding a Voter ID statute im-plementation. Since neither set of states implemented Voter ID policies in this periodof time, voter turnout across subgroups in these “future” Voter ID states should beno different from turnout patterns in states that never undergo a Voter ID policyimplementation. These placebo tests are one method of examining whether individ-uals in Voter ID policy states are systematically different from voters in states thatdo not change their policy.
The final column of Table 4 , “04 to 08” compares the change in voter turnout amongstates that strengthened their Voter ID policy between 2006 and 2008 with statesthat did not have a Voter ID implementation in the period. It is evidence thatlow income and young adults are disproportionately demobilized by the Voter IDimplementation. The third column, “04 to 06”, examines change in voter turnoutacross the same sets of states for an earlier period when no states strengthened theirVoter ID policies. Since neither set of states implemented Voter ID policies in thisperiod of time, voter turnout across subgroups in these “future” Voter ID statesshould be no different from turnout patterns in states that never undergo a VoterID policy implementation. The table indicates that voter turnout patterns amongindividuals who are demobilized by Voter ID statutes are not significantly differ inthe third column.
53
Table 4: Placebo Test estimates
Category Subcategory 04 to 06 04 to 08Age Under 35 0.75 -3.50Age 35-44 3.32 -0.51Age 45-54 2.67 -1.94Age 55-64 1.58 -0.89Age 65-74 1.27 -0.08Age 75+ 0.93 -0.15Income Under $20k 1.74 -2.17Income $20k-30k 0.73 -1.63Income 30k-40k 0.46 -1.66Income 40k-60k 0.55 -1.41Income 60k-100k 0.83 -0.98Income 100k+ 1.13 -0.67Owner Owner 1.60 -1.28Owner Renter -0.30 -1.80Race Black 3.58 -4.51Race Hispanic 2.54 0.46Race Caucasian 0.26 -1.28Residence < 1 year -1.95 -1.79Residence 1-5 years -0.17 -1.46Residence 6-10 years -2.64 -4.90Residence 10+ years 2.72 -0.02
Treatment Effects with Different Population Denominators
As noted above, the Catalist data provides a numerator for the total number of votescast by a subgroup and I estimate turnout models with a series of three populationdenominators. The main models presented in the body of the paper use individualswith an active voting history as the denominator for calculating voter turnout. HereI present the treatment effects when I use registered voters and the change in totalvotes cast as denominators. In general, the substantive takeaways are very similaracross the various population denominators.
Effects Among Registered Voters. Table 5 displays the main treatment ef-fects among registered voters. The treatment effects by age, race, income and homeownership are small in the presidential election comparison. By contrast, there are
54
significant and negative findings in the two midterm election comparisons. For exam-ple, voter turnout is approximately 13 percentage points lower among young adultsin states administering Voter ID policy changes than in states that underwent nopolicy change.
Table 5: Treatment effects among Registered VotersCategory Subcategory 04 to 08 06 to 10 04 to 10Age Under 35 -0.53 -2.93 -1.05Age 35-44 0.12 -0.73 0.44Age 45-54 -0.23 -1.14 0.32Age 55-64 -0.47 -1.12 -0.33Age 65-74 0.14 -0.46 0.17Age 75+ -0.02 -0.18 0.07Income Under $20k 0.85 -2.16 -1.16Income $20k-30k 0.55 -1.88 -1.03Income 30k-40k 0.58 -1.89 -0.88Income 40k-60k 0.67 -2.13 -0.64Income 60k-100k 0.57 -2.28 -0.27Income 100k+ -0.10 -2.45 -0.02Owner Owner 0.19 -2.32 0.14Owner Renter 0.60 -2.66 -1.75Race Black 0.14 -1.37 -0.91Race Hispanic 1.17 -2.35 0.10Race Caucasian -0.19 -2.19 -0.55Residence < 1 year -0.20 -2.09 -1.34Residence 1-5 years 0.01 -2.64 -1.03Residence 6-10 years -4.49 -2.88 -4.57Residence 10+ years 2.34 -2.03 0.99
Effects Using Raw Vote Changes Table 6 displays the main treatment effectsusing the change in raw votes casts across elections as the measure. As in the previoustable, the treatment effects by age, race, income and home ownership are small inthe presidential election comparison. By contrast, there are significant and negativefindings in the two midterm election comparisons. For example, voter turnout isapproximately 20 percentage points lower among young adults and 10 percentagepoints lower among renters in states administering Voter ID policy changes than instates that underwent no policy change.
55
Table 6: Treatment effects using raw votes as a denominatorCategory Subcategory 04 to 08 06 to 10 04 to 10Age Under 35 -1.28 -24.04 -22.95Age 35-44 0.57 -6.66 -4.01Age 45-54 0.10 -6.48 -1.88Age 55-64 -0.50 -3.21 -1.17Age 65-74 1.10 -0.40 1.32Age 75+ -0.31 0.61 0.54Income Under $20k 1.80 -10.50 -7.75Income $20k-30k 0.82 -8.02 -4.50Income 30k-40k 0.70 -7.13 -2.62Income 40k-60k 0.74 -6.95 -0.98Income 60k-100k 0.34 -6.11 0.59Income 100k+ -0.69 -5.45 0.83Owner Owner 0.05 -5.45 1.05Owner Renter 1.13 -10.68 -9.04Race Black 0.19 -5.95 -4.84Race Hispanic 3.77 -9.23 -2.35Race Caucasian -0.34 -6.59 -2.17Residence < 1 year -1.35 -11.09 -7.83Residence 1-5 years 0.11 -9.93 -5.25Residence 6-10 years -9.50 -8.39 -12.35Residence 10+ years 3.77 -4.89 3.05
Calculating Treatment Effects with non-random assignment
The primary tables and figures in the next section present national estimates. I alsoanalyze separate models with subsets of the data because Voter ID statutes havebeen disproportionately adopted in conservative and competitive states.
First, Table 7 examines competitive states where the 2004 presidential vote waswithin 10 percentage points. Second, Table 8 restricts the sample to Republican-leaning states – places that George W. Bush won in 2004. Finally, Table 9 examinesstates with at least a Non-Photo Voter ID policy in 2010.63 The results for thethree estimation approaches are similar to the findings reported in the paper’s mainbody – small effects during presidential elections and modest, negative effects during
63Approximately 30 states have administered a Voter ID policy stricter than the HAVA minimum.
56
midterm contests.
Table 7: Treatment effects in 2008 battleground states (e.g., less than 10 percentagepoint margin)
Table 10: Treatment effects in states that changed policy from No ID to Non-PhotoID
Category Subcategory 04 to 08 06 to 10 04 to 10Age Under 35 -5.81 -0.48 -1.96Age 35-44 -1.57 0.50 2.60Age 45-54 -2.75 -0.88 0.73Age 55-64 -0.88 0.23 1.92Age 65-74 -0.13 0.16 1.21Age 75+ -0.10 0.50 1.12Income Under $20k -3.86 -1.26 -0.82Income $20k-30k -3.39 -0.34 0.35Income 30k-40k -3.16 -0.31 0.79Income 40k-60k -2.56 -0.11 1.10Income 60k-100k -1.89 0.62 2.04Income 100k+ -1.75 0.74 2.96Owner Owner -1.69 0.53 2.62Owner Renter -3.49 -1.13 -1.05Race Black -9.56 -4.08 -8.10Race Hispanic 2.27 4.02 8.28Race Caucasian -1.70 0.88 1.48Residence < 1 year -2.21 1.51 2.63Residence 1-5 years -1.36 0.32 1.67Residence 6-10 years -6.49 -0.84 -1.91Residence 10+ years -1.77 -0.19 2.06ID states - Arizona, Ohio, Oklahoma, Utah & Washington.
60
Table 11: Treatment effects in states that changed policy from No ID to Photo ID /Strict Photo ID
Category Subcategory 04 to 08 06 to 10 04 to 10Age Under 35 0.35 -11.16 -6.24Age 35-44 -0.38 -5.87 -1.10Age 45-54 -1.52 -6.73 -2.79Age 55-64 -1.19 -4.49 -1.89Age 65-74 -0.35 -2.09 -0.62Age 75+ -0.06 -1.19 0.09Income Under $20k 2.59 -11.40 -6.08Income $20k-30k 0.05 -11.13 -6.95Income 30k-40k -0.55 -11.03 -7.08Income 40k-60k -0.94 -10.24 -6.28Income 60k-100k -1.37 -9.97 -5.65Income 100k+ -1.78 -9.54 -5.85Owner Owner -1.18 -10.03 -5.23Owner Renter -1.21 -10.05 -6.74Race Black -4.70 -17.24 -11.82Race Hispanic 4.61 -11.88 -6.64Race Caucasian 0.96 -8.69 -4.85Residence < 1 year -2.76 -13.95 -13.31Residence 1-5 years -0.46 -14.13 -11.39Residence 6-10 years -8.46 -12.59 -12.08Residence 10+ years 2.25 -7.92 -1.98ID states - Idaho, Indiana and Michigan.
61
Table 12: Treatment effects in states that weakened their Voter ID policy. Thereis evidence that Democratic-leaning groups’ turnout increases more after Voter IDlaws are weakened.
Category Subcategory 04 to 08 06 to 10 04 to 10Age Under 35 3.88 3.49 5.08Age 35-44 3.83 3.72 5.62Age 45-54 1.99 3.55 3.36Age 55-64 2.73 3.15 2.37Age 65-74 2.68 3.25 3.22Age 75+ 1.18 2.42 1.93Income Under $20k 3.64 8.70 8.65Income $20k-30k 4.10 7.71 8.54Income 30k-40k 4.08 6.74 7.64Income 40k-60k 4.58 6.45 7.48Income 60k-100k 4.93 5.78 7.79Income 100k+ 5.16 5.75 9.20Owner Owner 4.72 5.38 7.54Owner Renter 3.57 7.46 7.37Race Black 5.88 9.63 11.74Race Hispanic -6.31 -0.40 -1.12Race Caucasian 4.49 5.17 6.64Residence < 1 year 7.06 7.87 10.52Residence 1-5 years 6.81 10.50 13.23Residence 6-10 years 12.29 8.07 14.18Residence 10+ years 0.30 3.51 2.56New Mexico and South Carolina.