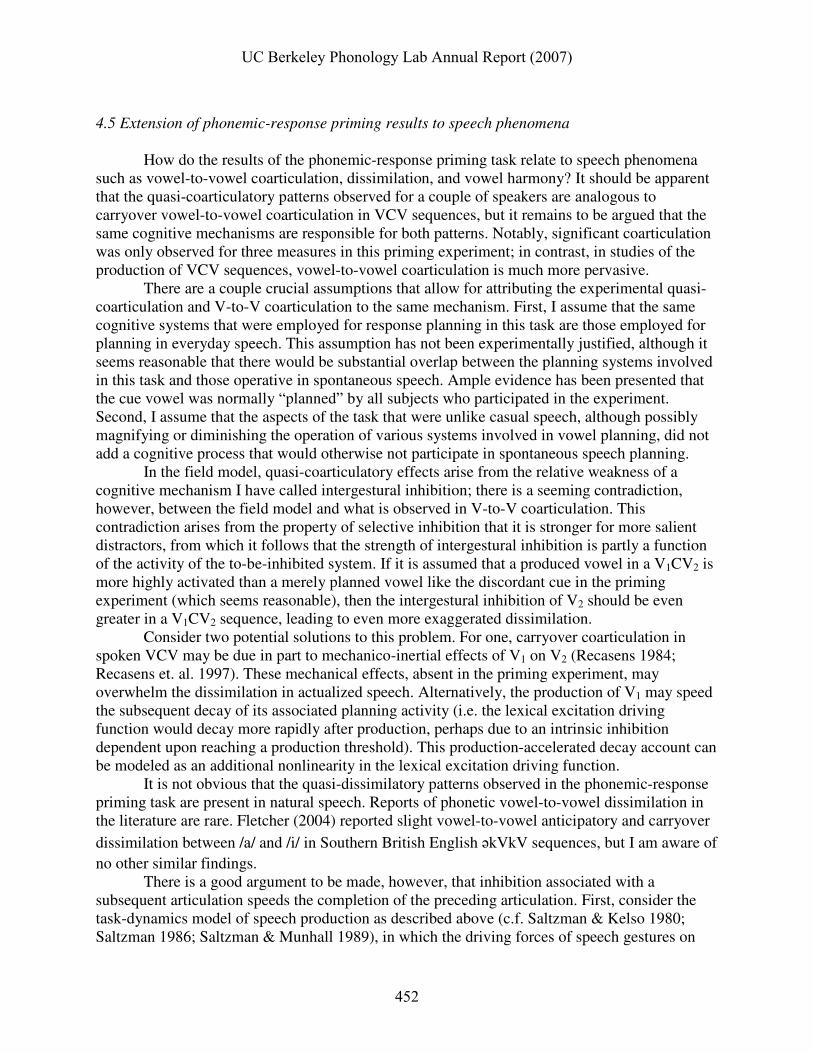
Vowel-to-vowel coarticulation and dissimilation in phonemic-response priming Sam Tilsen University of California, Berkeley Abstract. A phonemic-response priming experiment was conducted to investigate the extent to which carryover vowel-to-vowel coarticulation is caused by cognitive mechanisms, as opposed to physical constraints on articulator movement. On experimental trials the first vowel in a two- vowel sequence was planned—but not articulated—before the second vowel was produced. Contrary to hypothesis, significant quasi-dissimilatory effects on vowel formants were observed between the unproduced and produced vowels. These results suggest that there is a speech- planning mechanism restricting the extent of carryover vowel-to-vowel coarticulation. Drawing upon similar findings in oculomotor and reaching studies, this report proposes a dynamical field model of vowel planning with inhibition between contemporaneously planned gestures. The model can be extended to account for cross-linguistic and interspeaker variation in coarticulation. 1. Introduction 1.1 Vowel-to-vowel coarticulation Vowel-to-vowel coarticulation is an assimilatory influence upon the articulatory movements of one vowel due to the presence of a nearby vowel. The existence of this phenomenon begs a two-sided question: why does it occur?, and why does it not occur more extensively? In other words, what are the cognitive and phonetic mechanisms responsible for vowel-to-vowel (henceforth V-to-V) coarticulation, and what are the mechanisms that limit the magnitude and range of V-to-V coarticulation? V-to-V coarticulation is either anticipatory or carryover (perseveratory); both types have been observed in a variety of languages (Öhman 1966; Gay 1974, 1977; Bell-Berti & Harris 1976; Butcher & Weiher 1976; Fowler 1981; Parush et al. 1983; Recasens 1984, 1997; Manuel & Krakow 1984; Manuel 1990), although the relative extent of anticipatory and carryover V-to-V coarticulation typically depends upon numerous factors, including language, speaker, vowel, and the instrumentation used (e.g. palatography, spectral analysis, cineflourography, etc). A fundamental question in the study of coarticulation is how the causes of anticipatory and carryover coarticulation may differ. Anticipatory coarticulation is generally understood to arise from interaction between the planning and/or production of an articulation and early planning of an upcoming articulation. Articulatory phonology, which has been successful in UC Berkeley Phonology Lab Annual Report (2007) 416
Transcript
Vowel-to-vowel coarticulation and dissimilation
in phonemic-response priming
Sam Tilsen University of California, Berkeley
Abstract. A phonemic-response priming experiment was conducted to investigate the extent to which carryover vowel-to-vowel coarticulation is caused by cognitive mechanisms, as opposed to physical constraints on articulator movement. On experimental trials the first vowel in a two-vowel sequence was planned—but not articulated—before the second vowel was produced. Contrary to hypothesis, significant quasi-dissimilatory effects on vowel formants were observed between the unproduced and produced vowels. These results suggest that there is a speech-planning mechanism restricting the extent of carryover vowel-to-vowel coarticulation. Drawing upon similar findings in oculomotor and reaching studies, this report proposes a dynamical field model of vowel planning with inhibition between contemporaneously planned gestures. The model can be extended to account for cross-linguistic and interspeaker variation in coarticulation.
1. Introduction
1.1 Vowel-to-vowel coarticulation
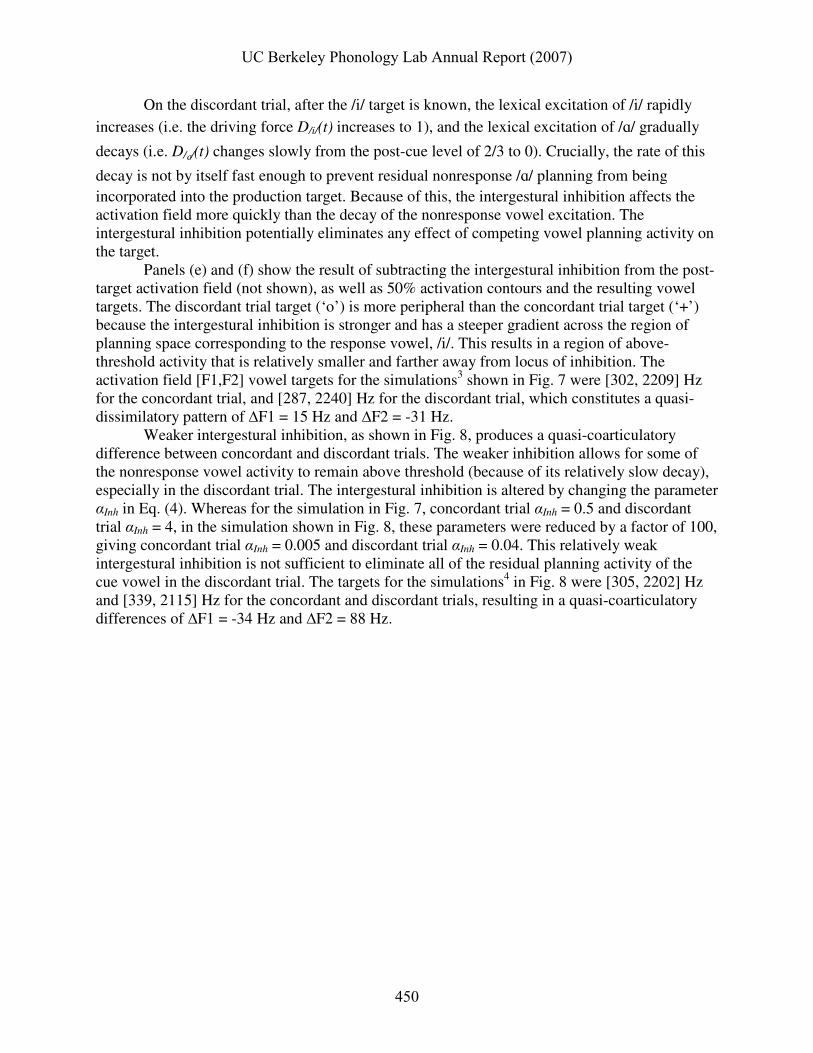
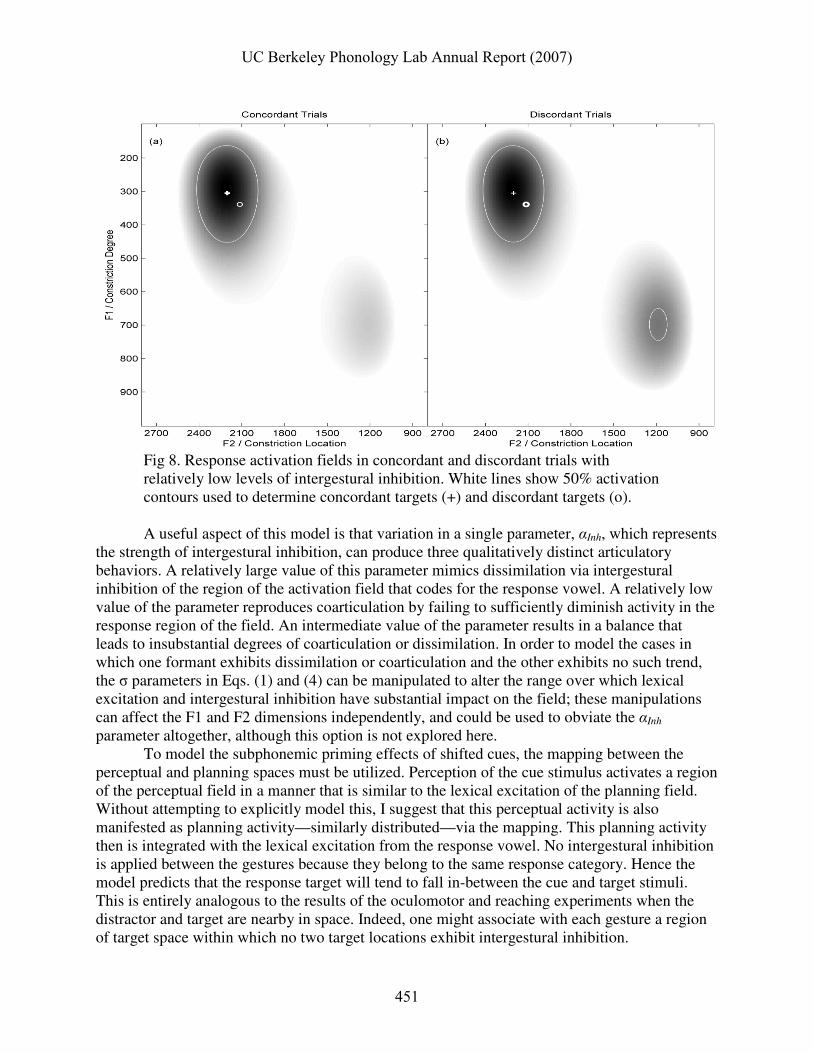
Vowel-to-vowel coarticulation is an assimilatory influence upon the articulatory
movements of one vowel due to the presence of a nearby vowel. The existence of this phenomenon begs a two-sided question: why does it occur?, and why does it not occur more extensively? In other words, what are the cognitive and phonetic mechanisms responsible for vowel-to-vowel (henceforth V-to-V) coarticulation, and what are the mechanisms that limit the magnitude and range of V-to-V coarticulation? V-to-V coarticulation is either anticipatory or carryover (perseveratory); both types have been observed in a variety of languages (Öhman 1966; Gay 1974, 1977; Bell-Berti & Harris 1976; Butcher & Weiher 1976; Fowler 1981; Parush et al. 1983; Recasens 1984, 1997; Manuel & Krakow 1984; Manuel 1990), although the relative extent of anticipatory and carryover V-to-V coarticulation typically depends upon numerous factors, including language, speaker, vowel, and the instrumentation used (e.g. palatography, spectral analysis, cineflourography, etc).
A fundamental question in the study of coarticulation is how the causes of anticipatory and carryover coarticulation may differ. Anticipatory coarticulation is generally understood to arise from interaction between the planning and/or production of an articulation and early planning of an upcoming articulation. Articulatory phonology, which has been successful in
UC Berkeley Phonology Lab Annual Report (2007)
416
describing a wide range of casual speech phenomena, models coarticulation as the overlapping of gestural activations, such that multiple gestures simultaneously exert some influence on the control of vocal tract variables like dorsal constriction degree and location (Browman & Goldstein 1990).
Carryover V-to-V coarticulation, the focus of this study, admits of two compatible explanations. Articulatory effects of a vowel on the following one may arise from cognitive causes, such as the integration of residual articulatory planning into subsequent articulation; in addition (or alternatively), carryover V-to-V coarticulation may be caused by inertial and mechanical forces governing the motions of articulators (Recasens 1984; Recasens et. al. 1997). Distinguishing between these two causes is difficult because there is no straightforward way of independently measuring those components of tongue movement that are due to motor control and those due to physical forces.
One good argument for positing a cognitive explanation for carryover V-to-V
coarticulation is its temporal range. Fowler (1981) reported evidence of such coarticulation across two unstressed vowels, and Magen (1997) found an effect between stressed vowels separated by an unstressed vowel. Mechanico-inertial constraints are unlikely to have consequences for articulator movement over such long time-scales—although this possibility has not been experimentally precluded.
A less solid argument is based upon the existence of language-particular V-to-V coarticulatory patterns. Considerable cross-linguistic variation is evident when examining the variety of results obtained in VCV coarticulation studies: speakers of some languages seem to exhibit both anticipatory and carryover articulation, while speakers of other languages may show predominantly one or the other. Furthermore, the magnitudes of these coarticulatory effects can differ markedly between languages. Because the physiology of the human vocal apparatus does not differ cross-linguistically to an extent that would account for such diverse patterns, a cognitive mechanism might be implicated. However, cross-linguistic differences in how consonantal articulations in VCV sequences interact with the flanking vowel gestures raise doubts about the legitimacy of such an argument. The cross-linguistic differences in V-to-V coarticulation could be attributable to consonant-vowel relations.
In a similar vein, if the size and organization of the vowel inventory in a given language is found to interact with the extent of carryover V-to-V coarticulation observed in the language, an argument could be made for a cognitive cause. Manuel (1990, 1999) has shown that there is less anticipatory V-to-V coarticulation in languages with more crowded vowel spaces. If this finding extends to carryover V-to-V coarticulation, then it argues for a cognitive cause, because the size and organization of a vowel inventory presumably does not alter physical laws or human physiology.
Other interesting findings in studies of V-to-V coarticulation do not persuasively argue
one way or the other for a cognitive or physical cause of carryover coarticulation. Speaker-specific differences in anticipatory and carryover effects are often observed in experimental studies (c.f. Magen 1997). These idiosyncrasies could arise either from individual physiological differences or individual differences in parameters of the speech planning system. Although physiological variables responsible for coarticulatory variation have not been found, the relevant variables could have remained elusive to date.
UC Berkeley Phonology Lab Annual Report (2007)
417
Prosodic strengthening, the increased resistance to coarticulation of stressed vowels and phrase-initial and phrase-final vowels (Cho 2004), could arise from differences in speech planning differences between these prosodic contexts. However, these effects could also follow indirectly from mechanico-inertial differences that are associated with the increased gestural amplitudes and durations observed in non-medial and stressed contexts.
A more general problem in analyzing the causes of carryover V-to-V coarticulation is the possibility that speakers employ cognitive mechanisms to compensate for or modulate physical factors. In other words, speakers may compensate for expected physical constraints with planned coarticulation, or perhaps exaggerate or otherwise alter their articulations. Such behaviors would obfuscate physical perturbations on coarticulation, and there would exist no simple method of distilling the contributions of the cognitive and physical domains.
Some of the findings mentioned above suggest that there are various factors which
restrict the magnitude and range of coarticulation. Several more general linguistic tendencies can also be invoked to account for why coarticulation is not more promiscuous. One is the principle of maximization of contrast, whereby speakers intentionally produce acoustically more distinct vowels to aid in the perception of their speech. Liljencrants & Lindblom (1972) modeled this as the minimization of a potential energy function derived from the distances between points in vowel space. Another is a tendency to be faithful to lexical representations, which is commonly modeled in OT with constraints upon differences between input and output representations. In articulatory phonology, coarticulation is restricted by the specification of relative phases between successive gestures; vocalic gestures are typically phase-locked in an offset-to-onset manner and departures from this phasing, which are responsible for V-to-V coarticulation, are restricted.
While the most common approach to studying coarticulation is to measure utterances in a variety of relatively unperturbed speech contexts, an alternative approach is to perturb the speech planning and production systems in a controlled way prior to or during an utterance. Whalen (1990) did this by attempting to limit the planning of the second vowel in a VCV sequence. Subjects in his experiment were presented with VC_ on a screen, and when they began phonating the first vowel, the second vowel appeared—thus pre-planning of anticipatory coarticulation was effectively prevented, and pre-planning of carryover coarticulation was restricted to part of the duration of the first vowel and the duration consonant. Whalen found that there was no anticipatory V-to-V coarticulation in the experimental condition, indicating that anticipatory V-to-V coarticulation is planned. However, the extent of carryover V-to-V coarticulation was not significantly different between the experimental and control conditions. Whalen interpreted the absence of carryover effects as inconclusive: either physical causes were responsible for carryover V-to-V coarticulation, or planning of such coarticulation could have occurred during the VC portion of the utterance. Ultimately, the experimental design could not distinguish between these two explanations. 1.2 Phonemic-response priming
To address the question of the extent to which cognitive mechanisms cause carryover
coarticulation, this study employed a priming task. The Whalen (1990) study restricted preplanning of V2 in a V1CV2 utterance by preventing subjects from knowing what V2 would be until they began the production of V1. The operating principle here differs in two important respects: encourage preplanning of V1, but prevent the articulation of this vowel. In other words,
UC Berkeley Phonology Lab Annual Report (2007)
418
prompt subjects to plan but not produce V1, and then produce a different vowel. If a planned but unproduced vowel has an effect on the formants of a subsequently produced vowel, then this argues for viewing carryover effects as partly cognitive, perhaps due to residual activation from previously planned gestures, rather than physical constraints on articulator movement.
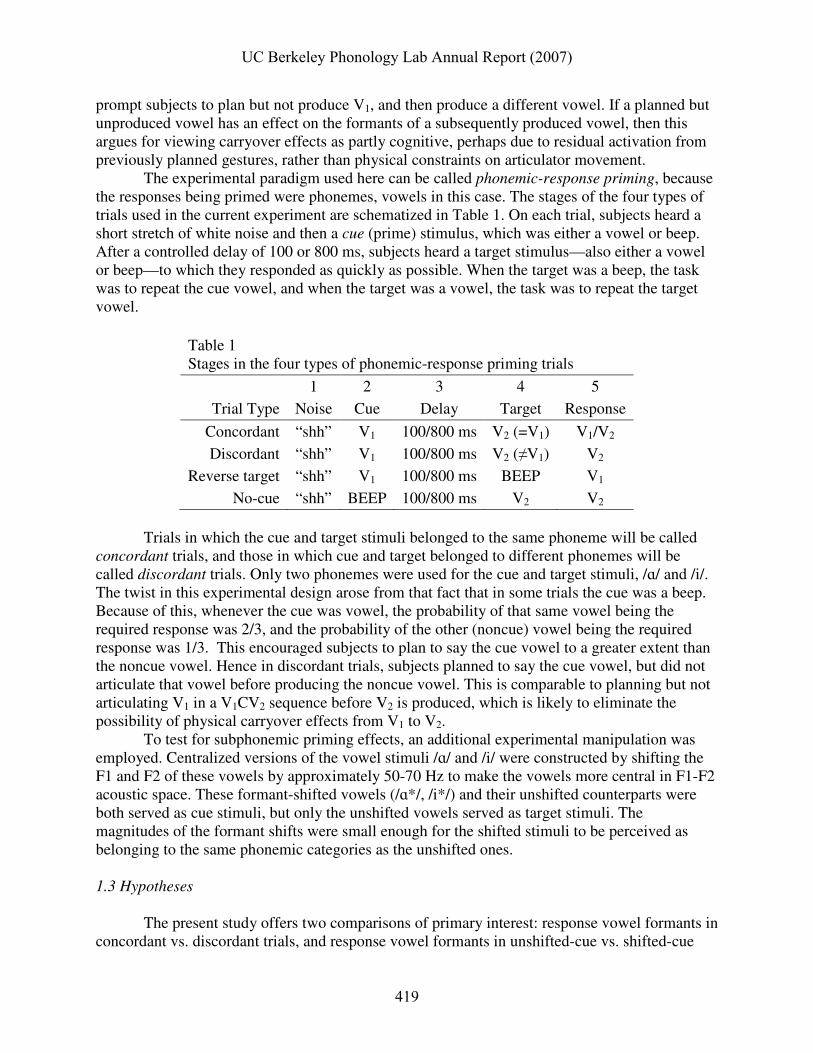
The experimental paradigm used here can be called phonemic-response priming, because the responses being primed were phonemes, vowels in this case. The stages of the four types of trials used in the current experiment are schematized in Table 1. On each trial, subjects heard a short stretch of white noise and then a cue (prime) stimulus, which was either a vowel or beep. After a controlled delay of 100 or 800 ms, subjects heard a target stimulus—also either a vowel or beep—to which they responded as quickly as possible. When the target was a beep, the task was to repeat the cue vowel, and when the target was a vowel, the task was to repeat the target vowel.
Table 1 Stages in the four types of phonemic-response priming trials
1 2 3 4 5
Trial Type Noise Cue Delay Target Response
Concordant “shh” V1 100/800 ms V2 (=V1) V1/V2
Discordant “shh” V1 100/800 ms V2 (≠V1) V2
Reverse target “shh” V1 100/800 ms BEEP V1
No-cue “shh” BEEP 100/800 ms V2 V2 Trials in which the cue and target stimuli belonged to the same phoneme will be called
concordant trials, and those in which cue and target belonged to different phonemes will be called discordant trials. Only two phonemes were used for the cue and target stimuli, /ɑ/ and /i/. The twist in this experimental design arose from that fact that in some trials the cue was a beep. Because of this, whenever the cue was vowel, the probability of that same vowel being the required response was 2/3, and the probability of the other (noncue) vowel being the required response was 1/3. This encouraged subjects to plan to say the cue vowel to a greater extent than the noncue vowel. Hence in discordant trials, subjects planned to say the cue vowel, but did not articulate that vowel before producing the noncue vowel. This is comparable to planning but not articulating V1 in a V1CV2 sequence before V2 is produced, which is likely to eliminate the possibility of physical carryover effects from V1 to V2. To test for subphonemic priming effects, an additional experimental manipulation was employed. Centralized versions of the vowel stimuli /ɑ/ and /i/ were constructed by shifting the F1 and F2 of these vowels by approximately 50-70 Hz to make the vowels more central in F1-F2 acoustic space. These formant-shifted vowels (/ɑ*/, /i*/) and their unshifted counterparts were both served as cue stimuli, but only the unshifted vowels served as target stimuli. The magnitudes of the formant shifts were small enough for the shifted stimuli to be perceived as belonging to the same phonemic categories as the unshifted ones.
1.3 Hypotheses The present study offers two comparisons of primary interest: response vowel formants in concordant vs. discordant trials, and response vowel formants in unshifted-cue vs. shifted-cue
UC Berkeley Phonology Lab Annual Report (2007)
419
concordant trials. Secondary comparisons involve interstimulus delay and response time. Four hypotheses are enumerated below. H1. Subphonemic perceptual-motor integration: on concordant trials, responses made after centrally-shifted cue stimuli will be more central than those after unshifted cues. For example, /ɑ/ responses after centralized /ɑ*/ cues will tend to be more central in F1,F2 space than after unshifted /ɑ/ cues. This would indicate that the sub-phonemic differences in the cue stimuli were perceived and integrated into motor plans. H2. Carryover quasi-coarticulation: response vowels on discordant trials will be acoustically more like the cue vowel than responses on concordant trials. For example, /ɑ/ responses after /i/ cues will tend to be more central than /ɑ/ responses after /ɑ/ cues. Such effects are “quasi-coarticulatory” because they pattern like vowel-to-vowel coarticulation, but in this case the first vowel was not articulated. If such effects are observed, they suggest that carryover coarticulation involves a cognitive component that cannot be attributed to the mechanics of tongue or jaw movements. H3. Temporal decay of carryover coarticulation: carryover quasi-coarticulation will be less extensive when there is a longer delay between cue and target stimuli. The effects on F1 and F2 in the 800 ms delay condition will be less extensive compared to the 100 ms delay condition. The 100 ms delay was chosen to approximate the duration of an intervocalic consonant in a VCV sequence, and the 800 ms delay was chosen to approximate a duration greater than two or three syllables (assuming an average syllable duration in the range of 250-400 ms), where coarticulatory effects should be less substantial or nonexistent. H4. Response times reflect the extent of pre-planning: response times will be faster on concordant trials compared to discordant trials, reflecting relatively more extensive priming or pre-planning of the response on concordant trials. Faster responses to targets sharing phonetic features with primes have been observed for the consonantal feature of voicing (Gordon 1984); these results may extend to features of vocalic gestures such as height and frontness/backness. 2. Method
2.1 Experimental design
Subjects were 18-40 year-old native speakers of American English with no history of speech or hearing problems. 12 subjects participated, 6 male, 6 female. All subjects participated in 2 or 3 one hour sessions, over the course of which they performed a total of 20 to 40 blocks of 32 trials. Each trial began with an interval of white noise of random duration from 1000-4000 ms, followed by a 100 ms interval of silence. The white noise was intended to disrupt any residual effects from the preceding trial. The duration of the noise was randomized in order to avoid the establishment of a rhythm from the onset of the noise to the cue stimulus. After the 100 ms interval of silence, subjects heard the cue stimulus, which was either a beep or one of four vowels, two of which were /ɑ/, the other two /i/. The F1 and F2 of one vowel from each phonemic category were shifted slightly to make the vowels more central in F1,F2 vowel space (c.f. sec. 2.2). All stimuli were 250 ms in duration.
UC Berkeley Phonology Lab Annual Report (2007)
420
Following the cue was a delay of either 100 ms or 800 ms. These durations were chosen to represent intervals of time differing in the relative extent to which planning of the cue stimulus might influence subsequent response planning and execution. After the interstimulus delay, subjects heard the target stimulus, which was either a beep or one of the two unshifted vowels, /ɑ/ and /i/. Note that if the cue stimulus was a beep, the target stimulus was restricted to a vowel, so that beep-beep trials never occurred. Following the target stimulus was a 2000 ms interval in which the subject responded.
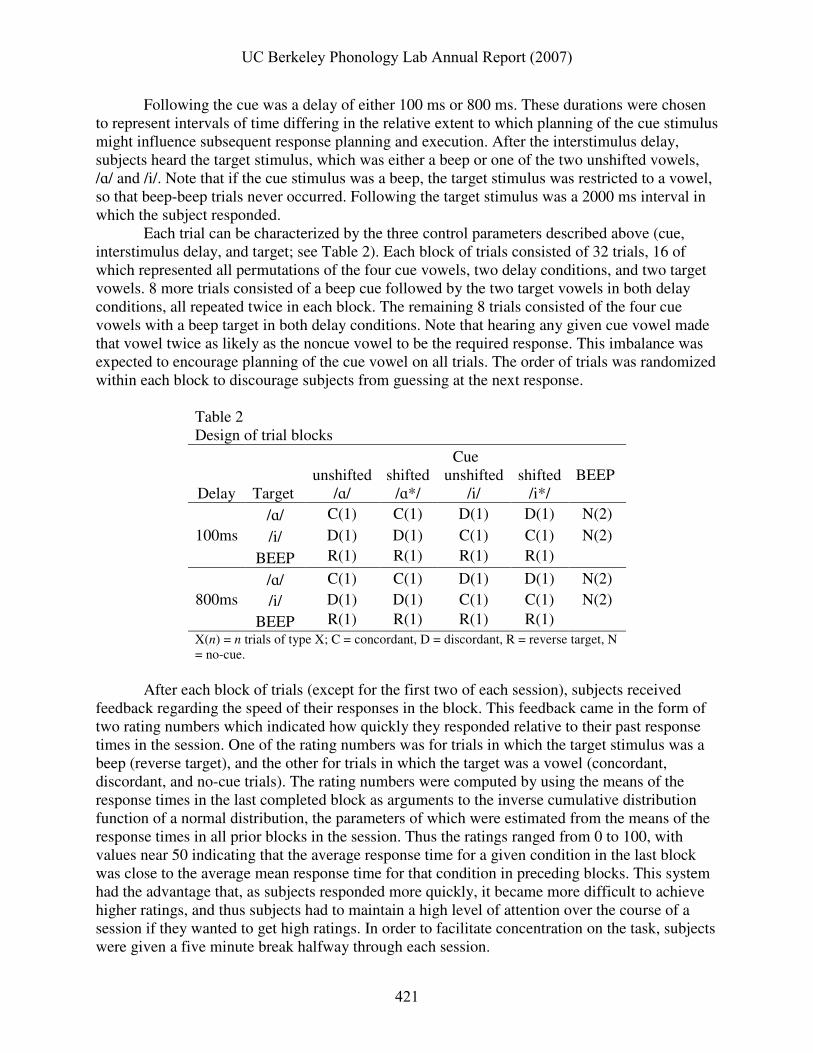
Each trial can be characterized by the three control parameters described above (cue, interstimulus delay, and target; see Table 2). Each block of trials consisted of 32 trials, 16 of which represented all permutations of the four cue vowels, two delay conditions, and two target vowels. 8 more trials consisted of a beep cue followed by the two target vowels in both delay conditions, all repeated twice in each block. The remaining 8 trials consisted of the four cue vowels with a beep target in both delay conditions. Note that hearing any given cue vowel made that vowel twice as likely as the noncue vowel to be the required response. This imbalance was expected to encourage planning of the cue vowel on all trials. The order of trials was randomized within each block to discourage subjects from guessing at the next response.
Table 2 Design of trial blocks
Cue
Delay Target unshifted
/ɑ/ shifted
/ɑ*/ unshifted
/i/ shifted
/i*/ BEEP
100ms /ɑ/ C(1) C(1) D(1) D(1) N(2)
/i/ D(1) D(1) C(1) C(1) N(2)
BEEP R(1) R(1) R(1) R(1)
800ms /ɑ/ C(1) C(1) D(1) D(1) N(2)
/i/ D(1) D(1) C(1) C(1) N(2)
BEEP R(1) R(1) R(1) R(1) X(n) = n trials of type X; C = concordant, D = discordant, R = reverse target, N = no-cue.
After each block of trials (except for the first two of each session), subjects received feedback regarding the speed of their responses in the block. This feedback came in the form of two rating numbers which indicated how quickly they responded relative to their past response times in the session. One of the rating numbers was for trials in which the target stimulus was a beep (reverse target), and the other for trials in which the target was a vowel (concordant, discordant, and no-cue trials). The rating numbers were computed by using the means of the response times in the last completed block as arguments to the inverse cumulative distribution function of a normal distribution, the parameters of which were estimated from the means of the response times in all prior blocks in the session. Thus the ratings ranged from 0 to 100, with values near 50 indicating that the average response time for a given condition in the last block was close to the average mean response time for that condition in preceding blocks. This system had the advantage that, as subjects responded more quickly, it became more difficult to achieve higher ratings, and thus subjects had to maintain a high level of attention over the course of a session if they wanted to get high ratings. In order to facilitate concentration on the task, subjects were given a five minute break halfway through each session.
UC Berkeley Phonology Lab Annual Report (2007)
421
2.2 Stimuli construction
Vowel stimuli were constructed with the following procedure: a speaker of Midwestern American English who makes no distinction between a low back vowel /ɑ/ and a mid low back vowel /ɔ/ produced sets of approximately 100 tokens each of the vowels /ɑ/ and /i/. The tokens closest to the mean F1 and F2 of each set were selected as base tokens (vowel formants were estimated using an LPC algorithm implemented in Matlab, c.f. section 2.3 for details). Using PSOLA resynthesis, the pitch of both vowels was changed to 105 Hz with a slightly falling contour using the formula: F0 = 105 – 20t, where t is the time in seconds from the onset of the vowel. The first 250 ms (over which the pitch fell from 105 Hz to 100 Hz) of the signals were windowed using a Tukey window with r = 0.25 to reduce the salience of onset transients and normalized to have the same signal energy.
Centralized versions of the stimuli were constructed using a method of formant shifting described in Purcell & Munhall (2006). The signals produced in the procedure described above were bandpass filtered in a narrow range of frequencies above or below the formant being shifted, and likewise the signals were bandstop filtered in a range of frequencies containing the center of the formant. The two filtered signals were combined to produce a synthesized signal in which the formant was shifted in the direction of the bandpass filter. This method was chosen over LPC resynthesis because it produces more natural-sounding formant-shifted stimuli (a disadvantage to this method may be that it allows less precise control over the formants of the stimuli). De-emphasis was accomplished with a 3rd-order elliptical filter with 2 dB of passband ripple and 50 dB of stopband attenuation, and emphasis was accomplished with a 3rd-order elliptical filter with 0.5 dB of passband ripple and 15 dB of stopband attenuation. The filtered signals were resynthesized at a 1:1 ratio. Passbands and stopbands for F1 and F2 were, respectively (relative to the unshifted formants, in Hz), F1pass(/ɑ/) = [-150 0], F1stop(/ɑ/) = [0 150], F2pass(/ɑ/) = [50 250], F2stop(/ɑ/) = [-250 50], F1pass(/i/) = [25 350], F1stop(/i/) = [-75 25], F2pass(/i/) = [-350 -50], F2stop(/i/) = [-50 200].
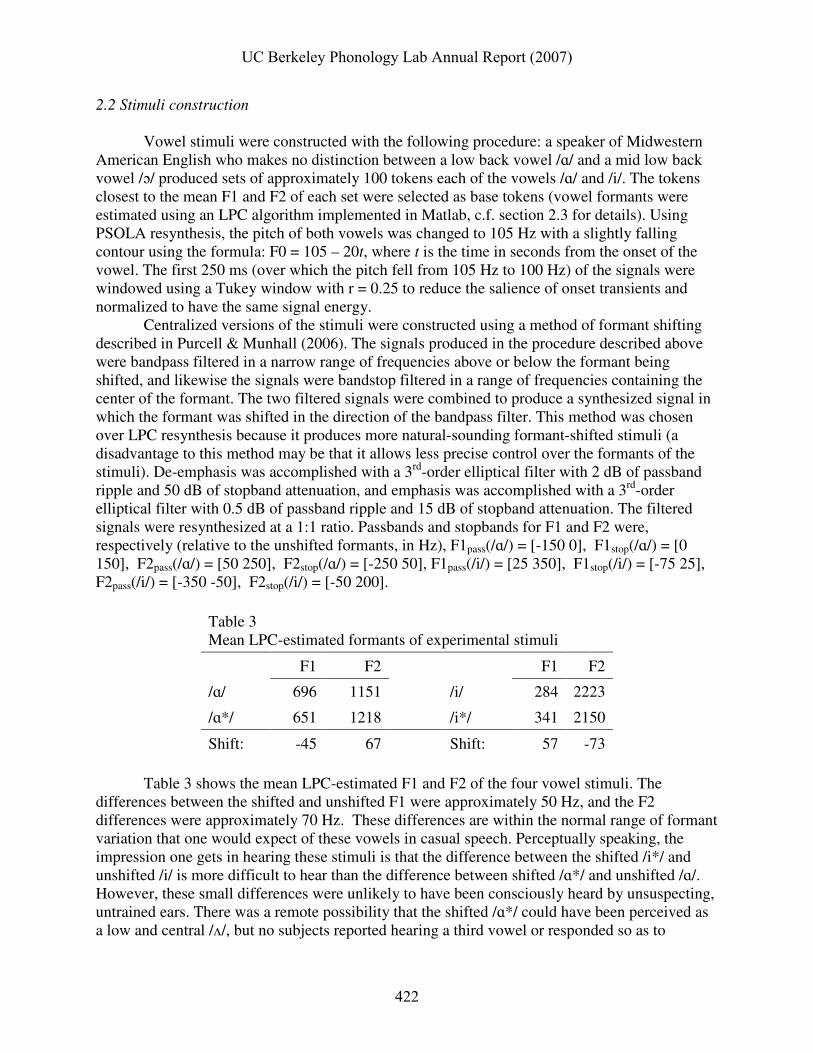
Table 3 Mean LPC-estimated formants of experimental stimuli
F1 F2 F1 F2
/ɑ/ 696 1151 /i/ 284 2223
/ɑ*/ 651 1218 /i*/ 341 2150
Shift: -45 67 Shift: 57 -73
Table 3 shows the mean LPC-estimated F1 and F2 of the four vowel stimuli. The
differences between the shifted and unshifted F1 were approximately 50 Hz, and the F2 differences were approximately 70 Hz. These differences are within the normal range of formant variation that one would expect of these vowels in casual speech. Perceptually speaking, the impression one gets in hearing these stimuli is that the difference between the shifted /i*/ and unshifted /i/ is more difficult to hear than the difference between shifted /ɑ*/ and unshifted /ɑ/. However, these small differences were unlikely to have been consciously heard by unsuspecting, untrained ears. There was a remote possibility that the shifted /ɑ*/ could have been perceived as a low and central /ʌ/, but no subjects reported hearing a third vowel or responded so as to
UC Berkeley Phonology Lab Annual Report (2007)
422
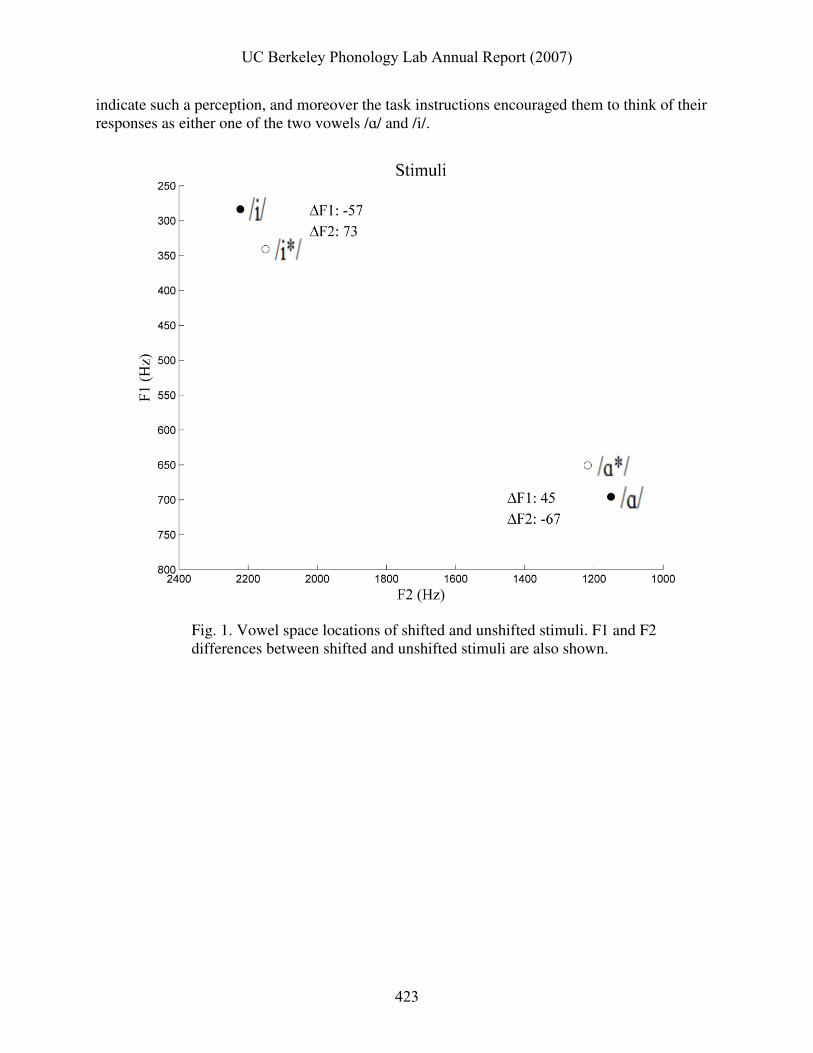
indicate such a perception, and moreover the task instructions encouraged them to think of their responses as either one of the two vowels /ɑ/ and /i/.
Fig. 1. Vowel space locations of shifted and unshifted stimuli. F1 and F2 differences between shifted and unshifted stimuli are also shown.
UC Berkeley Phonology Lab Annual Report (2007)
423
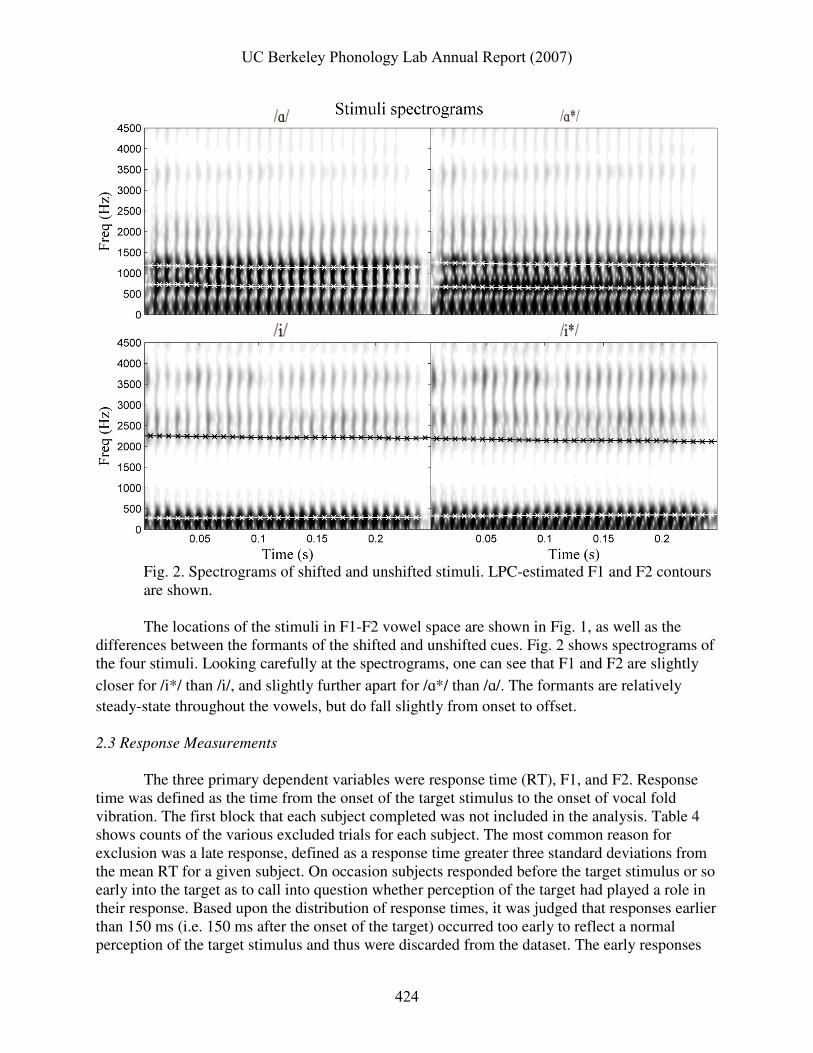
Fig. 2. Spectrograms of shifted and unshifted stimuli. LPC-estimated F1 and F2 contours are shown.
The locations of the stimuli in F1-F2 vowel space are shown in Fig. 1, as well as the
differences between the formants of the shifted and unshifted cues. Fig. 2 shows spectrograms of the four stimuli. Looking carefully at the spectrograms, one can see that F1 and F2 are slightly
closer for /i*/ than /i/, and slightly further apart for /ɑ*/ than /ɑ/. The formants are relatively steady-state throughout the vowels, but do fall slightly from onset to offset. 2.3 Response Measurements
The three primary dependent variables were response time (RT), F1, and F2. Response
time was defined as the time from the onset of the target stimulus to the onset of vocal fold vibration. The first block that each subject completed was not included in the analysis. Table 4 shows counts of the various excluded trials for each subject. The most common reason for exclusion was a late response, defined as a response time greater three standard deviations from the mean RT for a given subject. On occasion subjects responded before the target stimulus or so early into the target as to call into question whether perception of the target had played a role in their response. Based upon the distribution of response times, it was judged that responses earlier than 150 ms (i.e. 150 ms after the onset of the target) occurred too early to reflect a normal perception of the target stimulus and thus were discarded from the dataset. The early responses
UC Berkeley Phonology Lab Annual Report (2007)
424
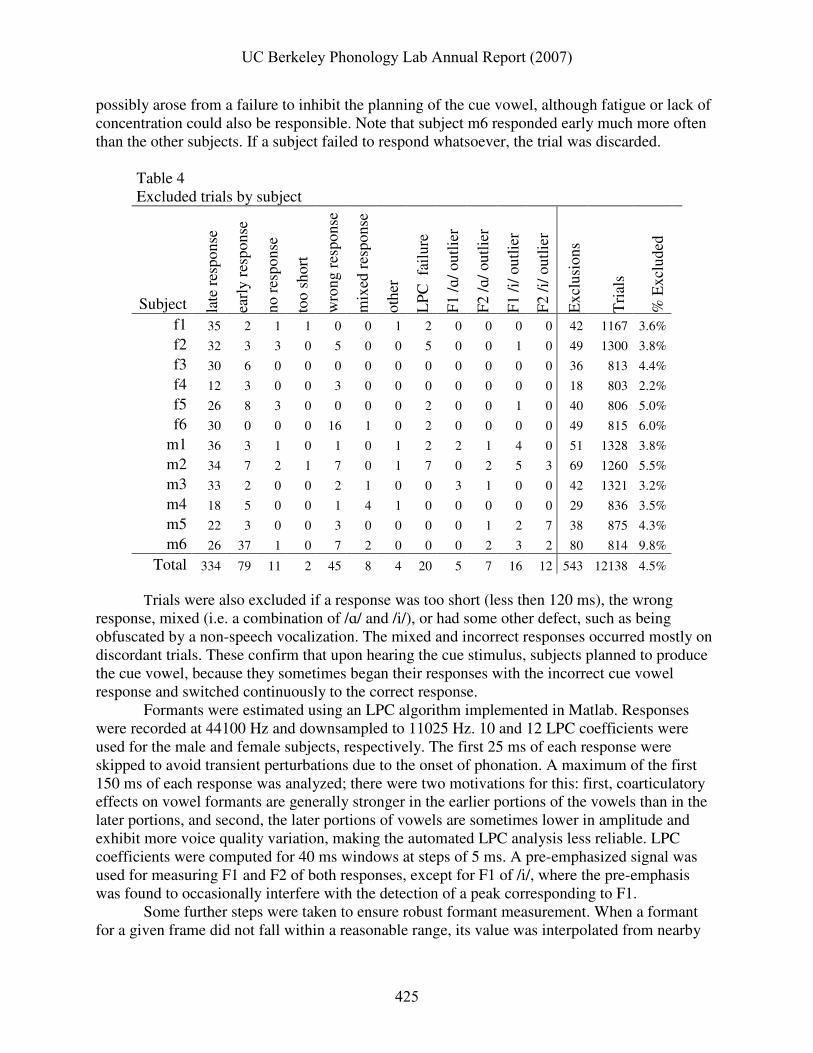
possibly arose from a failure to inhibit the planning of the cue vowel, although fatigue or lack of concentration could also be responsible. Note that subject m6 responded early much more often than the other subjects. If a subject failed to respond whatsoever, the trial was discarded.
Table 4 Excluded trials by subject
Subject late
res
pons
e
earl
y re
spon
se
no r
espo
nse
too
shor
t
wro
ng r
espo
nse
mix
ed r
espo
nse
oth e
r
LP
C f
ailu
re
F1
/ ɑ/
outl
ier
F2
/ ɑ/
outl
ier
F1
/i/
outl
ier
F2
/i/
outl
ier
Exc
lusi
ons
Tri
als
% E
xclu
ded
f1 35 2 1 1 0 0 1 2 0 0 0 0 42 1167 3.6%
f2 32 3 3 0 5 0 0 5 0 0 1 0 49 1300 3.8%
f3 30 6 0 0 0 0 0 0 0 0 0 0 36 813 4.4%
f4 12 3 0 0 3 0 0 0 0 0 0 0 18 803 2.2%
f5 26 8 3 0 0 0 0 2 0 0 1 0 40 806 5.0%
f6 30 0 0 0 16 1 0 2 0 0 0 0 49 815 6.0%
m1 36 3 1 0 1 0 1 2 2 1 4 0 51 1328 3.8%
m2 34 7 2 1 7 0 1 7 0 2 5 3 69 1260 5.5%
m3 33 2 0 0 2 1 0 0 3 1 0 0 42 1321 3.2%
m4 18 5 0 0 1 4 1 0 0 0 0 0 29 836 3.5%
m5 22 3 0 0 3 0 0 0 0 1 2 7 38 875 4.3%
m6 26 37 1 0 7 2 0 0 0 2 3 2 80 814 9.8%
Total 334 79 11 2 45 8 4 20 5 7 16 12 543 12138 4.5% Trials were also excluded if a response was too short (less then 120 ms), the wrong response, mixed (i.e. a combination of /ɑ/ and /i/), or had some other defect, such as being obfuscated by a non-speech vocalization. The mixed and incorrect responses occurred mostly on discordant trials. These confirm that upon hearing the cue stimulus, subjects planned to produce the cue vowel, because they sometimes began their responses with the incorrect cue vowel response and switched continuously to the correct response. Formants were estimated using an LPC algorithm implemented in Matlab. Responses were recorded at 44100 Hz and downsampled to 11025 Hz. 10 and 12 LPC coefficients were used for the male and female subjects, respectively. The first 25 ms of each response were skipped to avoid transient perturbations due to the onset of phonation. A maximum of the first 150 ms of each response was analyzed; there were two motivations for this: first, coarticulatory effects on vowel formants are generally stronger in the earlier portions of the vowels than in the later portions, and second, the later portions of vowels are sometimes lower in amplitude and exhibit more voice quality variation, making the automated LPC analysis less reliable. LPC coefficients were computed for 40 ms windows at steps of 5 ms. A pre-emphasized signal was used for measuring F1 and F2 of both responses, except for F1 of /i/, where the pre-emphasis was found to occasionally interfere with the detection of a peak corresponding to F1.
Some further steps were taken to ensure robust formant measurement. When a formant for a given frame did not fall within a reasonable range, its value was interpolated from nearby
UC Berkeley Phonology Lab Annual Report (2007)
425
formants; if reasonable formants were not found in ten consecutive frames or twelve frames total in the vowel, the LPC algorithm was considered to have failed and the trial was discarded. Finally, the formants were smoothed and averaged across frames. Most of the LPC algorithm failures (< 0.2%) involved low amplitude tokens in which the F1 and F2 spectral peaks of an /ɑ/ were indistinct or the F2 and F3 of an /i/ were indistinct. A few tokens with F1 or F2 values more than four standard deviations away from the mean for a given subject were also discarded.
Overall, less than 5% of the entire dataset was excluded, although this varied by subject. When one discounts the late responses, less than 2% of all trials were excluded. Keeping the late responses makes no qualitative differences in the formant results presented in the next section; however, they do have some minor impacts on the statistical analysis of response times. Because quick response times are indicative of attention to the task, and because lack of attention is possibly a confounding factor, it was judged best to exclude these RT outliers. 3. Results
3.1 Effects of shifted cues on response vowel formants
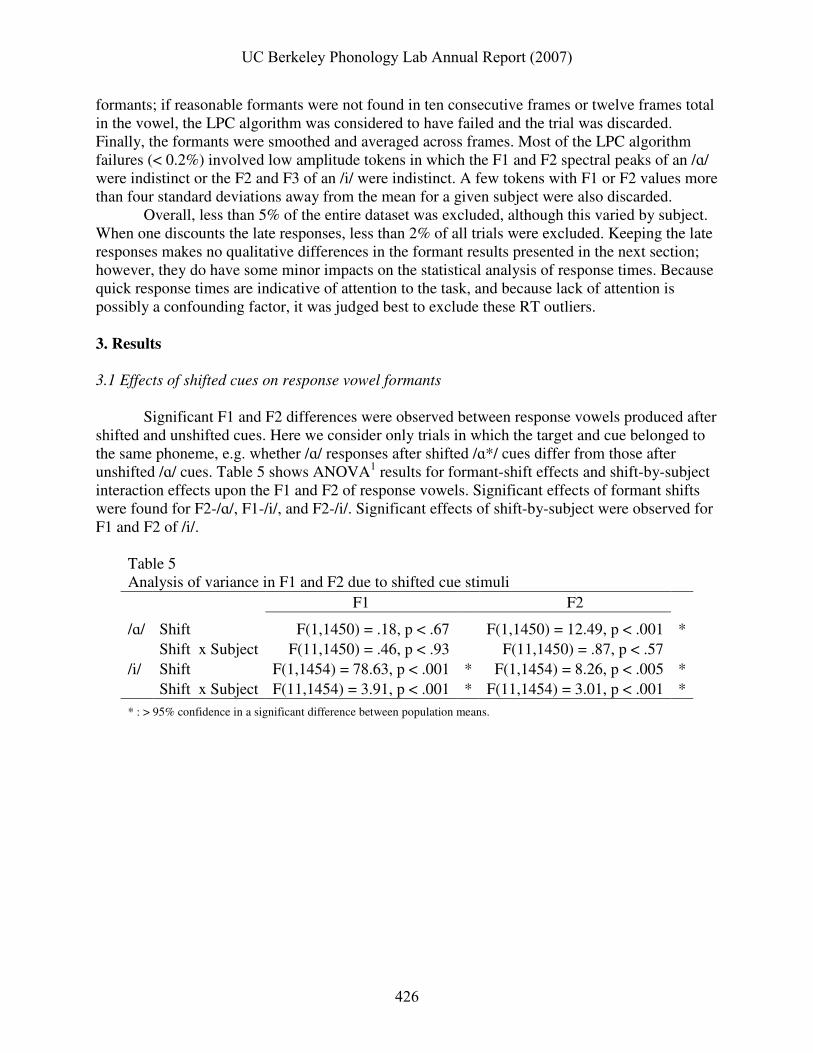
Significant F1 and F2 differences were observed between response vowels produced after
shifted and unshifted cues. Here we consider only trials in which the target and cue belonged to the same phoneme, e.g. whether /ɑ/ responses after shifted /ɑ*/ cues differ from those after unshifted /ɑ/ cues. Table 5 shows ANOVA1 results for formant-shift effects and shift-by-subject interaction effects upon the F1 and F2 of response vowels. Significant effects of formant shifts were found for F2-/ɑ/, F1-/i/, and F2-/i/. Significant effects of shift-by-subject were observed for F1 and F2 of /i/.
Table 5 Analysis of variance in F1 and F2 due to shifted cue stimuli
F1 F2
/ɑ/ Shift F(1,1450) = .18, p < .67 F(1,1450) = 12.49, p < .001 * Shift x Subject F(11,1450) = .46, p < .93 F(11,1450) = .87, p < .57
/i/ Shift F(1,1454) = 78.63, p < .001 * F(1,1454) = 8.26, p < .005 * Shift x Subject F(11,1454) = 3.91, p < .001 * F(11,1454) = 3.01, p < .001 *
* : > 95% confidence in a significant difference between population means.
UC Berkeley Phonology Lab Annual Report (2007)
426
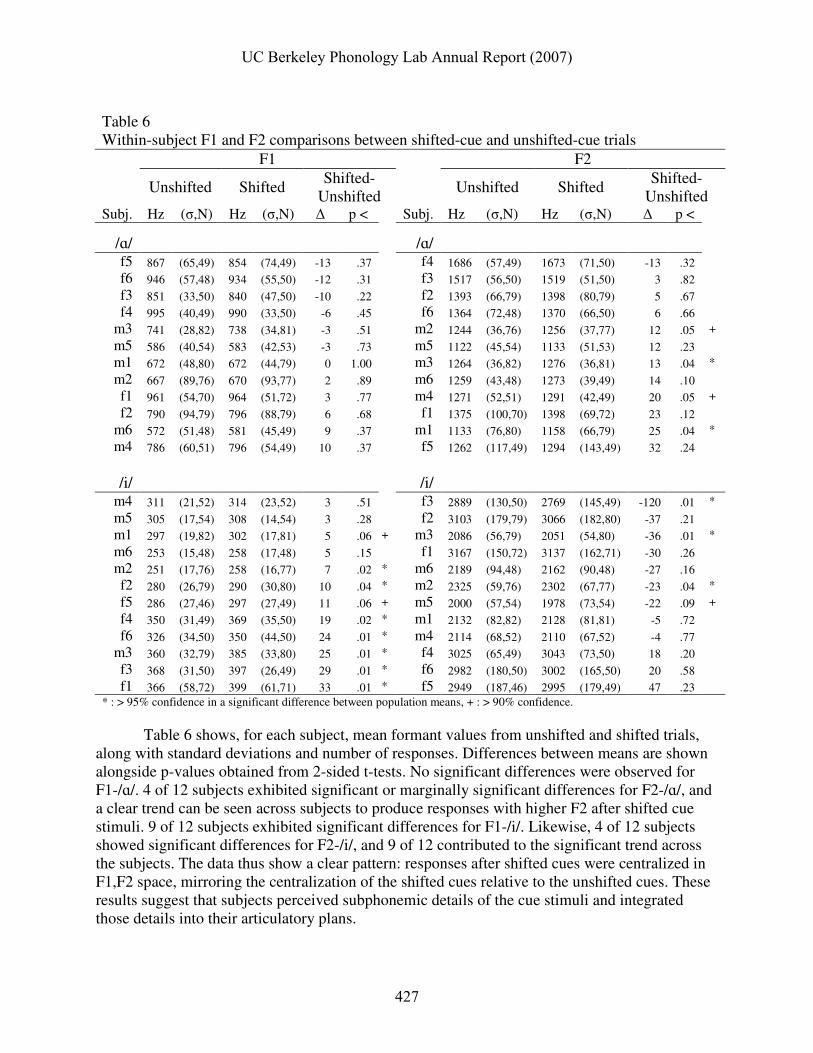
Table 6 Within-subject F1 and F2 comparisons between shifted-cue and unshifted-cue trials
* : > 95% confidence in a significant difference between population means, + : > 90% confidence.
Table 6 shows, for each subject, mean formant values from unshifted and shifted trials,
along with standard deviations and number of responses. Differences between means are shown alongside p-values obtained from 2-sided t-tests. No significant differences were observed for F1-/ɑ/. 4 of 12 subjects exhibited significant or marginally significant differences for F2-/ɑ/, and a clear trend can be seen across subjects to produce responses with higher F2 after shifted cue stimuli. 9 of 12 subjects exhibited significant differences for F1-/i/. Likewise, 4 of 12 subjects showed significant differences for F2-/i/, and 9 of 12 contributed to the significant trend across the subjects. The data thus show a clear pattern: responses after shifted cues were centralized in F1,F2 space, mirroring the centralization of the shifted cues relative to the unshifted cues. These results suggest that subjects perceived subphonemic details of the cue stimuli and integrated those details into their articulatory plans.
UC Berkeley Phonology Lab Annual Report (2007)
427
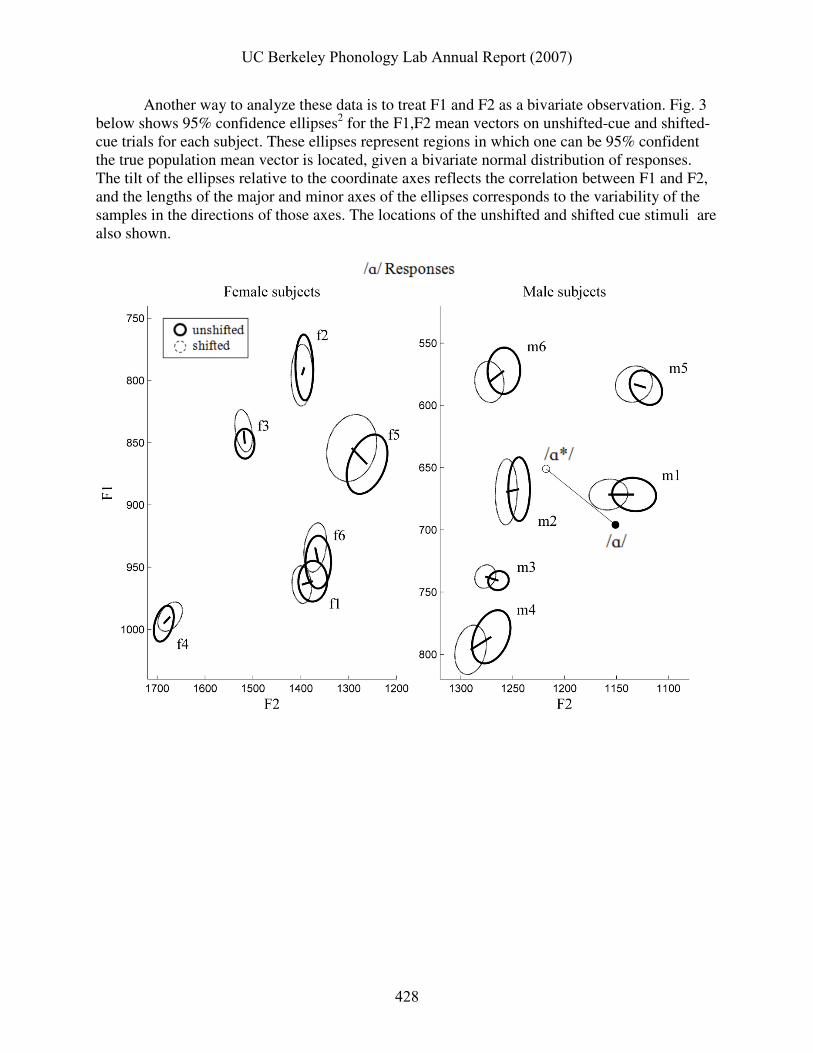
Another way to analyze these data is to treat F1 and F2 as a bivariate observation. Fig. 3 below shows 95% confidence ellipses2 for the F1,F2 mean vectors on unshifted-cue and shifted-cue trials for each subject. These ellipses represent regions in which one can be 95% confident the true population mean vector is located, given a bivariate normal distribution of responses. The tilt of the ellipses relative to the coordinate axes reflects the correlation between F1 and F2, and the lengths of the major and minor axes of the ellipses corresponds to the variability of the samples in the directions of those axes. The locations of the unshifted and shifted cue stimuli are also shown.
UC Berkeley Phonology Lab Annual Report (2007)
428
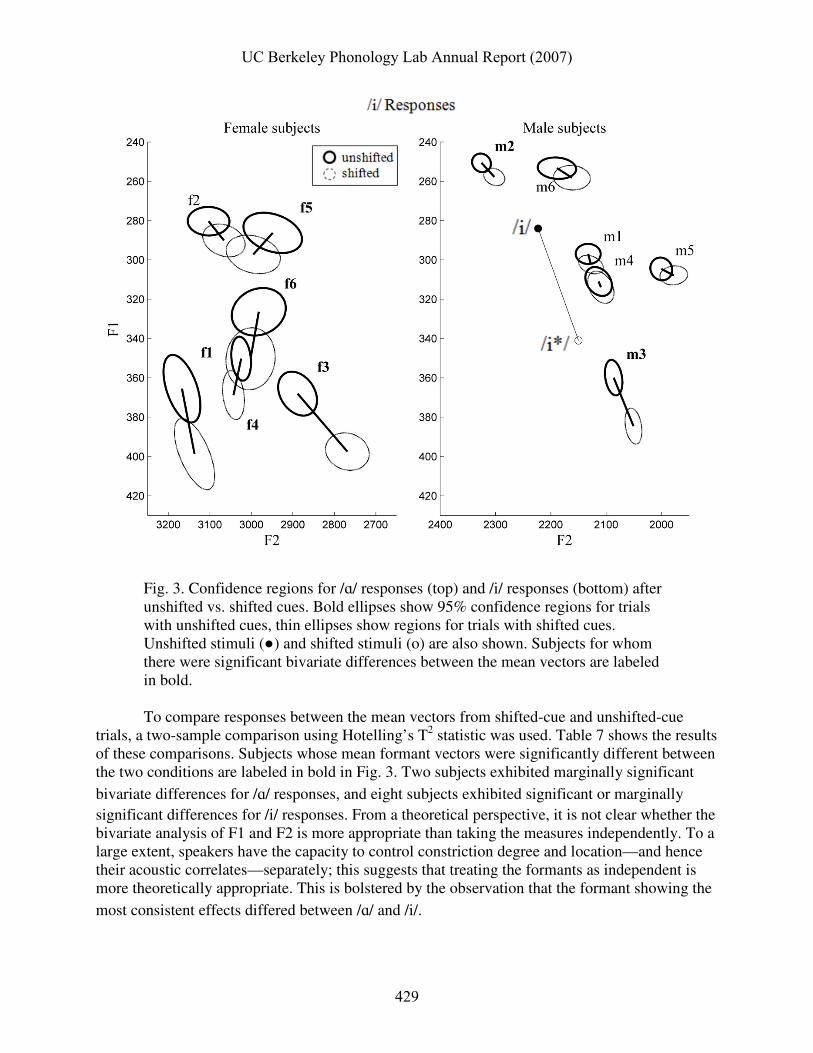
Fig. 3. Confidence regions for /ɑ/ responses (top) and /i/ responses (bottom) after unshifted vs. shifted cues. Bold ellipses show 95% confidence regions for trials with unshifted cues, thin ellipses show regions for trials with shifted cues. Unshifted stimuli (●) and shifted stimuli (o) are also shown. Subjects for whom there were significant bivariate differences between the mean vectors are labeled in bold. To compare responses between the mean vectors from shifted-cue and unshifted-cue
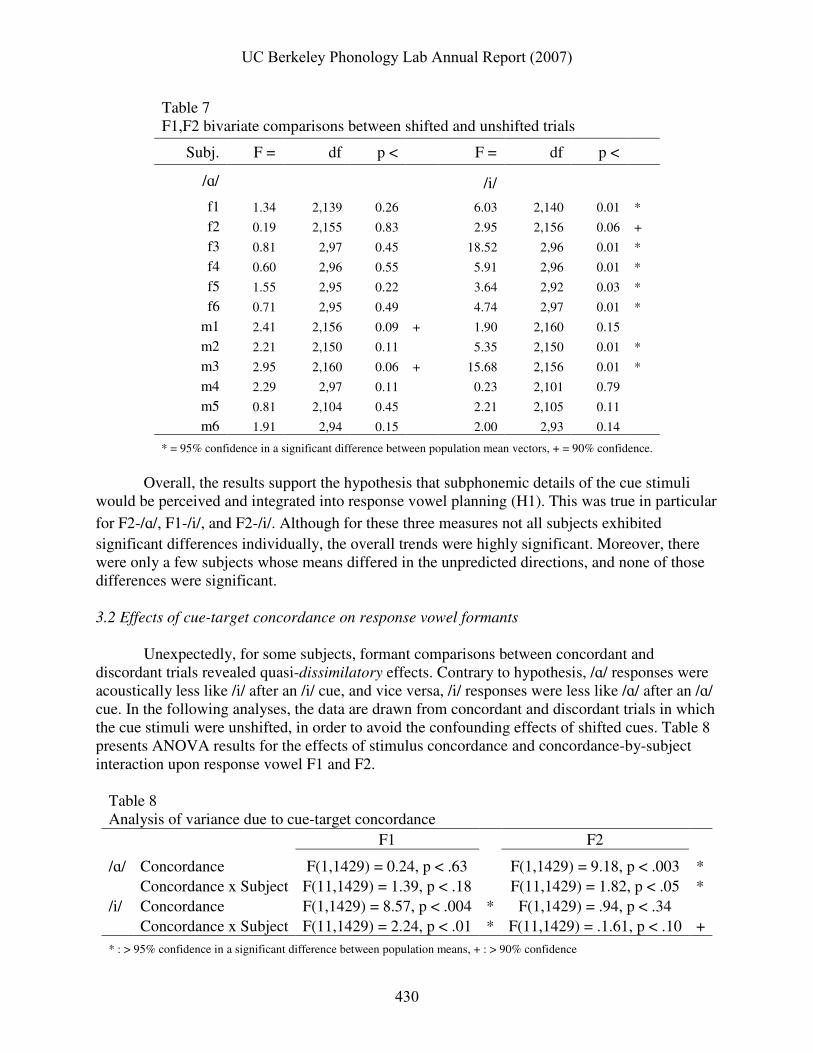
trials, a two-sample comparison using Hotelling’s T2 statistic was used. Table 7 shows the results of these comparisons. Subjects whose mean formant vectors were significantly different between the two conditions are labeled in bold in Fig. 3. Two subjects exhibited marginally significant
bivariate differences for /ɑ/ responses, and eight subjects exhibited significant or marginally significant differences for /i/ responses. From a theoretical perspective, it is not clear whether the bivariate analysis of F1 and F2 is more appropriate than taking the measures independently. To a large extent, speakers have the capacity to control constriction degree and location—and hence their acoustic correlates—separately; this suggests that treating the formants as independent is more theoretically appropriate. This is bolstered by the observation that the formant showing the
most consistent effects differed between /ɑ/ and /i/.
UC Berkeley Phonology Lab Annual Report (2007)
429
Table 7 F1,F2 bivariate comparisons between shifted and unshifted trials
Subj. F = df p < F = df p <
/ɑ/ /i/
f1 1.34 2,139 0.26 6.03 2,140 0.01 *
f2 0.19 2,155 0.83 2.95 2,156 0.06 +
f3 0.81 2,97 0.45 18.52 2,96 0.01 *
f4 0.60 2,96 0.55 5.91 2,96 0.01 *
f5 1.55 2,95 0.22 3.64 2,92 0.03 *
f6 0.71 2,95 0.49 4.74 2,97 0.01 *
m1 2.41 2,156 0.09 + 1.90 2,160 0.15
m2 2.21 2,150 0.11 5.35 2,150 0.01 *
m3 2.95 2,160 0.06 + 15.68 2,156 0.01 *
m4 2.29 2,97 0.11 0.23 2,101 0.79
m5 0.81 2,104 0.45 2.21 2,105 0.11
m6 1.91 2,94 0.15 2.00 2,93 0.14
* = 95% confidence in a significant difference between population mean vectors, + = 90% confidence. Overall, the results support the hypothesis that subphonemic details of the cue stimuli would be perceived and integrated into response vowel planning (H1). This was true in particular
for F2-/ɑ/, F1-/i/, and F2-/i/. Although for these three measures not all subjects exhibited significant differences individually, the overall trends were highly significant. Moreover, there were only a few subjects whose means differed in the unpredicted directions, and none of those differences were significant. 3.2 Effects of cue-target concordance on response vowel formants
Unexpectedly, for some subjects, formant comparisons between concordant and
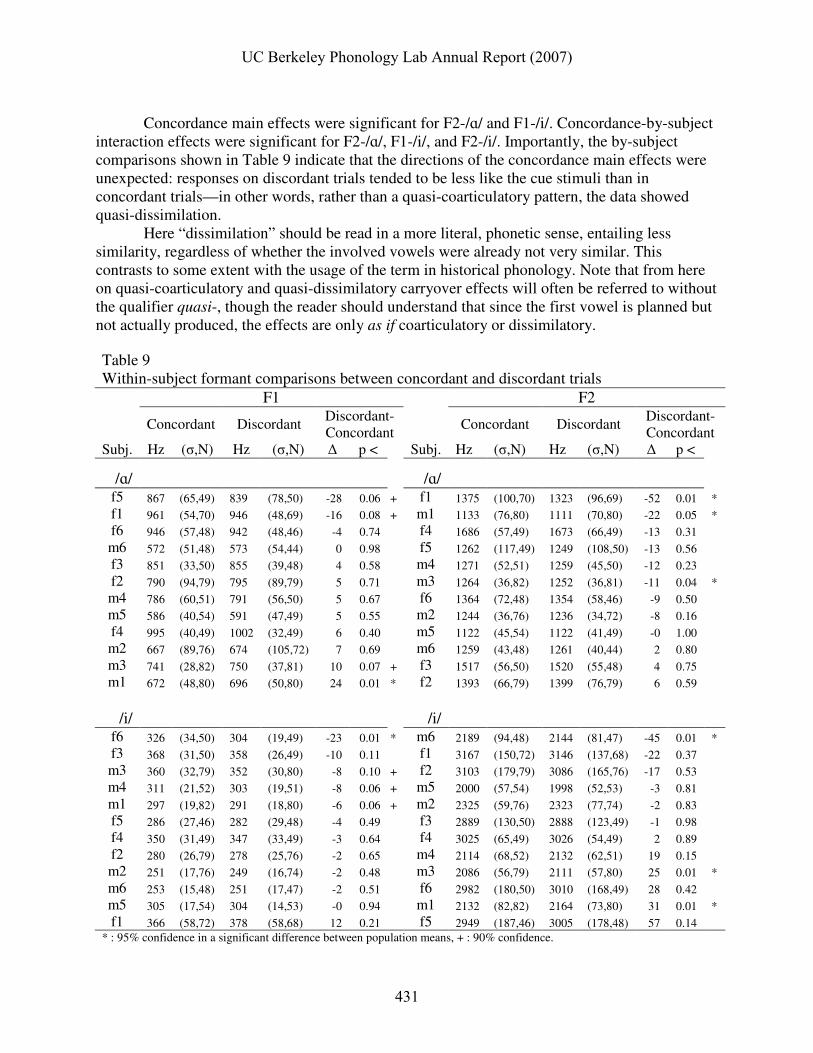
discordant trials revealed quasi-dissimilatory effects. Contrary to hypothesis, /ɑ/ responses were acoustically less like /i/ after an /i/ cue, and vice versa, /i/ responses were less like /ɑ/ after an /ɑ/ cue. In the following analyses, the data are drawn from concordant and discordant trials in which the cue stimuli were unshifted, in order to avoid the confounding effects of shifted cues. Table 8 presents ANOVA results for the effects of stimulus concordance and concordance-by-subject interaction upon response vowel F1 and F2.
Table 8 Analysis of variance due to cue-target concordance
F1 F2
/ɑ/ Concordance F(1,1429) = 0.24, p < .63 F(1,1429) = 9.18, p < .003 * Concordance x Subject F(11,1429) = 1.39, p < .18 F(11,1429) = 1.82, p < .05 *
/i/ Concordance F(1,1429) = 8.57, p < .004 * F(1,1429) = .94, p < .34 Concordance x Subject F(11,1429) = 2.24, p < .01 * F(11,1429) = .1.61, p < .10 +
* : > 95% confidence in a significant difference between population means, + : > 90% confidence
UC Berkeley Phonology Lab Annual Report (2007)
430
Concordance main effects were significant for F2-/ɑ/ and F1-/i/. Concordance-by-subject
interaction effects were significant for F2-/ɑ/, F1-/i/, and F2-/i/. Importantly, the by-subject comparisons shown in Table 9 indicate that the directions of the concordance main effects were unexpected: responses on discordant trials tended to be less like the cue stimuli than in concordant trials—in other words, rather than a quasi-coarticulatory pattern, the data showed quasi-dissimilation.
Here “dissimilation” should be read in a more literal, phonetic sense, entailing less similarity, regardless of whether the involved vowels were already not very similar. This contrasts to some extent with the usage of the term in historical phonology. Note that from here on quasi-coarticulatory and quasi-dissimilatory carryover effects will often be referred to without the qualifier quasi-, though the reader should understand that since the first vowel is planned but not actually produced, the effects are only as if coarticulatory or dissimilatory.
Table 9 Within-subject formant comparisons between concordant and discordant trials
f1 366 (58,72) 378 (58,68) 12 0.21 f5 2949 (187,46) 3005 (178,48) 57 0.14 * : 95% confidence in a significant difference between population means, + : 90% confidence.
UC Berkeley Phonology Lab Annual Report (2007)
431
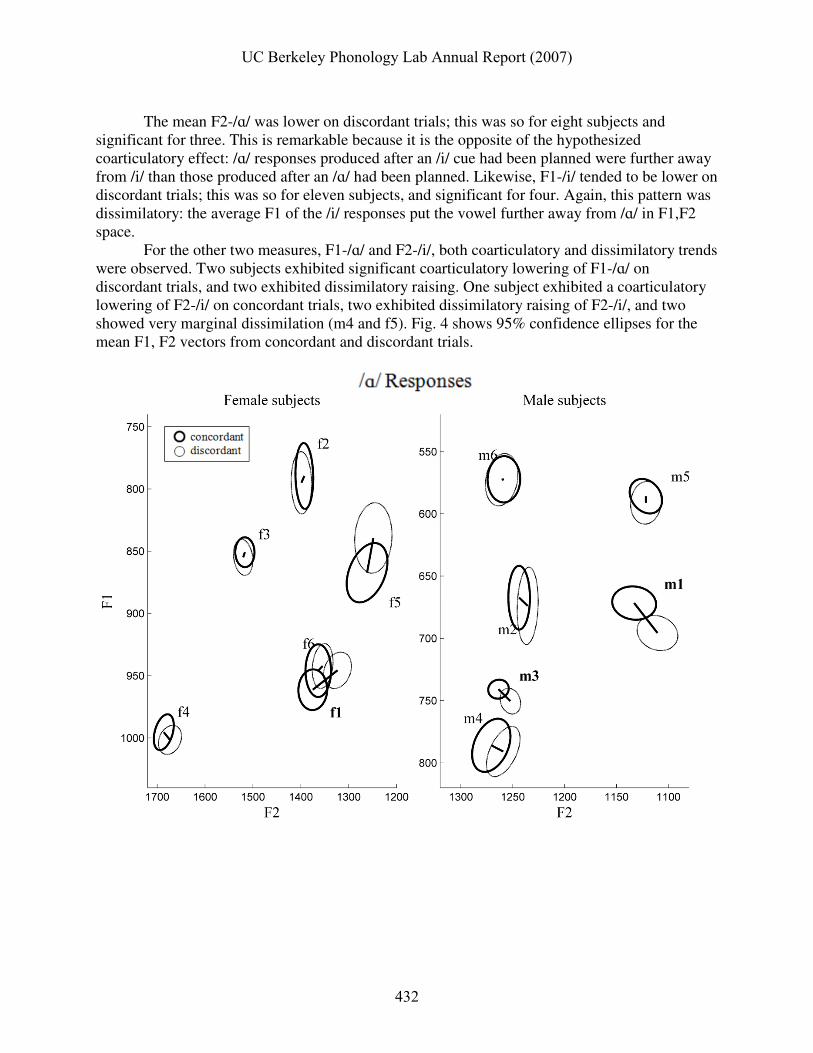
The mean F2-/ɑ/ was lower on discordant trials; this was so for eight subjects and
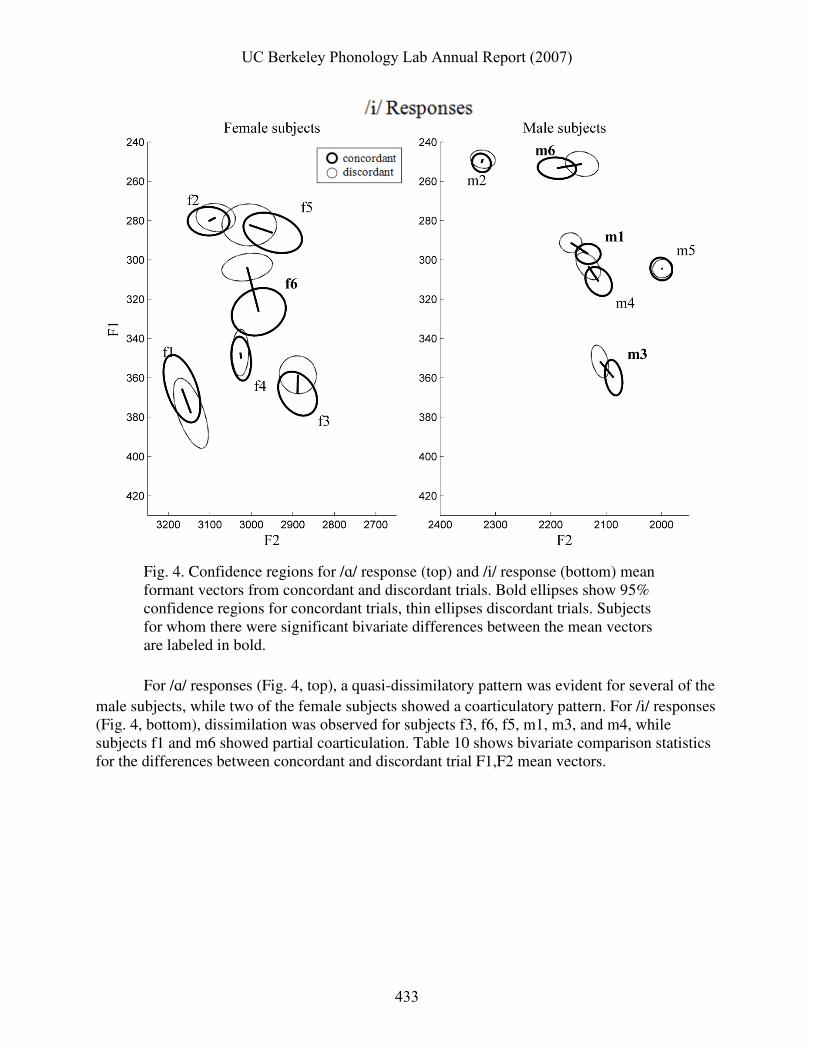
significant for three. This is remarkable because it is the opposite of the hypothesized coarticulatory effect: /ɑ/ responses produced after an /i/ cue had been planned were further away from /i/ than those produced after an /ɑ/ had been planned. Likewise, F1-/i/ tended to be lower on discordant trials; this was so for eleven subjects, and significant for four. Again, this pattern was dissimilatory: the average F1 of the /i/ responses put the vowel further away from /ɑ/ in F1,F2 space.
For the other two measures, F1-/ɑ/ and F2-/i/, both coarticulatory and dissimilatory trends were observed. Two subjects exhibited significant coarticulatory lowering of F1-/ɑ/ on discordant trials, and two exhibited dissimilatory raising. One subject exhibited a coarticulatory lowering of F2-/i/ on concordant trials, two exhibited dissimilatory raising of F2-/i/, and two showed very marginal dissimilation (m4 and f5). Fig. 4 shows 95% confidence ellipses for the mean F1, F2 vectors from concordant and discordant trials.
UC Berkeley Phonology Lab Annual Report (2007)
432
Fig. 4. Confidence regions for /ɑ/ response (top) and /i/ response (bottom) mean formant vectors from concordant and discordant trials. Bold ellipses show 95% confidence regions for concordant trials, thin ellipses discordant trials. Subjects for whom there were significant bivariate differences between the mean vectors are labeled in bold.
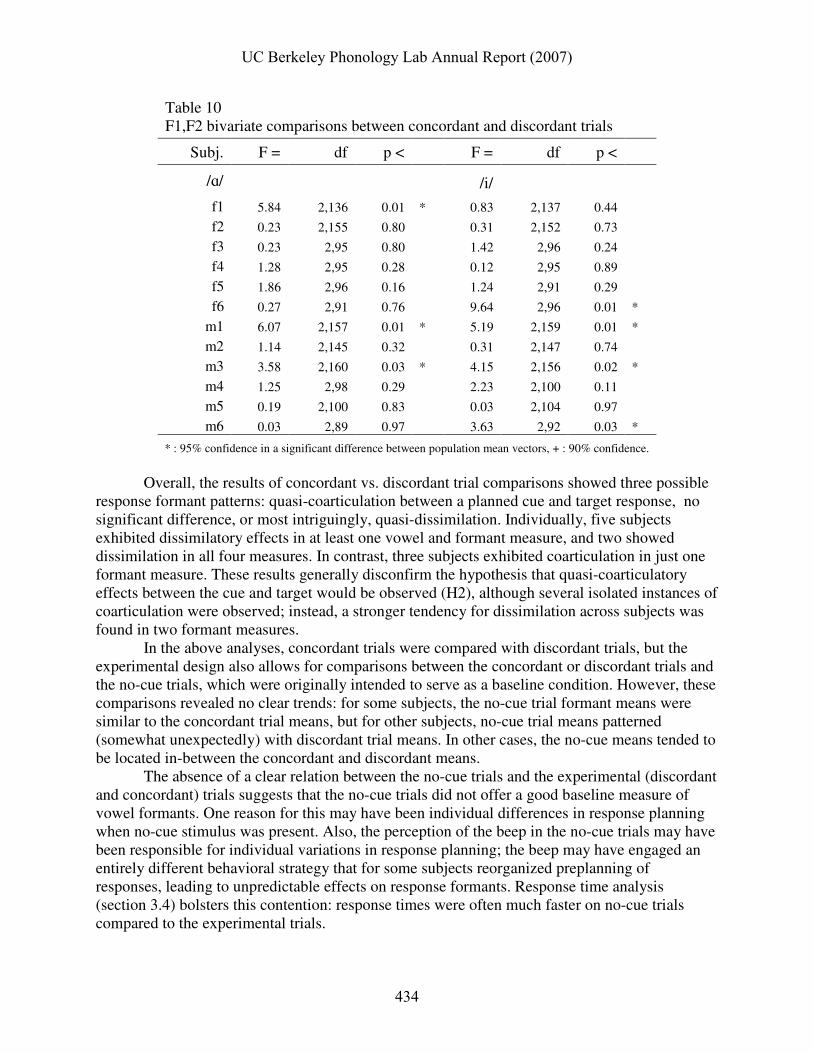
For /ɑ/ responses (Fig. 4, top), a quasi-dissimilatory pattern was evident for several of the male subjects, while two of the female subjects showed a coarticulatory pattern. For /i/ responses (Fig. 4, bottom), dissimilation was observed for subjects f3, f6, f5, m1, m3, and m4, while subjects f1 and m6 showed partial coarticulation. Table 10 shows bivariate comparison statistics for the differences between concordant and discordant trial F1,F2 mean vectors.
UC Berkeley Phonology Lab Annual Report (2007)
433
Table 10 F1,F2 bivariate comparisons between concordant and discordant trials
Subj. F = df p < F = df p <
/ɑ/ /i/
f1 5.84 2,136 0.01 * 0.83 2,137 0.44
f2 0.23 2,155 0.80 0.31 2,152 0.73
f3 0.23 2,95 0.80 1.42 2,96 0.24
f4 1.28 2,95 0.28 0.12 2,95 0.89
f5 1.86 2,96 0.16 1.24 2,91 0.29
f6 0.27 2,91 0.76 9.64 2,96 0.01 *
m1 6.07 2,157 0.01 * 5.19 2,159 0.01 *
m2 1.14 2,145 0.32 0.31 2,147 0.74
m3 3.58 2,160 0.03 * 4.15 2,156 0.02 *
m4 1.25 2,98 0.29 2.23 2,100 0.11
m5 0.19 2,100 0.83 0.03 2,104 0.97
m6 0.03 2,89 0.97 3.63 2,92 0.03 *
* : 95% confidence in a significant difference between population mean vectors, + : 90% confidence.
Overall, the results of concordant vs. discordant trial comparisons showed three possible response formant patterns: quasi-coarticulation between a planned cue and target response, no significant difference, or most intriguingly, quasi-dissimilation. Individually, five subjects exhibited dissimilatory effects in at least one vowel and formant measure, and two showed dissimilation in all four measures. In contrast, three subjects exhibited coarticulation in just one formant measure. These results generally disconfirm the hypothesis that quasi-coarticulatory effects between the cue and target would be observed (H2), although several isolated instances of coarticulation were observed; instead, a stronger tendency for dissimilation across subjects was found in two formant measures.
In the above analyses, concordant trials were compared with discordant trials, but the experimental design also allows for comparisons between the concordant or discordant trials and the no-cue trials, which were originally intended to serve as a baseline condition. However, these comparisons revealed no clear trends: for some subjects, the no-cue trial formant means were similar to the concordant trial means, but for other subjects, no-cue trial means patterned (somewhat unexpectedly) with discordant trial means. In other cases, the no-cue means tended to be located in-between the concordant and discordant means.
The absence of a clear relation between the no-cue trials and the experimental (discordant and concordant) trials suggests that the no-cue trials did not offer a good baseline measure of vowel formants. One reason for this may have been individual differences in response planning when no-cue stimulus was present. Also, the perception of the beep in the no-cue trials may have been responsible for individual variations in response planning; the beep may have engaged an entirely different behavioral strategy that for some subjects reorganized preplanning of responses, leading to unpredictable effects on response formants. Response time analysis (section 3.4) bolsters this contention: response times were often much faster on no-cue trials compared to the experimental trials.
UC Berkeley Phonology Lab Annual Report (2007)
434
3.3 Effects of interstimulus delay on response vowel formants
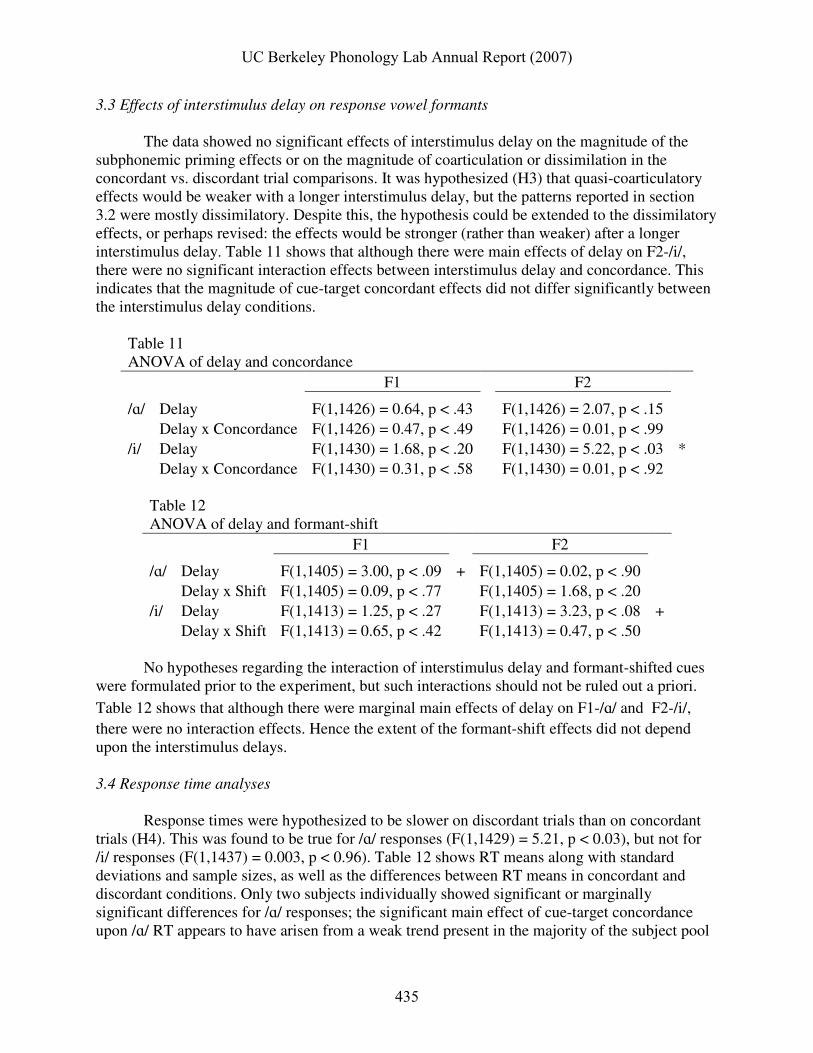
The data showed no significant effects of interstimulus delay on the magnitude of the subphonemic priming effects or on the magnitude of coarticulation or dissimilation in the concordant vs. discordant trial comparisons. It was hypothesized (H3) that quasi-coarticulatory effects would be weaker with a longer interstimulus delay, but the patterns reported in section 3.2 were mostly dissimilatory. Despite this, the hypothesis could be extended to the dissimilatory effects, or perhaps revised: the effects would be stronger (rather than weaker) after a longer interstimulus delay. Table 11 shows that although there were main effects of delay on F2-/i/, there were no significant interaction effects between interstimulus delay and concordance. This indicates that the magnitude of cue-target concordant effects did not differ significantly between the interstimulus delay conditions.
Table 11 ANOVA of delay and concordance
F1 F2
/ɑ/ Delay F(1,1426) = 0.64, p < .43 F(1,1426) = 2.07, p < .15 Delay x Concordance F(1,1426) = 0.47, p < .49 F(1,1426) = 0.01, p < .99
/i/ Delay F(1,1430) = 1.68, p < .20 F(1,1430) = 5.22, p < .03 * Delay x Concordance F(1,1430) = 0.31, p < .58 F(1,1430) = 0.01, p < .92
Table 12 ANOVA of delay and formant-shift
F1 F2
/ɑ/ Delay F(1,1405) = 3.00, p < .09 + F(1,1405) = 0.02, p < .90 Delay x Shift F(1,1405) = 0.09, p < .77 F(1,1405) = 1.68, p < .20
/i/ Delay F(1,1413) = 1.25, p < .27 F(1,1413) = 3.23, p < .08 + Delay x Shift F(1,1413) = 0.65, p < .42 F(1,1413) = 0.47, p < .50
No hypotheses regarding the interaction of interstimulus delay and formant-shifted cues
were formulated prior to the experiment, but such interactions should not be ruled out a priori.
Table 12 shows that although there were marginal main effects of delay on F1-/ɑ/ and F2-/i/, there were no interaction effects. Hence the extent of the formant-shift effects did not depend upon the interstimulus delays. 3.4 Response time analyses
Response times were hypothesized to be slower on discordant trials than on concordant trials (H4). This was found to be true for /ɑ/ responses (F(1,1429) = 5.21, p < 0.03), but not for /i/ responses (F(1,1437) = 0.003, p < 0.96). Table 12 shows RT means along with standard deviations and sample sizes, as well as the differences between RT means in concordant and discordant conditions. Only two subjects individually showed significant or marginally significant differences for /ɑ/ responses; the significant main effect of cue-target concordance upon /ɑ/ RT appears to have arisen from a weak trend present in the majority of the subject pool
UC Berkeley Phonology Lab Annual Report (2007)
435
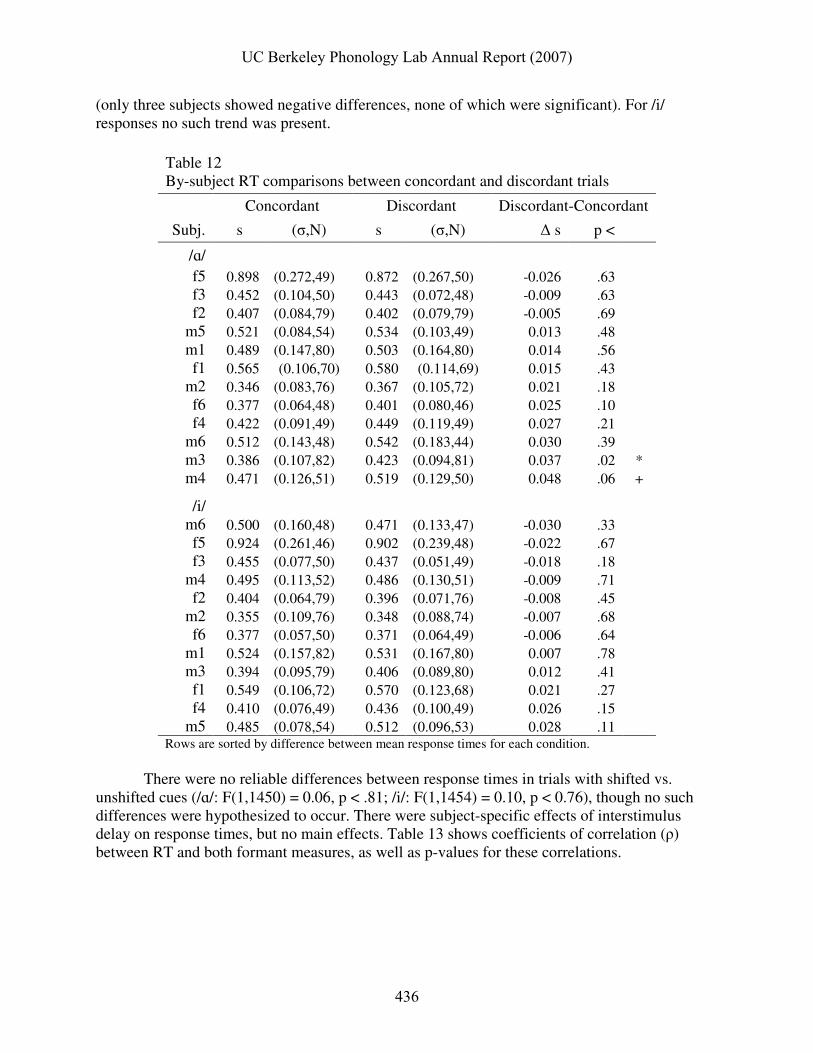
(only three subjects showed negative differences, none of which were significant). For /i/ responses no such trend was present.
Table 12 By-subject RT comparisons between concordant and discordant trials
m5 0.485 (0.078,54) 0.512 (0.096,53) 0.028 .11 Rows are sorted by difference between mean response times for each condition.
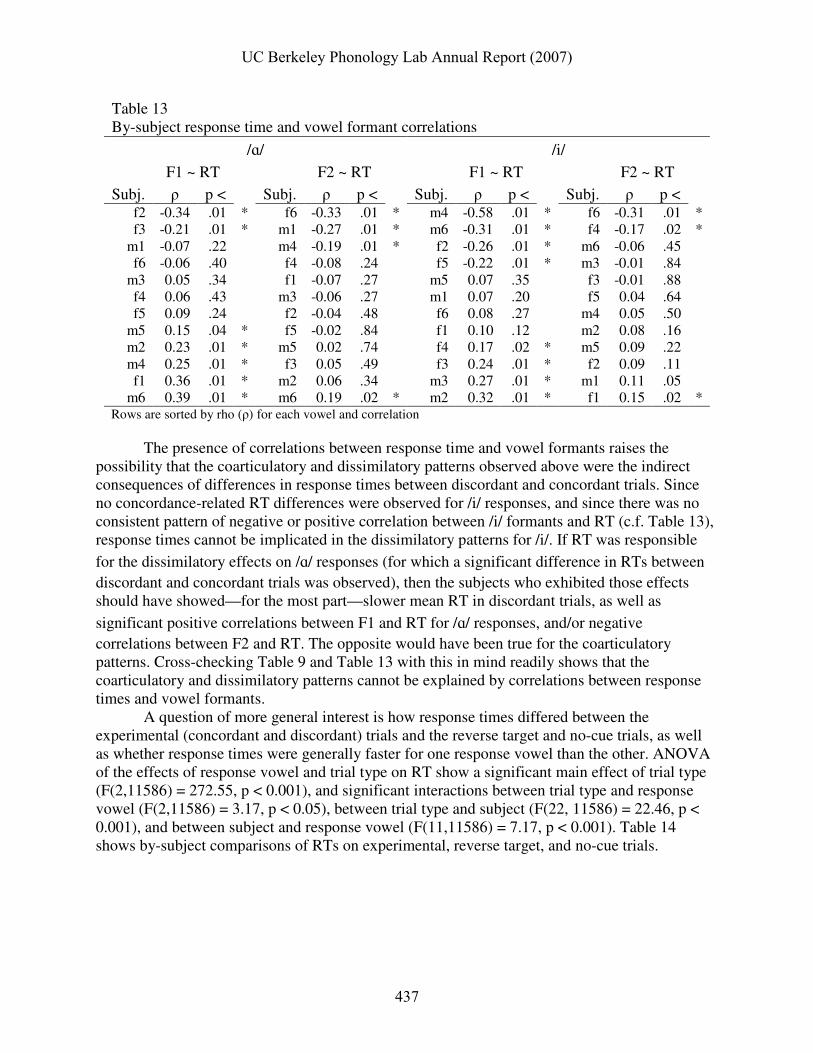
There were no reliable differences between response times in trials with shifted vs. unshifted cues (/ɑ/: F(1,1450) = 0.06, p < .81; /i/: F(1,1454) = 0.10, p < 0.76), though no such differences were hypothesized to occur. There were subject-specific effects of interstimulus delay on response times, but no main effects. Table 13 shows coefficients of correlation (ρ) between RT and both formant measures, as well as p-values for these correlations.
UC Berkeley Phonology Lab Annual Report (2007)
436
Table 13 By-subject response time and vowel formant correlations
m6 0.39 .01 * m6 0.19 .02 * m2 0.32 .01 * f1 0.15 .02 * Rows are sorted by rho (ρ) for each vowel and correlation
The presence of correlations between response time and vowel formants raises the
possibility that the coarticulatory and dissimilatory patterns observed above were the indirect consequences of differences in response times between discordant and concordant trials. Since no concordance-related RT differences were observed for /i/ responses, and since there was no consistent pattern of negative or positive correlation between /i/ formants and RT (c.f. Table 13), response times cannot be implicated in the dissimilatory patterns for /i/. If RT was responsible
for the dissimilatory effects on /ɑ/ responses (for which a significant difference in RTs between discordant and concordant trials was observed), then the subjects who exhibited those effects should have showed—for the most part—slower mean RT in discordant trials, as well as
significant positive correlations between F1 and RT for /ɑ/ responses, and/or negative correlations between F2 and RT. The opposite would have been true for the coarticulatory patterns. Cross-checking Table 9 and Table 13 with this in mind readily shows that the coarticulatory and dissimilatory patterns cannot be explained by correlations between response times and vowel formants.
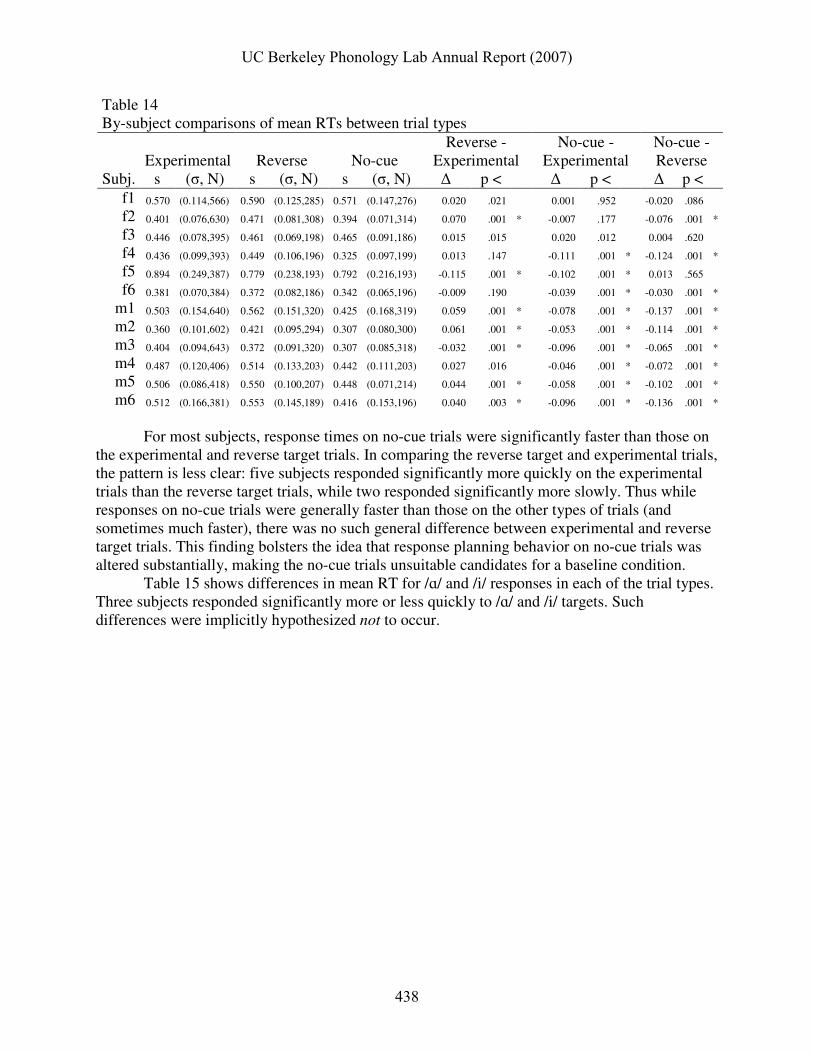
A question of more general interest is how response times differed between the experimental (concordant and discordant) trials and the reverse target and no-cue trials, as well as whether response times were generally faster for one response vowel than the other. ANOVA of the effects of response vowel and trial type on RT show a significant main effect of trial type (F(2,11586) = 272.55, p < 0.001), and significant interactions between trial type and response vowel (F(2,11586) = 3.17, p < 0.05), between trial type and subject (F(22, 11586) = 22.46, p < 0.001), and between subject and response vowel (F(11,11586) = 7.17, p < 0.001). Table 14 shows by-subject comparisons of RTs on experimental, reverse target, and no-cue trials.
UC Berkeley Phonology Lab Annual Report (2007)
437
Table 14 By-subject comparisons of mean RTs between trial types
Experimental Reverse No-cue Reverse -
Experimental No-cue -
Experimental No-cue - Reverse
Subj. s (σ, N) s (σ, N) s (σ, N) ∆ p < ∆ p < ∆ p < f1 0.570 (0.114,566) 0.590 (0.125,285) 0.571 (0.147,276) 0.020 .021 0.001 .952 -0.020 .086
For most subjects, response times on no-cue trials were significantly faster than those on
the experimental and reverse target trials. In comparing the reverse target and experimental trials, the pattern is less clear: five subjects responded significantly more quickly on the experimental trials than the reverse target trials, while two responded significantly more slowly. Thus while responses on no-cue trials were generally faster than those on the other types of trials (and sometimes much faster), there was no such general difference between experimental and reverse target trials. This finding bolsters the idea that response planning behavior on no-cue trials was altered substantially, making the no-cue trials unsuitable candidates for a baseline condition.
Table 15 shows differences in mean RT for /ɑ/ and /i/ responses in each of the trial types. Three subjects responded significantly more or less quickly to /ɑ/ and /i/ targets. Such differences were implicitly hypothesized not to occur.
UC Berkeley Phonology Lab Annual Report (2007)
438
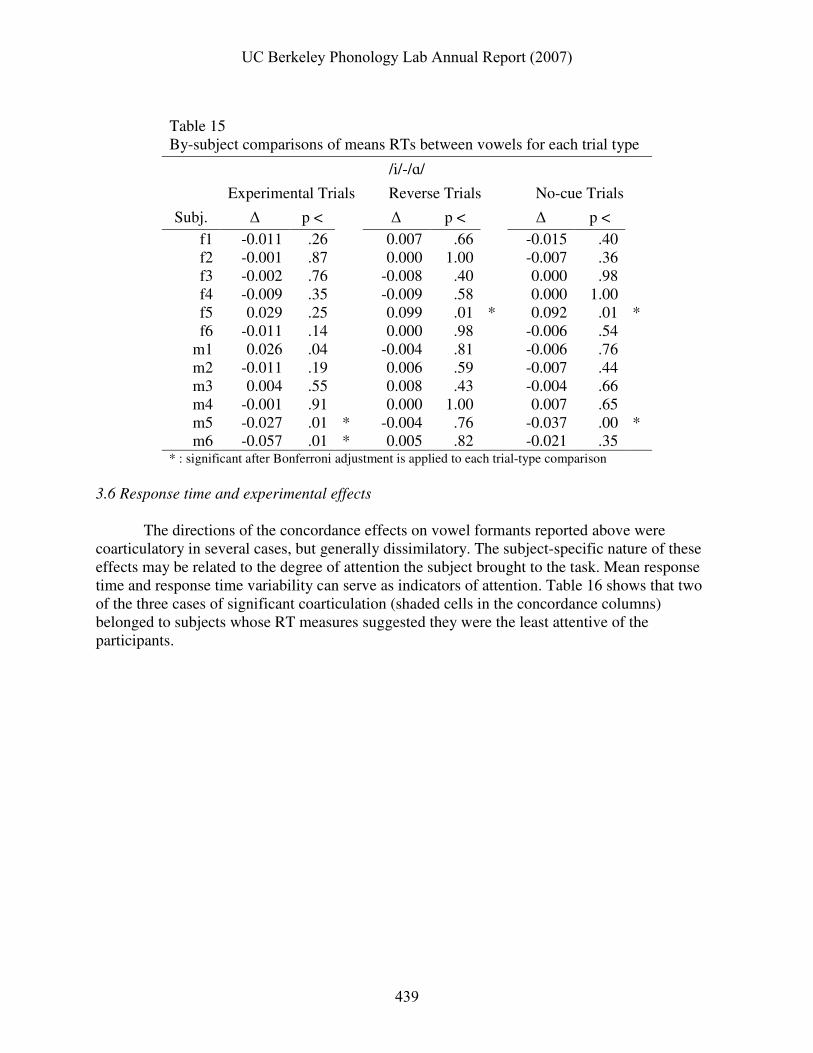
Table 15 By-subject comparisons of means RTs between vowels for each trial type
* : significant after Bonferroni adjustment is applied to each trial-type comparison
3.6 Response time and experimental effects
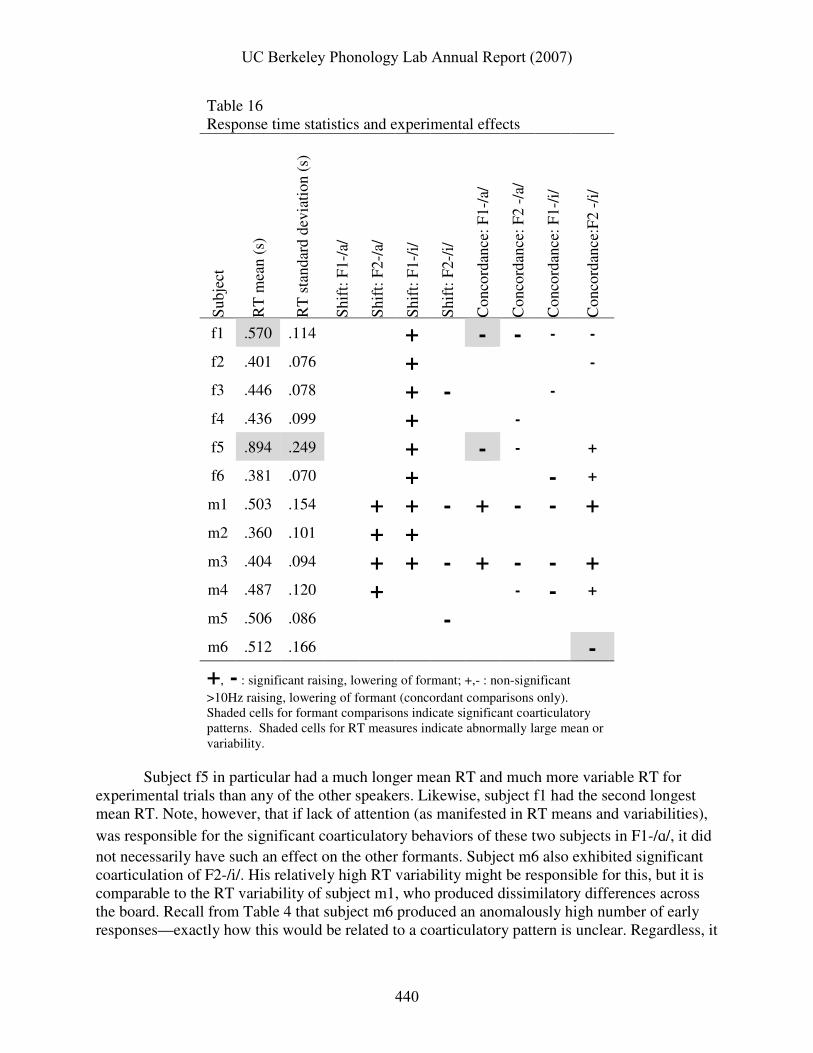
The directions of the concordance effects on vowel formants reported above were coarticulatory in several cases, but generally dissimilatory. The subject-specific nature of these effects may be related to the degree of attention the subject brought to the task. Mean response time and response time variability can serve as indicators of attention. Table 16 shows that two of the three cases of significant coarticulation (shaded cells in the concordance columns) belonged to subjects whose RT measures suggested they were the least attentive of the participants.
UC Berkeley Phonology Lab Annual Report (2007)
439
Table 16 Response time statistics and experimental effects
Sub
ject
RT
mea
n (s
)
RT
sta
ndar
d de
viat
ion
(s)
Shi
ft:
F1 -
/a/
Shi
ft:
F2 -
/a/
Shi
ft:
F1 -
/i/
Shi
ft:
F2 -
/i/
Con
cord
ance
: F
1 -/a
/
Con
cord
ance
: F
2 -/
a/
Con
cord
ance
: F
1 -/i
/
Con
cord
ance
:F2
-/i/
f1 .570 .114
+
- - - -
f2 .401 .076
+
-
f3 .446 .078
+ -
-
f4 .436 .099
+
-
f5 .894 .249
+
- -
+
f6 .381 .070
+
- +
m1 .503 .154
+ + - + - - + m2 .360 .101
+ +
m3 .404 .094
+ + - + - - +
m4 .487 .120
+
- - +
m5 .506 .086
-
m6 .512 .166
-
+, - : significant raising, lowering of formant; +,- : non-significant >10Hz raising, lowering of formant (concordant comparisons only). Shaded cells for formant comparisons indicate significant coarticulatory patterns. Shaded cells for RT measures indicate abnormally large mean or variability.
Subject f5 in particular had a much longer mean RT and much more variable RT for experimental trials than any of the other speakers. Likewise, subject f1 had the second longest mean RT. Note, however, that if lack of attention (as manifested in RT means and variabilities),
was responsible for the significant coarticulatory behaviors of these two subjects in F1-/ɑ/, it did not necessarily have such an effect on the other formants. Subject m6 also exhibited significant coarticulation of F2-/i/. His relatively high RT variability might be responsible for this, but it is comparable to the RT variability of subject m1, who produced dissimilatory differences across the board. Recall from Table 4 that subject m6 produced an anomalously high number of early responses—exactly how this would be related to a coarticulatory pattern is unclear. Regardless, it
UC Berkeley Phonology Lab Annual Report (2007)
440
is highly intriguing that the only three significant examples of coarticulation belonged to subjects who showed slower, more variable RT or anomalous response behavior. 3.7 Summary of results
To recap, of the four hypotheses presented in section 1.3, only (H1) was supported by the data. (H2) and (H3) were not supported, and (H4) was only partly supported by the data:
H1. Subphonemic perceptual-motor integration: on concordant trials, F2-/ɑ/, F1-/i/, and F2-/i/ tended to reflect the acoustic qualities of the cue stimuli, indicating that the sub-phonemic differences in the cue stimuli were perceived and integrated into vowel targets. *!H2. Carryover quasi-coarticulation: response vowels on discordant trials showed significant coarticulatory tendencies for only three subject-vowel-formant combinations, and no general coarticulatory effects held across the subjects. In comparison, there were significant dissimilatory tendencies for ten subject-vowel-formant combinations, and significant trends
across the subject population for F2-/ɑ/ and F1-/i/. *H3. Temporal decay of carryover coarticulatory effects: the limited coarticulatory effects and more widespread dissimilatory effects were neither greater or lesser in magnitude in the 800 ms delay condition compared to the 100 ms condition.
(*)H4. Response times reflect the extent of pre-planning: for /ɑ/ responses, there was a trend for response times to be longer on discordant trials relative to concordant trials, presumably reflecting more extensive preplanning of the response on concordant trials. Perplexingly, no such trend was observed for /i/ responses.
4. Analysis
The goal of this section is to develop a model to account for several of the key findings in the previous section. The model will account for subphonemic priming effects, provide for both coarticulatory and dissimilatory patterns, and explain the lack of an effect of interstimulus delay. On the way to this goal we will examine findings in oculomotor and reaching studies that are analogous to quasi-dissimilation, and which suggest that this pattern is caused by inhibition between the systems associated with planning of vowel responses.
4.1 Response probabilities and planning
Consider the experimental trials from an information-theoretic standpoint, with regard to predicting what the required response vowel will be at various stages of an experimental trial. At the beginning of each trial, before the cue is known, the probabilities of either response being the required one are equal (i.e. p{/ɑ/} = p{/i/} = 0.5). Then, when the cue stimulus is a vowel, the expectations change. For example, given a cue of /ɑ/, the probability of /ɑ/ being the required response increases: p{ /ɑ/ | CUE:/ɑ/ } = 2/3, and the probability of an /i/ response being required decreases: p{ /i/ | CUE:/ɑ/ } = 1/3. This shift in expectations follows from the parameters of the
UC Berkeley Phonology Lab Annual Report (2007)
441
experimental design: when the cue is a vowel, there is an equal probability of the target stimulus being /i/, /ɑ/, or a beep, and because the beep requires production of the cue stimulus, an /ɑ/ cue makes a required response of /ɑ/ twice as likely as /i/. How might these probabilities affect the behavior of subjects? It is reasonable to assert that subjects plan the cue vowel to a greater extent than the noncue vowel, if several assumptions are made. First, subjects are presumably attentive and motivated to respond quickly. Second, after some experience with the task, their pre-cue and post-cue expectations approximately reflect the theoretical values. Third, subjects prepare potential responses to extents that minimize their response times across trials. Given these assumptions, it follows that after hearing the cue, subjects have prepared the cue vowel to a greater extent than the non-cue vowel. Each of these three assumptions may have been violated in some way. Regarding the first, subjects might have been unmotivated to respond quickly. Such lack of motivation would have been apparent in relatively slow response times or greater variability in response time (c.f. Table 14, 16). Only subject f5 exhibited response times and variabilities that, relative to the other subjects, suggest a lack of attention or motivation—but not clearly so. Subject m6 produced an anomalously high number of early responses, perhaps indicating inattentiveness, but his response times were not abnormally long. Subject f1 also had relatively slow response times. The remainder of the subjects exhibited no signs of failing to respond quickly. Whether the second and third assumptions are justified is more difficult to address with the experimental measures. That subjects developed sufficiently accurate expectations about the pre-cue and post-cue probabilities for both vowel responses, and that these expectations were incorporated into response planning, can be indirectly checked if another assumption is made: response time for a given vowel reflects the extent to which that vowel response has been planned. This predicts that response times to /ɑ/ and /i/ should not have differed significantly within a given type of trial. Table 15 showed that there were only four instances in which this prediction was violated: subject f5 produced /ɑ/ responses significantly more quickly in reverse and no-cue trials, m5 produced /i/ responses more quickly in no-cue and experimental trials, and m6 produced /i/ responses more quickly in experimental trials. This might be interpreted as evidence that these subjects violated the second assumption. It may be no coincidence that f5 and m6 also had other response time anomalies (an outlying mean RT and an abnormal number of early responses, respectively), and were two of the three subjects who showed a significant coarticulatory effect in one measure. 4.2 Movement planning and response deviations
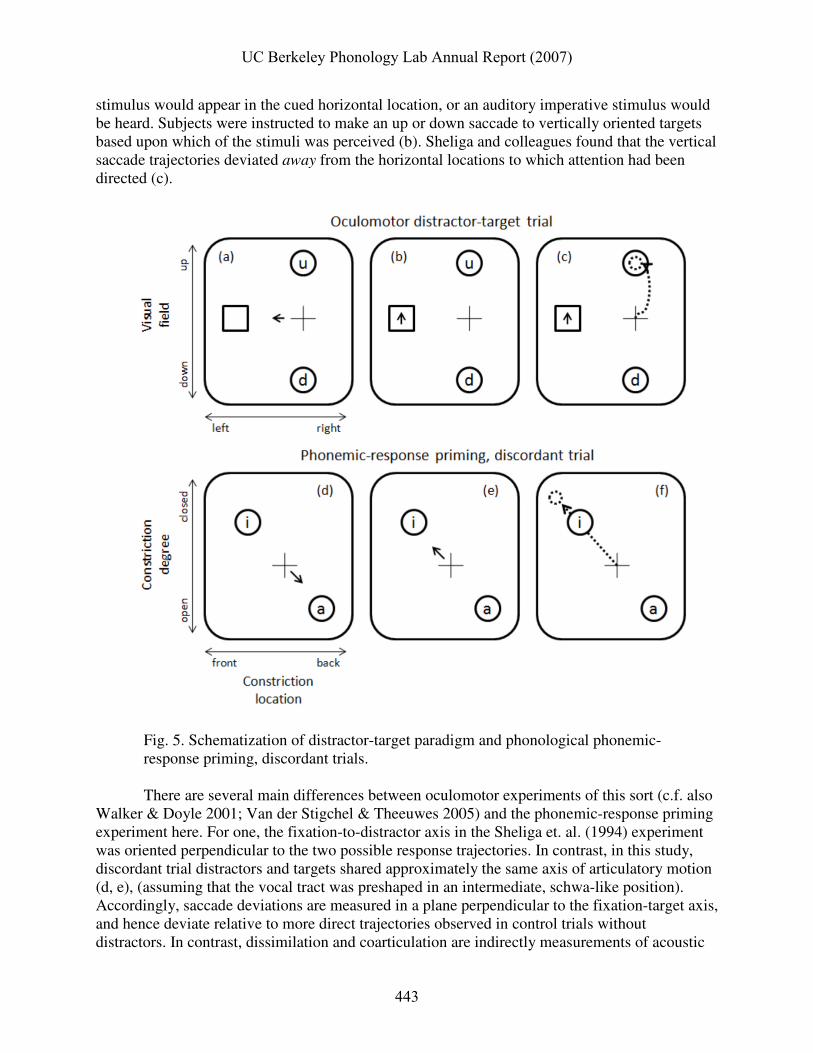
Vowel-to-vowel quasi-dissimilation in the phonemic-response priming task, although surprising from a linguistic perspective, may be entirely expected from the results of similar studies in ocular and manual domains of motor behavior. One vein of research in these areas employs “distractor-target” paradigms in which a goal-directed movement is perturbed by diverting attention prior to or during the movement. Sheliga et. al. (1994) reported results from several experiments on the trajectories of eye movements (saccades) which provide a nice basis for understanding the dissimilatory patterns in the present experiment. Fig. 5 details several stages in a trial of one such experiment. At the beginning of each trial, subjects first fixated on a central location on a screen, and then were directed to attend to a horizontally-oriented location in the peripheral visual field without relocating their fixation (a). Then one of two things would occur: either a visual imperative
UC Berkeley Phonology Lab Annual Report (2007)
442
stimulus would appear in the cued horizontal location, or an auditory imperative stimulus would be heard. Subjects were instructed to make an up or down saccade to vertically oriented targets based upon which of the stimuli was perceived (b). Sheliga and colleagues found that the vertical saccade trajectories deviated away from the horizontal locations to which attention had been directed (c).
Fig. 5. Schematization of distractor-target paradigm and phonological phonemic-response priming, discordant trials.
There are several main differences between oculomotor experiments of this sort (c.f. also
Walker & Doyle 2001; Van der Stigchel & Theeuwes 2005) and the phonemic-response priming experiment here. For one, the fixation-to-distractor axis in the Sheliga et. al. (1994) experiment was oriented perpendicular to the two possible response trajectories. In contrast, in this study, discordant trial distractors and targets shared approximately the same axis of articulatory motion (d, e), (assuming that the vocal tract was preshaped in an intermediate, schwa-like position). Accordingly, saccade deviations are measured in a plane perpendicular to the fixation-target axis, and hence deviate relative to more direct trajectories observed in control trials without distractors. In contrast, dissimilation and coarticulation are indirectly measurements of acoustic
UC Berkeley Phonology Lab Annual Report (2007)
443
target overshoot or undershoot, which is a deviation of articulatory movement amplitude rather than a deviation of trajectory perpendicular to the main axis of motion. Despite these dissimilarities, there are suggestive similarities between the results observed in these experiments.
The premotor theory of attention (Rizzolatti 1983) holds that the mechanisms of visual attention involve some of the same neural populations as those of saccade and reach planning; this theory has been used to understand saccade and reaching trajectory deviations away from distractors. It follows from the theory that attention to the location of a distractor stimulus entails the planning of a saccade and reach to that location. Deviation away from a distractor (attended location) is held by some theorists to result from the “selective inhibition” of motor plans associated with a saccade or reach to the distractor (Houghton & Tipper 1994; Tipper and Houghton 1996; Tipper, Howard, and Houghton 1999). In this approach, movement targets are determined from the integrated activity of overlapping populations of neurons. The basic idea behind selective inhibition is that in order to saccade to or reach for a target, movement plans to competing targets must be selectively inhibited. Furthermore, more salient distractors evoke stronger selective inhibition. Strong inhibition of the population encoding the planning of a distractor response can thus shift the target response further away from the distractor, because their populations overlap to some extent:
Because each neuron’s activity is broadly tuned, each cell will contribute to a variety of reaches. Thus, when two objects are present that both evoke reaches, the cell activities coding their directions can overlap, that is, some cells will be activated by both reaches. Inhibitory selection of one reach over the other may shift the population distribution in such a way that it affects the final reach to a target (Tipper, Howard, and Houghton 1999: 226). If some version of the premotor theory of attention applies to speech movements, then
there exists a partial analogy between oculomotor and reaching trajectory deviations away from distractors and the dissimilatory patterns in the phonemic-response priming task. The basic correspondence is this: just as saccades and reaches towards the distractors are planned and inhibited, the cue vowel response is planned and, in discordant trials, inhibited. Assuming there exists some overlap between the neural populations encoding the cue and non-cue response targets, then inhibition of the cue response would shift the articulatory target further away from the cue, causing dissimilation. The subphonemic priming effects of the cue stimuli also have analogues in oculomotor and reaching studies. Van der Stigchel & Theeuwes (2006) cite a number of oculomotor studies in which deviations toward distractors occur when distractor and target are located close enough together (e.g. 20° to 30° of the visual field). Saccade endpoints in these cases are usually in-between the target and distractor stimulus. Ghez et. al. (1997) have reported similar findings for manual reaching. To model such findings, Tipper, Howard, & Houghton (1999) hold that when the distractor is relatively weak or located close to the target, no selective inhibition occurs and the response will be a compromise between the target and distractor. Erlhagen and Schöner (2002) present a dynamical field model capable of producing this result, in which multiple responses are represented by distributions of activity in a movement-planning field; when the distributions are close enough, they are both integrated into the response.
UC Berkeley Phonology Lab Annual Report (2007)
444
The model that I will develop to describe subphonemic priming, coarticulatory, and dissimilatory effects in the phonemic-response priming task is based on a conceptual integration of the excitatory and inhibitory mechanisms of response selection discussed in Tipper & Houghton (1996) and Tipper, Howard, & Houghton (1999), and the dynamic field model of movement planning described by Erlhagen and Schöner (2002). This conceptual integration involves the combination of a selective inhibition mechanism with a continuous activation field framework. The continuous field equation can be interpreted as an approximation of a cortical population of broadly-tuned neurons, with excitatory and inhibitory connections, in which relevant movement parameters are associated with separate dimensions of a space. The field approximation is useful in creating a low-dimensional model of various phenomena. 4.3 Vowel planning space and the planning activation field.
A useful way of modeling the quasi-coarticulatory and quasi-dissimilatory patterns begins with the postulation of two abstract vowel-specific spaces, a perception space and a planning space. For illustrative purposes, the spaces will be modeled here as two-dimensional, but presumably the results can be extended to higher-dimensional spaces. The perceptual space can be defined in acoustic coordinates that correspond to F1 and F2, and the motor-planning space can be defined in either vocal tract coordinates that represent constriction degree and location or articulatory coordinates of tongue height and frontness/backness. We can for purposes of simplicity pretend that the coordinates are linear and the spaces are uniform, with the understanding that a more realistic model would introduce nonlinearities. In addition, a mapping between the perceptual and motor-planning spaces provides a way for the two spaces to interact. The mapping need not be specified in detail for our purposes here, but one must be assumed to exist. The interaction of these spaces corresponds to the function of premotor-temporal/parietal mirror systems in which perception of an intentional gesture (e.g. a vowel) evokes premotor simulation of the same gesture (Rizzolatti & Arbib 1998; Gallese & Lakoff 2005). This interaction is crucial for explaining the effects of subphonemic (i.e. subcategorical) priming. The idea that perception of a speech gesture relies on some of the same cognitive systems as the production of that gesture is the hallmark of any motor theory of speech perception (Liberman & Mattingly 1985).
The workhorses of the model are two separate scalar fields, each defined over every point in their respective perceptual and motor spaces. The values of the scalar fields are activations, which are energy-like quantities that can be thought of as neural potentials. Activation is interpreted differently depending upon which space is being considered: in the perceptual space, it represents the extent to which a given F1,F2 combination is perceived or attended to, and in the planning space, it represents the extent to which a given vocal tract or articulatory target is being planned. Smooth activation functions can be defined over both spaces at every instant in time. These functions can be used to visualize how phenomena such as subphonemic priming, coarticulation, and dissimilation may arise. For convenience, I will refer to this model as a field
model of speech perception and production, or simply the field model (i.e. the one discussed here). As with almost all models of speech production, we must invoke an “intention” to initiate a given categorical action. Intention should be thought of not as the conscious, willed act of an agent, but rather, as the spontaneous emergence of collective dynamics in prefrontal neural populations, arising from a complex interplay of brain-internal and external systems. In other
UC Berkeley Phonology Lab Annual Report (2007)
445
words, intention is not “intentional” in the colloquial sense of the word. The important role of intention in the field model is to excite and inhibit regions of vowel planning space that correspond to phonemic targets. The integration of excitation and inhibition constitutes the activation field, which describes how activation is distributed in the vowel-planning space from an arbitrary initial time to an arbitrary end time. Intentional excitation and inhibition can be associated with lexical and/or phonological representations—the representations should be thought of as specifications of distributions of excitation and inhibition.
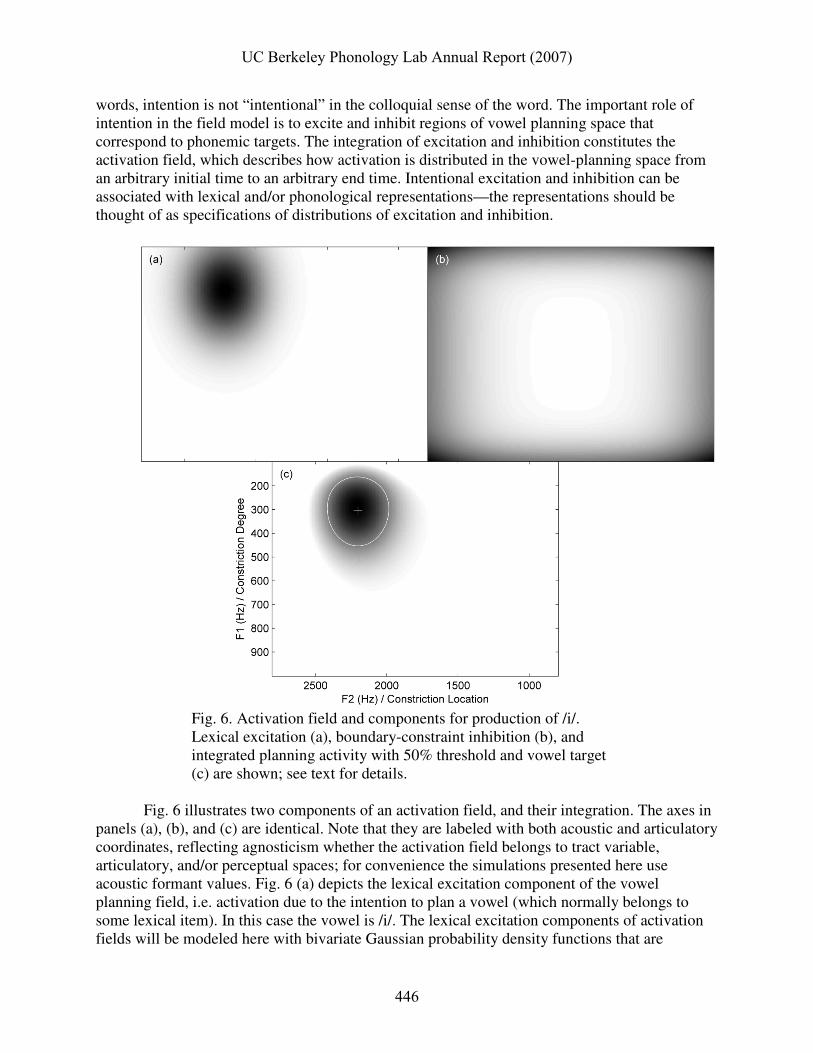
Fig. 6. Activation field and components for production of /i/. Lexical excitation (a), boundary-constraint inhibition (b), and integrated planning activity with 50% threshold and vowel target (c) are shown; see text for details.
Fig. 6 illustrates two components of an activation field, and their integration. The axes in
panels (a), (b), and (c) are identical. Note that they are labeled with both acoustic and articulatory coordinates, reflecting agnosticism whether the activation field belongs to tract variable, articulatory, and/or perceptual spaces; for convenience the simulations presented here use acoustic formant values. Fig. 6 (a) depicts the lexical excitation component of the vowel planning field, i.e. activation due to the intention to plan a vowel (which normally belongs to some lexical item). In this case the vowel is /i/. The lexical excitation components of activation fields will be modeled here with bivariate Gaussian probability density functions that are
UC Berkeley Phonology Lab Annual Report (2007)
446
modulated by a time-dependent driving function. There is no a priori reason for choosing a bivariate Gaussian rather than any number of other functions that could accomplish the same purpose. The main advantages of using bivariate Gaussians are the relatively few parameters needed to characterize them, the ease of extending them to higher-dimensional spaces, and the general familiarity with and widespread use of them.
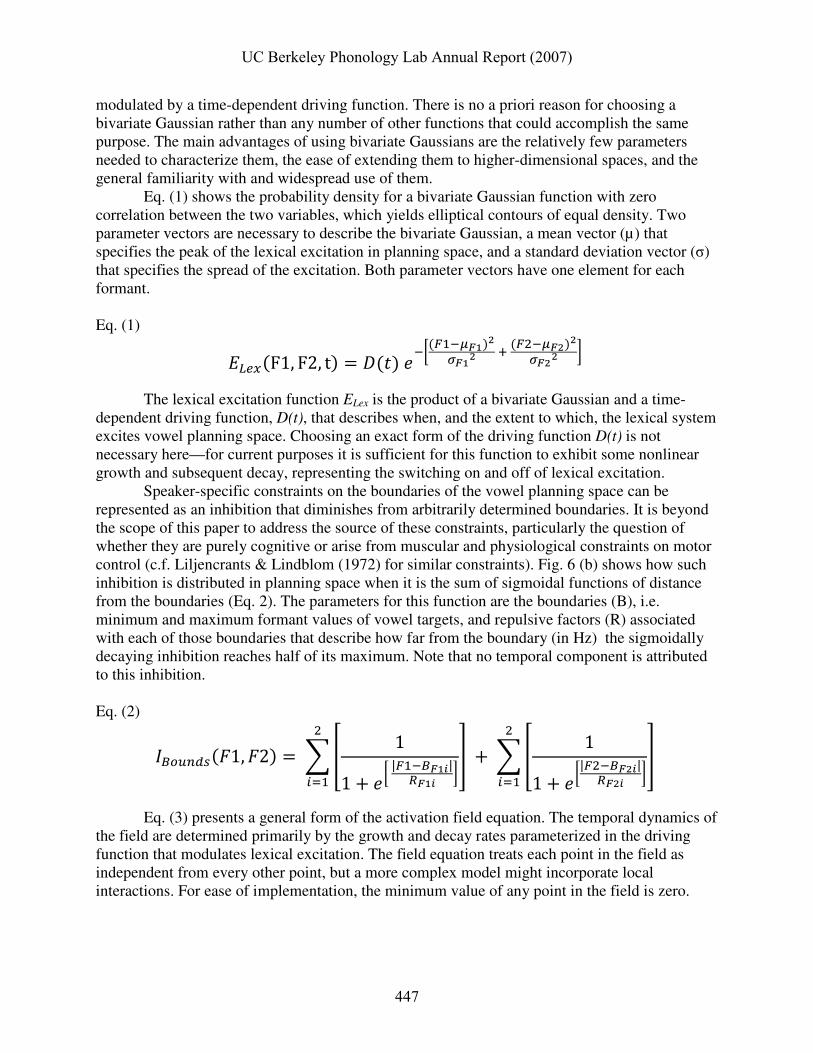
Eq. (1) shows the probability density for a bivariate Gaussian function with zero correlation between the two variables, which yields elliptical contours of equal density. Two parameter vectors are necessary to describe the bivariate Gaussian, a mean vector (µ) that specifies the peak of the lexical excitation in planning space, and a standard deviation vector (σ) that specifies the spread of the excitation. Both parameter vectors have one element for each formant. Eq. (1)
The lexical excitation function ELex is the product of a bivariate Gaussian and a time-
dependent driving function, D(t), that describes when, and the extent to which, the lexical system excites vowel planning space. Choosing an exact form of the driving function D(t) is not necessary here—for current purposes it is sufficient for this function to exhibit some nonlinear growth and subsequent decay, representing the switching on and off of lexical excitation.
Speaker-specific constraints on the boundaries of the vowel planning space can be represented as an inhibition that diminishes from arbitrarily determined boundaries. It is beyond the scope of this paper to address the source of these constraints, particularly the question of whether they are purely cognitive or arise from muscular and physiological constraints on motor control (c.f. Liljencrants & Lindblom (1972) for similar constraints). Fig. 6 (b) shows how such inhibition is distributed in planning space when it is the sum of sigmoidal functions of distance from the boundaries (Eq. 2). The parameters for this function are the boundaries (B), i.e. minimum and maximum formant values of vowel targets, and repulsive factors (R) associated with each of those boundaries that describe how far from the boundary (in Hz) the sigmoidally decaying inhibition reaches half of its maximum. Note that no temporal component is attributed to this inhibition. Eq. (2)
��� !"#�$1, $2� = % & 11 + �� |������)|*��) �+�
,-� + % & 11 + ��|������)|*��) �+
�,-�
Eq. (3) presents a general form of the activation field equation. The temporal dynamics of the field are determined primarily by the growth and decay rates parameterized in the driving function that modulates lexical excitation. The field equation treats each point in the field as independent from every other point, but a more complex model might incorporate local interactions. For ease of implementation, the minimum value of any point in the field is zero.
Some additional mechanisms are required to translate from the vowel planning activation field to an articulatory target. An arbitrary threshold determines a subset of the field that contributes to the target. Fig. 6 (c) shows a 50% activation contour enclosing the region of the planning space where the field is above the 50% activation threshold. There is no principled reason for a 50% threshold value per se, but varying the threshold generally produces only qualitative differences. All above-threshold points contribute to the determination of a production target, which is defined by the means of the formant values of the points inside the above-threshold region. The simulated [F1,F2] target vector in Fig. 6 (c) is [305, 2202] Hz. To model variability in observed values, a random error component could contribute relatively small, normally distributed perturbations to the vowel targets; however such errors could also arise from lower levels of the motor control system, and thus are not included in Eq. (3). The vowel targets (in articulatory coordinates) can serve as input to a production model, such as the task-dynamics model of speech gestures (Saltzman & Kelso 1983; Saltzman 1986; Saltzman & Munhall 1989). In the task-dynamics approach, tongue dorsum constriction location and tongue dorsum constriction degree are tract variables whose motions in an abstract task space are determined by tract variable targets, which are dynamically turned on and off by gestural activation. This activation is the introduction of a driving force in a second-order mass-spring system that changes the equilibrium positions of the tract variables (masses). Tract variables can then be transformed into articulator motions (if an arbitrary weighting of articulators is assumed). In order to integrate the field model formant targets into this system, they could be transformed into task variables of dorsal constriction degree and location (although the details of such a transform would be quite complex). The application of the field model to the results of the phonemic-response priming task employs one more crucial mechanism: selective inhibition. As described in section 4.2, inhibition has been used to account for trajectory deviations away from planned responses in oculomotor and reaching experiments. In applying this concept to vowel planning, we utilize a mechanism of intergestural inhibition: selective inhibition of the planning field that arises from the production of a gesture and is focused on a contemporaneously planned gesture. In the present scenario, intergestural inhibition applies to coplanned vowel gestures. The source of intergestural inhibition should be viewed as external to the planning and perception fields, i.e. not as lateral inhibition within the fields, but rather, as a form of lexical and phonological inhibition—in other words, the inhibition is part of the long-term memory specific to a gesture.
Fig. 7 illustrates how intergestural inhibition can produce dissimilation between a planned cue vowel and a discordant response. The left side of the figure corresponds to a
concordant trial with an /i/ cue and target; the right side to a discordant trial with an /ɑ/ cue and /i/ target. After the cue stimulus, the subject has prepared the possible responses to extents that reflect their probabilities of being the required response; to represent this, the lexical excitation components of the activation fields shown in panels (a) and (b) are driven by D(t) = 2/3 and D(t) = 1/3 for the cue and noncue responses, respectively. Panels (c) and (d) show the intergestural inhibition associated with production of the target, /i/. The precise time course of the inhibition, i.e. exactly when it takes effect relative to the production of the inhibiting gesture, is perhaps better left to future empirical investigation and development of the model. Following Houghton
UC Berkeley Phonology Lab Annual Report (2007)
448
& Tipper (1999), the strength of the inhibition is greater for a more actively planned (or salient)
nonresponse vowel—/ɑ/ in this case—and thus the intergestural inhibition is more influential on the discordant trial than the concordant one. The inhibition (Eq. 4) constitutes an additional term in the activation field equation (Eq. 5). It takes the form of a bivariate Gaussian (as in Eq. 1) that is modulated by the parameter αInh, which corresponds to the strength of the inhibition.
Fig. 7. Activation fields at different stages of concordant and discordant trials. (a,b) post-cue activation on concordant and discordant trials. (c,d) intergestural inhibition. (e,f) response activation fields. White lines show 50% activation contours used to determine concordant targets (+) and discordant targets (o).
On the discordant trial, after the /i/ target is known, the lexical excitation of /i/ rapidly
increases (i.e. the driving force D/i/(t) increases to 1), and the lexical excitation of /ɑ/ gradually
decays (i.e. D/ɑ/(t) changes slowly from the post-cue level of 2/3 to 0). Crucially, the rate of this
decay is not by itself fast enough to prevent residual nonresponse /ɑ/ planning from being incorporated into the production target. Because of this, the intergestural inhibition affects the activation field more quickly than the decay of the nonresponse vowel excitation. The intergestural inhibition potentially eliminates any effect of competing vowel planning activity on the target.
Panels (e) and (f) show the result of subtracting the intergestural inhibition from the post-target activation field (not shown), as well as 50% activation contours and the resulting vowel targets. The discordant trial target (‘o’) is more peripheral than the concordant trial target (‘+’) because the intergestural inhibition is stronger and has a steeper gradient across the region of planning space corresponding to the response vowel, /i/. This results in a region of above-threshold activity that is relatively smaller and farther away from locus of inhibition. The activation field [F1,F2] vowel targets for the simulations3 shown in Fig. 7 were [302, 2209] Hz for the concordant trial, and [287, 2240] Hz for the discordant trial, which constitutes a quasi-dissimilatory pattern of ∆F1 = 15 Hz and ∆F2 = -31 Hz. Weaker intergestural inhibition, as shown in Fig. 8, produces a quasi-coarticulatory difference between concordant and discordant trials. The weaker inhibition allows for some of the nonresponse vowel activity to remain above threshold (because of its relatively slow decay), especially in the discordant trial. The intergestural inhibition is altered by changing the parameter αInh in Eq. (4). Whereas for the simulation in Fig. 7, concordant trial αInh = 0.5 and discordant trial αInh = 4, in the simulation shown in Fig. 8, these parameters were reduced by a factor of 100, giving concordant trial αInh = 0.005 and discordant trial αInh = 0.04. This relatively weak intergestural inhibition is not sufficient to eliminate all of the residual planning activity of the cue vowel in the discordant trial. The targets for the simulations4 in Fig. 8 were [305, 2202] Hz and [339, 2115] Hz for the concordant and discordant trials, resulting in a quasi-coarticulatory differences of ∆F1 = -34 Hz and ∆F2 = 88 Hz.
UC Berkeley Phonology Lab Annual Report (2007)
450
Fig 8. Response activation fields in concordant and discordant trials with relatively low levels of intergestural inhibition. White lines show 50% activation contours used to determine concordant targets (+) and discordant targets (o).
A useful aspect of this model is that variation in a single parameter, αInh, which represents the strength of intergestural inhibition, can produce three qualitatively distinct articulatory behaviors. A relatively large value of this parameter mimics dissimilation via intergestural inhibition of the region of the activation field that codes for the response vowel. A relatively low value of the parameter reproduces coarticulation by failing to sufficiently diminish activity in the response region of the field. An intermediate value of the parameter results in a balance that leads to insubstantial degrees of coarticulation or dissimilation. In order to model the cases in which one formant exhibits dissimilation or coarticulation and the other exhibits no such trend, the σ parameters in Eqs. (1) and (4) can be manipulated to alter the range over which lexical excitation and intergestural inhibition have substantial impact on the field; these manipulations can affect the F1 and F2 dimensions independently, and could be used to obviate the αInh
parameter altogether, although this option is not explored here. To model the subphonemic priming effects of shifted cues, the mapping between the perceptual and planning spaces must be utilized. Perception of the cue stimulus activates a region of the perceptual field in a manner that is similar to the lexical excitation of the planning field. Without attempting to explicitly model this, I suggest that this perceptual activity is also manifested as planning activity—similarly distributed—via the mapping. This planning activity then is integrated with the lexical excitation from the response vowel. No intergestural inhibition is applied between the gestures because they belong to the same response category. Hence the model predicts that the response target will tend to fall in-between the cue and target stimuli. This is entirely analogous to the results of the oculomotor and reaching experiments when the distractor and target are nearby in space. Indeed, one might associate with each gesture a region of target space within which no two target locations exhibit intergestural inhibition.
UC Berkeley Phonology Lab Annual Report (2007)
451
4.5 Extension of phonemic-response priming results to speech phenomena
How do the results of the phonemic-response priming task relate to speech phenomena such as vowel-to-vowel coarticulation, dissimilation, and vowel harmony? It should be apparent that the quasi-coarticulatory patterns observed for a couple of speakers are analogous to carryover vowel-to-vowel coarticulation in VCV sequences, but it remains to be argued that the same cognitive mechanisms are responsible for both patterns. Notably, significant coarticulation was only observed for three measures in this priming experiment; in contrast, in studies of the production of VCV sequences, vowel-to-vowel coarticulation is much more pervasive.
There are a couple crucial assumptions that allow for attributing the experimental quasi-coarticulation and V-to-V coarticulation to the same mechanism. First, I assume that the same cognitive systems that were employed for response planning in this task are those employed for planning in everyday speech. This assumption has not been experimentally justified, although it seems reasonable that there would be substantial overlap between the planning systems involved in this task and those operative in spontaneous speech. Ample evidence has been presented that the cue vowel was normally “planned” by all subjects who participated in the experiment. Second, I assume that the aspects of the task that were unlike casual speech, although possibly magnifying or diminishing the operation of various systems involved in vowel planning, did not add a cognitive process that would otherwise not participate in spontaneous speech planning.
In the field model, quasi-coarticulatory effects arise from the relative weakness of a cognitive mechanism I have called intergestural inhibition; there is a seeming contradiction, however, between the field model and what is observed in V-to-V coarticulation. This contradiction arises from the property of selective inhibition that it is stronger for more salient distractors, from which it follows that the strength of intergestural inhibition is partly a function of the activity of the to-be-inhibited system. If it is assumed that a produced vowel in a V1CV2 is more highly activated than a merely planned vowel like the discordant cue in the priming experiment (which seems reasonable), then the intergestural inhibition of V2 should be even greater in a V1CV2 sequence, leading to even more exaggerated dissimilation.
Consider two potential solutions to this problem. For one, carryover coarticulation in spoken VCV may be due in part to mechanico-inertial effects of V1 on V2 (Recasens 1984; Recasens et. al. 1997). These mechanical effects, absent in the priming experiment, may overwhelm the dissimilation in actualized speech. Alternatively, the production of V1 may speed the subsequent decay of its associated planning activity (i.e. the lexical excitation driving function would decay more rapidly after production, perhaps due to an intrinsic inhibition dependent upon reaching a production threshold). This production-accelerated decay account can be modeled as an additional nonlinearity in the lexical excitation driving function.
It is not obvious that the quasi-dissimilatory patterns observed in the phonemic-response priming task are present in natural speech. Reports of phonetic vowel-to-vowel dissimilation in the literature are rare. Fletcher (2004) reported slight vowel-to-vowel anticipatory and carryover
dissimilation between /a/ and /i/ in Southern British English әkVkV sequences, but I am aware of no other similar findings.
There is a good argument to be made, however, that inhibition associated with a subsequent articulation speeds the completion of the preceding articulation. First, consider the task-dynamics model of speech production as described above (c.f. Saltzman & Kelso 1980; Saltzman 1986; Saltzman & Munhall 1989), in which the driving forces of speech gestures on
UC Berkeley Phonology Lab Annual Report (2007)
452
tract variables are “turned on” and “turned off” in a gestural score; more recently, Nam (2007) has modeled the opening and closing phases of gestures separately. What evidence is there for dissociating the onset and offset of a speech gestures? One form comes in the observation that some gestures appear to have an internal dynamic which admits of free variation in onset and offset properties, a simple example being the variation in the time course of the release of word-final stops in English. Despite a relative similarity between the closing gesture for word-final
voiceless alveolar stop allophones [th] and [t�] in the word “cat,” the time-courses of the release gestures may vary considerably within a speaker from utterance to utterance—especially when pre-pausal or utterance-final. Patterns like this suggest that the movements associated with gestural offsets are dissociable from the gestures themselves and may in part depend upon inhibition from subsequent gestures.
Another argument for the role of inhibition is its ability to explain the prosodic phenomenon of boundary lengthening. It has been observed that at phrase boundaries, gestures increase in duration (Beckman et. al. 1992; Byrd & Saltzman 1998). Gestures near edges also overlap less, i.e. spread apart in time (Edwards et. al 1991). Byrd & Saltzman (2003) have modeled such phenomena with π-gestures, which effect a local slowing of the flow of speech by adapting the dynamics of articulatory gestures to a scaled clock time that is distinct from real time. Intergestural inhibition offers an alternative approach to explaining boundary lengthening: a relative weakness of inhibition across word- and phrase-external boundaries relative to word-internal boundaries would result in more slowly inactivated gestures. If intergestural inhibition from subsequent or preceding gestures is weaker at phrase boundaries, gestural planning activity will remain above threshold longer, and thus boundary gestures will be longer in duration.
Neurophysiological studies also implicate inhibition in the control of sequential
movement. An nicely illustrative study was conducted by Averbeck, Chafee, Crowe, and Georgopolis (2002), in which intracellular recordings were made from prefrontal neurons in monkeys. The monkeys were trained to perform sequential movement tasks like drawing a square or a triangle. Fig. 9 schematizes the task and some results of this experiment. The monkeys began drawing at the dots in the geometrical shapes on the right side of the figure; to successfully complete the shapes, the monkeys would draw five segments for the square or three for the triangle. Using established statistical techniques, the experimenters were able to associate activity in individual neurons with the representation of serial elements of the movement sequences. Fig. 9 shows the timecourse of activity—i.e. “strength of representation”—in the neurons associated with each of the line segments in the square and triangle tasks. There are several things to note in this diagram: first, the neural ensembles associated with the initial and final segments exhibited relatively more activation; second, before the beginning of the movement, the activation levels of the ensembles corresponded to their associated order in the sequence; third, the activation of each ensemble peaked at approximately the middle of its corresponding segment; last, the activation of a subsequent segment began roughly at the peak of the preceding segment.
UC Berkeley Phonology Lab Annual Report (2007)
453
Fig. 9. Schematic representation of shape-drawing tasks and neural ensemble activity from Averbeck, Chafee, Crowe, and Georgopolis (2002).
According to the authors, “inhibitory interactions between prefrontal neurons may be part
of the mechanism by which distinct ensemble activity patterns are established,” and they explicitly suggest a connection between the serial order of a movement planning in the task and the serial order of phonemes in speech. Although not discussed in the paper, ensemble activity level for a given element of the sequence may fall substantially below the level observed before movement onset—presumably the extent of this decrease in activity reflects the extent of inhibition of the ensemble. It is not unreasonable from a neurophysiological perspective to speculate that the magnitude of the inhibition is the sort of thing that constitutes “memory,” and that is learned and also subject to contextual modulation.
Vowel harmony has been understood as the phonologization of vowel-to-vowel
coarticulation. One influential view of the phonologization process involves the mechanism of hypocorrection (Ohala 1993). Hypocorrection describes the failure of listeners to correct for phonetic perturbations due to production, such as coarticulation between vowels. These perturbations may then become part of pronunciation norms. In this view, what prevents phonologization is the cognitive mechanism of perceptual correction for contextually expected variation: listeners expect vowel-to-vowel coarticulation and higher-order perception factors out such variation. If production norms are perpetually defined according to these corrected perceptions, then coarticulation will not be phonologized as vowel harmony. The field model offers an additional stabilizing force: intergestural inhibition—a function inherent to the planning system—diminishes vowel-to-vowel perturbations before they are articulated in the first place.
Along these lines, intergestural inhibition may be one of the cognitive mechanisms responsible for maintaining phonetic contrast between speech sounds. It accomplishes this by dissimilating nearby articulations. These less similar articulations are then perceived as more