43
vSphere vs. Hyper-V Metron Performance Showdown
| Date post: | 17-Dec-2015 |
| Category: |
Documents |
| Upload: | muriel-wells |
| View: | 219 times |
| Download: | 0 times |
vSphere vs. Hyper-V
Metron
Performance Showdown

Objectives
• Architecture
• Available metrics
• Challenges in virtual environments
• Test environment and methods
• Results, conclusions, and caveats
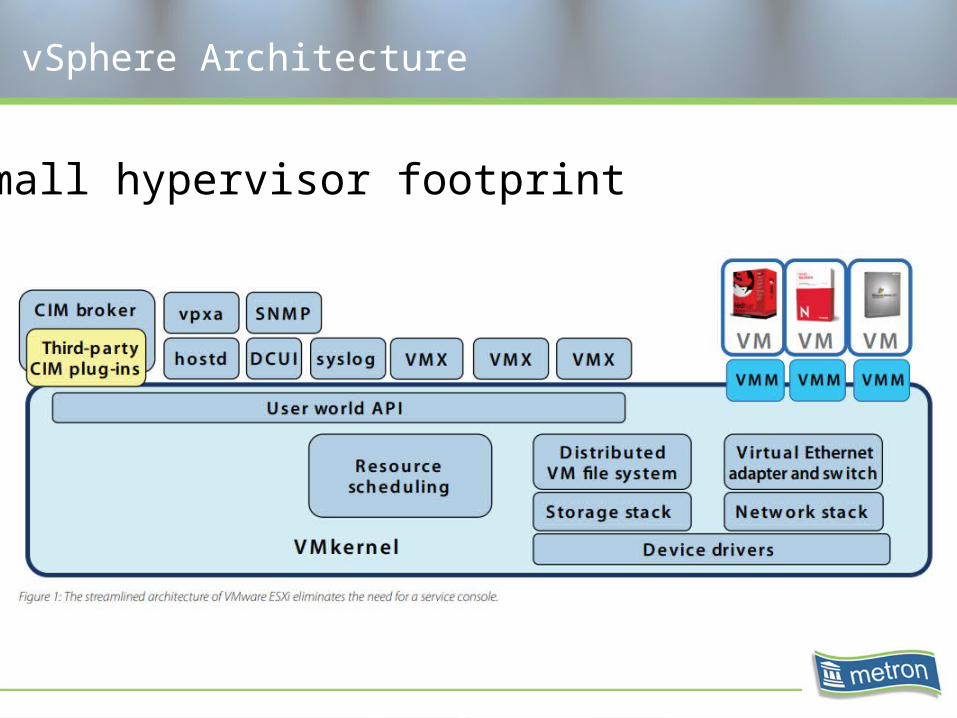
vSphere Architecture
Small hypervisor footprint

Hyper-V Architecture
Windows OS required - Larger footprint
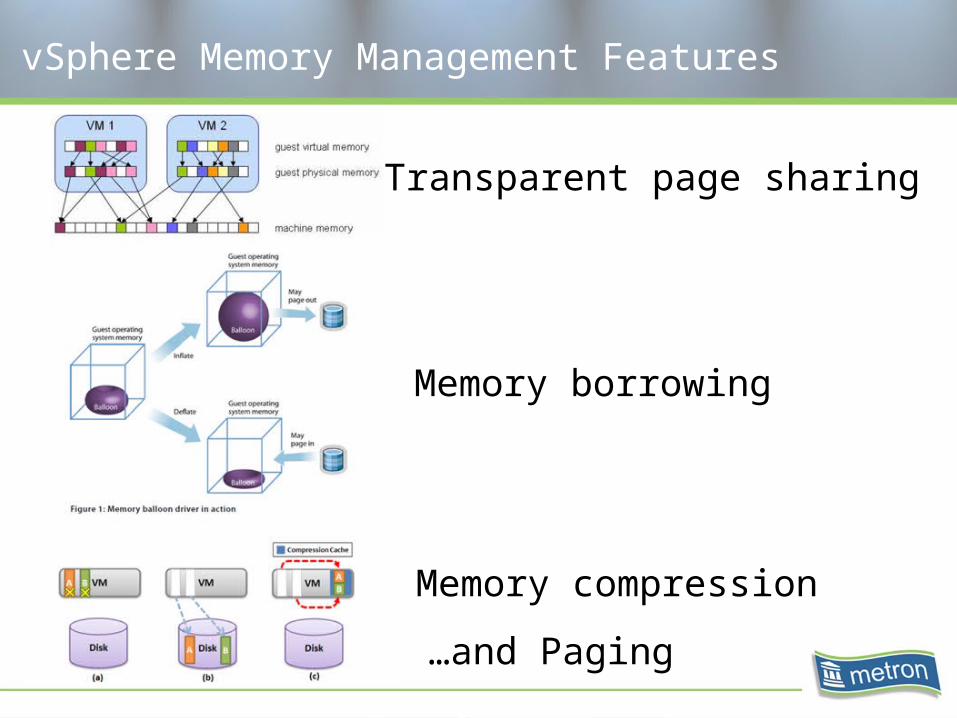
vSphere Memory Management Features
Transparent page sharing
Memory borrowing
Memory compression
…and Paging
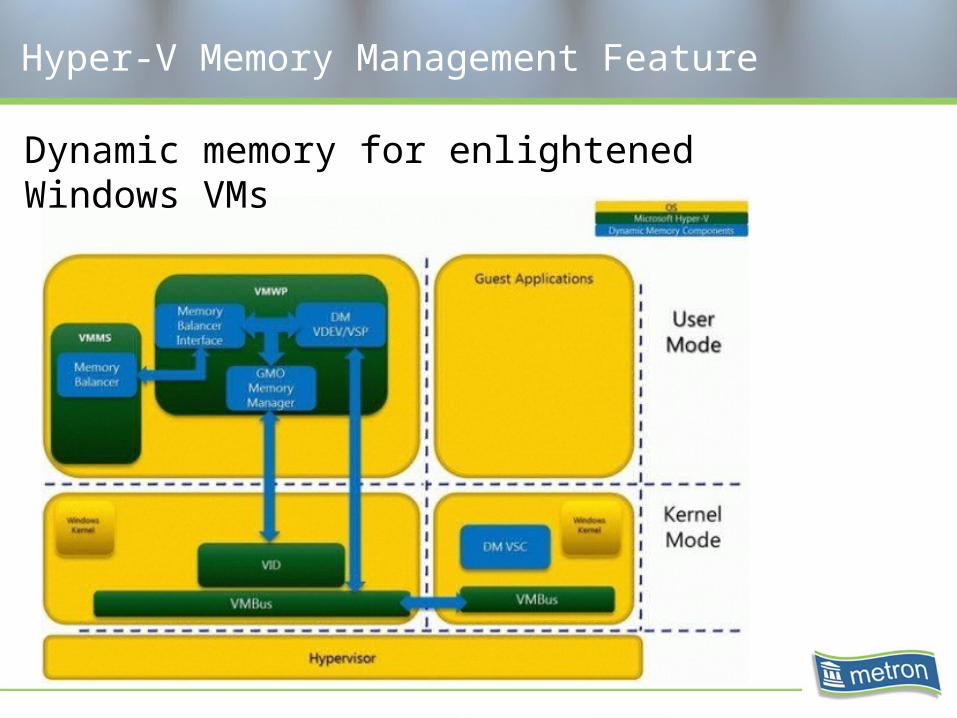
Hyper-V Memory Management Feature
Dynamic memory for enlightened Windows VMs
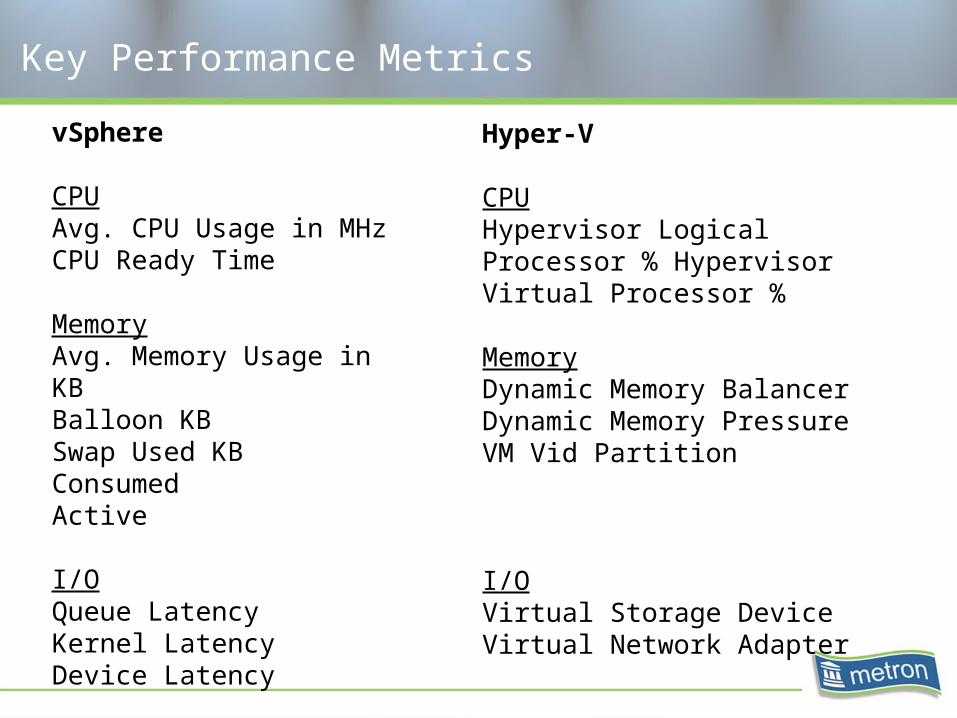
Key Performance Metrics
vSphere
CPUAvg. CPU Usage in MHzCPU Ready Time
MemoryAvg. Memory Usage in KBBalloon KBSwap Used KBConsumedActive
I/OQueue LatencyKernel LatencyDevice Latency
Hyper-V
CPUHypervisor Logical Processor % Hypervisor Virtual Processor %
MemoryDynamic Memory BalancerDynamic Memory PressureVM Vid Partition
I/OVirtual Storage DeviceVirtual Network Adapter

Challenges in Virtual Environments
- Clock skew
- NUMA (non-uniform memory access) scheduling
- Pass-through I/O
- Workload definition
- 32 versus 64 bit OS and applications
- Where to use solid state I/O devices
- Storage tiers
- Hidden overhead
- etc...
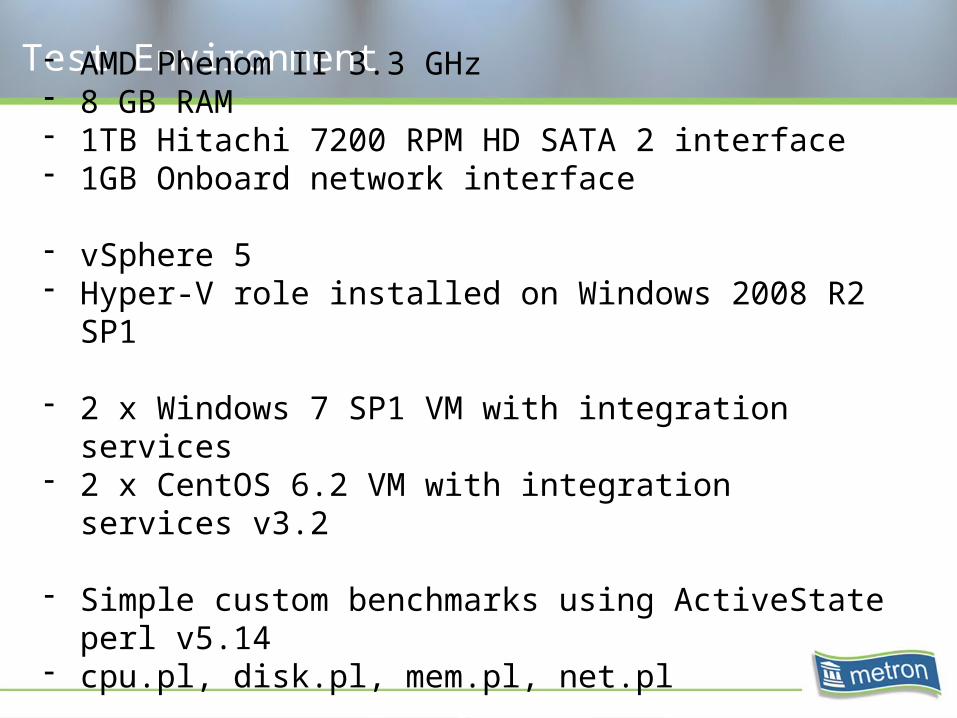
Test Environment
- AMD Phenom II 3.3 GHz- 8 GB RAM- 1TB Hitachi 7200 RPM HD SATA 2 interface- 1GB Onboard network interface
- vSphere 5- Hyper-V role installed on Windows 2008 R2 SP1
- 2 x Windows 7 SP1 VM with integration services- 2 x CentOS 6.2 VM with integration services v3.2
- Simple custom benchmarks using ActiveState perl v5.14- cpu.pl, disk.pl, mem.pl, net.pl
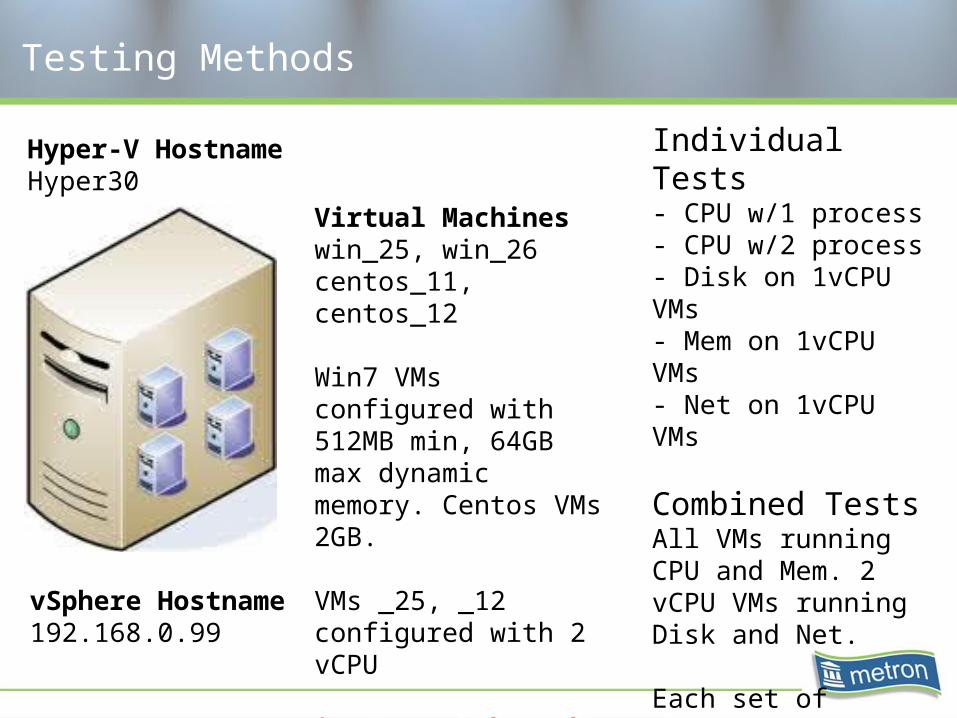
Testing Methods
Virtual Machineswin_25, win_26centos_11, centos_12
Win7 VMs configured with 512MB min, 64GB max dynamic memory. Centos VMs 2GB.
VMs _25, _12 configured with 2 vCPU
* No Pass-Through
Hyper-V HostnameHyper30
vSphere Hostname192.168.0.99
Individual Tests- CPU w/1 process- CPU w/2 process- Disk on 1vCPU VMs- Mem on 1vCPU VMs- Net on 1vCPU VMs
Combined TestsAll VMs running CPU and Mem. 2 vCPU VMs running Disk and Net.
Each set of testing was run identically on the same host using both hypervisors
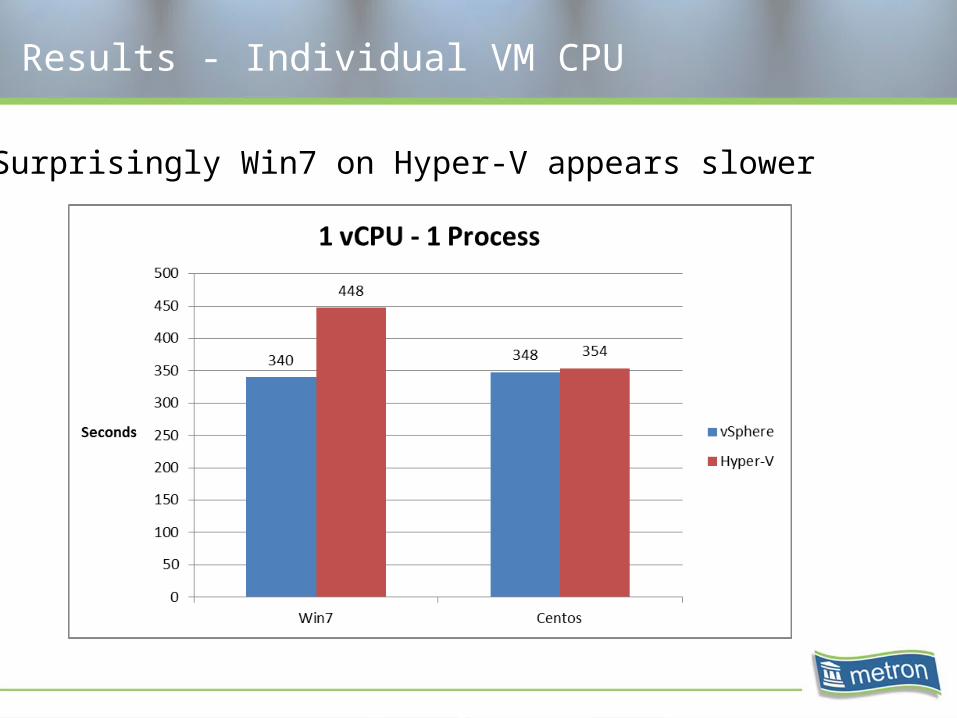
Results - Individual VM CPU
Surprisingly Win7 on Hyper-V appears slower

Results - Individual VM CPU
Extra vCPU no help with one process
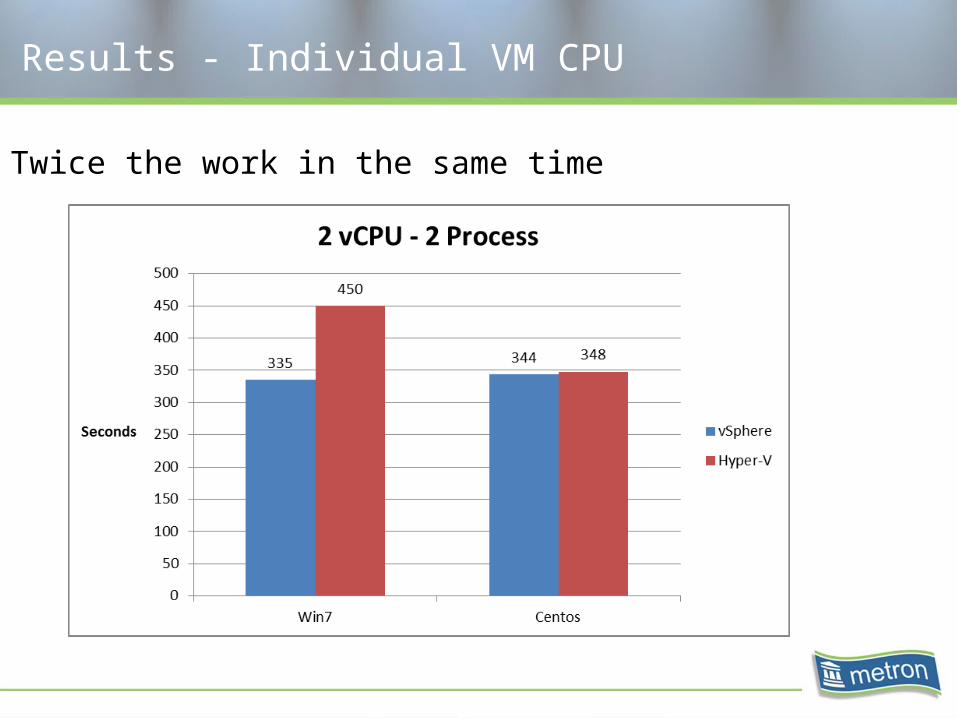
Results - Individual VM CPU
Twice the work in the same time

Results - Individual VM CPU
Summary of CPU results
- Windows CPU performance on Hyper-V was significantly slower
- Two vCPUs running a single process had little negative impact
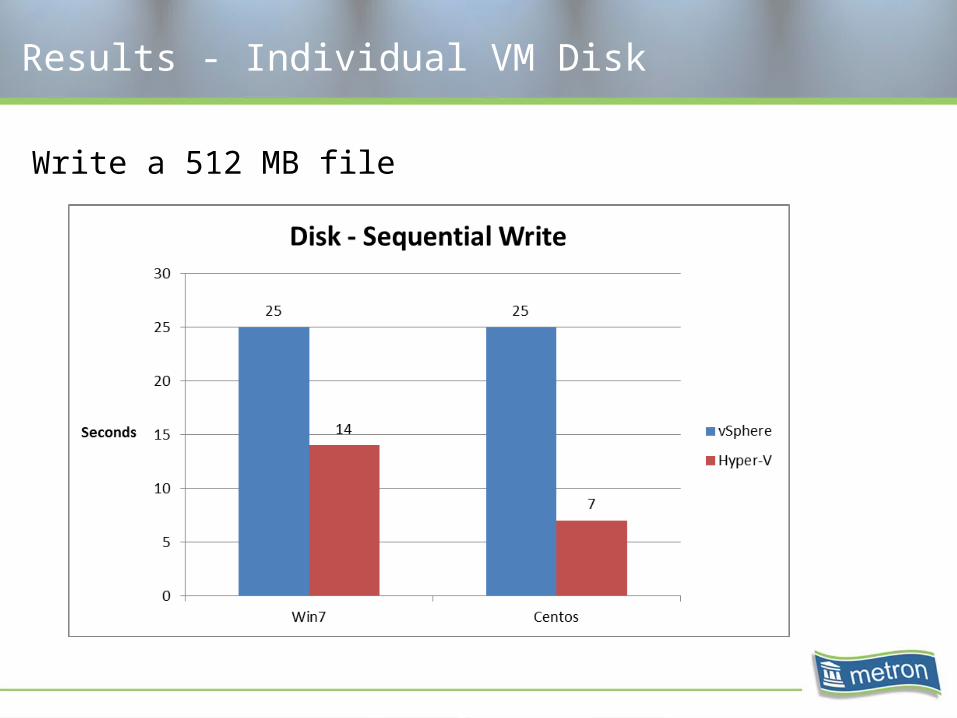
Results - Individual VM Disk
Write a 512 MB file
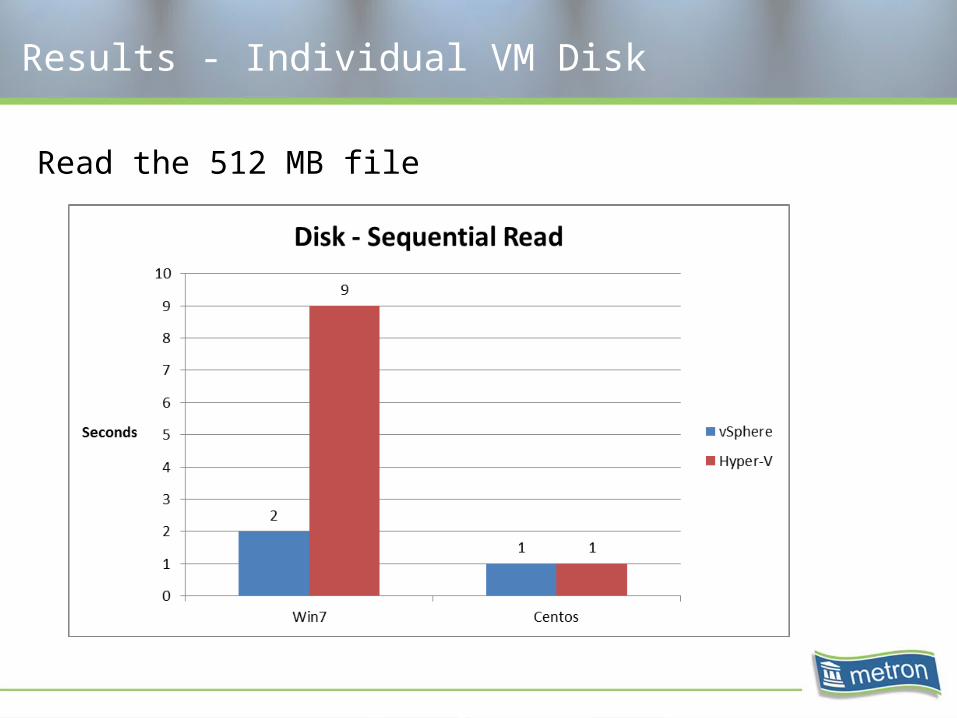
Results - Individual VM Disk
Read the 512 MB file
Results - Individual VM Disk
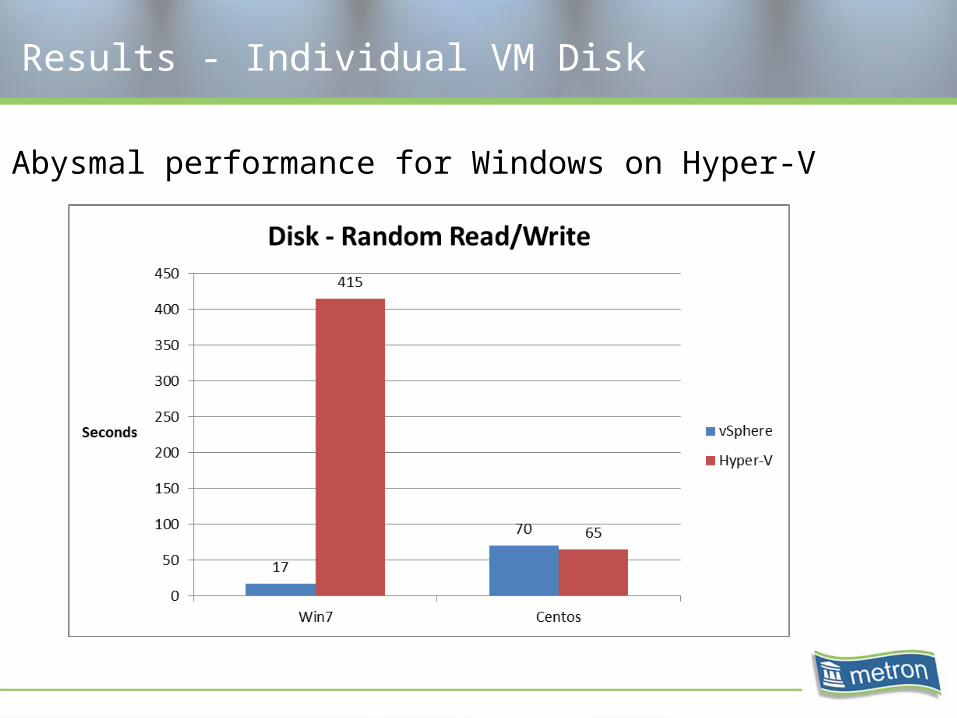
Abysmal performance for Windows on Hyper-V

Results - Individual VM Disk
Summary of disk I/O results
- Random I/O on a Hyper-V dynamic disk had terrible performance
Results - Individual VM Memory
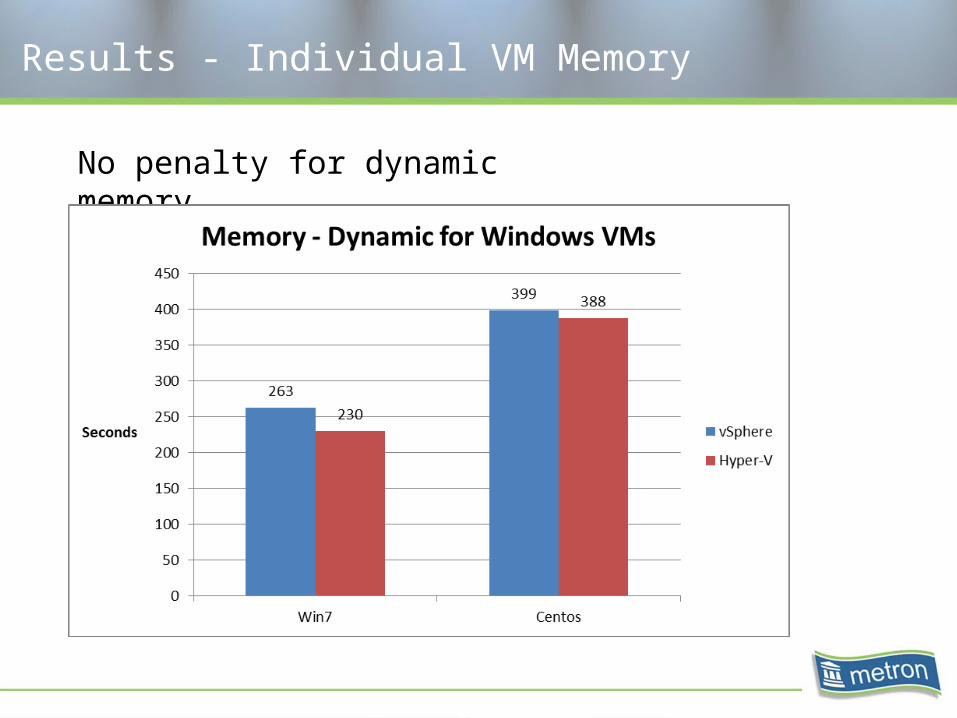
No penalty for dynamic memory
Results - Individual VM Network
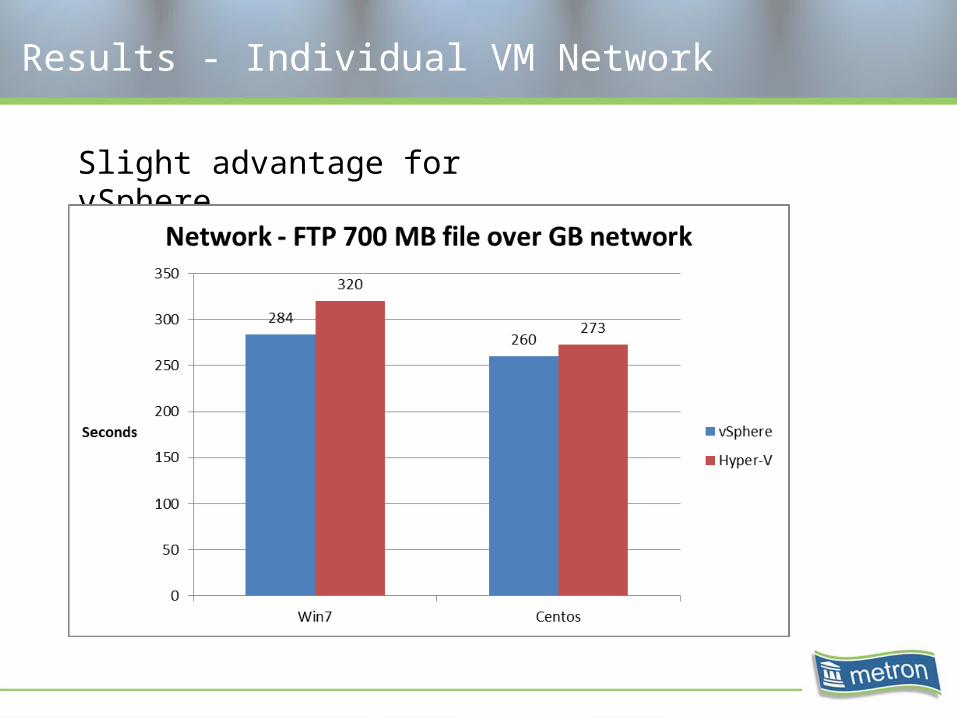
Slight advantage for vSphere
Results - Combined Test
And now… for the grand finale
All workloads running at the same time on multiple VMs
The winner is….
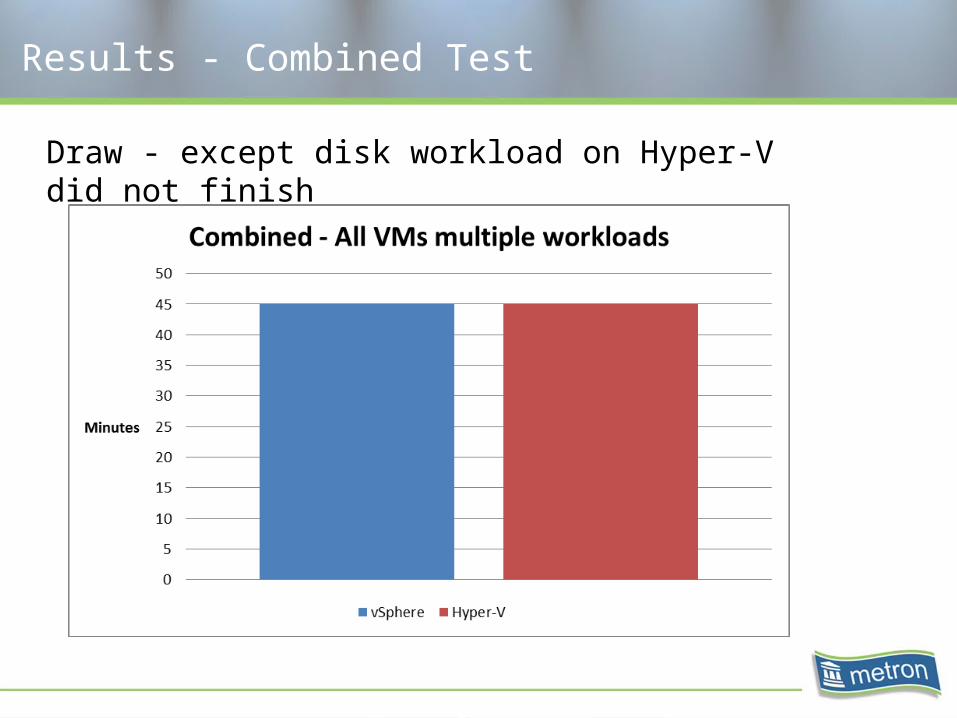
Results - Combined Test
Draw - except disk workload on Hyper-V did not finish
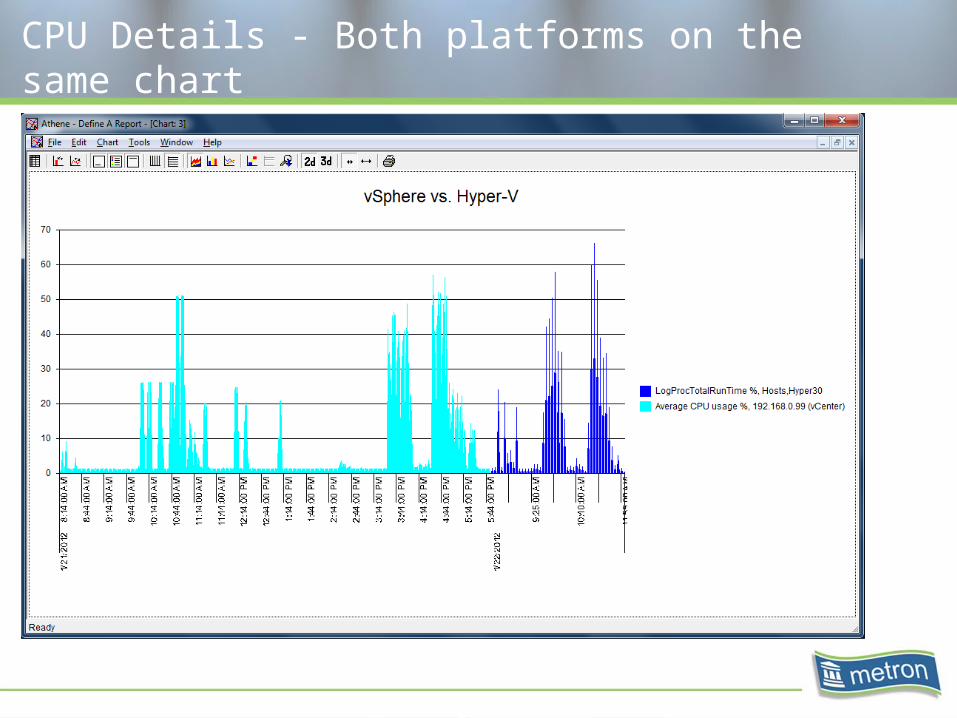
CPU Details - Both platforms on the same chart
Detail CPU Metrics
- vSphere VM ready time
- Hyper-V Guest run time
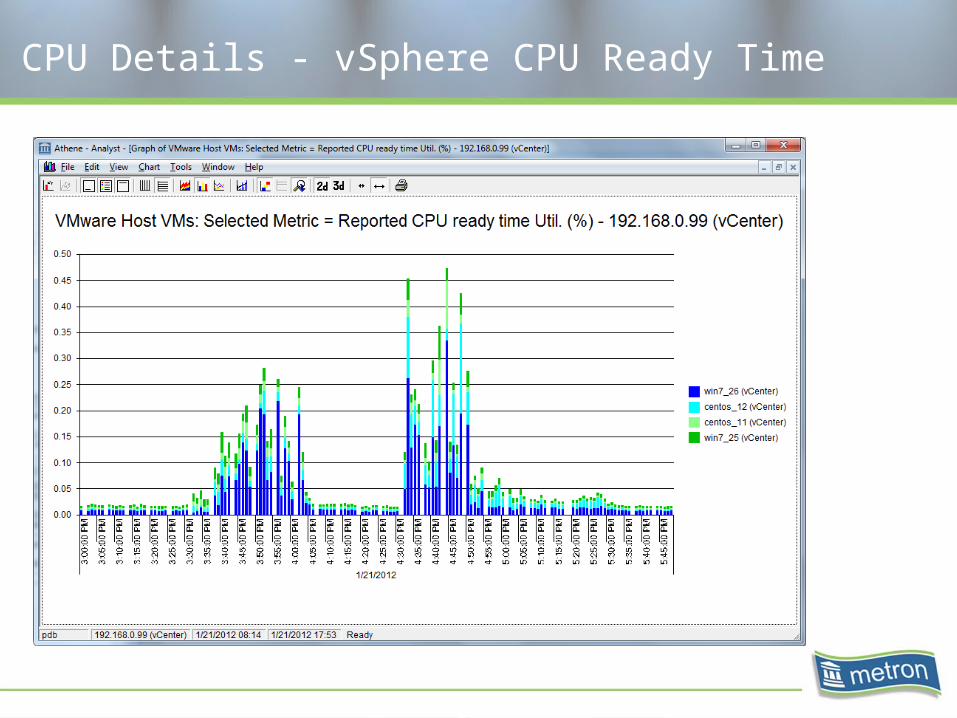
CPU Details - vSphere CPU Ready Time
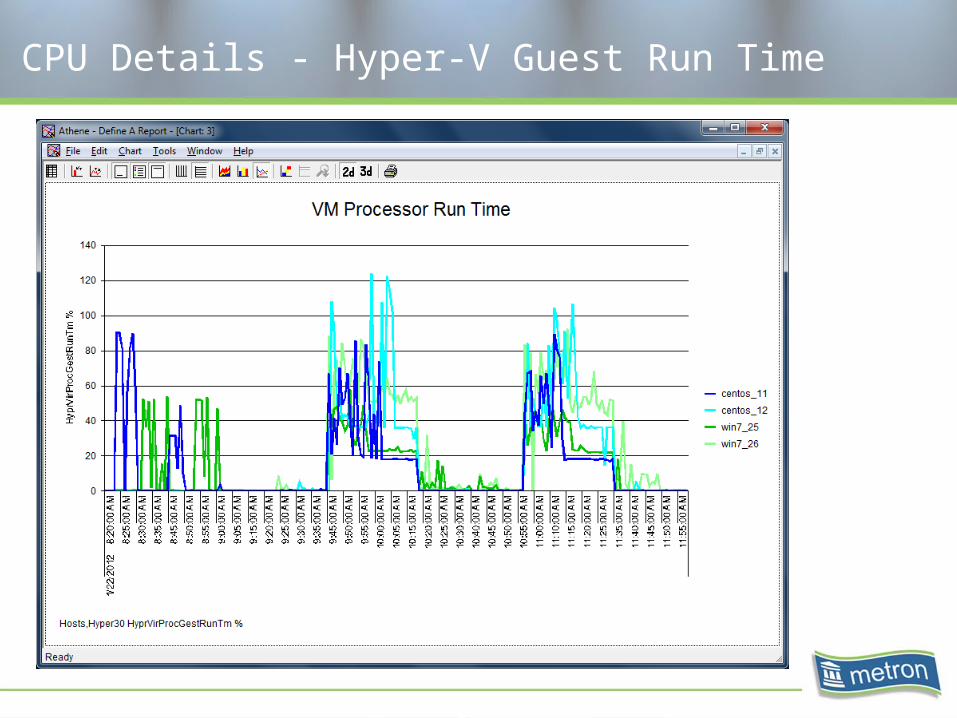
CPU Details - Hyper-V Guest Run Time
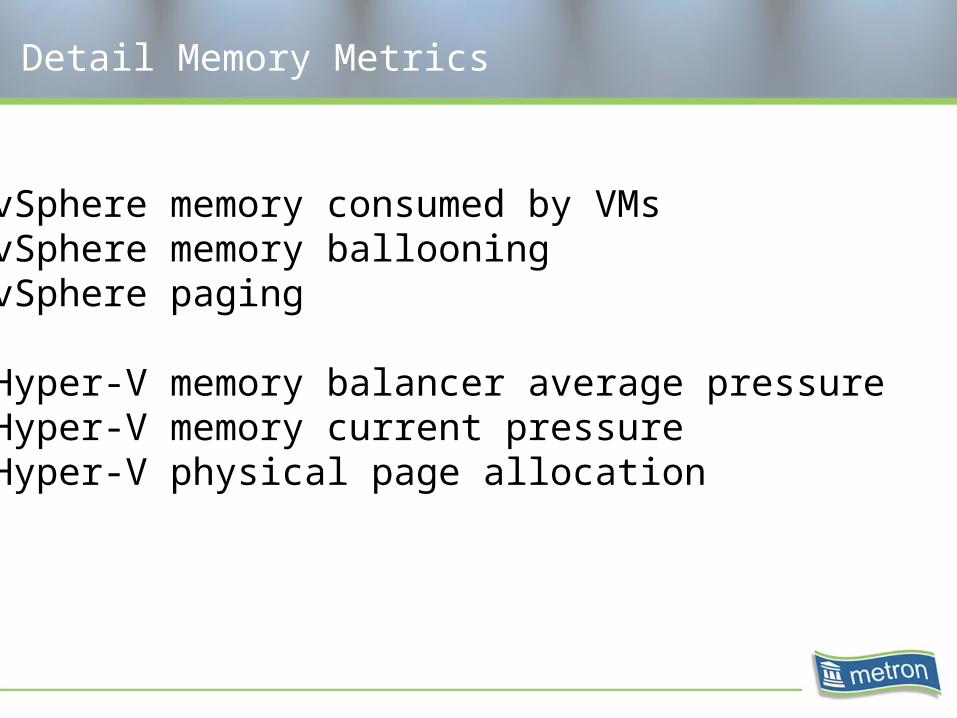
Detail Memory Metrics
- vSphere memory consumed by VMs- vSphere memory ballooning- vSphere paging
- Hyper-V memory balancer average pressure- Hyper-V memory current pressure- Hyper-V physical page allocation

Memory Details - vSphere Ballooning
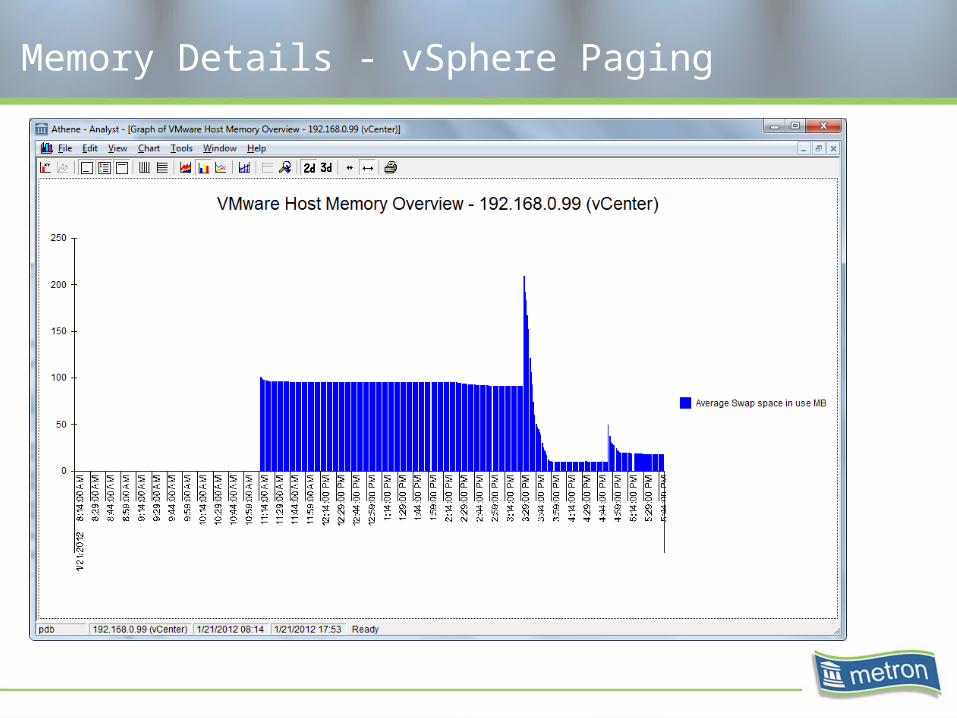
Memory Details - vSphere Paging

Memory Details - vSphere Consumed

Memory Details - Hyper-V Memory Balancer Pressure
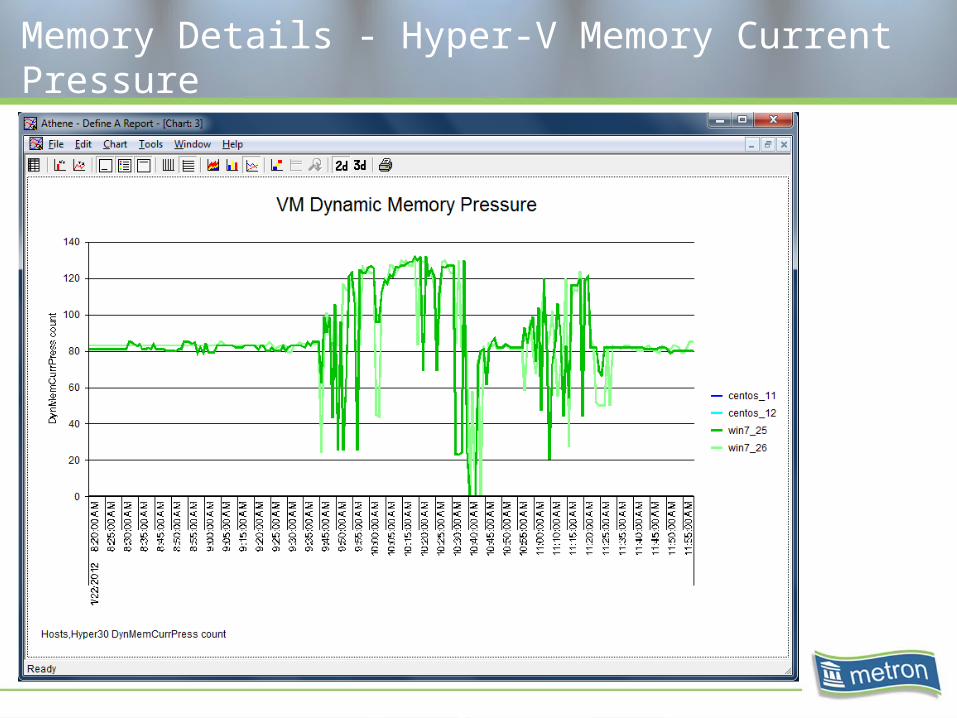
Memory Details - Hyper-V Memory Current Pressure
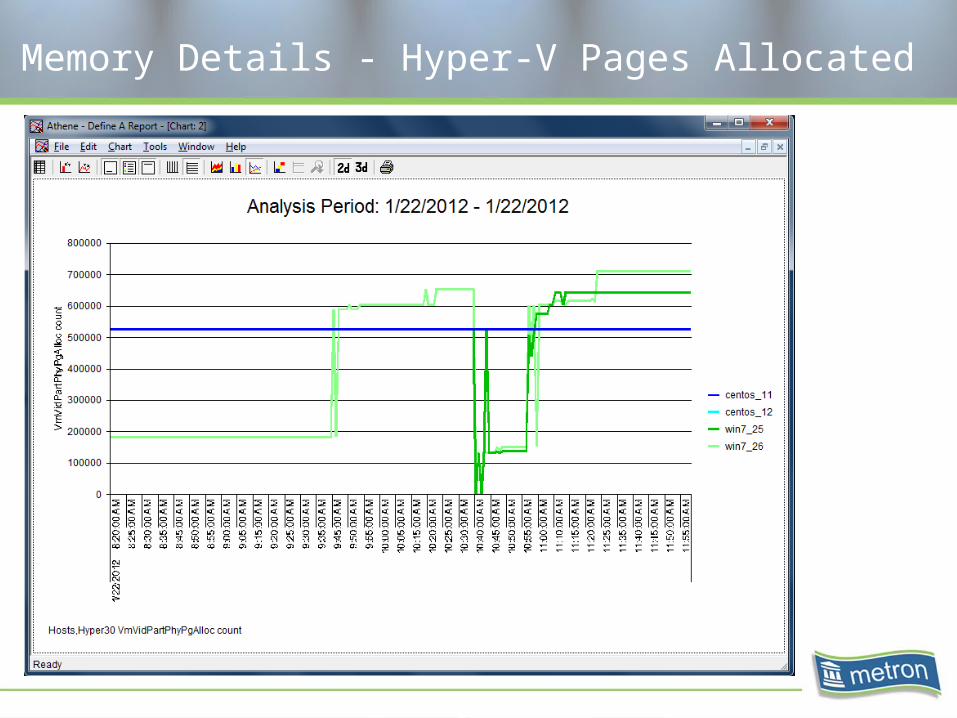
Memory Details - Hyper-V Pages Allocated

Detail I/O Metrics
- vSphere queue latency- vSphere device latency
- Hyper-V disk throughput
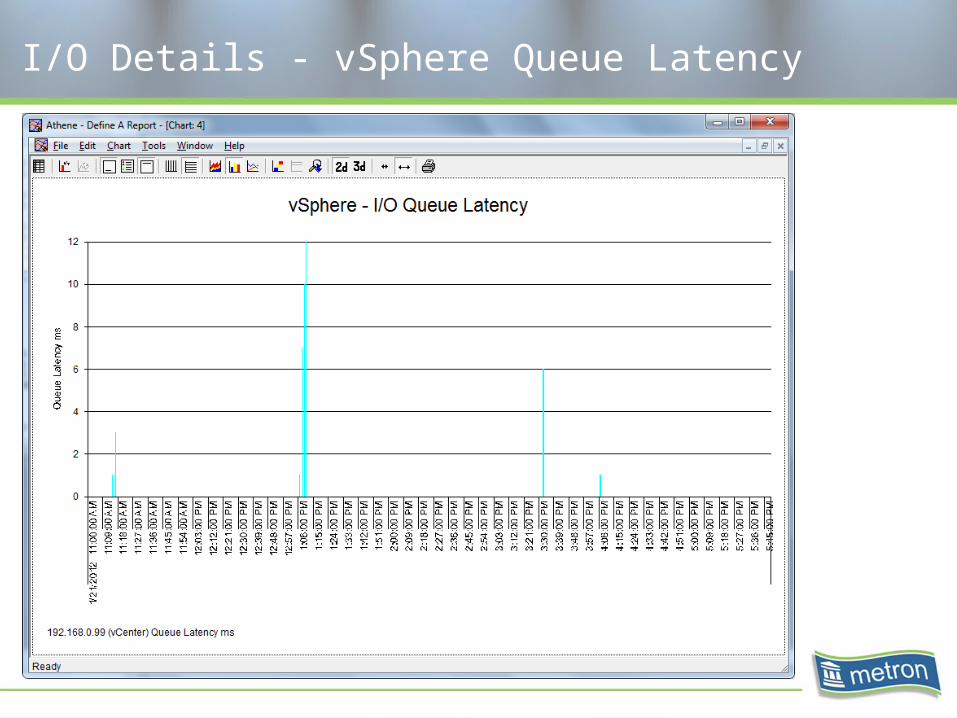
I/O Details - vSphere Queue Latency
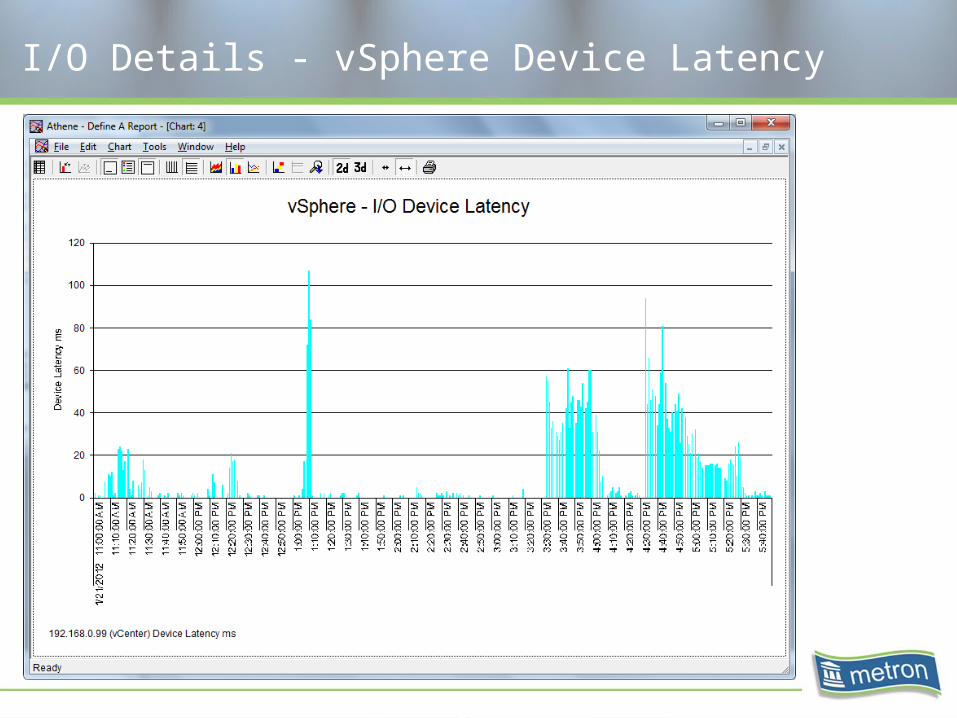
I/O Details - vSphere Device Latency
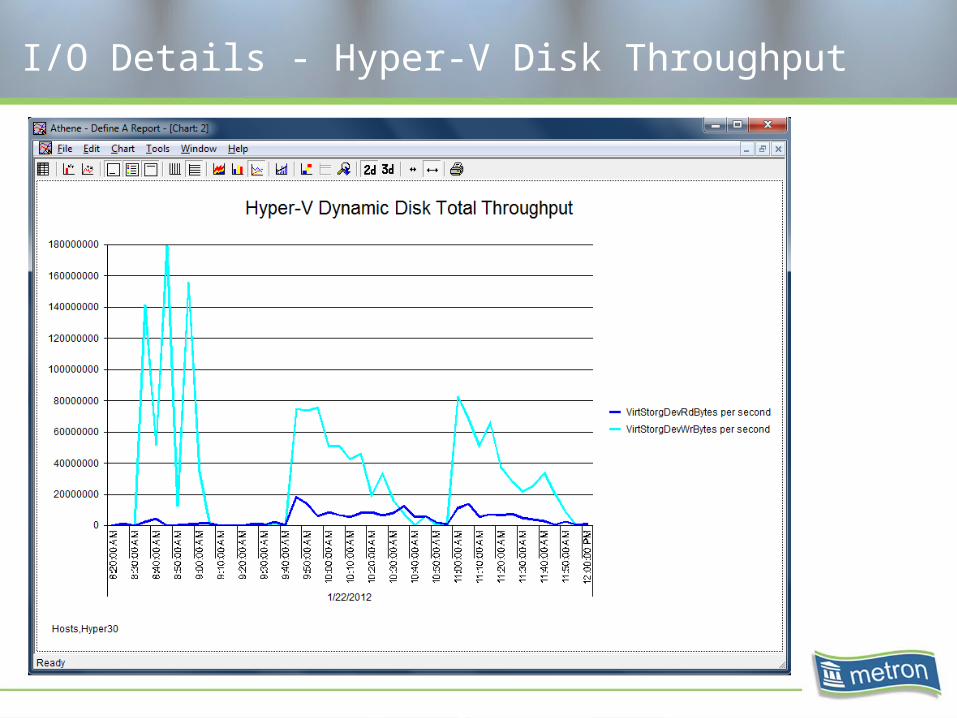
I/O Details - Hyper-V Disk Throughput
Interesting Observations
- Hyper-V dynamic memory- Hyper-V dynamic disk device performance

Dynamic Memory in action - High Pressure

Dynamic Memory in action - Low Pressure
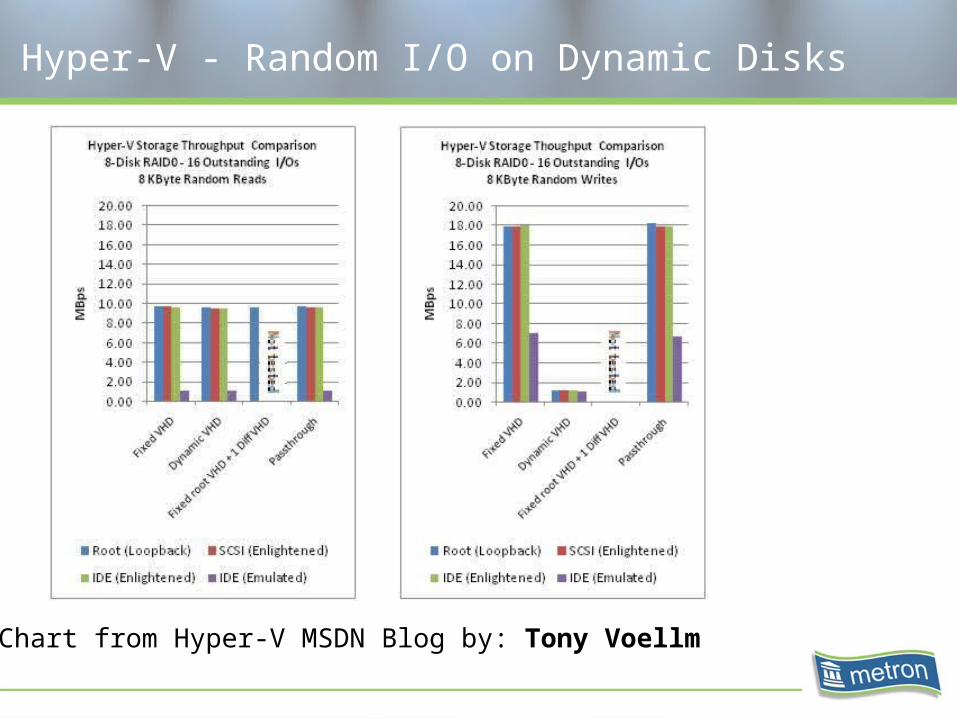
Hyper-V - Random I/O on Dynamic Disks
Chart from Hyper-V MSDN Blog by: Tony Voellm
Conclusions, Caveats, and Final Thoughts
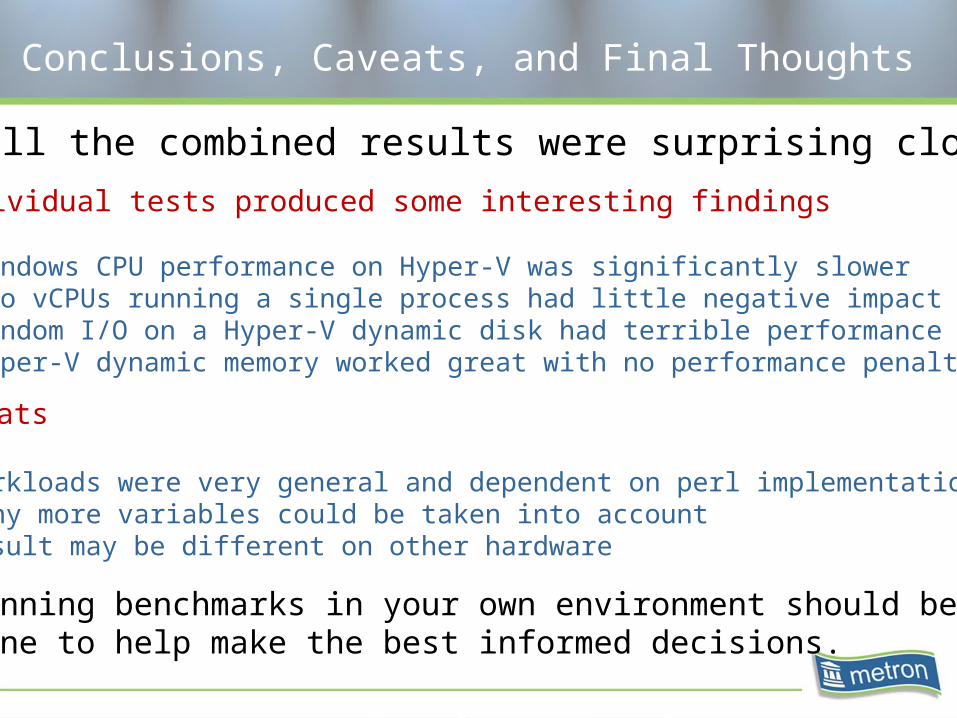
Overall the combined results were surprising close
Individual tests produced some interesting findings
- Windows CPU performance on Hyper-V was significantly slower- Two vCPUs running a single process had little negative impact- Random I/O on a Hyper-V dynamic disk had terrible performance- Hyper-V dynamic memory worked great with no performance penalty
Caveats
- Workloads were very general and dependent on perl implementation- Many more variables could be taken into account- Result may be different on other hardware
Running benchmarks in your own environment should bedone to help make the best informed decisions.