50
VTT WORKING PAPERS 117 Paula Järvinen, Kai Puolamäki, Pekka Siltanen & Markus Ylikerälä Visual Analytics Final Report analytics visualization data applications tools

VTT WORKING PAPERS 117VTT CREATES BUSINESS FROM TECHNOLOGY�Technology�and�market�foresight�•�Strategic�research�•�Product�and�service�development�•�IPR�and�licensing�•�Assessments,�testing,�inspection,�certification�•�Technology�and�innovation�management�•�Technology�partnership
•�•�•���VTT�WO
RKIN
G�PA
PERS�117������VISU
AL�A
NA
LYTICS.�FIN
AL�R
EPOR
T
ISBN 978-951-38-7178-9 (URL: http://www.vtt.fi/publications/index.jsp)ISSN 1459-7683 (URL: http://www.vtt.fi/publications/index.jsp)
Paula Järvinen, Kai Puolamäki, Pekka Siltanen & Markus Ylikerälä
Visual AnalyticsFinal Report
VTT Working Papers
102 Stephen Fox. Ontological uncertainty and semantic uncertainty in global network organizations. 2008. 122 p.
103 Kati Tillander, Helena Järnström, Tuula Hakkarainen, Juha Laitinen, Mauri Mäkelä, & Panu Oksa. Palokohteiden savu-, noki- ja kemikaalijäämät ja niiden vaikutukset työturvallisuuteen. Polttokokeet ja altistumisen arviointi. 2008. 67 s.
104 Eija Kupi, Sanna-Kaisa Ilomäki, Virpi Sillanpää, Heli Talja & Antti Lönnqvist. Aineettoman pääoman riskienhallinta. Riskit ja riskienhallinnan käytännöt yrityksissä. 2008. 44 s.
105 Teemu Mutanen, Joni Niemi, Sami Nousiainen, Lauri Seitsonen & Teppo Veijonen. Cultural Event Recommendations. A Case Study. 2008. 17 p.
106 Hannele Holttinen. Tuulivoiman tuotantotilastot. Vuosiraportti 2007. 2008. 44 s. + liitt. 8 s.
107 Kari Keinänen, Jarkko Leino & Jani Suomalainen. Developing Keyboard Service for NoTA. 2008. 17 p. + app. 2 p.
108 Hannele Antikainen, Asta Bäck & Pirjo Näkki. Sosiaalisen median hyödyntäminen paikallisissa mediapalveluissa. 2008. 64 s.
109 Raine Hautala, Pekka Leviäkangas, Jukka Räsänen, Risto Öörni, Sanna Sonninen, Pasi Vahanne, Martti Hekkanen, Mikael Ohlström, Bengt Tammelin, Seppo Saku & Ari Venäläinen. Benefits of meteorological services in South Eastern Europe. An assessment of potential benefits in Albania, Bosnia-Herzegovina, FYR Macedonia, Moldova and Montenegro. 2008. 63 p. + app. 35 p.
110 Jaana Leikas. Ikääntyvät, teknologia ja etiikka. Näkökulmia ihmisen ja teknologian vuorovaikutustutkimukseen ja -suunnitteluun. 2008. 155 s.
111 Tomi J. Lindroos. Sectoral Approaches in the Case of the Iron and Steel Industry. 2008. 58 p. + app. 11 p.
112 Johan Mangs. A new apparatus for flame spread experiments. 2009. 50 p. + app. 27 p.
113 Stephen Fox & Brent Stucker. digiproneurship. New types of physical products and sustainable employment from digital product entrepreneurship. 2009. 29 p. + app. 6 p.
114 Päivi Parviainen, Juha Takalo, Susanna Teppola & Maarit Tihinen. Model-Driven Development. Processes and practices. 2009. 102 p. + app. 4 p.
115 Kim Björkman, Juho Frits, Janne Valkonen, Keijo Heljanko & Ilkka Niemelä. Model-based analysis of a stepwise shutdown logic. MODSAFE 2008 Work Report. 2009. 35 p. + app. 4 p
117 Paula Järvinen, Pekka Siltanen, Markus Ylikerälä & Kai Puolamäki. Visual analytics. Final report. 2009. 45 p. + app. 3 p.
analyticsvisualization
data
applicationstools

ISBN 978-951-38-7178-9 (URL: http://www.vtt.fi/publications/index.jsp) ISSN 1459-7683 (URL: http://www.vtt.fi/publications/index.jsp)
Copyright © VTT 2009
JULKAISIJA – UTGIVARE – PUBLISHER
VTT, Vuorimiehentie 5, PL 1000, 02044 VTT puh. vaihde 020 722 111, faksi 020 722 4374
VTT, Bergsmansvägen 5, PB 1000, 02044 VTT tel. växel 020 722 111, fax 020 722 4374
VTT Technical Research Centre of Finland, Vuorimiehentie 5, P.O. Box 1000, FI-02044 VTT, Finland phone internat. +358 20 722 111, fax +358 20 722 4374
Technical editing Leena Ukskoski

Series title, number and report code of publication
VTT Working Papers 117 VTT-WORK-117
Author(s) Paula Järvinen, Kai Puolamäki, Pekka Siltanen & Markus Ylikerälä Title Visual Analytics Final report Abstract The improvement of data storage devices and means to collect data has lead to accumulated data sources and there is a need for effective methods to extract knowledge from them.
Visual analytics is one approach to tackle this information overload problem. It has been defined as “the science of analytical reasoning supported by the interactive visual interface”. It provides visual tools to support analytical reasoning and decision making from data with interactive visualizations.
This report presents the findings of the joint project by VTT, TKK and Helsinki Institute of Information Technology (HIIT) around the topic in 2008. The report introduces the concept, the state-of-the-art of research and tools on the markets, presents the demonstration tool developed in the project and outlines roadmaps for industrial and consumer applications.
ISBN 978-951-38-7178-9 (URL: http://www.vtt.fi/publications/index.jsp)
Series title and ISSN Project number VTT Working Papers 1459-7683 (URL: http://www.vtt.fi/publications/index.jsp)
33993
Date Language Pages March 2009 English 45 p. + app. 3 p.
Name of project Commissioned by Visual Analytics
Keywords Publisher information visualization, visual analytics VTT Technical Research Centre of Finland
P.O. Box 1000, FI-02044 VTT, Finland Phone internat. +358 20 722 4520 Fax +358 20 722 4374


5
Preface
During the spring 2007 VTT Content engineering and visualization team (tk1061) arranged a series of internal seminars about information visualization. Among the covered topics arouse a new interesting research field visual analytics. A follow-on project was launched in 2008 in order to acquire more knowledge about the topic. In addition to the VTT Content engineering and visualization team Prof. Heikki Mannila and Dr. Kai Puolamäki from TKK and Helsinki Institute of Information Technology HIIT participated the project as tutors of information visualization and data analysis1 .
The objectives of the project were to get familiar with the new research field, organize workshops around the topic, establish connections among the actors in the field, launch new projects, create a demonstration application and collect the findings to a report.
The project arranged several workshops with TKK partners. During the workshops the ambiguous concept of visual analytics became in many ways clearer. In the course of the project TKK joined the EU VisMaster Coordinating Action Project around visual analytics bringing information of the state-of-the-art of research.
The ideas of visual analytics were introduced in VTT and to customers. The experience was that there seems to be a great interest in visual analytics kind of “intelligent visualizations”. Visual analytics has been now included to some projects and proposals.
This report presents the findings of the project containing
♦ introductions to information visualization (Chapter 1) and visual analytics (Chapter 2)
♦ state-of the-art of research, tools and software on the markets (Chapter 2)
♦ introduction to the building blocks of visual analytics: information visualization, data mining, analytical reasoning and integrating data sources (Chapter 3)
♦ description of the demonstration tool developed in the project (Chapter 4)
♦ roadmaps for industrial and consumer applications (Chapter 5).
In addition to the authors Heikki Mannila from TKK/HIIT and Hannu Kuukkanen, Kari Rainio and Seppo Valli from VTT contributed the project.
1 Members of Algorithmic Data Analysis Centre of Excellence (Algodan 2008–2013),
http://www.cs.helsinki.fi/research/algodan/.

6
Contents
Preface ........................................................................................................................... 5
1. Introduction ............................................................................................................... 8
2. Visual analytics ....................................................................................................... 10 2.1 Definition of visual analytics ...................................................................................................... 10 2.2 State of research in visual analytics.......................................................................................... 12 2.3 State-of-the-art of tools and software........................................................................................ 14
3. Building blocks of visual analytics ........................................................................... 16 3.1 Information visualization ........................................................................................................... 16
3.1.1 Human perception ...................................................................................................... 16 3.1.2 Data graphics ............................................................................................................. 18 3.1.3 Information visualization techniques........................................................................... 19
3.2 Data mining............................................................................................................................... 20 3.3 Integrating data sources ........................................................................................................... 23
4. Visual Analytics Experience prototype .................................................................... 26 4.1 Prototype requirements............................................................................................................. 26 4.2 Use case ”Intelligent Home System”......................................................................................... 28 4.3 Tool implementation.................................................................................................................. 29
5. Roadmap................................................................................................................. 31 5.1 Meta-roadmap and vision of the project.................................................................................... 31
5.1.1 Visualization today ..................................................................................................... 32 5.1.2 Visualization in short term (1–5 years) ....................................................................... 32 5.1.3 Visualization in long term ........................................................................................... 33
5.2 Sub-roadmap: Industrial applications........................................................................................ 35 5.2.1 Industrial applications today ....................................................................................... 35 5.2.2 Industrials applications: Short term ............................................................................ 36 5.2.3 Industrials applications: Long term............................................................................. 36
5.3 Sub-roadmap: Consumer applications...................................................................................... 38 5.3.1 Consumers applications: Today ................................................................................. 38 5.3.2 Consumers applications: Short term .......................................................................... 38 5.3.3 Consumers applications: Long term........................................................................... 39
7
6. Summary................................................................................................................. 41
Acknowledgements....................................................................................................... 43
References ................................................................................................................... 44
Appendix 1: Role of VTT in Visual Analytics

1. Introduction
8
1. Introduction
Information visualization is defined as “The use of computer-supported, interactive, visual representations of abstract data to amplify cognition” [Card et al. 1999]. The goal is to improve understanding of the data with graphical presentations. The principle behind information visualization is to utilize the powerful image processing capabilities of the human brain. Visualizations increase the human cognitive resources. They extend the working memory; reduce the search of information and enhance the recognition of patterns.
Information visualization has been an active research area since 1990. It has evolved from the use of computer graphics in scientific problems. The special issue of Computer Graphics on Visualization in Scientific Computing in 1987 is considered as the starting point. Since then there have been several conferences and workshops, co-sponsored by the IEEE Computer Society and ACM SIGGRAPH, devoted to the general topic, and special areas in the field. The “Visualization Time Line” is introduced in [Cook et al. 2007].
The driving forces of information visualization have been the growth of computing power, lowering computing costs, the development in user interaction technologies and the large amounts of information accumulated into databases. In the recent years internet technology, new rendering and user interface technologies, 3D and virtual environments, have activated the field. The recent advances and challenges of visualization are introduced in the report “Visualization Research Challenges” by U.S. National Science Foundation (NSF) and National Institutes of Health (NIH) [Johnson et al. 2006].
Information visualization has traditionally been divided into scientific visualization and visualization of abstract information, data visualization. Scientific visualization deals with large sets of scientific data to see phenomena in data. It handles mostly with physical data: human body, earth, molecules and with data that has a natural geometric structure, for instance wind flows. In scientific visualization the computer renders visible some properties of interest from the data. Data visualization handles abstract, non-physical information using abstract visualization structures like trees or graphs. It has applications with financial data, business information, document collections, web content and other abstract concepts. It renders visible properties of the objects of interest and can be combined with information access techniques.

1. Introduction
9
Visual analytics is the most recent field of information visualization. It has been defined as “the science of analytical reasoning supported by the interactive visual interface” [Thomas & Cook 2005]. It has origins in U.S. national security and is one approach to tackle the information overload problem caused by the improvement of data storage devices and means to collect data. It provides visual tools to support analytical reasoning and decision making from data with interactive visualizations, optimized for efficient human perception. It is a multi-disciplinary research area, combining information visualization science, data mining, mathematical and statistical methods, data management, user interface techniques, human perception and cognition research (Figure 1).
Figure 1. Building blocks of visual analytics.
The branches of information visualization have lots of overlapping goals and techniques. In this report we focus on visual analytics. We introduce the concept; review the state-of-the art of research and the tools and software on the markets. We introduce the main building blocks of visual analytics. We also introduce the visual analytics tool developed in the project and outline roadmaps for visual analytics in industrial applications and consumer applications.
Information visualization science
Visual Analytics
User interface techniques Cognition research
Mathematical and statistical methods Data mining
Data management and integration

2. Visual analytics
10
2. Visual analytics
2.1 Definition of visual analytics
The basic idea of visual analytics is to combine the strengths of automatic data analysis with the visual perception and analysis capabilities of the human user. It uses visualizations, user interaction and data analysis techniques to find insight from complex, conflicting and dynamic information. Visual analytics is especially focused on situations where the huge amount of data and the complexity of the problem make automatic reasoning impossible without human interaction.
The starting point for visual analytics is the report ”Illuminating the Path: the R&D Agenda for visual analytics” by U.S. National Science Foundation(NSF) and National Institutes of Health (NIH) [Thomas & Cook 2005]. It defines visual analytics as follows:
“Visual analytics is a science of analytical reasoning facilitated by interactive visual interfaces.”
“People use visual analytics tools and techniques to synthesize information and derive insight from massive, dynamic, ambiguous, and often conflicting data; detect the expected and discover the unexpected; provide timely, defensible and understandable assessments; and communicate assessment effectively for action. “
The report leaves the concept to a quite general level and since then several publications has appeared introducing the idea and challenges [Thomas & Cook 2006], [Keim et al. 2006], [Cook et al. 2007], [Wong 2007], [Keim et al. 2008].
The objective of visual analytics is to develop visual and interactive tools and techniques for reasoning and decision making from large data sets. The principle of a visual analytics tool has been summed up in the visual analysis mantra by Daniel Keim [Keim et al. 2006].
“Analyze First – Show the important – Zoom, Filter and Analyze Further – Details on demand”.
The visual analytics process is outlined in Figure 2 [Keim et al. 2008].

2. Visual analytics
11
Feedback loop
Knowledge
Model visualization
Model building
Parameter refinement
Data
Visualization
Models
Transformation
Mapping
User Interaction
Data mining
Figure 2. Visual analytics process.
Complex and heterogeneous data from different sources and various types and levels of quality need to be filtered, noise removed and transformed to be processed jointly. The data sources can range from well organized data bases to continuous input data streams. The data is processed and abstracted using mathematical, statistical and data mining algorithms and models. Visualizations highlight the important features, including commonalities and anomalies, making it easy for users to perceive new aspects of the data. Visualizations are optimized for efficient human perception taking into account the capabilities and limitations of the human visual system. Interactivity in visualizations allows users to explore the data and achieve new knowledge and insight.
A visual analytics tools supports
♦ showing different views to data: from raw data to data abstractions ♦ representations of large quantities of information in small space ♦ finding pattern from data: similarities, anomalies, relationships and events ♦ simulation, prediction, testing hypothesis ♦ data retrieval, browsing and exploration ♦ information extraction and distillation.
Figure 3 shows potential views to data of a visual analytics tool. Other examples are represented in [Aigner al. 2008] and [Keim et al. 2008].

2. Visual analytics
12
Figure 3. Visual analytics tool.
Application areas for visual analytics are everywhere where is a need for decision making based on accumulated data. Although the origin is in safety and security, applications can be found as well in industry, engineering, business, media and consumer applications.
2.2 State of research in visual analytics
The increasing international importance of the topic is reflected by the strong presence of visual analytics at leading international conferences such as IEEE Visualization, IEEE Symposium on Information Visualization, and the Eurographics/IEEE-VGTC Symposium on Visualization. In October 2006, the first IEEE Symposium on Visual Analytics Science and Technology2 has been organized. Partners of this consortium have been actively involved in these conferences. Visual analytics also found its way into major journals in this area. Special issues on visual analytics have appeared in IEEE Transactions on Visualization and Computer Graphics, Computer & Graphics, the International Journal for Geographical Information Science, and SIGKDD Explorations.
2 http://conferences.computer.org/vast/vast2006/.

2. Visual analytics
13
The highly prospective utility of visual analytics research has led to significant national and international activities in this area. In the United States, the National Institute of Health (NIH) and the National Science Foundation (NSF) recently published the “Visualization Research Challenges” report [Johnson et al. 2006], which lists visual analytics as one of the most important challenges for future research. The US Department of Homeland Security (DHS) started a research initiative on visual analytics for homeland security. The “National Visualization and Analytics Center” (NVAC)3, founded in 2004, coordinates these research efforts. The agenda for the US visual analytics research program is laid out in the book “Illuminating the Path” [Thomas & Cook 2005], which describes visual analytics research challenges focussing on security applications such as border security. In Canada, significant related research initiatives are under way and additional visual analytics programs supported by the Canadian government are prepared by Brian Fisher of Simon Fraser University4. In Australia, Peter Eades of University of Sydney is currently leading an initiative to launch a national visual analytics research initiative. All of these international initiatives have stated their support for a European Coordination Action on visual analytics.
In Europe, several national initiatives relating to visual analytics have been introduced or are in preparation. In Germany, the German Research Foundation DFG accepted a strategic research initiative on Scalable Visual Analytics5 in April 2007 proposed by a consortium of working groups6 led by Daniel Keim of University of Konstanz. The program is targeted to advance the national visual analytics research by supporting a number of individual research projects. In Switzerland, there are efforts underway to initiate a national centre for scientific visualization and visual analytics. In Austria, recently there has been introduced a research initiative on Visual Computing with specifically stated visual analytics relations within the Austrian FIT-IT program.
Data mining and machine learning research is in the focus of the KDNet7 and MLNet NoEs and the KDubiq8 CA. The visualization, analysis and management of mobility referenced to geography are in the focus of the FET-Open project GeoPKDD9. Disaster
3 http://nvac.pnl.gov/. 4 Visual Analytics for Safety and Security: NSERC Strategic Grant.
http://www.cs.ubc.ca/~fisher/VisAnalyticsNSERCproposalPublic.pdf. 5 http://infovis.uni-konstanz.de/spp/index.php?lang=en. 6 http://infovis.uni-konstanz.de/events/VisAnalyticsWs05/index.php. 7 IST-2001-33086 Knowledge Discovery Network of Excellence. http://www.kdnet.org/ 8 KDubiq – Knowledge Discovery in Ubiquitous Environments, IST-6FP-021321 Coordination Action,
http://www.kdubiq.org/. 9 Geographic Privacy-aware Knowledge Discovery and Delivery. IST-6FP-014915, 2005-2008,
http://www.geopkdd.eu/.

2. Visual analytics
14
and emergency management applications are in the focus of the OASIS10 and ESS projects11. Visualization problems related to information retrieval have been addressed in the DELOS12 NoE as part of the user interface work done within that project.
VisMaster Coordinating Action Project13 began on 2008 [Keim 2008]. The purpose of the VisMaster is to bring together a critical mass of interdisciplinary European researchers to scope the prospects for a European visual analytics initiative.
2.3 State-of-the-art of tools and software
Information visualizations are usually implemented with specialized software. Some of these have been released as open source software, having often origins in universities. There are also many proprietary software packages available. They can be categorized e.g. in the following way:
♦ Office tools. The most familiar and used visualization tool is Excel with its bar charts and pie representations.
♦ Business intelligence tools offering visualizations of the business status and the future for enterprise management, often connected to the company enterprise management system.
♦ Statistical and mathematical tools. Statistical analysis has a long history of visualizing the results as time series, bar charts, plots and histograms. Examples of tools providing statistical and mathematical visualization are R14 and Mahtlab15 , tools for statistical computing and graphics.
♦ Visualization-related libraries and software packages. Prefuse16 visualization toolkit for creating rich interactive data visualizations, GGobi17, an open source visualization program for exploring high-dimensional data, XGVis18, an interactive multidimensional scaling (MDS) software.
10 OASIS: Open Advanced System for Improved crisiS management. Integrated Project, IST-2003-
004677, 2004–2008, http://www.oasis-fp6.org. 11 ESS: Emergency Support System. FP7-SEC-2007-1 Integrated Project currently at final stage of
selection process. 12 DELOS Network of Excellence on Digital Libraries, supported under FP5 and FP6, http://www.delos.info/. 13 VisMaster, a Coordinating Action Project within the 7th Framework Programme. http://www.vismaster.eu/ 14 http://www.r-project.org/. 15 http://www.mathworks.com. 16 http://prefuse.org/. 17 http://www.ggobi.org. 18 http://public.research.att.com/~stat/xgobi/xgvis.html.

2. Visual analytics
15
♦ Algorithmic tools developed by the research communities based on some algorithm. An example is Graphviz19 for drawing graphs.
♦ Visual data mining tools. Visual data mining creates visualizations to reveal hidden patterns from data sets. The need of new methods in data analysis has the launched the field. Several products are on the markets, often focused on “Business intelligence” such as marketing, risk analysis, selling analyses and customer management. The field is closely related to visual analytics.
♦ Web tools and packages. An increasing amount of tools is available in the web, either open source packages for download or on-site use. With the tools users can create more or less fancy visualizations from data. See for example Many Eyes20 , an IBM application for social data analysis.
♦ Scientific visualization tools for modelling some complicated physical phenomenon.
19 http://www.graphviz.org/. 20 http://manyeyes.alphaworks.ibm.com.

3. Building blocks of visual analytics
16
3. Building blocks of visual analytics
3.1 Information visualization
This chapter represents a selection of topics of information visualization research to be considered in visual analytics: human perception, data graphics and data visualization techniques. The content is mainly based on the information visualization course held in Helsinki University of Technology (TKK) in spring 200721 by Kai Puolamäki, the books about Information Visualization by Colin Ware [Ware 2004] and the fundamental report of visual analytics “Illuminating the path” [Thomas & Cook 2005].
3.1.1 Human perception
Designing effective visualizations require knowledge about the capabilities and limits of the human information and visual system. Visualizations, often designed by application developers without knowledge about human perceptual and cognitive principles or graphic design can lead to poor or misleading ad hoc solutions. If the information is presented in an inappropriate way it can in the worst case lead to incorrect decisions. On the opposite, good visualizations can improve the efficiency, effectiveness, and capabilities of decision makers and analysts.
Human perception research studies the understanding of sensory information. There are several types of perception but the most important from in information visualization is the visual perception. Human visual system is a pattern seeker of enormous power. The human eye and brain form together an efficient parallel processor. On the other hand, the visual system has its limitations. Understanding the rules of the human visual perception helps us to display information effectively. We can present data in such a way that the important and informative patterns stand out. If we disobey these rules, our data will be incomprehensive of misleading.
21 http://www.cis.hut.fi/Opinnot/T-61.5010/.

3. Building blocks of visual analytics
17
The study of human perception has advanced enormously over the past decades and great deal of the results is relevant to information visualization. But much of the information is not yet accessible to information visualization designers. There is still a long way to convert the findings to design principles for the everyday use. An excellent source for more information is the book of Information Visualization by Colin Ware [Ware 2004].
Important aspects of human perception for the effectiveness of visualizations and user interaction are:
♦ Processing visual symbols. Some symbols are understood without learning and processing them is fast (sensory), others are learned and easy to forget (arbitrary). For example letters and numbers are arbitrary symbols, a line connecting two areas is a sensory symbol.
♦ Human perceptual processing. It proceeds in stages with different rates: starting with rapid parallel processing including extraction of features, orientation, colour, texture and movement, continues with pattern perception, and ends up to slow sequential goal-driven processing.
♦ Human eye properties including aquities (the ability to see detail), contrast sensitivity, colour vision, perception of shape or motion with colours.
♦ Visual attention, the process of seeking out visual stimuli and focusing on them. Some visual objects are processed pre-attentively, before conscious attention. These objects seem to “pop out”. Bolding text is an example of pre-attentive features. Othes are line orientation, length, width, co linearity, size, curvature, spatial grouping, added marks, numerosity (up to four), colour (hue, intensity), blur motion (flicker, direction) and, spatial position (2d position, stereo depth, convex/concave shape of shading).
♦ Pattern perception. Pattern perception is summoned up in Gestalt laws that can be translated directly into design principles. They include similarity, continuation, proximity or nearness, symmetry, closure and relative size. Visual grammars like UML are applications of Gestalt laws.
♦ Perception of visual objects. There are two complementary approaches of object perception, image-based theory founded on efficient image recognition and structure-based theory suggesting that images are recognised as structures build from three dimensional primitives. Neither theory can explain all cases of unit recognition.
♦ Perception of distance and size. There is no general theory of depth perception but several depth cues, principles that can be used to create distance and depth effects, have been recognized including occlusion, perspective, depth of focus, cast shadows, surface shading, surface contours, motion, stereoscopic depth.

3. Building blocks of visual analytics
18
♦ Visual interaction bringing a dialogue between the user and data. Interactive visualizations can be characterized by a feedback loop divided into three phases: 1) data manipulation, 2) view refinement and navigation (exploration and navigation), 3) problem solving loop. Each step has a time scale for the human action reflecting what the user is cognitively and perceptually capable of doing.
3.1.2 Data graphics
The theory of data graphics introduces principles for efficient visual representations. Many of them are developed by Edward Tufte [Tufte 1982]. Tufte’s principles were originally for graphics design but the principles are valid to computer based visualizations as well. They are not an exact theory but more a collection of rules-of-thumb. Later, cognition research has confirmed the principles. In general, representations should match the task to be performed by the user. The visual representation should provide neither more nor less information than that is needed for the task at hand. Additional information may be distracting and makes the task more difficult. Also, the proportions of the visual representation should match the information being represented.
The most important principles of data graphics are introduced here. Attention to data. The main purpose of visualization is to show the data. Data-ink
ratio is a measure for the effectiveness of the graphic of showing the data.
data-ink ratio = ink used to represent the data / total ink used to graphics.
The larger the share of data-ink is, the more the focus is on data. If the ratio is low, some graphic can be removed without the loss of information.
Avoid chartjunk. Chartjunk is the decoration of graphics that does not tell the viewer anything new. The purpose of chartjunk may be to make the graphics appear more scientific or lively (or to give the designer an opportunity to exercise artistic skills). Gridlines, decorations, facejunk, vibrations and redundancy belongs to chartjunk. In the worst cases the design overwhelms the data.
Care with multifunction graphics. Multifunction graphical elements can effectively display complex, multivariate data. A map that shows coordinate data and other properties with shading and colour is an example of multifunction graphics. The complexity of multifunction elements can easily turn data graphics into graphical puzzles.
Lie factor. Graphics should be proportional to the numerical quantities. The lie factor is a measure for the proportion.
lie factor = size of effect shown in graphics / size of effect in data.
If the lie factor is one, the graphic is accurately presenting the underlying numbers.

3. Building blocks of visual analytics
19
3.1.3 Information visualization techniques
Several visualization techniques have been developed for mapping data to visual presentations. The techniques differ depending on the properties of the data and the purpose of use. The dimensionality of the data, the data structure and the size of data sets are the main factors that determine the appropriate visualization technique. A selection of the huge variety of visualization techniques are introduced here. A good source for visualization techniques is the book Readings in Information Visualization – Using Vision to Think” [Card et al. 1999].
Line graphs are used for displaying single-valued or continuous functions of one variable. Line graphs are applicable only with few dimensions.
Scatter plot is probably the most popular visual data mining tool. Scatter plots are good at finding outliers and seeing clusters and correlations. Scatter plots are inadequate for higher dimensions.
Bar charts are normally used for presentation purposes. Histograms are bar charts where the value for the bar represents the sum of data points. Multiple bar charts can be used effectively in data mining.
Glyphs are symbols that are used to describe multivariate discrete data. A single glyph corresponds to one sample in a data set. Data values are mapped to the visual properties of the glyph. Glyphs can be constructed so that they are perceived pre-attentively using visual features that “pop out”. Examples of glyphs are Chernoff faces where data is mapped to facial expressions, star glyphs, where the dimensions are represented as angular spokes radiating from the center and stick figure icons where data dimensions are mapped to the rotation angles of the limbs.
Clustering attempts to show possible clusters in data sets. Several techniques exist, both algorithmic solutions and visual methods.
In pixel oriented visualization techniques each attribute value is represented by one pixel. If the data has a hierarchical structure it can be represented as trees and graphs. There
are two major approaches: node link diagrams and enclosure (for example treemaps). The most used are node-link diagrams, including the traditional vertical or horizontal hierarchies, H-trees, radial views, hyperbolic (star) trees and concept maps. There are plenty of drawing algorithms for node-link diagrams optimizing the graph layout.
With large data sets a special problems is how to represent, navigate and find details in them (Focus + context problem). The basic principle by Ben Shneiderman [Schneiderman 1996] is
“Overview first, zoom and filter, details on demand”.
Several visualization techniques have been developed based on this principle:
♦ Ellison techniques. Part of the structure are hidden until they are needed (Furnas’ Fisheye view, Cone Tree)

3. Building blocks of visual analytics
20
♦ Distortion techniques. Magnify regions of interest, decrease space to irrelevant regions (Table lens)
♦ Rapid zooming techniques. User zooms in and out of regions of interest (Pad++)
♦ Multiple windows. Some windows show overview and others content (Spiral Calendar)
♦ Micro-macro readings. A good static visualization supports focus.
Other approaches to visualize large data sets are dense layouts and 3D layouts, for instance cone tree and hyperbolic tree (star tree) in 3D and information pyramid.
Often, real world data is multidimensional consisting of many data items or without clean hierarchy. Dimension reduction aims at projecting data into low dimensional space (1D-3D) while maintaining the correct relations between the nodes. There are several methods with different optimization goals and complexities. Among them are
♦ Multidimensional scaling (MDS) trying to preserve a measure of similarity (or dissimilarity or distance) between pairs of data points. It can be used as an explanatory visualization technique to find the structure of data and testing hypothesis. It has the roots in psychology
♦ Principal component analysis (PCA). It tries to find a linear subspace that has maximal variance. It is based on matrix algebra. It is usually the first dimension reduction method to try.
Other methods to mention: Sammon’s projection – a variation of the MDS, pays more attention to short distances, Isometric mapping of data manifolds (ISOMAP) – a graph-based method (of the MDS spirit), Curvilinear component analysis (CCA) – MDS-like method that tries to preserve distances in small neighborhoods, Maximum variance unfolding – maximizes variance with the constraint that the short distances are preserved, Self-organizing map (SOM) – a flexible and scalable method that tries a surface that passes through all data points (developed at TKK), Independent component analysis (ICA) – a fast linear method, suitable for some applications.
3.2 Data mining
Data mining22 has been be defined as “a science of extracting useful information from large data sets or databases”. It shares the goals and techniques with visual analytics and uses much abstract visualization to reveal hidden patterns from data sets. Data mining
22 The introduction to data mining is based on the slides related to the book “Introduction to Data
Mining” [Tan et al. 2006] and an interview of prof. Heikki Mannila 7.12.2006.

3. Building blocks of visual analytics
21
combines machine learning, artificial intelligence, pattern recognition, statistics, and data base systems.
The data mining is an iterative process starting with selecting the target data from the raw material, pre-processing and transforming it into a suitable form. After that the data is run by the data mining algorithm that creates patterns from the data. The user interpreters and evaluates the results and starts a new iteration with possible modifications on the raw data, algorithm and algorithm parameters. The process is shown in Figure 4.
Figure 4. The data mining process (edited from original in [Tan et al. 2006]).
Examples of data sources used in data mining are web data, purchase data, e-commerce transactions, banking data, credit card transactions, sensor data, industry process and maintenance data, satellites, telescopes, gene data and scientific simulations.
Data mining uses several data types: data base records, matrix data, documents, graphs, links, transaction data, transaction sequences, sequence data, genomes, spatio-temporal data. The quality of data causes problems. The data can contain noise, there are missing values and duplicate data. Often a data cleaning phase is required before using the data. Also other pre-processing is required such as data aggregation, sampling, dimensionality reduction, subset selection, feature creation, attribute transformation. A new challenging trend in data mining is combining data from diverse data sources.
Data
Patterns
Transformed data
Preprocessed data
Target data
Selection
Preprocessing
Transformation
Data mining
Interpretation and evaluation
Knowledge

3. Building blocks of visual analytics
22
The methods used in data mining are divided into
♦ Prediction methods that use variables to predict unknown but predefined or selected object of interest
♦ Description methods for finding patterns that describe data in general.
The most important prediction methods are classification and regression. In classification a model for a class attribute as a function of the values of other
attributes (Training set) is created. Then unseen records are assigned to the class. The accuracy of the models is evaluated with a test set. Several techniques are used including decision tree based methods, rule based methods, memory based reasoning, neural networks, naive bayes and bayesian belief networks, support vector machines. Classification is a much used method and also commercial applications are available. Examples of classification applications are direct marketing, credit card fraud detection, customer analysis and sky survey cataloguing.
Regression predicts a value of a continuous variable based on other variables. It uses linear or nonlinear models. The area is studied in statistics, and neural networks. It has examples in predicting sales based on advertising expenditure, predicting wind as a function of temperature or humidity and in stock market time series.
Description methods include clustering, association rule discovery, sequential pattern discovery and deviation detection.
In clustering a set of data points, each having a set of attributes and a similarity measure among is created and the algorithm finds clusters with more or less similar data to one another. The field has been an active research topic and lots of (enough) algorithms are available. Application examples of clustering are customer segmentation, document clustering and stock data observation.
The goal in association rule discovery is prediction without a selected target. It predicts occurrences of some item based on occurrences of other items (buyers of milk and diapers also by beer) produce dependency rules. The difficulty with the method is that it produces easily too many rules and it is difficult to find the important ones. Association rule discovery has introduced few successful applications. Some examples are marketing and sales promotion, supermarket self management, inventory management and sales prediction.
Sequential pattern discovery concentrates for finding objects that are associated with their own timelines of events. It finds rules that predict strong sequential dependencies among different events. Several algorithms are available. Applications are in telecommunications alarm logs analysis, sales transaction sequences. A promising new application area could be process monitoring from sensor data.
Deviation/anomaly detection searches significant exceptions from normal behaviour. The interest is in single observations. Application examples are in credit card fraud detection, network intrusion detection and process anomalies detection.

3. Building blocks of visual analytics
23
Data mining has been studied intensively and several algorithms exist. Lots of tools and commercial applications are available, some of which are highly competitive, for instance Customer Relationship Management (CRM). Sensor data and process industry could offer new potential application areas and needs.
It has been recognized recently that visualization and interaction are highly beneficial in arriving at optimal results. The role of information visualization is communicating the results of the automatic analysis. Visualizations represent the found patterns to the user. Another important feature is the ability to explain the patterns either by providing easy ways to explore and summarize data, or to demonstrate the reasoning logic behind.
The visualization, data analysis and user interaction has evolved separately in the past. The recent development has integrated the fields (present). In the future the fields will integrate to visual analytics solutions (Figure 5).
Other challenges lay in the following areas: multiple sources of data, dimensionality, complex and heterogeneous data, data quality, missing values, scalability of the algorithms, data ownership and distribution, privacy preservation and streaming data.
Figure 5. State-of-the art of visual data mining. Based on [Aigner et al. 2008].
3.3 Integrating data sources
Integrating data from different data sources is the foundation on which visual analytics applications are often built. In order to make visualizations, data must be represented in a format suitable for applying the analysis algorithms.
Data used in visualization can be characterized from multiple perspectives [Thomas & Cook 2005]:
♦ Data type: numeric, non-numeric, or both
Visual-ization methds
Data analysis
User interaction Analysis
User interaction
Visual-ization
Visual analytics
past present future

3. Building blocks of visual analytics
24
♦ Level of structure: from completely structured, such as categorical data, to completely unstructured, such as narrative description on a web page. Unstructured doesn’t always mean that there’s no structure, instead it means that the structure is only interpretable by human
♦ Geospatial characteristics: data are associated with a particular location or region
♦ Temporal characteristics: data of all types may have a temporal association, and this association may be either discrete or continuous
♦ Language data: language data can be processed without any acknowledgment of their linguistic structure because meaning is inherent in the communication of the originator
♦ Image and video data: one of the key challenges for visual analytics is to derive semantic content or meaning from images in real time.
Traditional relational databases are usually well structured, but the structures and concepts used in the data bases are database-specific and require extensive integration work when used in e.g. visual analytics applications. However, when applying visual analytics into existing industrial data, the data to be used is normally stored in legacy databases.
Problems that are faced when integrating legacy databases include the following:
♦ Syntactic problems: differences in representation format of data
♦ Structural problems: the native model or structure to store data differs in the databases
♦ Semantic problems: differences in interpretation of the 'meaning' of data
♦ System problems: use of different operating system, software versions, or hardware platforms.
Syntactic problems can in many cases be avoided by using standard or de facto standard data formats (e.g. XML or Excel) when exporting applications from legacy databases. These export formats are normally available on all modern applications, but using them does not solve structural or semantic problems: same information is often represented in different structures or named differently in two legacy systems. These problems are being tackled using semantic ontology based integration [Wache et al. 2001].
In practise, probably the biggest integration problems when trying to apply visual analytics are the problems related to the system problems. Users of the visual analytics tools should be able to use familiar user interfaces, or at least switch easily between visual analytics tools and legacy applications. This is not easily achieved by exporting data files between applications, but by direct integration using application programming interfaces.

3. Building blocks of visual analytics
25
Integration needs give requirements to the visual analytics tools. Building specific visualisation tools for every use case is not a durable solution in a long run. Instead visual analytics platforms, enabling integration of different data sources, analysis methods and visualizations are needed. Such a platform should enable implementation of reusable integration components for different purposes instead of making point-to-point integrations. (Figure 6).
Figure 6. Point to point integrations vs. generic visual analytics platform.
The platform should contain tools for creating software and data modelling components for integrating different types of data sources, via file import or direct application interface programming. It should also include different visualization components, allowing different types of visualization to be used for different analysis methods.
Data source
AnalysisMethod 2
Visualisation 2
Data Source 2
Visualisation
AnalysisMethod
Data source
AnalysisMethod 2
Visualisation 2
Data Source 2
Visualisation
AnalysisMethod
Visual AnalyticsPlatform
4. Visual Analytics Experience prototype
26
4. Visual Analytics Experience prototype
A demonstration application called the Visual Analytics Experience was developed During the Visual Analytics project. The idea was to create a tool that allows users to explore data in different ways until something interesting shows up. The tool would give a good overview to data, allow the user perform analysis, navigate within interactive visualizations and see details.
The tool development started with requirement specification. It was noticed that the analysis and visualization needs vary depending of application context and data sources available. A use case “Intelligent Home System” for planning and monitoring house energy management was specified to delimit the scope.
The project schedule did not allow finalising the application but the work helped to clarify the ambiguous concept of visual analytics. The time devoted to the tool went mainly for building the interoperability of the tool components. Many required features were nevertheless implemented and the prototype gives a good starting point for further development.
4.1 Prototype requirements
Overview to data. The tool gives a good visual overview to the data. There can be several overview visualizations depending on what is relevant to the application. The data can be shown in some context, for instance on maps, diagrams or virtual models.
Analyses. The tool includes a selection of analyses: The basic statistical descriptors and analyzes, and data mining algorithms: variances, min, max, correlations, PCA analysis, graphs, scatter plots and classifications. Analysing can be done with varying parameters.
User interaction. The visualizations of the results of the analyses are interactive. The user can navigate, zoom details, and crop areas of interest for further analysis and visualizations. The user can ask details of the data from the analysis/visualization results.
Access to raw data. The user is given access to the raw data behind some area of interest.
4. Visual Analytics Experience prototype
27
Validation. The tool makes possible to validate hypothesis: if some reasoning is valid with a selected data set it can be tested if it is also valid with the rest of the data.
Data source selection and integration. The data to be analysed can be combined from several data sources:
♦ Raw data consisting of the data of the objects of interest. ♦ Descriptive data including product models, metadata, ontologies and documentation. ♦ Background data that can be used in analysis or to explain the phenomena.
The possibility to save the analysis results was also a desired feature for the tool. Requirement for the implementation were
♦ a lightweight web tool with easy data integration
♦ the tool should be built up from open source components. Especially the analysis should be done with some existing software packages, for instance R or Mathlab.
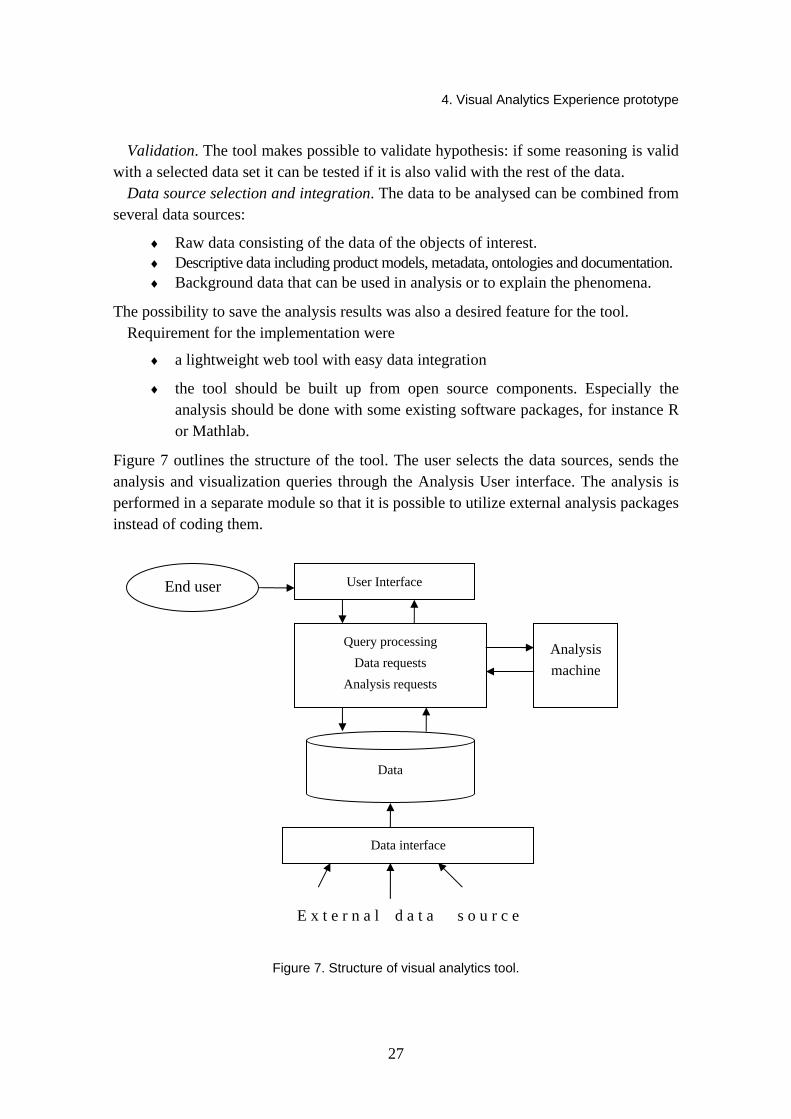
Figure 7 outlines the structure of the tool. The user selects the data sources, sends the analysis and visualization queries through the Analysis User interface. The analysis is performed in a separate module so that it is possible to utilize external analysis packages instead of coding them.
Figure 7. Structure of visual analytics tool.
End user
Query processing Data requests
Analysis requests
Data
Analysis machine
Data interface
E x t e r n a l d a t a s o u r c e
User Interface

4. Visual Analytics Experience prototype
28
4.2 Use case ”Intelligent Home System”
The “Intelligent Home System” visual analysics tool is supposed to give answers to questions like
♦ Energy costs are too big, how to save? ♦ Is something wrong? If so, what is the problem?
Measurements from energy consumption, room temperatures and water consumption from different spaces of the house and from individual devices are collected to a time series monitoring database. A product model of the house and 2D/3D images of the house layout is available. Outdoor temperatures are used as reference data.
The user can browse the house layouts showing the measurement points and the status of them (Figure 8). From the layouts the user can select measurements of interest and perform the analysis time series, scatterplots and correlations (Figure 9). The analysis results are visualized and the user can choose from the resulting visualizations areas of interest for further analysis. Also the raw data from selected measurements are available.
Figure 8. House layout with measurement points.

4. Visual Analytics Experience prototype
29
Figure 9. Analysis results.
4.3 Tool implementation
Visual Analytics Experience was built on Spring Framework (http://www.springframe work.org/). Spring Framework enables integration of heterogeneous software components thus integration of networked and distributed resources.
Spring Framework allows building of graphical user interface (GUI) with networked Model View Control (MVC) design pattern. As a result, utilizing the web browser as GUI was taken for granted. The web browser as GUI enables accessing of Visual Analytics Experience virtually from anywhere without pre installing of any software. The main benefits are enabling using Visual Analytics Experience on-demand and platform neutrality.
For accessing data, databases are de-facto and Spring Framework enables this off the shelf. Currently MySQL (http://www.mysql.com/) is utilized. But, we are also keen on utilizing Simantics (https://www.simantics.org/) not only as database but also as a central building block of Visual Analytics Experience.
R (http://www.r-project.org/) was chosen for the analysis tool because one of our tutors was suggesting it as a common tool but e.g. Matlab (http://www.mathworks.com/) could also be chosen. Correlation, Principal Component Analysis (PCA) and clustering methods were chosen as the main analysis tool and the connection between the Visual Analytics Experience and R is now implemented. For the demonstration purposes correlation was used.

4. Visual Analytics Experience prototype
30
Figure 10 shows the architecture of the implemented tool.
Figure 10. Visual Analytics Experience implementation.

5. Roadmap
31
5. Roadmap
The visualization roadmap consists of four separate roadmaps; the first of them is a so called meta-roadmap that combines the information of the sub-roadmaps and two sub-roadmaps, each representing more detailed information on one of the focus areas. The focus areas studied here are: visualization in industrial applications and visualization in consumer applications. The structure of the visualization roadmaps is shown in Figure 11.
Figure 11. Structure of the visualization roadmap.
5.1 Meta-roadmap and vision of the project
The vision of the meta-roadmap and at the same time the vision of the whole project for the next ten years – until year 2017 – is the following:
Interactive visualizations are being used in most decision tasks. Visualization allows making better decisions based on well formulated predictions and reasoning. The underlining databases are invisible to the user. The visual analytics tools are integrated parts of information systems and can be used anywhere and anytime.
Drivers. The development of visualization is driven by the need to have better visual user interfaces because of the information overflow in modern society. Another driver comes in form of enabling technologies: advances in hardware and software technologies enabling to create more effective visualizations of more complicated data. Not so easily recognized, but an important driver, are the security issues: authorities and
Visualization roadmap
Industrial applications Consumer applications
Visualization roadmap
Industrial applications Consumer applications

5. Roadmap
32
private companies must handle huge masses of information when handling security threats; a task that requires advanced decision support tools.
The meta-roadmap is shown in Figure 12. The following chapters give a more detailed explanation of the roadmap figure.
5.1.1 Visualization today
Technology. Currently visualization applications are mostly used on personal computers or in more complex cases the visualizations are computed using more powerful computers or networked computer grids. Software technology development on the area has traditionally mostly concerned about algorithm research.
Products and solutions: Business visualizations can be seen as specialised visual analytics applications. They are normally made on simple spreadsheet software, such as MS Excel, or more complex analysis is based on specialised business analysis software. There are some general open source visualization tools, e.g. VTK toolkit, and some commercial tools, such as AVS and Iris Explorer. Different data mining applications have their own visualization user interfaces. However, mostly the visualizations used are either static pictures without user interaction or specialised interactive tools made for one purpose.
Market: Visualizations are today often used in marketing, e.g. showing product properties or comparing them with the other products, however visual analytics applications are quire rare. Media uses quite a lot of visualizations, for showing complex information, such as weather reports, or visualising connections. Visualizations are used interactively for analysing e.g. election results; however they can be seen as a series of generated visualizations, not applications of real visual analytics process. In business applications visualization is used e.g. as a decision support tool or for showing business results in an easily understandable form. Also in the business applications real visual analytics software are not yet on the market.
5.1.2 Visualization in short term (1–5 years)
Technology. In short term the visualization will be influenced greatly by the human computer interaction research. Since the need for visualization grows, also the need for good quality interfaces grows, meaning that visual analytics will become more important. Traditional data mining applications will have better visualization capabilities. On the software engineering side, the programmable graphics hardware will give more computing speed when creating visualizations. Since the need for creating interactive visualization grows, also the need for generic tools for making and combining different interactive visualizations rises. Also the need for creating general visualization platforms creates needs for standardising the way the information is visualized and the results are represented.

5. Roadmap
33
Products and solutions: The visualization applications will be used more often in the web environment. Also the popular web tools, such as search engines will have visual representations of their contents. The number of industrial applications, such as analysis of the sensor data, is expected to have more visual user interfaces in the near future. Also it is expected that governmental organisation will be using more visualizations is their internal applications, such as visualising the simulated effects of political decisions.
Market: New market will appear in short term in the engineering and manufacturing applications because of the developing sensor technology. The growing need for the security related applications is expected to establish new markets in the public sector, and need e.g. for better search result visualizations creates new markets in web applications.
5.1.3 Visualization in long term
Technology. In the long run the technologies in sight affecting visualization are new user interface technologies. The growing use of mobile terminals and other new devices, in co-operation with human computer interaction research create new opportunities for making good visual representations.
Products and solutions: Visualization will be part of all software handling complex data. It gives better decision support and support for collaborative decision making. In the long run visual analytics methods allow more intelligence to be added into visualization, making a change from information visualization into knowledge visualization.
Market: New markets are expected to be found in the education sector and also in entertainment and even in art. In the industrial and commercial applications visual analytics tools will be the implemented in most of the tools that are used to analyse large quantities of data.

Gov
erm
ents
ervi
ces
and
appl
icat
ions
Indu
stria
luse
rint
erfa
ces
Web
app
licat
ions
Driv
ers
Prod
ucts
and
solu
tions
Tech
nolo
gies
Mar
kets
Algo
rithm
rese
arch
Alg
orith
mre
sear
ch
Sta
ndar
dsS
tand
ards
HC
I res
earc
hH
CI r
esea
rch
Ope
nso
urce
tool
s: V
TK T
oolk
it, R
Com
mer
cial
tool
s: A
VS, I
ris E
xplo
rer
Col
labo
rativ
ede
cisi
onsu
ppor
tus
ing
visu
alis
atio
n
Prog
ram
mab
legr
aphi
csha
rdw
are
Prog
ram
mab
legr
aphi
csha
rdw
are
Toda
yLo
ng te
rmSh
ort t
erm
Kno
wle
dge
visu
aliz
atio
n
Pro
gres
s in
har
dwar
e an
d so
ftwar
e te
chno
logi
es
Info
rmat
ion
over
flow
Info
rmat
ion
over
flow
Nee
d fo
r bet
ter u
ser i
nter
face
sN
eed
for b
ette
r use
r int
erfa
ces
Secu
rity
issu
esSe
curit
y is
sues
Pub
licse
ctor
Publ
icse
ctor
Bus
ines
s an
alys
tsBu
sine
ss a
naly
sts
Visu
al a
naly
tics
Visu
al a
naly
tics
Exce
l, fe
wsp
ecia
lised
softw
are
Web
app
licat
ion
deve
lope
rs
Visu
alis
atio
npa
rtof
all
softw
are
hand
ling
com
plex
data
Med
ia c
onte
ntpr
oduc
ers
Med
ia c
onte
ntpr
oduc
ers
Sear
chre
sult
visu
alis
atio
n
Dat
a m
inin
gan
d vi
sual
iz. m
erge
Dat
a m
inin
gan
d vi
sual
iz. m
erge
Mob
ile te
rmin
als
Mob
ile te
rmin
als
Mar
ketin
gM
arke
ting
Ent
erta
inm
ent,
art
Eng
inee
ring,
man
ufac
turin
gEd
ucat
ion
New
hum
anin
tera
ctio
nde
vice
sN
ew h
uman
inte
ract
ion
devi
ces
VISI
ON
Visu
alis
atio
non
per
sona
lco
mpu
ters
cree
n.
Vis
ualis
atio
non
per
sona
lco
mpu
ters
cree
n.
Gov
erm
ents
ervi
ces
and
appl
icat
ions
Gov
erm
ents
ervi
ces
and
appl
icat
ions
Indu
stria
luse
rint
erfa
ces
Web
app
licat
ions
Web
app
licat
ions
Driv
ers
Prod
ucts
and
solu
tions
Tech
nolo
gies
Mar
kets
Algo
rithm
rese
arch
Alg
orith
mre
sear
ch
Sta
ndar
dsS
tand
ards
HC
I res
earc
hH
CI r
esea
rch
Ope
nso
urce
tool
s: V
TK T
oolk
it, R
Com
mer
cial
tool
s: A
VS, I
ris E
xplo
rer
Col
labo
rativ
ede
cisi
onsu
ppor
tus
ing
visu
alis
atio
n
Prog
ram
mab
legr
aphi
csha
rdw
are
Prog
ram
mab
legr
aphi
csha
rdw
are
Toda
yLo
ng te
rmSh
ort t
erm
Kno
wle
dge
visu
aliz
atio
n
Pro
gres
s in
har
dwar
e an
d so
ftwar
e te
chno
logi
es
Info
rmat
ion
over
flow
Info
rmat
ion
over
flow
Nee
d fo
r bet
ter u
ser i
nter
face
sN
eed
for b
ette
r use
r int
erfa
ces
Secu
rity
issu
esSe
curit
y is
sues
Pub
licse
ctor
Publ
icse
ctor
Bus
ines
s an
alys
tsBu
sine
ss a
naly
sts
Visu
al a
naly
tics
Visu
al a
naly
tics
Exce
l, fe
wsp
ecia
lised
softw
are
Web
app
licat
ion
deve
lope
rsW
eb a
pplic
atio
nde
velo
pers
Visu
alis
atio
npa
rtof
all
softw
are
hand
ling
com
plex
data
Med
ia c
onte
ntpr
oduc
ers
Med
ia c
onte
ntpr
oduc
ers
Sear
chre
sult
visu
alis
atio
n
Dat
a m
inin
gan
d vi
sual
iz. m
erge
Dat
a m
inin
gan
d vi
sual
iz. m
erge
Mob
ile te
rmin
als
Mob
ile te
rmin
als
Mar
ketin
gM
arke
ting
Ent
erta
inm
ent,
art
Ent
erta
inm
ent,
art
Eng
inee
ring,
man
ufac
turin
gEd
ucat
ion
Educ
atio
n
New
hum
anin
tera
ctio
nde
vice
sN
ew h
uman
inte
ract
ion
devi
ces
VISI
ON
VISI
ON
Visu
alis
atio
non
per
sona
lco
mpu
ters
cree
n.
Vis
ualis
atio
non
per
sona
lco
mpu
ters
cree
n.
Figu
re 1
2. V
isua
lizat
ion
met
a-ro
adm
ap.
5. Roadmap
34

5. Roadmap
35
5.2 Sub-roadmap: Industrial applications
The vision of using visualization in industrial applications until year 2017 is the following:
Interactive visualizations are being used for making decisions that need combining information from different business applications and engineering applications. New interaction techniques are used to make visualizations interactive enabling the use of visual analytics widely.
Drivers. The need for using visualization in industrial applications comes from the information overflow. Different kinds of sensors are cheap to install but the data they collect is rarely utilised properly. This creates information overflow that is not currently solved. Simultaneously, business models of the machinery manufacturing companies are shifting from manufacturing towards product life cycle support. This means that manufacturing companies are taking responsibility for the whole lifecycle of the product, generating new interest in utilising sensor data. Also, increasing use of simulation techniques gives new needs for visualising the simulation results.
The roadmap for industrial applications is shown Figure 13. The following chapters give a more detailed explanation of the roadmap.
5.2.1 Industrial applications today
Markets. Current market in the industrial sector is dominated by the business applications and on the other hand specialized engineering tools, such as 3D CAD and CFD tools. The current trend of offering business applications as a service (SaaS) will give business opportunities for web based visualization tools also.
Technologies. Today visualization is used mostly in product design for visualising 3D models of the product or for simulating the interaction of fluids or gases using computational fluid dynamics (CFD) algorithms. Normally these tools require expert users and understanding of the underlying phenomena. In the product operation and maintenance processes quite a lot of sensors are used for collecting process data, but the data is poorly utilised.
Products and solutions. Visualization tools are common in engineering applications, making visualizations of 3D models, CFD calculations etc, however, they normally require expert users. Sensor technology is developing rapidly, giving possibilities to install better and cheaper sensors. Common business applications, such as MS Excel, are used to create simple visualizations. Also special tools for creating and visualising e.g. performance metrics, key performance indicators (KPI) etc. are used.

5. Roadmap
36
5.2.2 Industrials applications: Short term
Technologies. In short term the growing screen sizes give more opportunities for making more effective visualizations for both engineering and business related applications. On the other hand, maintenance and operation are mobile activities by nature and therefore increasing number of mobile terminals will be used giving new opportunities for visualization, e.g. in augmented reality user interfaces.
Products and solutions. Data mining techniques will be applied to the sensor data streams and visual analytics will be applied to the data. Also, since there will be more good quality 3D models, they will be used for visualising different analyses results, such as energy consumption, environmental issues etc. Visualization will also be used in mobile terminals, especially in operation and installation phases.
Markets. Visualization markets will spread from 3D design applications into other business application by combining engineering data with simulation data. Also new types of applications such as control systems and maintenance management systems (CMMS) will be able to use visualization. Increasing usage of diagnostics tools will also create market for visualization.
5.2.3 Industrials applications: Long term
Technologies. In long term, new interaction devices that give new opportunities for interactive visualizations, such as multi-touch screens and haptic devices, will be used in industrial applications. Industrial applications are expected to move into using more open platforms that will be combined with open visualization platforms.
Products and solutions. While standardisation of the application interfaces advances, visualization tools will be used to help combining information from different business applications. This enables also collaborative visual analytics, used by e.g. remote maintenance personnel and field personnel. Also, visualization products are expected to be more interactive, using e.g. sensor data and new interaction devices.
Markets. Advances in the models for predicting e.g. product failures will enable the use of collected data in prognostics software that need advanced visualization.

Prod
ucts
and
solu
tions
Driv
ers
Softw
are
as a
Ser
vice
Softw
are
as a
Ser
vice
Visu
al a
naly
tics
tool
s Vi
sual
ana
lytic
s to
ols
Indu
stria
lmob
ile te
rmin
als
Indu
stria
lmob
ile te
rmin
als
Augm
ente
d re
ality
Au
gmen
ted
real
ity
Busi
ness
sys
tem
sBu
sine
ss s
yste
ms
Tech
nolo
gies
Mar
kets
Vis
ualis
atio
non
per
sona
lco
mpu
ters
cree
n.
Visu
alis
atio
non
per
sona
lco
mpu
ters
cree
n.
CFD
tool
s re
quire
exp
erts
un
ders
tand
ing
phen
omen
a an
d pr
ogra
mm
ing
CFD
tool
s re
quire
exp
erts
un
ders
tand
ing
phen
omen
a an
d pr
ogra
mm
ing
Eng
inee
ring
softw
are,
dia
gnos
tics
Eng
inee
ring
softw
are,
dia
gnos
tics
Gro
win
g sc
reen
siz
es
Gro
win
g sc
reen
siz
es
Sen
sors
ever
ywhe
reS
enso
rsev
eryw
here
VISI
ON
Eng
inee
ring
visu
alis
atio
ns:
3D m
odel
s, fl
uid
dyna
mic
s
Busi
ness
app
licat
ions
: Per
form
ance
Met
rics,
KP
I, Ex
cel
Info
rmat
ion
over
load
Info
rmat
ion
over
load
Sen
sord
ata
colle
cted
in
indu
stry
, but
rare
lyus
ed
Sens
orda
ta c
olle
cted
in
indu
stry
, but
rare
lyus
edD
ata
min
ing
appl
ied
to s
enso
rda
ta a
nd v
isua
lised
Dat
a m
inin
gap
plie
dto
sen
sor
data
and
vis
ualis
edIn
tera
ctiv
e vi
sual
isat
ion
appl
ied
tose
nsor
dat
a
Inte
ract
ive
visu
alis
atio
n ap
plie
d to
sens
or d
ata
Toda
yLo
ng te
rmSh
ort t
erm
Util
isat
ion
of s
imul
atio
nU
tilis
atio
nof
sim
ulat
ion
Faci
lity
anal
ysis
vis
ualis
atio
n
Visu
alis
atio
nse
rvic
esin
Web
Visu
alis
atio
nto
ols
inte
grat
ein
form
atio
nfro
mdi
ffere
ntso
urce
s
Vis
ualis
atio
nto
ols
inte
grat
ein
form
atio
nfro
mdi
ffere
ntso
urce
s
Mul
titou
chsc
reen
s in
indu
stry
, ha
ptic
sde
vice
s
Mul
titou
chsc
reen
s in
indu
stry
, ha
ptic
sde
vice
s
New
inte
ract
ion
met
hods
N
ew in
tera
ctio
n m
etho
ds
Ope
n v
isua
l ana
lytic
s pl
atfo
rms
Ope
n v
isua
l ana
lytic
s pl
atfo
rms
Sens
ors
crea
tea
loto
f da
ta re
late
dto
the
prod
ucts
Sen
sors
crea
tea
loto
f da
ta re
late
dto
the
prod
ucts
3D C
AD
, CFD
3D C
AD, C
FD
Col
labo
rativ
evi
sual
anal
ytic
sC
olla
bora
tive
visu
alan
alyt
ics
Con
trols
yste
ms,
CM
MS
Con
trols
yste
ms,
CM
MS
Sim
ulat
ion
softw
are
Sim
ulat
ion
softw
are
Pro
gnos
tics
softw
are
Pro
gnos
tics
softw
are
Bus
ines
s m
oves
from
man
ufac
turin
gto
life
cycl
ese
rvic
esBu
sine
ss m
oves
from
man
ufac
turin
gto
life
cycl
ese
rvic
es
Softw
are
as a
Ser
vice
Softw
are
as a
Ser
vice
Visu
al a
naly
tics
tool
s Vi
sual
ana
lytic
s to
ols
Indu
stria
lmob
ile te
rmin
als
Indu
stria
lmob
ile te
rmin
als
Augm
ente
d re
ality
Au
gmen
ted
real
ity
Busi
ness
sys
tem
sBu
sine
ss s
yste
ms
Tech
nolo
gies
Mar
kets
Vis
ualis
atio
non
per
sona
lco
mpu
ters
cree
n.
Visu
alis
atio
non
per
sona
lco
mpu
ters
cree
n.
CFD
tool
s re
quire
exp
erts
un
ders
tand
ing
phen
omen
a an
d pr
ogra
mm
ing
CFD
tool
s re
quire
exp
erts
un
ders
tand
ing
phen
omen
a an
d pr
ogra
mm
ing
Eng
inee
ring
softw
are,
dia
gnos
tics
Eng
inee
ring
softw
are,
dia
gnos
tics
Gro
win
g sc
reen
siz
es
Gro
win
g sc
reen
siz
es
Sen
sors
ever
ywhe
reS
enso
rsev
eryw
here
VISI
ON
Eng
inee
ring
visu
alis
atio
ns:
3D m
odel
s, fl
uid
dyna
mic
s
Busi
ness
app
licat
ions
: Per
form
ance
Met
rics,
KP
I, Ex
cel
Info
rmat
ion
over
load
Info
rmat
ion
over
load
Sen
sord
ata
colle
cted
in
indu
stry
, but
rare
lyus
ed
Sens
orda
ta c
olle
cted
in
indu
stry
, but
rare
lyus
edD
ata
min
ing
appl
ied
to s
enso
rda
ta a
nd v
isua
lised
Dat
a m
inin
gap
plie
dto
sen
sor
data
and
vis
ualis
edIn
tera
ctiv
e vi
sual
isat
ion
appl
ied
tose
nsor
dat
a
Inte
ract
ive
visu
alis
atio
n ap
plie
d to
sens
or d
ata
Toda
yLo
ng te
rmSh
ort t
erm
Util
isat
ion
of s
imul
atio
nU
tilis
atio
nof
sim
ulat
ion
Faci
lity
anal
ysis
vis
ualis
atio
n
Visu
alis
atio
nse
rvic
esin
Web
Visu
alis
atio
nto
ols
inte
grat
ein
form
atio
nfro
mdi
ffere
ntso
urce
s
Vis
ualis
atio
nto
ols
inte
grat
ein
form
atio
nfro
mdi
ffere
ntso
urce
s
Mul
titou
chsc
reen
s in
indu
stry
, ha
ptic
sde
vice
s
Mul
titou
chsc
reen
s in
indu
stry
, ha
ptic
sde
vice
s
New
inte
ract
ion
met
hods
N
ew in
tera
ctio
n m
etho
ds
Ope
n v
isua
l ana
lytic
s pl
atfo
rms
Ope
n v
isua
l ana
lytic
s pl
atfo
rms
Sens
ors
crea
tea
loto
f da
ta re
late
dto
the
prod
ucts
Sen
sors
crea
tea
loto
f da
ta re
late
dto
the
prod
ucts
3D C
AD
, CFD
3D C
AD, C
FD
Col
labo
rativ
evi
sual
anal
ytic
sC
olla
bora
tive
visu
alan
alyt
ics
Con
trols
yste
ms,
CM
MS
Con
trols
yste
ms,
CM
MS
Sim
ulat
ion
softw
are
Sim
ulat
ion
softw
are
Pro
gnos
tics
softw
are
Pro
gnos
tics
softw
are
Bus
ines
s m
oves
from
man
ufac
turin
gto
life
cycl
ese
rvic
esBu
sine
ss m
oves
from
man
ufac
turin
gto
life
cycl
ese
rvic
es
Figu
re 1
3. R
oadm
ap fo
r ind
ustri
al a
pplic
atio
ns.
5. Roadmap
37

5. Roadmap
38
5.3 Sub-roadmap: Consumer applications
The vision of using visualization in consumer applications until year 2017 is the following:
Visualization is used in most of the consumer applications, such as decision support. The applications are mobile and the consumers can use them everywhere and anytime.
Drivers. As everywhere, the need for using visualization in consumer applications comes from information overflow. Information overflow combined with increasing consumer awareness (e.g. environmental issues, consumer rights), makes demand for showing information to the consumers in an easily understandable format. The information used by the consumers is more and more produced by the other consumers (social media), making the task of finding relevant information even more difficult. Also the nomadic lifestyle makes people need more applications that are easily available everywhere, e.g. on mobile terminals.
Roadmap for consumer applications is shown in Figure 14. The following chapters give a more detailed explanation of the roadmap.
5.3.1 Consumers applications: Today
Markets. Currently the visualization market in customer applications is mostly on the marketing sector and media producers.
Products and solutions. Media is a big user of visualizations, ranging from weather forecasts to visualization of the election or opinion poll results. Visualization is also used in many sports applications, such as live visualization of serves in a tennis game.
Technologies. Today the consumer visualizations are mostly made manually for marketing etc. purposes, with exception of rain radars and weather forecasts, where “scientific visualizations” are used in consumer applications. In the web normal web programming technologies (HTML, XML, JavaScript, Ajax etc.) are used. Tools used in creating visualizations are specialised software for different purposes. Open source technologies have not yet reached popularity outside the research community.
5.3.2 Consumers applications: Short term
Markets. New markets in the short run are expected to arise in public services and marketing departments of the product and service providers.
Products and solutions. New visualization products will be established especially among web applications. New types of applications using visualization will be e.g. different social media sites, for e.g. enabling society and political participation by making real time opinion polls etc. Also public content services, e.g. public libraries and information services, will automate their functions, creating needs for visualising their offering according to customer preferences. Since the customer awareness is increasing,

5. Roadmap
39
the need to compare different products according to different attributes creates new markets for interactive visualizations.
Technologies. In short term, consumers will have faster internet connections and home computers will have increasing computation power. Also, the increasing use or mobile terminals capable of making visualizations or accessing web enables new mobile visualization services. Another type of new technology enabler is IPTV, that is expected to become more common in short term.
5.3.3 Consumers applications: Long term
Consumer applications are the most volatile business area and therefore it is fairly impossible to predict trends in the consumer applications in the long run.
Products and solutions. The products will become more media independent, allowing same content to be used in e.g. web, mobile applications and IPTV.
Technologies. In the long run open application interfaces will become more common, allowing users to create own applications creating advanced visualization.

Tech
nolo
gies
Mar
kets
Clo
sed
softw
are
arch
itect
ures
Clo
sed
softw
are
arch
itect
ures
Med
ia h
ouse
s M
edia
hou
ses
Ope
nAP
isO
pen
APis
Fast
erin
tern
et c
onne
ctio
ns, m
ore
and
chea
perc
ompu
ting
pow
erFa
ster
inte
rnet
con
nect
ions
, mor
ean
d ch
eape
rcom
putin
gpo
wer
Driv
ers
Wea
ther
fore
cast
s,ra
inra
dars
Med
ia a
nim
atio
ns,
elec
tion
engi
nes
Toda
yLo
ng te
rmSh
ort t
erm
Info
rmat
ion
over
flow
Info
rmat
ion
over
flow
Web
pro
gram
min
g,(J
avas
crip
t, Aj
ax)
VISI
ON
Spo
rt
Nom
adic
lifes
tyle
Nom
adic
lifes
tyle
Incr
easi
ngco
nsum
eraw
arne
ss, e
.g. s
usta
inab
ility
Incr
easi
ngco
nsum
eraw
arne
ss, e
.g. s
usta
inab
ility
Mar
ketin
g M
arke
ting Soc
iety
and
pol
itics
par
ticip
atiti
onSo
ciet
y an
d po
litic
s pa
rtici
patit
ion
Pub
licse
rvic
es
Pro
duct
and
serv
ice
prov
ider
s
Spec
ialis
edpr
esen
tatio
nso
ftwar
eM
obili
tyM
obilit
y
IP T
VIP
TV
Adv
ance
d vi
sual
isat
ion
on s
ocia
l med
ia s
ites.
Adv
ance
d vi
sual
isat
ion
on s
ocia
l med
ia s
ites.
Pub
lic c
onte
nt s
ervi
ces,
i.e.
libr
arie
sPu
blic
con
tent
ser
vice
s, i.
e. li
brar
ies
Pro
duct
aw
arne
sse,
.gen
viro
nmen
t to
uris
m, r
eal e
stat
e sa
les
Prod
uct a
war
ness
e,.g
envi
ronm
ent
tour
ism
, rea
l est
ate
sale
s M
edia
iden
pend
entv
isua
lisat
ion,
e.
g. w
eb, m
obile
, IP
-TV
Med
ia id
enpe
nden
tvis
ualis
atio
n,
e.g.
web
, mob
ile, I
P-TV
Soc
ial m
edia
Soci
al m
edia
Tech
nolo
gies
Mar
kets
Clo
sed
softw
are
arch
itect
ures
Clo
sed
softw
are
arch
itect
ures
Med
ia h
ouse
s M
edia
hou
ses
Ope
nAP
isO
pen
APis
Fast
erin
tern
et c
onne
ctio
ns, m
ore
and
chea
perc
ompu
ting
pow
erFa
ster
inte
rnet
con
nect
ions
, mor
ean
d ch
eape
rcom
putin
gpo
wer
Driv
ers
Wea
ther
fore
cast
s,ra
inra
dars
Wea
ther
fore
cast
s,ra
inra
dars
Med
ia a
nim
atio
ns,
elec
tion
engi
nes
Med
ia a
nim
atio
ns,
elec
tion
engi
nes
Toda
yLo
ng te
rmSh
ort t
erm
Info
rmat
ion
over
flow
Info
rmat
ion
over
flow
Web
pro
gram
min
g,(J
avas
crip
t, Aj
ax)
VISI
ON
VISI
ON
Spo
rtS
port
Nom
adic
lifes
tyle
Nom
adic
lifes
tyle
Incr
easi
ngco
nsum
eraw
arne
ss, e
.g. s
usta
inab
ility
Incr
easi
ngco
nsum
eraw
arne
ss, e
.g. s
usta
inab
ility
Mar
ketin
g M
arke
ting Soc
iety
and
pol
itics
par
ticip
atiti
onSo
ciet
y an
d po
litic
s pa
rtici
patit
ion
Pub
licse
rvic
esP
ublic
serv
ices
Pro
duct
and
serv
ice
prov
ider
sP
rodu
ctan
d se
rvic
epr
ovid
ers
Spec
ialis
edpr
esen
tatio
nso
ftwar
eM
obili
tyM
obilit
y
IP T
VIP
TV
Adv
ance
d vi
sual
isat
ion
on s
ocia
l med
ia s
ites.
Adv
ance
d vi
sual
isat
ion
on s
ocia
l med
ia s
ites.
Pub
lic c
onte
nt s
ervi
ces,
i.e.
libr
arie
sPu
blic
con
tent
ser
vice
s, i.
e. li
brar
ies
Pro
duct
aw
arne
sse,
.gen
viro
nmen
t to
uris
m, r
eal e
stat
e sa
les
Prod
uct a
war
ness
e,.g
envi
ronm
ent
tour
ism
, rea
l est
ate
sale
s M
edia
iden
pend
entv
isua
lisat
ion,
e.
g. w
eb, m
obile
, IP
-TV
Med
ia id
enpe
nden
tvis
ualis
atio
n,
e.g.
web
, mob
ile, I
P-TV
Soc
ial m
edia
Soci
al m
edia
Figu
re 1
4. R
oadm
ap fo
r con
sum
er a
pplic
atio
n.
5. Roadmap
40

Summary
41
6. Summary
Visual analytics is the most recent field of information visualization. The objective of visual analytics is to develop visual and interactive tools and techniques for reasoning and decision making from large data sets. It is a multi-disciplinary research area, combining visualization science, data mining, statistics, mathematics, data management, human perception and cognition research. Visual analytics brings a new promising approach to tackle the information overload problem.
Visual analytics is an active research field. The increasing international importance of the topic is reflected by the strong presence of visual analytics at leading international conferences. It has also found its way into major journals in this area. Many research activities around the topic are in progress and preparation.
Resulting form the novelty of the research field there are no full-scale visual analytics tools on the markets. Tool development is for the present under way in research communities. Visual data mining, a research field closely related to visual analytics has several products on the market but they lack more or less of the essential features of visual analytics. These tools are mostly focused on ”Business intelligence” and implemented as heavy stand-alone systems, difficult to integrate to existing systems with complex and heterogeneous data sources.
Introducing the ideas of visual analytics in VTT and to customers has shown that there are both plenty of accumulated data sources waiting for to be analyzed and also a great need and enthusiasm for more intelligent visualizations. The present methods clearly do not fulfil the needs.
The Visual Analytics project got acquainted to the concept and the related research fields, made a review to the state of the art of research and the tools on the markets, developed a demonstration tool and outlined roadmaps for industrial and consumer applications.
Our recommendations for the next steps of future work are
♦ Continue to follow the state-of-the-art of the area and increase knowledge both of visual analytics and the related fields, especially analysis and visualization techniques and human perception.

6. Summary
42
♦ Participate to and launch research projects. More work is required to test the power of the concept with real application data and decision making problems.
♦ Identification of valid customers and applications. An ideal candidate for visual analytics has accumulated data and need for decision making.
♦ Building an open source platform for visual analytics, outlined in Chapter 3.3. Integrating data sources.
♦ Finalizing the demonstration application. The prototype tool for analyzing energy measurement data was developed in the project but the project schedule did not allow finalising the tool. A full-working demonstration tool is essential for introducing the visual analytics ideas to potential clients.

Summary
43
Acknowledgements
The VTT Content engineering and visualization team would like to thank VTT for funding the project, especially Vice President Pekka Silvennoinen, whose interest towards the project was encouraging. Warm thanks also to our tutors Prof. Heikki Mannila and Dr. Kai Puolamäki from TKK and HIIT; without their important contribution the project would have not been successful at all. Finally, thanks to the anonymous donator who gave us house monitoring data to be used in the demonstration application.

6. Summary
44
References [Aigner et al. 2008] Aigner. W, Miksch, S., Müller, W., Schumann, H. & Tominsk, C. 2008.
Visual methods for analyzing time-oriented data. Transactions on Visualization and Computer Graphics, Vol. 14, No. 1, pp. 47–60.
[Card et al. 1999] Card, S. K., Mackinlay, J. D. & Schneidermann, B. 1999. Readings in information visualization, Using Vision to Think. Academic Press Inc. 686 p. ISBN 1-55860-533-9.
[Cook et al. 2007] Cook, K., Earnshaw, R. & Stasko, J. 2007. Discovering the Unexpected. IEEE Computer Graphics and Applications, Vol. 27, No. 5.
[Johnson et al. 2006] Johnson, C., Moorhead, R., Munzner, T., Pfister, H. P., Rheingans, P. & Yoo T. S. 2006. NIH/NSF Visualization Research Challenges. http://vgtc.org/wpmu/ techcom/national-initiatives/nihnsf-visualization-research-challenges-report-january.
[Keim et al. 2008] Keim, D. A., Mansmann, F., Oelke, D. & Ziegler, H. 2008. Visual Analytics: Combining Automated Discovery with Interactive Visualizations. Discovery Science, pp. 2–14. ISBN 978-3-540-88410-1. http://infovis.uni-konstanz.de/papers/2008/ComVis.pdf.
[Keim et al. 2006] Keim, D. A., Mansmann, F., Schneidewind, J. & Hartmut, Z. 2006. Challenges in Visual Data Analysis. In: Proceedings of the Tenth International Conference on Information Visualization (IV'06). doi.ieeecomputersociety.org. ISBN 978-0-7695-2602-7.
[Keim 2008] Keim, D. A. 2008. Visual Analytics in Europe. NVAC Views. http://infovis.uni-konstanz.de/papers/2008/NVACViews2008.pdf.
[Schneiderman 1996] Schneiderman, B. 1996. The eyes have it: A task by data type taxonomy for information visualizations. Proc. of the IEEE Symp. on Visual Languages. Pp. 336–343.
[Tan et al. 2006] Tan, P., Steinbach, M. & Kumar,V. 2006. Introduction to Data Mining. Addison–Wesley. 769 p. ISBN-10: 0321321367, ISBN-13: 9780321321367. http://www-users. cs.umn.edu/~kumar/dmbook/index.php#item4.
[Thomas & Cook 2005] Thomas, J. & Cook, K. 2005. Illuminating the Path: Research and Development Agenda for Visual Analytics, IEEE Press. 194 p. http://nvac.pnl.gov/.
[Thomas & Cook 2006] Thomas, J. & Cook, K. 2006. A Visual Analytics Agenda. IEEE Computer Graphics and Applications, Vol. 26. Issue 1, pp. 10–13.
[Tufte 1982] Tufte, E. T. 1982, 2001 (second edition). The visual display of quantitative information. 2nd edition, fourth printing 2006. USA. Graphics Press. 197 p.
[Wache et al. 2001] Wache, H., Vögele, T., Visser, U., Stuckenschmidt, U., Schuster, G., Neumann, H. & Hübner, S. 2001. Ontology-based integration of information – a survey of existing approaches. In: Stuckenschmidt, H. (ed.). IJCAI-01 Workshop: Ontologies and Information Sharing, 2001. Pp. 108–117.

Summary
45
[Ware 2004] Ware, C. 2004. Information visualization: perception for design. 2nd edition. San Fransisco, USA. Morgan Kaufmann Publishers. 486 p. ISBN 1-55860-919-2.
[Wong 2007] Wong, P. C. 2007. Visual analytics science and technology. Information Visualization, 6, pp. 1–2.


Appendix 1: Role of VTT in Visual Analytics
1/1
Appendix 1: Role of VTT in Visual Analytics
It is easy to see that the opportunities in visual analytics are rapidly increasing and this creates new opportunities for VTT too. Until now, the science of data mining has been separated from visualization and research communities in both areas have been concentrating on their own area, without wanting to expand there research interest into other areas. This naturally creates an opportunity for a player like VTT that can combine expertise of different research areas. In practise this combination has already happened in VTT’s knowledge centre Virtual Models and Interfaces and especially in the Content Engineering and Visualisation team, where coexistence of information management and visualization has been studied already years.
Therefore, the role of VTT in visual analytics could and should be in developing and using tools for visual analytics; and not in the developing new methodologies. Since the focus of the VTT’s research is in applied research, VTT should concentrate in utilising the state of art research and tools instead of aiming into basic research in theses areas.
One of the biggest challenges in visual analytics is the change from implementing visualization applications for different purposes into implementing tools for visual analytics application development. Starting application development from scratch for each new application is not an efficient way of working in cases where same input data formats, same analysis methods and same visualization methods and used in different combinations. Even a simple case (Figure 1.1), where there are two data formats that are analysed using two methods and two different visualizations requires implementation of more point to point interfaces compared to using a central platform capable of linking different methods. When the number of data formats, applications and visualizations grows, the difference comes even more obvious.

Appendix 1: Role of VTT in Visual Analytics
1/2
Data source
AnalysisMethod 2
Visualisation 2
Data Source 2
Visualisation
AnalysisMethod
Data source
AnalysisMethod 2
Visualisation 2
Data Source 2
Visualisation
AnalysisMethod
Visual AnalyticsPlatform
Figure 1.1. Advantages of visual analytics platform.
The platform needed in the right side requires basically implementing tools for modelling and mapping data models between data input, analysis and visualization tools. Each application has its own data model (Figure 1.2) and the role of the visualization can be simplified to linking the data properties in different data models: for example values of column 1 in input format are mapped to parameter a in analysis method and output parameter p1 of the analysis are mapped to parameter x in visualization tools.
Data source
AnalysisMethod 2
Visualisation 2
Data Source 2
Visualisation
AnalysisMethod
Figure 1.2. Data models in visual analytics platform.
The reason why implementing this kind of platform seems to fit well for VTT is that VTT already has already implemented a very similar simulation platform, called Simantics. Simantics is a high level process simulation platform for simulation component integration and complex system modelling. Simantics platform is based on creating Eclipce-plugins for different simulation, data import or visualization purposes

Appendix 1: Role of VTT in Visual Analytics
1/3
(Figure 1.3). The platform offers tools for modelling and mapping different data models together to enable data exchange between the plugins.
Platform• Plugin programming framework• Data modelling and mapping• Model instance storage/version control
APROS simulationengine
OpenSceneGraphvisualisationenvironment
BALAS simulation engine
Platform• Plugin programming framework• Data modelling and mapping• Model instance storage/version control
APROS simulationengine
OpenSceneGraphvisualisationenvironment
BALAS simulation engine
Figure 1.3. Simantics plugin architecture.
The Simantics platform is being published as an open source application. The VTT business model in creating such an open source platform is based on the tools and services that are built on top of it: year 2008 revenues of the projects around Simantics are more 2 M€ and they are estimated to double year 2009.
The success of Simantics could be repeated in building an visual analytics platform in the business area that is even bigger than process simulation; even so that it is possible to reuse work that has been done in Simantics project.

VTT WORKING PAPERS 117VTT CREATES BUSINESS FROM TECHNOLOGY�Technology�and�market�foresight�•�Strategic�research�•�Product�and�service�development�•�IPR�and�licensing�•�Assessments,�testing,�inspection,�certification�•�Technology�and�innovation�management�•�Technology�partnership
•�•�•���VTT�WO
RKIN
G�PA
PERS�117������VISU
AL�A
NA
LYTICS.�FIN
AL�R
EPOR
T
ISBN 978-951-38-7178-9 (URL: http://www.vtt.fi/publications/index.jsp)ISSN 1459-7683 (URL: http://www.vtt.fi/publications/index.jsp)
Paula Järvinen, Kai Puolamäki, Pekka Siltanen & Markus Ylikerälä
Visual AnalyticsFinal Report
VTT Working Papers
102 Stephen Fox. Ontological uncertainty and semantic uncertainty in global network organizations. 2008. 122 p.
103 Kati Tillander, Helena Järnström, Tuula Hakkarainen, Juha Laitinen, Mauri Mäkelä, & Panu Oksa. Palokohteiden savu-, noki- ja kemikaalijäämät ja niiden vaikutukset työturvallisuuteen. Polttokokeet ja altistumisen arviointi. 2008. 67 s.
104 Eija Kupi, Sanna-Kaisa Ilomäki, Virpi Sillanpää, Heli Talja & Antti Lönnqvist. Aineettoman pääoman riskienhallinta. Riskit ja riskienhallinnan käytännöt yrityksissä. 2008. 44 s.
105 Teemu Mutanen, Joni Niemi, Sami Nousiainen, Lauri Seitsonen & Teppo Veijonen. Cultural Event Recommendations. A Case Study. 2008. 17 p.
106 Hannele Holttinen. Tuulivoiman tuotantotilastot. Vuosiraportti 2007. 2008. 44 s. + liitt. 8 s.
107 Kari Keinänen, Jarkko Leino & Jani Suomalainen. Developing Keyboard Service for NoTA. 2008. 17 p. + app. 2 p.
108 Hannele Antikainen, Asta Bäck & Pirjo Näkki. Sosiaalisen median hyödyntäminen paikallisissa mediapalveluissa. 2008. 64 s.
109 Raine Hautala, Pekka Leviäkangas, Jukka Räsänen, Risto Öörni, Sanna Sonninen, Pasi Vahanne, Martti Hekkanen, Mikael Ohlström, Bengt Tammelin, Seppo Saku & Ari Venäläinen. Benefits of meteorological services in South Eastern Europe. An assessment of potential benefits in Albania, Bosnia-Herzegovina, FYR Macedonia, Moldova and Montenegro. 2008. 63 p. + app. 35 p.
110 Jaana Leikas. Ikääntyvät, teknologia ja etiikka. Näkökulmia ihmisen ja teknologian vuorovaikutustutkimukseen ja -suunnitteluun. 2008. 155 s.
111 Tomi J. Lindroos. Sectoral Approaches in the Case of the Iron and Steel Industry. 2008. 58 p. + app. 11 p.
112 Johan Mangs. A new apparatus for flame spread experiments. 2009. 50 p. + app. 27 p.
113 Stephen Fox & Brent Stucker. digiproneurship. New types of physical products and sustainable employment from digital product entrepreneurship. 2009. 29 p. + app. 6 p.
114 Päivi Parviainen, Juha Takalo, Susanna Teppola & Maarit Tihinen. Model-Driven Development. Processes and practices. 2009. 102 p. + app. 4 p.
115 Kim Björkman, Juho Frits, Janne Valkonen, Keijo Heljanko & Ilkka Niemelä. Model-based analysis of a stepwise shutdown logic. MODSAFE 2008 Work Report. 2009. 35 p. + app. 4 p
117 Paula Järvinen, Kai Puolamäki, Pekka Siltanen & Markus Ylikerälä. Visual analytics. Final report. 2009. 45 p. + app. 3 p.
analyticsvisualization
data
applicationstools


![Publication [IV] - TKK](https://static.documents.pub/doc/80x56/61f2fb971a17171fc95f7b67/publication-iv-tkk.jpg)


