Tissue Elasticity Regulated Tumor GeneExpression: Implication for DiagnosticBiomarkers of Primitive NeuroectodermalTumorLong T. Vu1,5, Vic Keschrumrus1, Xi Zhang6, Jiang F. Zhong6*, Qingning Su8, MustafaH. Kabeer1,7,9, William G. Loudon1,2,3, Shengwen Calvin Li1,4,5*
1 Neuro-Oncology and Stem Cell Research Laboratory, Center for Neuroscience Research, CHOCChildren's Hospital Research Institute, University of California Irvine, 1201West La Veta Ave., Orange, CA,92868, United States of America, 2 Department of Neurological Surgery, Saint Joseph Hospital, Orange, CA,92868, United States of America, 3 Department of Neurological Surgery, University of California IrvineSchool of Medicine, Orange, CA, 92862, United States of America, 4 Department of Neurology, University ofCalifornia Irvine School of Medicine, Orange, CA, 92697–4292, United States of America, 5 Department ofBiological Science, California State University, Fullerton, CA, 92834, United States of America,6 Department of Pathology, Keck School of Medicine, University of Southern California, Los Angeles, CA,90033, United States of America, 7 Department of Pediatric Surgery, CHOC Children's Hospital, 1201WestLa Veta Ave., Orange, CA, 92868, United States of America, 8 Bioengineering Research Center, School ofMedicine, Shenzhen University, Shenzhen, 518057, Guangdong, China, 9 Department of Surgery,University of California Irvine School of Medicine, 333 City Blvd. West, Suite 700, Orange, CA 92868, UnitedStates of America
Funding: This study was supported by the Children'sHospital of Orange County (CHOC) Children'sFoundation, CHOC Neuroscience Institute, AustinFord Tribute Fund, W. M. Keck Foundation, GrantR21CA134391 from the National Institutes of Health,and Grant AW 0852720 from the National ScienceFoundation. The funders had no role in study design,data collection and analysis, decision to publish, orpreparation of the manuscript.
Competing Interests: The authors have declaredthat no competing interests exist.
processing was affected by tissue elasticity. Dicer genes were downregulated on PAA and
had multiple predicted miRNA binding sites in its 3' UTR that matched the miRNA binding
sites found enriched on PAA. Many differentially regulated genes were found to be present
on PS but downregulated on PAA were mapped onto intron sequences. This suggests ex-
pression of alternative polyadenylation sites within intron regions that provide alternative
3' UTRs and alternative miRNA binding sites. This results in tissue specific transcriptional
downregulation of mRNA in humans by miRNA. We propose a mechanism, driven by the
physical characteristics of the microenvironment by which downregulation of genes occur.
We found that tissue elasticity-mediated cytokines (TGFβ2 and TNFα) signaling affect ex-
pression of ECM proteins.
Conclusions
Our results suggest that tissue elasticity plays important roles in miRNA expression, which,
in turn, regulate tumor growth or tumorigenicity.
IntroductionUncontrolled growth and rapid division of cells characterize cancer. Malignant cancer cells, re-sistant to programmed cell death, invade surrounding tissue, and possess potential for meta-static migration to other organs. Current cancer treatments (surgery, chemotherapy, radiation)target rapidly dividing cancer cells, resulting in reduction of the tumor size [1], driving the se-lection of cell subclones with treatment-resistance that leads to recurrence [2]. Such mecha-nism of cancer cell subclone switching to escape treatment renders malignant cancer incurable.We need to control such dominating subclones for managing cancer progression and posttreat-ment recurrence by subclonal switchboard signal [3]. However, in some cases, the cancerouscells may reappear and become more resistant to therapy. It is essential to study this cell behav-ior in a physiologically relevant culture microenvironment.
The treatment-resistance cell subclones are believed to be derived from cancer stem cells(CSCs) [4] and some called cancer as a stem-cell disease [5,6,7]. CSCs reside in a cellular mi-croenvironment (a.k.a., milieu or onco-niche [7], mirror stem-cell niche) where they can main-tain their self-renewal characteristics and prevent cell proliferation. For example, glioblastoma-derived CSCs reside in the microvascular niche of brain tumors [8]. CSCs remain stem-cellstate until they are out of the onco-niche and this exiting process activates cancer dormant sub-clones to proliferate. The onco-niche consists of interaction of CSCs with other cells (stromalcells) and the extracellular matrix (ECM) as well as chemical factors (e.g., growth factors). Wereported that induced pluripotent stem cells (iPSC) grow along the fiber track in an organoty-pic brain slice system[9], CSCs form clonal mass [10], and normal neural stem cells migratedtoward tumor and differentiated [1] in the native milieu, but not on artificially designed Petripolystyrene (PS) plates. These prompted us to hypothesize that brain environment regulatesstem cell behavior. However, a brain environment is a complex of physical and chemical fac-tors, complicating the interpretation of data at the molecular level. Recent publications showthat an array of physical metrics plays a vital role for cancer initiation, progression, and metas-tasis [11]. Intriguingly, a substrate with an elasticity that emulates normal tissue can functionas a developmental cue that directs stem cells to differentiate into cells of specific lineages, in-cluding mesenchymal stem cells (MSCs) [12] and neural stem cells [13] ([14], page 489). The
Tissue Elasticity Regulated Tumor Gene Expression
PLOS ONE | DOI:10.1371/journal.pone.0120336 March 16, 2015 2 / 32
differences in Tissue-level elasticity of cultural environment were found to determine the fateof MSC cells for their neurogenic, myogenic, and osteogenic differentiations[12]. All of thesenew reports inspired us to focus on how tissue elasticity regulates gene expression in patient’sderived CSCs. Our results indicate that elasticity-induced gene expression may be regulated bymicroRNAs in CSCs.
MicroRNAs (miRNAs) are small ~22 nucleotide (nt) non-coding single stranded RNA mol-ecules. About half of miRNA genes are located within introns of coding regions and the otherhalf within intergenic non-coding regions. They are usually transcribed by RNA polymerase IIto generate a primary miRNA (pri-miRNA) transcript that is capped and polyadenylated. Pri-mary miRNA (pri-miRNA) can contain multiple stem loop secondary structures that representprecursor miRNA (pre-miRNA), which are cleaved co-transcriptionally within the nucleus bythe Microprocessor complex. The Microprocessor complex consists of two gene productsbound together, Drosha and DGCR8, which act to attach to cleave primary miRNA. A recentanalysis of the genomic location of human miRNA genes suggested that 50% of miRNA genesare located in cancer-associated genomic regions or in fragile sites [15].
The mechanism by which miRNA regulates gene expression is not fully understood. At thistime, they are known to play a variety of roles in development and biological processes andhave been reported to be important in some cancers. They were initially thought to only silencegene expression via translation repression with the implication that the transcripts are not de-graded during repression, but recent studies have determined that miRNAs may primarily si-lence gene expression by destabilizing and degrading mRNA transcripts leading to reducedprotein synthesis. Silencing gene expression by miRNA can be tissue and cell specific.
Tumor microenvironment (stromal cells, soluble factors, ECM) is essential for growth andspread of cancer. Emerging data show that ECMmay influence stem cell fate through physicalinteractions with cells and through transmission of mechanical or other biophysical factors tothe cell. Little is known about the physical factors of the microenvironment, including matrixelasticity that may affect gene expression of tumor cells via miRNA. We investigate this possi-bility with CSCs derived from a primitive neuroectodermal tumor (PNET) obtained from ayoung patient with an established control cell line of glioblastoma multiforme (GBM) primarycell line (ACBT). Specifically, we studied the global gene expression of CSCs grown on a softpolyacrylamide (PAA) hydrogel plates, used to mimic the elasticity of soft brain tissue, com-pared to CSCs grown on a standard polystyrene (PS) plates. We propose a novel mechanism,driven by the physical characteristics of the microenvironment by which downregulation ofgenes occur. We also investigated if tissue elasticity and cytokines affect expression of ECMproteins. Our results suggest that tissue elasticity plays important roles in miRNA expression,which, in turn, regulate tumor growth or tumorigenicity.
Results
Asymmetric Expression of Tumor Genes between Tumor Grown on PAAand That on PSPrimitive neuroectodermal tumor (PNET) cells (F3Y), derived from neurospheres in a neuralstem cell (NSC) selection medium, were grown either on standard polystyrene (PS) or on softpolyacrylamide (PAA) hydrogel substrate. The cells retained a similar spindle-shaped fibro-blast-like morphology when grown on PS and PAA (Fig. 1). The cells grew slower on PAAthan on PS, a phenomenon described previously as micro-environmental mechanical stress-induced apoptosis occurs via the mitochondrial pathway [16]. Six microarray experimentswere performed using Affymetrix HG-U133 Plus 2.0 chips, three replicates for each culturecondition. The microarray results were normalized by invariant set normalization utilizing
Tissue Elasticity Regulated Tumor Gene Expression
PLOS ONE | DOI:10.1371/journal.pone.0120336 March 16, 2015 3 / 32
DNA-Chip Analyzer (dChip) software [15]. Quantile normalization results were used for com-parison purposes for the initial analyses and choice of normalization method.
The presence or absence of a transcript for each gene probed on the array was initially deter-mined using dChip on unnormalized probe intensities for each array. The results demonstratedexpression of 57.73% of all genes probed in the PS samples compared to 48.7% of genes probedin the PAA samples (Table 1). All probe intensities of each array were then normalized by ei-ther rank invariant set model (Fig. 2A) or quantile normalization model using dChip (Fig. 2B).The scatter plot on the top panels shows the intensity value of a representative probe of a PSsample (PS_1, y-axis) compared to a PAA sample (PAA_4, x-axis) before (top left) and afternormalization (top right). The PS and PAA samples plotted were representative samples thatdisplayed differences in gene expression between the two culture conditions. The red pointsrepresent probes from the rank invariant set model (Fig. 2A) and from the quantile normaliza-tion model (Fig. 2B) used to normalize the arrays. The green line represents the running medi-an normalization curve to which the probes are normalized, while the blue line represents x =y. The greater deviation at high intensities of probes from the rank invariant set indicate thatinvariant normalization is less reliable for probes with very high signal intensities, while signalintensity ranges that have many invariant probes is more reliable (Fig. 2A).
Fig 1. Microscographs of F3Y cells on PS or PAA.Cells were grown on either a standard polystyrene (PS) culture p late (left) or a polyacrylamide hydrogel(right) coated with collagen type I in 5% FBS in Advanced DMEM. (Under 10x magnification).
Note: The median intensity and the presence call % of all probes on each array was measured using dChip
software. The standard deviation (SD) was calculated from three experiments. The presence call %
indicates the percentage of all probed gene transcripts that was expressed when cells were grown on the
corresponding surface.
doi:10.1371/journal.pone.0120336.t001
Tissue Elasticity Regulated Tumor Gene Expression
PLOS ONE | DOI:10.1371/journal.pone.0120336 March 16, 2015 4 / 32
MA plots, which are a scaled transformation of the scatter plot of series of thousands of mi-croscopic spots in DNA microarrays, are used to determine if the data needs normalizationand test if the normalization worked. Here, we used an MA plot, to compare the signal intensi-ty of genes on PS to gene on PAA where M (y-axis) represents the intensity ratio (log2 (con-trol/experimental)) and A (x-axis) represents the average intensity (1/2 � log2 (control �
experimental)) (Fig. 2, bottom panels). To provide a consistent frame of reference, genes on PSwere chosen to be the control and genes on PAA were chosen to be the experimental groupthroughout this study. The MA plot before (Fig. 2A, bottom left) and after normalization(Fig. 2A, bottom right) demonstrated that, the change in gene expression was not evenly dis-tributed between positive and negative expression (Fig. 2A and B). The data shows more pointsbelow an M value of zero (x-axis) than above an M value of zero, which indicates that, moregenes downregulated in cells grown on PAA than in cells on PS.
To confirm the above finding, a histogram of the fold change of genes between the PS andPAA conditions, normalized by rank invariant set normalization (Fig. 3A) or quantile normali-zation (Fig. 3B), was used to express that genes were skewed towards downregulation on PAA.This was indicated by the greater amount of genes that have a negative fold change comparedto the amount of genes that had a positive fold change from PS to PAA. The effect of asymmet-ric gene expression was greater in the normalization method of rank invariant set and damp-ened in quantile normalization (Figs. 2, 3, and 4). This effect was more difficult to observe inFig. 2 because the high density of the points in the MA plots masks the distribution of theprobes. Since the quantile normalization process assumes that the upregulated and
Fig 2. Normalization of gene expression arrays of PNET cells grown on PS or PAA. (A) By ranked invariant set normalization.. All probes werenormalized using dChip software implementation of ranked invariant set normalization. The x and y-axis on each of the top panels represent the probessignal intensity values of a PS sample (x-axis) compared to a PAA sample (y-axis) before (left) and after (right) normalization. The bottom graphs are atransformation of the distribution into an MA plot. (Descriptions inside the figure: A: upper left panel—X: JZ1A_1 raw, Y: baseline JZ2A_4 raw, correlation:0.914; lower left panel—M-A plot before normalization. A: upper right panel—X: JZ1A_1 normalized, Y: baseline JZ2A_4 raw, correlation: 0.919; lower rightpanel—M-A plot after normalization). (B) By quantile normalization. All probes were normalized using dChip software implementation of quantilenormalization. The x and y-axis on each of the top panels represent the probes signal intensity values of a PS sample (x-axis) compared to a PAA sample (y-axis) before (left) and after (right) normalization. The bottom graphs are a transformation of the distribution into an MA plot. (Descriptions inside the figure: B:upper left panel—X: JZ1A_1 raw, Y: baseline JZ2A_4 raw, correlation: 0.914; lower left panel—M-A plot before normalization. B: upper right panel—X:JZ1A_1 normalized, Y: baseline JZ2A_4 raw, correlation: 0.919; lower right panel—M-A plot after normalization.)
doi:10.1371/journal.pone.0120336.g002
Tissue Elasticity Regulated Tumor Gene Expression
PLOS ONE | DOI:10.1371/journal.pone.0120336 March 16, 2015 5 / 32
Fig 3. Choice of normalization method affects gene expression balance.Histograms showing the distribution of up or downregulated genes normalizedby (A) invariant set normalization or (B) Quantile normalization grown on PAA compared to PS. A negative fold change (FC) represents genes downregulatedon PAA and a positive FC represents genes upregulated on PAA.
doi:10.1371/journal.pone.0120336.g003
Tissue Elasticity Regulated Tumor Gene Expression
PLOS ONE | DOI:10.1371/journal.pone.0120336 March 16, 2015 6 / 32
Fig 4. Greater number of miRNA binding sites predicted from probes downregulated on PAA. A random samples of 50 probes upregulated on PAA(FC> 2) was compared to 50 probes highly downregulated on PAA (FC< -10). MicroRNA target sites were predicted from the 3' UTR of each probe for eachset collected using the microRNA.org resource. Histograms of the predicted number of miRNA targets are for the probes (A) downregulated on PAA and (B)upregulated on PAA. (C) Box p lot that compared the distribution of the two sets of probes.
doi:10.1371/journal.pone.0120336.g004
Tissue Elasticity Regulated Tumor Gene Expression
PLOS ONE | DOI:10.1371/journal.pone.0120336 March 16, 2015 7 / 32
downregulated genes are evenly distributed, the quantile normalization results were invali-dated. We therefore relied upon the normalization results from rank invariant set for subse-quent data analyses. Finally, to identify differentially regulated and unregulated genes, the twoconditions (PA and PAA) were compared and filtered to include only the genes that met thefollowing well-established criteria: (1) probes with a p-value less than 0.05 using a paired t-test.(2) Signal intensity is greater than 100 in 50% of the probes. (3) Signal intensity is with a lowerthan 90% confidence bound of fold change (FC).As such, 15,515 probes were filtered from theoriginal 54,639 probes of the gene chip. Following filtration, the distribution of differentialgene expression between PS to PAA was skewed towards a negative fold change. Of the remain-ing 15,515 filtered probes, 1,220 (7.86%) were unregulated (|FC|< 1.2), 7,139 (46.01%) werefound to be differentially regulated (|FC|> 2), 575 (3.70%) were upregulated (FC> 2) whengrown on PAA compared to PS, and 6,564 (42.30%) were downregulated (FC< -2) whengrown on PAA compared to PS (Table 2). At greater fold changes, there was an increase in theratio of downregulated probes to upregulated probes (Fig. 3, Table 2).
Thus, all the above aggregate findings (unnormalized, normalized, MA plot, histogram, andfiltered comparisons) consistently led to the conclusion that the substrate was likely a factor inthe down regulation of gene transcripts in tumor cells on PAA compared to cells on PS.
Downregulation of Genes on PAA by miRNAThe high degree of genes downregulated on soft polyacrylamide (PAA) hydrogel suggests amechanism that preferentially downregulated messenger RNA (mRNA). Mechanisms such asDNAmethylation and histone modification can downregulate mRNA expression, but they canalso upregulate its expression depending on the default state of the gene. Downregulation ofgene expression leads to a reduction in production of gene products and, ultimately, to a de-crease of effector activity. However, reductions in the activity of the gene products could havethe same effect of decreased effector activity. Regulation by microRNA (miRNA) is a post-transcriptional process that silences mRNA expression by binding of the miRNA to compli-mentary regions on the three prime untranslated regions (3' UTR) of mRNA ultimately causingboth the inhibition of translation and the destabilization and degradation of mRNA. Thus, wewanted to test whether miRNA silencing was more closely associated with genes that weredownregulated than for those upregulated on PAA.
To confirm this close association, we took a random sample of 50 probed genes that werehighly downregulated on PAA as evidenced by a fold change of less than-10 (FC< -10) andcompared them to a random sample of 50 probed genes that were upregulated on PAA as
Table 2. Proportion of probes up or downregulated on PAA.
Note: Proportion of probes up or downregulated on PAA. As an example, 7139 probes had a |FC| > 2 and of those, 6564 were downregulated and 575
were upregulated.
doi:10.1371/journal.pone.0120336.t002
Tissue Elasticity Regulated Tumor Gene Expression
PLOS ONE | DOI:10.1371/journal.pone.0120336 March 16, 2015 8 / 32
indicated by a fold change greater than 2 (FC> 2). Our analysis found a statistically significantdifference in gene regulation between genes highly downregulated and upregulated on PAA.
A web resource (www.microRNA.org) was used to collect miRNA target sites of downregu-lated genes that had a mirSVR algorithm score (a measure of probability that a particularmiRNA would repress a gene) of less than-0.10, an established parameter. The probability ofmiRNA binding to a site and the resulting degree of repression was with mirSRV scores lowerthan-0.10. Conversely, the probability of repression sharply drops at mirSRV scores greaterthan-0.10. A more stringent criterion may miss possible miRNA binding sites. The number ofpredicted miRNA binding sites for each downregulated gene in the two sample sets (PS versusPAA) was collected (S2 Dataset) and histograms of the predicted number of miRNA targets forthe probes downregulated on PAA (Fig. 4A) and upregulated on PAA (Fig. 4B) were createdalong with a box plot that compared their relationship (Fig. 4C).The result shows the numberof predicted miRNA bindings sites within genes downregulated on PAA was greater than ingenes upregulated on PAA (Fig. 4A, B, and C). The box plot and subsequent box plots are rep-resented by the median and the 10th, 25th, 50th, and 90th percentiles with circles representingoutliers. The number of predicted miRNA binding sites that were downregulated on PAA(mean = 33.460, SD = 21.647) compared to the predicted miRNA binding sites upregulated onPAA (mean = 10.840, SD = 9.778) was statistically significant (p< 0.001). This supports theidea that many transcripts were downregulated on PAA via miRNA silencing.
The proportion of individual genes within each set that were targeted by miRNA was com-pared between the downregulated and upregulated sets and demonstrated that the downregula-tion of mRNA was likely caused by an increase of individual miRNA levels, which wasinfluenced by the elasticity of the surface substrate (Fig. 5). Again, miRNAs were predicted tobind a greater proportion of genes downregulated on PAA than those upregulated on PAA.The Wilcoxon signed-rank test showed that the proportion of predicted genes targeted by indi-vidual miRNA was greater in genes downregulated on PAA than upregulated on PAA (Z =-12.085, p<. 001). This shows that the downregulation of transcripts could be caused by the in-crease in specific miRNAs on PAA.
During the process of collecting miRNA binding sites from the two sets of differentially regu-lated genes, we also recorded the length of the 3' UTR for each probe. The 3' UTR contains themiRNA binding sites and a longer 3' UTR should correlate to more potential miRNA bindingsites. The length of the 3' UTR for each probe downregulated on PAA was compared to the probesupregulated on PAA (Fig. 6). TheWilcoxon signed-rank test shows that probes downregulated onPAA have longer 3' UTRs than the probes upregulated on PAA (Z = -3.837, p<. 001).
Thus, microenvironment (elasticity) may lead miRNA functional changes, which in turnmoderate mRNA production. It appears that gene regulation is consistently different on the PSsubstrate compared to that on the PAA substrate. We examined what specific miRNA speciesmay change these substrate-regulated genes.
Identification of Tissue Specific miRNA CandidatesIf miRNAs that bind in different proportion to genes downregulated on PAA could be identi-fied, they may be candidates for brain specific gene regulation and be the agents of selective re-pression by the miRNA. The miRNA prediction relies on identifying sequences on the 3' UTRthat can correspond to several different miRNAs. Prediction of miRNA is determined, in part,by the identity of the mature miRNA sequence and its seed region that consists of the initial2–7 base pairs on the 5' end of the mature miRNA that binds to the 3' UTR. The collection ofmiRNAs predicted was annotated with its chromosomal location(s), mature miRNA sequence,and mirBase accession number for comparison purposes (S2 Dataset). Of particular interest
Tissue Elasticity Regulated Tumor Gene Expression
PLOS ONE | DOI:10.1371/journal.pone.0120336 March 16, 2015 9 / 32
Fig 5. Downregulation of genes on PAA by specific miRNAs predicted. A random samples of 50 p robesupregulated on PAA (FC> 2) was compared to 50 probes highly downregulated on PAA (FC< -10).MicroRNA target sites were predicted from the 3' UTR o f each probe for each set using the microRNA.org.Histograms of the proportion of genes predicted to be targeted by each miRNA was created for the set ofgenes (A) downregulated and (B) upregulated on PAA. (C) Box plot that compared the distribution of the twosets of probes.
doi:10.1371/journal.pone.0120336.g005
Tissue Elasticity Regulated Tumor Gene Expression
PLOS ONE | DOI:10.1371/journal.pone.0120336 March 16, 2015 10 / 32
Fig 6. Greater proportion of probes downregulated on PAA have a longer 3' UTR. A random samples of 50 probes upregulated on PAA (FC> 2) wascompared to 50 probes highly downregulated on PAA (FC< -10). MicroRNA target sites were predicted from the 3' UTR of each probe for each set using themicroRNA.org resource using a conserved mirSVR scores of< -0.1 as a filter to collect predicted miRNA target sites. Histograms of the length of the 3' UTRfor the probes (A) downregulated on PAA and (B) upregulated on PAA. (C) Box plot that compared the distribution of the two sets of probes.
doi:10.1371/journal.pone.0120336.g006
Tissue Elasticity Regulated Tumor Gene Expression
PLOS ONE | DOI:10.1371/journal.pone.0120336 March 16, 2015 11 / 32
are predicted miRNAs within the miRNA clusters of C14MC and C19MC. The C14MC cluster(also named miR-379–410 cluster) is located on the chromosomal locus 14q32.31; several miR-NAs within the cluster were predicted from genes downregulated on PAA. C14MC, a mater-nally imprinted cluster, has miRNAs that are processed from a long non-coding RNAcontaining dozens of intronic miRNA, which has tissue specific expression that is the strongestin the brain tissue of monkeys [17]. Other interesting miRNAs that were enriched on PAAwere predicted within the C19MC cluster located on the chromosomal locus 19q13.42, theMIR371–373 cluster, and the MIR302–367 cluster located on the chromosomal locus 4q25(S1 Dataset). All three clusters contain a similar miRNA sequences that characterize stem cells,miR-520, miR-302, miR-372, and miR-373 and have an identical seed sequence of AAGUGC(S1 Dataset). The identical seed sequences of these miRNA demonstrate that the prediction ofmiRNA can be non-specific to a single miRNA. The C19MC cluster also contains intronicmiRNA that is processed from a large non-coding RNA. The amplification of miRNAs withinthe C19MC cluster is associated with central nervous system primitive neuroectodermal em-bryogenic tumor (CNS-PNET), which matches the type of tumor under study.
Although we were able to predict possible miRNA that bind to target sites, we lacked a sta-tistical test to show that the predicted miRNAs were statistically significant. To address this, weused DIANA-mirExTra (www.microrna.gr/mirextra), a web server that uses an alternativemethod to detect and score miRNA target binding sites using expression data. Diana MicroTv3.0 web server Probe sets (Table 2) were used to compare differentially regulated genes sets toa group of unregulated genes (|FC|< 1.2) for prediction miRNAs that were differentially regu-lated when grown on PAA. Histograms were then created to show the proportion of predictedmiRNAs that were significantly different from the unregulated gene set (Fig. 7). The resultsdemonstrate that the genes highly downregulated (FC< -10) and downregulated (FC< -2) onPAA (Fig. 7A,B) had a significantly larger proportion of predicted miRNA (p< 0.05) than thegenes upregulated (subset of 500 probes with a FC> 2) on PAA (Fig. 9C). Only 0.9% (5/555)of the predicted miRNA within the upregulated genes set was statistically greater from the un-regulated gene set (Fig. 7C, S2 Dataset), while 70.8% (393/555) of the miRNA predicted withinthe highly downregulated genes was predicted to be greater than the unregulated set (Fig. 7A,S2 Dataset). Interestingly, the subset of 500 probes with a FC< -2 had 80.7% of the miRNAsignificantly greater than the unregulated set (Fig. 7B, S2 Dataset), which was an unexpectedlyhigher proportion than FC< -10 set. Subsets were used because of technical limitation of theweb server that prevented the processing of very large data sets such as the set of genes with aFC< -2 (6,564 probes) or FC< -5 (1,871 probes). The lowest p-value calculated by Diana-mir-Extra was 1 x 10–19 which corresponds to the peaks at a-ln (p-value) of 43.74 (Fig. 7A and B).
Functional Gene AnalysisGene Ontology (GO) terms are defined by three attributes of wild-type gene products: theirmolecular function, the biological processes in which they play a role, and their subcellular lo-cation [18]. To search for functional gene enrichment between the two conditions, the list ofdifferentially regulated genes with |FC|> 2 was used to search for enriched annotated GeneOntology (GO) terms, Kyoto Encyclopedia of Genes, and Genomes (KEGG) pathway termsusing The Database for Annotation, Visualization, and Integrated Discovery (DAVID) soft-ware. DAVID provides biological meaning behind large list of genes and KEGG is a collectionof online databases dealing with genomes, enzymatic pathways, and biological chemicals. TheKEGG PATHWAY database records networks of molecular interactions in the cells and vari-ants of those networks specific to particular organisms. In each database, genes are annotatedwith a list of terms describing its functions. The list of terms from differentially regulated genes
Tissue Elasticity Regulated Tumor Gene Expression
PLOS ONE | DOI:10.1371/journal.pone.0120336 March 16, 2015 12 / 32
Fig 7. MicroRNAs predicted from sets of genes downregulated on PAAwere significant different fromgenes unregulated on PAA.MicroRNA targets from genes sets that were, downregulated (subset of genesFC< -2), highly downregulated (FC< -10), or upregulated (FC> 2) were compared to predicted miRNAtargets in the set of genes that was unregulated (FC< 1.2) utilizing Diana-mirExtra to identify miRNA thatwere statistically significant (p< 0.5) between the sets. The histograms show the number of predicted
Tissue Elasticity Regulated Tumor Gene Expression
PLOS ONE | DOI:10.1371/journal.pone.0120336 March 16, 2015 13 / 32
was compared to a list taken from background genes and a probability that a particular func-tion is enriched in the differentially regulated set compared to the background list is made. Thelist of differentially regulated genes consists of 7,139 probes representing approximately 30% ofthe genes expressed. From this comparison, we observed a large number of terms that were en-riched in the list of differentially regulated genes that also represented a broad collection of GOterms and KEGG pathways (S3 Dataset). A relevant KEGG pathway that was shown to be en-riched was the focal adhesion pathway (hsa04510) which mediates cell anchorage to the ECMand can sense and react to changing cell elasticity. The differentially regulated genes weremapped onto the focal adhesion pathway (Fig. 8); genes highlighted in red indicate probes dif-ferentially regulated on PAA (|FC|> 2). Inspection of these genes revealed that all of theprobes were downregulated on PAA instead of being upregulated. Interestingly, this bias wasalso seen on most, but not all, terms and pathways that were found to be functionally enrichedon PAA, suggesting that microenvironment (tissue elasticity) play a key role forgene downregulation.
miRNAs that were statistically significant when comparing the set of unregulated genes to a set of genes (A)highly downregulated, (B) downregulated, or (C) upregulated. The lowest p-value calculated by Diana-mirExtra was 1 x 10–19 which corresponds to the peaks at 43.74.
doi:10.1371/journal.pone.0120336.g007
Fig 8. Functional gene enrichment of the KEGG focal adhesion pathway.Differentially regulated genes were mapped onto a KEGG pathway(hsa04510) that was found to be enriched between the culture conditions. Genes highlighted red indicates probes downregulated on PAA (FC< -2),including ITGA, ITGB, PKC, Fyn, RhoGAP, FAK, PI3K, Calpain, Actinin, Vinculin, Parvin, Vav, DOCK1, Rap1, JNK, ERK1/2, GSK-3β, β-Catenin, MLCP,ROCK, RTK, Shc, Sos, Raf1. No probes highlighted were upregulated on PAA (FC> 2) within this pathway.
doi:10.1371/journal.pone.0120336.g008
Tissue Elasticity Regulated Tumor Gene Expression
PLOS ONE | DOI:10.1371/journal.pone.0120336 March 16, 2015 14 / 32
One of the genes regulated in the focal adhesion pathway related to matrix interaction isAKT, an oncogene that plays a variety of roles including anchorage-independent cell growth,apoptosis, metabolism, and angiogenesis. To observe if the downregulation of AKT gene tran-scripts resulted in lower protein expression and to show if the surface elasticity affected othercells, western blotting was performed on PNET (F3Y) cells and glioblastoma (ACBT) cellsgrown on PS or PAA. We observed that both the PNET and the glioblastoma cells had lowerAKT gene products on PAA compared to PS (Fig. 9), suggesting that these two cell lines mayshare regulation pathways under these conditions.
The GO terms that are enriched can help identify multiple types of gene regulation depend-ing on growth in a softer culture environment. Such a regulation may lead to an increase inmiRNA production in the cell. The large quantity of terms enriched and their broad rangemade it difficult to separate the terms that may have played a role in the upregulation ofmiRNA on PAA from the terms that are an effect of the increased miRNA production. To sep-arate the terms that regulate these processes, we have to interpret the terms enriched usingprior knowledge of the biology of these processes and design experiments to confirm them.Though not apparent at first, terms enriched in the differentially regulated gene set includedRNA binding, transcription, and spliceosome that are important in the mechanism of alterna-tive polyadenylation and alternative splicing. We propose alternative polyadenylation in thisstudy to have a role in the regulation of miRNA production.
Downregulation of miRNA Processing GenesTo evaluate our alternative hypothesis regarding polyadenylation and its regulation of miRNAproduction, we examined proteins that process miRNA. The Drosha and Dicer genes wereboth noted to have been down regulated on PAA (Fig. 10A and B). DGCR8, an RNA binding
Fig 9. Western blot of ACBT and F3Y cell lysate for AKT on PS or PAA.GAPDH and Actin served as loading controls.
doi:10.1371/journal.pone.0120336.g009
Tissue Elasticity Regulated Tumor Gene Expression
PLOS ONE | DOI:10.1371/journal.pone.0120336 March 16, 2015 15 / 32
Fig 10. Downregulation of miRNA processing genes on PAA.Microarray signal intensities of miRNA processing enzymes were compared on PS andPAA. Error bars represent standard deviation.
doi:10.1371/journal.pone.0120336.g010
Tissue Elasticity Regulated Tumor Gene Expression
PLOS ONE | DOI:10.1371/journal.pone.0120336 March 16, 2015 16 / 32
protein, assists the RNase III enzyme Drosha in the processing of miRNAs [19]. However,when examined, DGCR8 did not show significant downregulation on PAA (Fig. 10C). One ofits probes was downregulated but because the probes were at low signal intensities (~100), thebackground signal noise, and possible systematic errors were assumed to play a larger relativerole. Dicer had been previously found to be involved in a negative feedback loop with amiRNA, let-7; an increase of let-7, processed by Dicer to generate mature miRNA, also silencesDicer.
The Dicer, Drosha, and DGCR8 genes were examined, using www.microRNA.org to searchtheir 3' UTR regions, to predict conserved miRNA binding sites that were below a mirSVRthreshold score of-0.10. From this criterion, Dicer had 57 miRNAs that were predicted to bindto its 3' UTR compared to 25 for Drosha and 13 for DGCR8. The list was compared to the pre-dicted miRNAs previously found significant in the set of genes highly downregulated (FC<
-10) on PAA compared to the unregulated gene set (Fig. 7A, S2 Dataset). Of the 57 miRNAbinding sites identified on Dicer, 47 of those were predicted to be downregulated on PAA(Table 3).
An alternative miRNA prediction algorithm, Diana-microT v3.0 (miTG score> 7.3), wasused to identify 54 predicted miRNAs binding sites for Dicer with 46 found to be significantfrom Diana-mirExtra (Table 3). Significant miRNAs were also found for Drosha and DGCR8using the same methods. This is evidence that groups of miRNAs expressed together have arole in the negative feedback of miRNA production and builds on previous studies of a singlemiRNA, let-7 and Dicer negative feedback.
Identification of Transcripts Containing Intron Sequences for CellsGrown on PAAAmong the differentially regulated probes sets, there were genes that contained both upregu-lated and downregulated probes which may indicate they are isoforms of the genes that wereregulated by the tissue elasticity of the surface medium. As many probes exhibit this behavior,we first examined epidermal growth factor receptor (EGFR). The EGFR probe was highlydown regulated on PAA. EGFR is an oncogene that is overexpressed in many cancers including
Table 3. Negative feedback regulation of miRNA processing enzymes by miRNA.
mRNA Dicer Drosha DGCR8
Total conserved miRNAs predicted tobind to each mRNA (microRNA.org)
25 13
Number of conserved miRNAs foundsignificant (Diana-mirExTra)
24 13
mRNA Dicer Drosha DGCR8
Total miRNAs predicted to bind toeach mRNA (Diane-microT v3.0)
0 4
Number of miRNAs found significant(Diana-mirExtra)
0 4
Note: The number of miRNA that bind to each mRNA was predicted using either microRNA.org using a
threshold score of less than-0.10 or Diana-microT v3.0 with a threshold score of greater than 7.3. Diana-
mirExtra was used to identify the miRNAs that were significantly downregulated on PAA (FC < -10, p<
0.05) from unregulated genes and used here to determine the proportion of predicted miRNA significant
compared to the total miRNAs predicted for each miRNA processing gene.
doi:10.1371/journal.pone.0120336.t003
Tissue Elasticity Regulated Tumor Gene Expression
PLOS ONE | DOI:10.1371/journal.pone.0120336 March 16, 2015 17 / 32
40–50% of glioblastomas and epithelial cancers. EGFR is one of the receptor tyrosine kinasesenriched in the focal adhesion pathway analysis.
EGFR is a cell surface receptor that interacts with ECM proteins, some of which were highlydownregulated on PAA. We mapped the EGFR genes using Ensembl and added the HGU133Plus 2.0 probe tracks to align the probes onto the gene sequence to locate possible splice vari-ants that were regulated by tissue elasticity. Unexpectedly, two of the probes (232541_at and232925_at) were mapped to intron sequences for EGFR. It had an expression signal that indi-cated the presence of the transcripts on PS but its downregulation on PAA. Mature mRNAhave intron sequences spliced out of the transcript and the identification of introns in EGFRtranscripts point to an alternative isoform containing intron sequences. Other ECM genes werenext checked for the existence of introns within their transcript and we found more evidence ofintrons within these transcripts. Though not every single gene examined contained intron se-quences, it was common within probes that were highly downregulated on PAA. The presenceof introns within transcripts may be caused by the softer surface environment of PAA, whichreflect a process that may also occur in native cells. In addition, many genes only have a fewprobes within introns, which was a limitation of the array platform. We then examined a non-coding RNA, maternally expressed gene 3 (MEG3). MEG3 is a well-studied gene that has manyhighly downregulated probes when grown on PS compared to PAA. It is neighboring theC14MC cluster that we identified earlier and may be a source of miRNA that was upregulatedon PAA. Most of the probes of MEG3 reside in intron regions and all of them were highly dif-ferentially regulated on PAA.
Characterization of PNET Invasiveness Induced by Cytokines on PAAWe emphasized here that we used high-throughput gene expression experiments to identify orpredict the role of genes involved in biological conditions of interest like stiffness, a schemethat has been widely applied. Keklikoglou and colleagues show that overexpression of miR-520/373 members reveals a strong downregulation of transforming growth factor-β (TGF-β)signaling and a negative correlation between miR-520c and TGFBR2 expression was observedin estrogen receptor negative (ER(-)) breast cancer patients[20]. Liu and Wilson made a directconnection that miR-520c and miR-373 increased the expression and activity of MMP9 in 3Dtype I collagen gels [21]. TGFβ and TNFα regulate the expression and activation of MMP9 [22]while IL-1 regulates MMP9 activity[23]. Taken together, we rationalized we could measure thecytokine regulated MMP9 activity to proposal an involvement of miRNA expression.
MMPs are secreted by cells to degrade ECM, to remodel and maintain their microenviron-ment. Migratory cells secrete MMPs to break down the basement membrane to pass throughthe tissue barrier. In stem cells and cancer cells, MMP2 and MMP9 are regulated by cytokinessuch as TGFβ2 and TNFα. In our experiments, we added 0, 10, 20 ng/mL TNFα to F3Y cellsgrown on PS and assessed their enzymatic activities using gelatin zymography andWesternblotting. The results show that MMP2 was slightly induced by 10 ng/mL of TNFα and greaterlevels of the cytokine show no additional effect (Fig. 11A). AKT and p-AKT are proteins down-stream from TNFα signaling and were used to determine if the phosphorylated AKT (p-AKT)was affected but no change was observed (Fig. 11B). Similar experiments were also done on PSand PAA conditions with the addition of either zero (C, control) or 10 ng/mL of TGFβ2 orTNFα (Fig. 12). To concentrate the amount of MMP loaded onto the well, Gelatin Sepharose4Bbeads were used to bind to MMP proteins. On PS, both TNFα and TGFβ2 were able to in-duce MMP9 and MMP2 activity in the condition medium of F3Y cells from the control(Fig. 12A). On PAA, the reverse occurred when either TNFα or TGFβ was added on cellsgrown on PAA where there was a repression of MMP activity (Fig. 12A).Western blotting of
Tissue Elasticity Regulated Tumor Gene Expression
PLOS ONE | DOI:10.1371/journal.pone.0120336 March 16, 2015 18 / 32
MMP2 showed nearly equal levels of MMP2 protein (Fig. 12B). Deb and colleagues show thatthe lower molecular weight, gelatin-degrading activity is an activated form of MMP-2 in U87human glioma cells [24]. Han and colleagues show that multiple isoforms of MMP9 are in-duced with TGFβ or TNFα [22]. In Fig. 12A, we observed multiple bands, indicating that mul-tiple forms of MMP2 were induced. These might include pre-MMP2 (72 kDa) and activeMMP2 (62 kDa). However, certain conditions led to generate the 65 kDa and 68 kDa MMP-2isoforms [25]. We didn not know why in Fig. 12B, the MMP2 molecular weight in PAA-cul-tured cells seemed to be a little smaller than those in PS-cultured cells as indicated by Westernblot analysis. These might be result from alternative splicing specifically induced byPAA condition.
We further asked if any specific miRNAs regulate MMP expression. As shown in Fig. 9,PAA induced AKT expression compared with the cells on PS. That prompted us to investigate
Fig 11. Gelatin zymography andWestern blot analysis of F3Y cells induced by TNFα. 0, 10, or 20 ng/mLTNF was added to each culture. Purified MMP9 protein was used the MMP9 control. (A) Gelatin zymographywas performed on the conditioned medium and (B) western blot was performed on the cell lysates.
doi:10.1371/journal.pone.0120336.g011
Tissue Elasticity Regulated Tumor Gene Expression
PLOS ONE | DOI:10.1371/journal.pone.0120336 March 16, 2015 19 / 32
if PAA induced other gene expression. The difference between PS and PAA was PAA; a soft na-tive environment (1-kPa) allows tumor cells to be invasive, while on PS, a stiff (100-kPa) sur-face is with reverse effect. Therefore, we focused on MMP9 and MMP2 expression becausethey are the enzymes responsible for tumor invasion.
Huang and colleagues found that human miR-373 and miR-520c stimulated cancer cell mi-gration and invasion in vitro and in vivo, and that certain cancer cell lines depend on endoge-nous miR-373 activity to migrate efficiently [26]. Further clinical specimen analyses show thatsignificant upregulation of miR-373 that correlated inversely with CD44 expression. These im-plicate that miR-373 and miR-520c promote tumor invasion and metastasis [26]. This is con-sistent with our data showing that on PAA, a soft native environment (1-kPa) allows tumorcells to be invasive while on PS, a stiff (100-kPa) surface is with reverse effect.
We observed an induction of MMP activity by TNFα and TGFβ2 when they were added toF3Y cells on a standard polystyrene culture plate but a reduction of MMP activity when thecells were cultured on a softer hydrogel plates (Fig. 12A and B). Our study predicted a large-scale increase in microRNAs from PS to the PAA environment. A previous study on fibrosar-coma cells showed an increase in MMP9 activity could be explained by miR-520c and miR-373that acts by targeting the 3’UTR of mTOR and SIRT1 and its downstream effectors and kinasesto inactivating signaling pathways that negatively regulate MMP9 expression [21]. Our study
Fig 12. Tissue elasticity modifies F3Y cells physiology and regulation of MMP activity via miRNAregulated signaling pathway. F3Y cells were grown on PS or PAA without cytokines (C, Control), 10 ng/mLof TNFα, or 10 ng/mL of TGFβ added. (A) Sepharose bead pull down of cell conditioned medium followed bygelatin zymography. (B) Western blot analysis of the F3Y cell lysates for MMP2. (C) Agarose gelelectrophoresis of PCR products, Lane 1: mir-520c pri-miRNA expression on PS; Lane 2: mir-520c pri-miRNA expression on PAA; Lane 3: No template control. (D) Agarose gel electrophoresis of PCR products,Lane 1: CD44 expression on PS; Lane 2: CD44 expression on PAA, Lane 3: CD44 expression on PS +acrylamide monomer solution; Lane 4: CD44 expression on PS + supernatant from PAA plate (PAAdegradation products).
doi:10.1371/journal.pone.0120336.g012
Tissue Elasticity Regulated Tumor Gene Expression
PLOS ONE | DOI:10.1371/journal.pone.0120336 March 16, 2015 20 / 32
predicted that both mir-520c and miR-373 binding sites were common among the 3’ UTRs ofgenes downregulated on PAA compared to PS (S1 Dataset). This suggests that these samemicroRNAs were upregulated on PAA and we choose to confirm this by performing RT-PCRon reported and predicted miR-520c and miR-373 targets that are involved in MMP regulationand TNFα and TGFβ signaling. We also hypothesized that the change in the softer elasticity ofPAA caused a change in the cell’s physiology that cause a decrease in MMP actively upon intro-duction of these cytokines and examine key genes from pathways that may influence MMP ex-pression. This is a component of NF-κB, a transcription factor for MMP9 [20, 27] and thereceptor for TGFβ2, TGFβR2, which are both targeted by miR-520c and miR-373 [20]. We alsoexamined CD44, a well-established biomarker for PNET in children[28] and with prognosticvalue[29], which is involved in the activation of MMP9 [30], and is targeted by miR-520c andmiR-373 by suppressing CD44 translation [26,31]. As miR-520c [32] was upregulated on PAA(Fig. 12C), however, CD44 expression was downregulated on PAA (Fig. 12D). In addition, wefound that these changes were due to the physical property of matrix, but not due to chemicalsignals (monomers or PAA degradation products) (Fig. 12D).
DiscussionPAA plate is a very mature material and has been well studied for the impact of their physicalelasticity on cell fate determination [12,33]. PAA produces linear stiffness gradients of at least115 kPa/mm, extending from one kPa (brain stiffness equivalent) to 240 kPa (bone stiffnessequivalent). This work addressed the role of substrate elasticity on gene expression of cancercells. Specifically, we used whole genome microarrays to measure transcriptional expressionand identify processes that are affected by the difference in the elasticity of the surface medium.The preferential downregulation of transcripts was identified when cells were grown on PAA.The silencing of those transcripts may be caused by miRNAs. The presences of transcripts con-taining intron sequences in PNET cells on PS may be a source of miRNA silencing. A cellularchange in the functional response to cytokines was due to the change in tissue elasticity. A sig-naling pathway (AKT) regulated by tissue elasticity was determined from the microarray data.The cancer cells’ AKT-regulated physiologically relevant signaling was examined by gelatinzymography. This was used to measure cell invasiveness by examining the expression and ac-tivity of MMPs that degrade ECM, thereby creating space for cellular growth and invasion. Weshowed the downregulation of several ECM proteins on PAA. The identification of possiblemiRNA as biological markers is specific for PNETs and brain cancer.
The elasticity of tissue ECM in vivo is determined by a balance between the secretion ofECM proteins and the degradation of the ECM by their proteases for cells. For cells grown onsofter tissue, the balance favors more protease secretion, while on stiffer and less elastic tissue;more ECM proteins would be expected. Cancer cells grown on the softer PAA surface may rec-ognize it as a native ECM (brain environment equivalent) and may adapt to the environment.Tissue elasticity has been shown to influence the differentiation of normal stem cells towardsspecific cellular lineages, showing that substrate elasticity determines stem cell fate [34]. Wehave discussed the possible advantages and disadvantages of using PS, PAA, agarose, organoty-pic culture, and animal models [1]. We have shown that stem cells migrate through fiber tracksin organotypic culture [9]. Cancers are thought to originate from CSCs, which like normalstem cells, would be affected by the elasticity of the tissue. Here, we examined how cells of aspecific type of brain tumor type, PNET, respond to culture conditions that more closely re-semble the elasticity of brain tissue compared to standard culture plate conditions. The growthof cells on the softer elasticity of the PAA surface may have a cellular response and behavior
Tissue Elasticity Regulated Tumor Gene Expression
PLOS ONE | DOI:10.1371/journal.pone.0120336 March 16, 2015 21 / 32
that more closely to in vivo environmental conditions. Cells grown on standard PS plates areless representative of normal tissue milieu.
By using cell invasiveness as an index of the simulated conditions for in vivo brain, we firstperformed the functional response of PNET cells to the soft PAA or rigid PS surfaces by exam-ining the cell invasiveness related MMPs enzymatic activity with gelatin zymography. We fur-ther studied if MMPs are regulated by cytokines due to the change in tissue elasticity at theprotein level. The difference in gene expression patterns between the PNET cells cultured onPS and PAA attracted us focusing on how miRNA regulation can affect the gene expression be-tween the two tissue culture environments, and investigating if there are physiological changesthat occur in cells between the PS and PAA culture conditions.
Our data supports the hypothesis that changes in tissue elasticity of cells can affect gene reg-ulation by miRNAs. Furthermore, novel miRNA products may rise from the alternative polya-denylation of intron sequences containing primary miRNA sequences. Cells grown in vivomayalso use alternative polyadenylation to regulate miRNA expression and that the set of miRNAexpressed would vary in different tissue types.
Our analysis of differentially regulated genes between the PS and PAA culture conditionsshowed a majority of probes downregulated on PAA (negative fold change) instead of upregu-lating on PAA (positive fold change) (Figs. 2, 3; S3, S4, S5, S6 Datasets). Unbalanced gene ex-pression is known to be common in cancer [35,36,37], which may reflect the differentiation ofthe cells away from a normal cell phenotype. A method for analyzing genes given the complexi-ty of differential expression like our sample has not yet been developed and widely used. Com-mon methods assume that gene distribution follows a normal distribution and thatdifferentially expressed genes are expected to be equally distributed between upregulated anddownregulated genes, and that only a small amount of genes change between different types oftreatments[36].
We identified specific miRNAs that enriched on PAA and may be regulated by the elasticityof the surface type. The increase in numbers of miRNA on targeting genes was recognized as acritical factor for the gene downregulated on PAA. To show that the predicted miRNAs was de-pendent on the elasticity of the cell, comparison of the number of unique miRNAs per genewas analyzed to show that individual miRNA had higher chance to bind to genes downregu-lated on PAA rather than binding of a gene upregulated on PAA (Fig. 5). The Wilcoxon rankedsum test showed that miRNA binding was greater in the genes downregulated on PAA thandue to chance. The Wilconox ranked sum test was performed instead of a paired t-test becausewe could not assume a normal distribution from the sampled probes. This probability (withstatistically significant p-values) was an estimate of how likely a miRNA binding site would befound on a gene grown on PAA or PS.
The finding of multiple miRNA genes that are part of clusters being enriched in the set ofgenes downregulated on PAA was an evidence to support our hypothesis. miRNAs within clus-ters were expressed and regulated together, which in turn to silence a groups of targeting genes.So the clustered expressing miRNAs play an important role in gene expression pattern on dif-ferent cultural conditions. The expression pattern will be a characteristic of a cell in a given ex-tracellular condition. These clustered expressing miRNA such as the C14MCmiRNA cluster(S1 Dataset) can be used as marker molecules for PNET cells cultured on PAA. The identifica-tion of miRNAs enriched in the brain specific C14MCmiRNA cluster and the C19MC clustershown us the evidence that PAA is able to mimic neuronal tissue [38,39].
The identification of stem cell specific miRNAs(miR-520, miR-302, miR-372, and miR-373)[40,41], which was predicted to be increased on PAA is an indication that the PAA tissue envi-ronment may allow the PNET cells to return to a less differentiated state (S1 Dataset). Theywere all identified to have down regulated mRNA expression on PAA but because they have
Tissue Elasticity Regulated Tumor Gene Expression
PLOS ONE | DOI:10.1371/journal.pone.0120336 March 16, 2015 22 / 32
identical seed sequences we cannot determine to what degree, each miRNA is upregulatedwithout further study. They may all target the same sites and have similar function to increasecell "stemness”. The other miRNAs that were predicted to vary between PAA and PS(S1 Dataset) may be potential cancer cell, stem cell, and diagnostic markers specific tumortypes that have not been characterized as of yet.
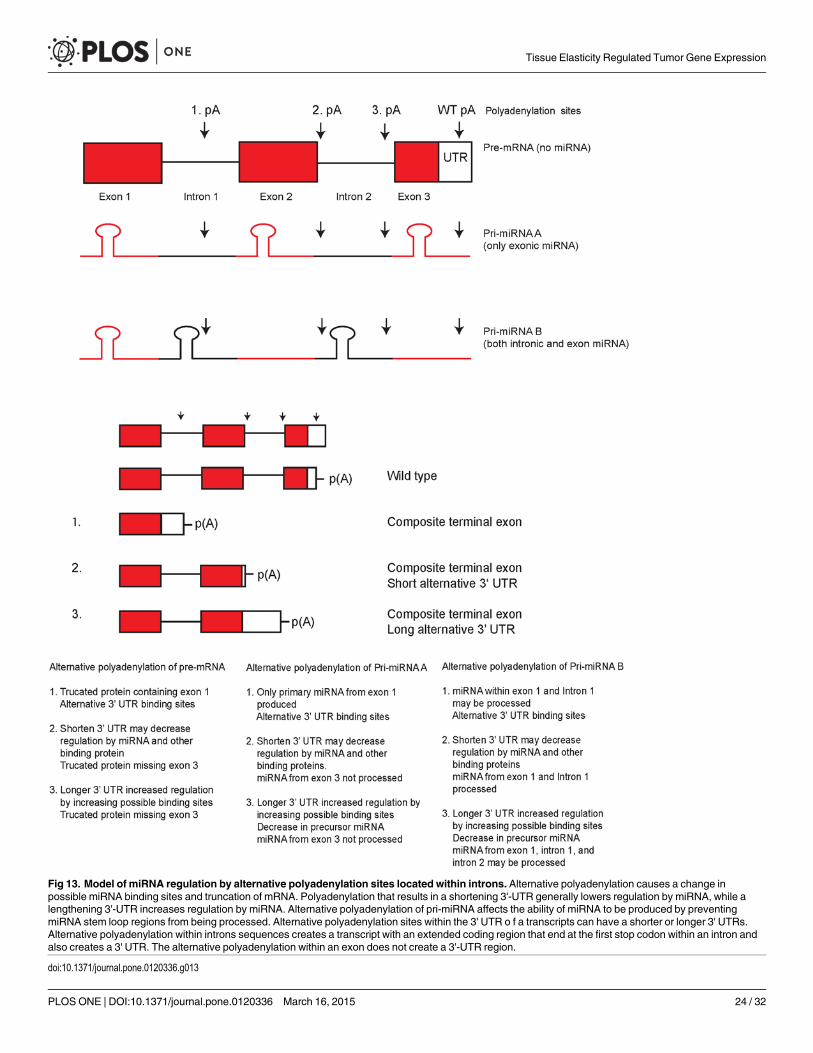
Functional enrichment of differentially regulated genes was performed to identify gene on-tology (GO) terms and KEGG pathways that may change between the two surface conditionsand to help discover why miRNAs may be downregulated on PAA. Many terms and pathwayswere enriched on PAA (S3 Dataset) but closer examination of the probes involved showed thatmost of the terms and pathways enriched were caused or highly influenced by probes whichwere downregulated on PAA. Since the terms and pathways identified to be functionally en-riched also show bias from the asymmetrical distribution of the differentiated genes, the identi-fication of the terms and pathways would not be ideal in separating the causes from the effectsof miRNA silencing on PAA. Another source of difference in miRNA expression between thecells on PS and PAA come from alternative polyadenylation. About half of all miRNA are with-in intron regions of coding regions and the other half are within the intron and exon regions ofnon-coding RNA [42]. Alternative polyadenylation of these sites can create alternative 3' UTRthat have different binding sites recognized by a tissue specific miRNA. Alternative polyadeny-lation that result in a short 3'-UTR would have less targets for miRNAs and a long 3'-UTRwould have in more possible targets to be regulated by miRNAs. In our model, alternative poly-adenylation of primary-miRNA (pri-miRNA) within introns can act to prevent miRNA frombeing processed. A single pri-miRNA may contain one to six miRNA precursors (pre-miRNA). If we fit the results into our model, mRNA from PNET cells grown on PS are alterna-tively polyadenylated within introns of coding sequences, but when the cells are grown onPAA, newly processed miRNA that is induced by the PAA growth conditioned binds to the3' UTR and rapidly degrades the mRNA rather than a slow decay. The newly processedmiRNA is dependent on the polyadenylation site of pri-miRNA. The increase in miRNA pre-dicted when ours cells were grown on PAA suggest that polyadenylation occurs further down-stream in pri-miRNA which would result in more miRNA produced. Pri-miRNA can also bedownregulated by other miRNA or from their own miRNA that they code for which act as anegative feedback mechanism on the production of their own miRNA and effect the regulationof other mRNA and miRNAs and so on. The opposite may also occur where alternative polya-denylation isoforms are produced that avoid downregulation by miRNA.
To elaborate how alternative polyadenylation sites on PS are downgraded on PAA, we showthat on PAA, alternative polyadenylation of introns can induce a new set of miRNA not pres-ent on PS (Fig. 13). Some alternative polyadenylation sites that were originally present on PSwould be silenced by the newly synthesized miRNA. Synthesis of new miRNA also causemiRNA levels to rise and increase binding to 3' UTR sites of Dicer and to the newly synthesizedpri-miRNA which would also be silenced if it had the same target sites on its 3' UTR. The nega-tive feedback of Dicer would prevent the continued production of miRNA that are not nega-tively regulated by specific miRNA and over time miRNA not produced are degraded and notreplaced and result in a change in the characteristics of the cell.
The softer PAA surface represents a cellular microenvironment that may be closer to nativecell conditions, while the PS condition represents a microenvironment that is closer to that ofstiffer tissue. The negative feedback mechanisms that control miRNA and Dicer may also con-trol the expression of genes on different types of tissue. Cells grown on bone, muscle, and braintissue may have a set of tissue specific miRNA that is induced in their microenvironment andregulated by Dicer and miRNA negative feedback mechanisms.
Tissue Elasticity Regulated Tumor Gene Expression
PLOS ONE | DOI:10.1371/journal.pone.0120336 March 16, 2015 23 / 32
Fig 13. Model of miRNA regulation by alternative polyadenylation sites located within introns. Alternative polyadenylation causes a change inpossible miRNA binding sites and truncation of mRNA. Polyadenylation that results in a shortening 3'-UTR generally lowers regulation by miRNA, while alengthening 3'-UTR increases regulation by miRNA. Alternative polyadenylation of pri-miRNA affects the ability of miRNA to be produced by preventingmiRNA stem loop regions from being processed. Alternative polyadenylation sites within the 3' UTR o f a transcripts can have a shorter or longer 3' UTRs.Alternative polyadenylation within introns sequences creates a transcript with an extended coding region that end at the first stop codon within an intron andalso creates a 3' UTR. The alternative polyadenylation within an exon does not create a 3'-UTR region.
doi:10.1371/journal.pone.0120336.g013
Tissue Elasticity Regulated Tumor Gene Expression
PLOS ONE | DOI:10.1371/journal.pone.0120336 March 16, 2015 24 / 32
The process of the metastasis of tumors, the migration of cancer cells and stem cells fromone tissue type to another, and the ability of the cell to adapt to its new environment would bedependent on the ability of the cell to recognize its ECM environment and adapt to it to sur-vive, grow, and replicate. This study suggests that the mechanism that allows cells to adapt totheir environment involves miRNA regulation of gene expression which is influenced by theelasticity of surface environment. When the cells do adapt to the environment, the behavior ofthe cell and the response to external stimulus is also changed.
MicroRNA 520c and 373 (miR-520c and miR-373) have been characterized as oncogenes inprostate cancer [31]), cancer cell metastasis-promoting factors in breast cancer [26], andtumor suppressors in estrogen receptor negative breast cancer [20]. Both miR-520c and miR-373 confer robustness to biological processes by upregulation of activity of MMP9 in human fi-brosarcoma cells [21]. Mechanistically, both miR-520c and miR-373 upregulate MMP9 expres-sion by targeting mTOR and SIRT1-mediated Ras/Raf/MEK/Erk signaling pathway and NF-κB factor. Our results suggest a change in the physiology of the PNET cells when they aregrown on PAA based on gelatin zymography of the PNET cells and their responses to cyto-kines. Other laboratories have found such changes in MMP activity responding to cytokines indifferent cell types. These include skin [22], decidual cells of the placenta [43], nucleus pulpo-sus tissue of intervertebral disc [44], and MMP2 of glioma [45]; however, it has not been docu-mented on reduced MMP2 or MMP9 activity, reversed in response to the cytokines signal. Inthis study, a large proportion of genes were differentially regulated between the PS and PAAculture environments that include ECM and cell receptor genes that receive and transmit cyto-kine signals as well as many downstream genes from those signals.
The MMPs changes on PS could be interpreted as a decrease in cell invasiveness. However,when the cells are grown on PAA, the induction of MMP activity by cytokines would be inter-preted as increasing cell invasiveness. This indicates that experiments performed on cellsgrown on standard PS cultures plates may not reflect in vivo conditions and that tissue elastici-ty can affect a cell's physiology such that responses to cancer drugs and treatments may nothave the desired effect if studies were only conducted on standard PS culture plates. Neverthe-less, the expression of miR-520c and miR373 involved in the up regulation of MMP9 couldnicely explain the experiments described on the modulation of cytokines activity by the sub-strate stiffness on MMP activities. This involvement of miRNA expression will be further di-rectly measured by managing miR-520c and miR373 expression in the brain-likemicroenvironment. The extent of downregulation of mRNA on PAA would suggest that themiRNA negative feedback mechanism acts like a biological switch, which can rapidly turn onmiRNA but limits it to a certain level of expression. But because miRNAs have a reported half-life of ~5 days [46], switching the miRNAs off may take several weeks and remains to be inves-tigated. This study only tracks the expression of the cell over a few days and further studieswould be needed to observe the effect of long-term growth on PAA compared to PS. We willfurther confirm the data obtained from PAAmatrix by using an ex vivo organotypic brain slicesystem and in vivo animal models.
Materials and Methods
PAA Hydrogel PreparationHydrogels were prepared as described previously [33,47] with some modifications. A 5% acryl-amide and 0.1% bis-acrylamide solution (1.25 mL of 40% acrylamide (Bio-Rad), 0.50 mL ofbis-acrylamide (Bio-Rad), 0.100 mL of 1M HEPES, and 8.15 mL of dH2O) was poured thathad a resulting expected modulus of elasticity of ~3.15 kPa ± 0.85 for use with cells of neuro-logical tissue origin. To catalyze the reaction, 50 μl of ammonium persulfate and 5μl of
Tissue Elasticity Regulated Tumor Gene Expression
PLOS ONE | DOI:10.1371/journal.pone.0120336 March 16, 2015 25 / 32
TEMED were added to the solution. The solution was passed through a syringe filter andpoured over a glass plate with 0.5 mm spacers and a second glass plate was placed over the so-lution to sandwich the liquid between two glass plates. The solution was allowed to gel underthe fume hood for 30 minutes. The top plate was carefully removed and a gel punch was usedto cut circular gels that are transferred onto the wells of a six well plate. A 0.5 mM solution ofsulfo-SANPAH (Pierce) in 50 mMHEPES pH 8.5 and 0.25% DMSO was prepared and used tocover the surface of the gel. The gel surface was exposed to UV light (365 nm) at a distance of2.5 inches for 10 minutes to covalently bind the sulfo-SANPAH onto the gel. The wells werewashed two times with 50 mMHEPES and addition sulfo-SANPAH solution was added andexposed to UV light for an additional 10 minutes. The wells were then rinsed three times withthe 50 mMHEPES solution. A solution of 1μg/mL Collagen type I (BD Biosciences) in PBSwas added to the wells to coat the surface of the gel by attaching to sulfo-SANPAH and was re-frigerated overnight. The gels were then washed twice with PBS. Cells were then seeded ontothe hydrogel.
Cell Culturing and HarvestingThe cells used in the microarray study were derived from neurospheres in neural stem cellselection medium isolated from a three year old female patient with a PNET (F3Y) as approvedby our institutional review board [10]. The cells were seeded on six welled tissue culture poly-styrene plates coated with collagen type I or on six well tissue plates containing a 5% polyacryl-amide gel coated with collagen type I. The cells were grown in and maintained in a solution of5% FBS in Advanced D-MEM (Gibco). Cells were harvested by aliquoting both the cells andthe medium into 15 mL conical tubes. The tubes were then centrifuged at 1600 rpm for 5 min-utes. The cell pellet was used for RNA extraction andWestern blot analysis while and the su-pernatant (conditional medium) was used for Zymography.
RNA Extraction and AnalysisTo extract total RNA, the cell pellet was treated with Trizol reagent (Invitrogen) according tothe manufacturer’s instructions. RNA concentration and purity was measured with a spectro-photometer at 260/280 nm. Total RNA was stored at-80°C. In experiments where cytokineswere added to culture, the cells were serum starved in 0.1% FBS plus Advanced DMEM over-night before cytokines were added and then maintained in 5% FBS-Advanced DMEM. Thecells and supernatant were harvested three days afterwards.
Affymetrix GeneChip U133 Plus 2.0 arrays was used to profile the gene expression changeof F3Ycells grown on two different surface mediums. Cells was plated either on a standardpolystyrene collagen I coated culture plate or on a 5% polyacrylamide collagen I coated Petridish. The cells were lysed with Trizol after three days and the RNA was then extracted andquantified. RNA was processed and hybridized onto six arrays (three replicates from the PSsample and three from the PAA sample). Labeling, hybridization, and scanning of the arrayswere performed at USC core faculty.
Microarray Chip Data AnalysisThe resulting intensity files (CEL files) were analyses with dChip software [48] using the fol-lowing parameters to compute the signal values and normalized the data set: model-based ex-pression model, mismatch probe (PM/MM difference) background selection, and invariant setor quantile normalization. In order to filter and identify relevant genes only probes that had asignal intensity value of over 100 in greater than 50% of the arrays was used to account for pos-sible systematic errors such as background signal noise and variations in individual gene chips.
Tissue Elasticity Regulated Tumor Gene Expression
PLOS ONE | DOI:10.1371/journal.pone.0120336 March 16, 2015 26 / 32
Differentially regulated genes were identified by examining the fold change (FC, mean experi-mental signal (PAA)/mean control signal (PS), if FC< 1, the negative inverse of the value wasreported) between the probes signals of the two samples conditions. Probes with a |FC|>2were used to generate a list of probes corresponding to differentially regulated genes for fur-ther analysis. All determination of FC was calculated using the lower 90% confidence bound ofFC and a p-value for paired t-test lower than 0.05. Similar list was generated for varying foldchanges to examine sets of higher degree of differentiation.
To determine if miRNA was a factor in the negative regulation of genes when grown onPAA, a randomly selected sample size of 50 highly downregulated genes (FC< -10) was com-pared to 50 upregulated genes (FC> 2) to obtain statistically significant results. The EntrezGene ID of these samples was used to search for and collect predicted miRNA binding sites.Targets sites were searched using the August 2010 release of microRNA.org, which is a re-source to identify miRNA binding sites. It utilizes a miRNA target prediction algorithm, mi-Randa, and scores by mirSVR to search for target genes that may be regulated by a miRNA andalso for miRNA that may be targeting the 3' UTR of a particular gene. Only conserved miRNAbinding sites with a good mirSVR score (� -0.10) were kept. If more than one 3' UTR waslisted, only the first listed was included in the analysis. Predicted miRNA and its genes targetswere tabulated for each set and annotated with its mature sequences, accession number, andchromosomal location. The Wilcoxon ranked sum test was then used to determine if predictedmiRNA binding sites were greater on genes downregulated on PAA than on PS.
A method to identify significant miRNAs based on expression arrays was performed usingDiana-MirExTra by comparing miRNA predicted from differentially regulated genes tomiRNA predicted for a set of unregulated genes as previously described [49,50,51]. Affymetrixprobe IDs were converted into Ensembl Gene IDs needed as an input for use with Diana-Mir-ExTra using the Database for Annotation, Visualization and Integrated Discovery (DAVID)gene ID conversion tool [52,53]. Only one Ensembl Gene ID was kept in situations where Affy-metrix Probe Ids have multiple possible Ensembl Gene IDs. Diana-MirExtra was used to showthat the predicted miRNAs of a set of differentially regulated genes was significantly greaterthan the predicted miRNAs from a list of genes defined as unregulated. In my analyses, I choseDIANA-microT v3.0 to predict miRNAs. A list of miRNAs and its significance (p-value) thatthe difference between the differentially regulated and unregulated gene sets is due to chancewas created (S2 Dataset).
Diana-MirExtra was used to show the probability that the set of differentially regulatedgenes had a higher miTG score from the list of background genes for individual miRNAs.Higher miTG score are more likely to correctly predict target sites. The list of miRNAs with itsassociated significance (p-value) and number of genes over the DIANA-microT thresholdscore was collected and analyzed (S2 Dataset).
Gene enrichment analysis was performed by using DAVID v6.7 to compare the differential-ly regulated genes to annotated gene ontologies, pathways, and databases to search for biologi-cal functions that are enriched from the differentially regulated genes [52]. The differentiallyregulated list of probes (|FC|> 2) was compared to background list composed from all theprobes with a signal intensity of more than 100 for more than 50% ofthe probes. Relevant en-riched pathways were mapped onto KEGG biological pathways [54].
Ensembl program was used to overlay microarray probes onto individual gene sequences[55]. An option to display HGU133 Plus 2.0 probes on the gene sequence was enabled that al-lowed the determination if the regions where the probes reside was upregulated or downregu-lated or if the probe was complimentary to a intron region or if it spanned an exon region. Thisdetermination was made by importing and comparing NCBI human RefSeq transcripts [56] tothe microarray probe tracks which were both aligned to a gene of interest on the Ensembl
Tissue Elasticity Regulated Tumor Gene Expression
PLOS ONE | DOI:10.1371/journal.pone.0120336 March 16, 2015 27 / 32
genomic sequence viewer. Probes that was mapped to the gene in question but not specific tothe location being analyzed was discarded from further analyses. Probes that did not align tohuman RefSeq transcripts were considered to be complimentary to intron regions.
Bradford Protein AssayThe protein content in conditional medium and cell lysates was quantified using Bio-Rad Pro-tein Assay solution (Bio-Rad) [57]. One part of the solution was mixed with four parts dH2O.200 μl of the solution was added to each wells of a 96 well plate and 10 μl of the sample wereadded and mixed and incubated for 5 minutes. Bovine serum albumin was dissolved in dH2Oto generate a standard curve over arrange of 0.2–1.0 mg/mL protein. Absorbance was measuredat 595nm using a micro plate reader (Molecular Devices).
ZymographyGelatin zymography was performed using a 10% SDS-PAGE containing 20mg/mL gelatin(Sigma) in dH2O. Samples were equalized with the same amount of protein from cell lysate orthe conditional medium were prepared and loaded into the wells of the SDS-PAGE. PurifiedMMP-9 was used as a MMP9 positive control and 3T3 condition medium used as an MMP2positive control. The gels were run at a 100 V until finished. Gels were rinsed for 30 minutes in2.5%TritonX-100, washed with dH2O and incubated overnight in developmental buffer (2 mMCaCl2, 120 mM NaCl, 50 mM Tris-Cl pH 7.5) at 37°C. Gels were stained with 0.5% CoomassieBlue R-250 for 1 hour and destained in destaining buffer (30% methanol, 10% acetic acid, 60%ddH20) for 1 hour and imaged. Bands of clearing indicate enzymatic degradation of thegelatin substrate.
Sepharose Bead Pull-down AssayGelatin Sepharose beads 4B (71–7094–00, GE Healthcare) was used to concentrate MMP pro-teins for use with gelatin zymography [58]. Thirty-microliter gelatin-conjugated Sepharose 4Bbead suspension was transferred into fresh Eppendorf tube and centrifuged at 1,000 rpm andthe supernatant was discarded. The beads were washed with 500 μl of a buffer solution (50 mMTris-Cl pH 7.5, 150 mMNaCl) and centrifuged for two minutes at 1,000 rpm. The supernatantwas discarded and then 1.5 mL of conditioned medium was added. The tube was rocked for anhour at 4°C and then centrifuged for two minutes and the supernatant discarded. The beadswere then washed with 500 μl of the buffer solution, centrifuged for two minutes, and the su-pernatant discarded. The previous step was then repeated leaving the beads. 20 μl of zymogrambuffer (Bio-Rad) was added to elute the MMPs proteins and the sample was loaded into the gel-atin zymogram gel wells.
RT-PCRAll RT-PCR conditions were described previously [10]. Primers were designed as follows: hsa-mir-520c pri-miRNA [32] (Forward: 63.4 oC (5p-fw)—accgctctctagagggaagcac and reverse:63.5 oC (lv-R)—agaagcccaccatcatccatc) with products of 1364bp and CD44 (Forward constitu-tive (58.2 oC—catcccagacgaagacagtc and reverse constitutive-tttgctccaccttcttgactcc) with prod-ucts of 1299bp. The data was analyzed by following the procedures [59].
Western BlottingTo prepare samples for western blotting, the cell pellet was washed with 1x PBS (Hyclone) andcentrifuged. The supernatant was discarded and the cell pellet then lysed with TBS-T (20 mM
Tissue Elasticity Regulated Tumor Gene Expression
PLOS ONE | DOI:10.1371/journal.pone.0120336 March 16, 2015 28 / 32
Tris pH 7.6, 150 mMNaCl, 1% Triton X-100, with phosphatase inhibitors (10 μg/mL Aproti-nin, 10 μg/mL Leupeptin, 5 μg/mL Pepstatin, 1 mM PMSF, 1 mMNaF, 1 mMNa3VO4) added[60]. A 10% SDS-PAGE gel was prepared for western blotting. Equal amount of protein takenfrom the cell lysates were loaded into the wells of the gel. Samples were then heated for 10 min-utes at 90°C, loaded into the wells, and the gels run at 100 V. The gel was transferred onto aPVDF membrane at 220 mA overnight and the membrane then blocked with 5% dry milk(Carnation) and 1% BSA in TBST solution for 1 hour. Primary antibody (1:200) was added tothe solution and left overnight at 4°C. The antibody used were AKT1/2/3 (sc-8312, Santa CruzBiotech), p-AKT (sc-16646-R, Santa Cruz Biotech), Actin (sc-1615, Santa Cruz Biotech),MMP2 (sc-6838, Santa Cruz Biotech), and GAPDH (Santa Cruz Biotech). The membrane waswashed three times with TBST and a secondary HRP-conjugated antibody was then added(1:10000) and incubated for two hours. The PVDF membrane was again washed three timeswith TBST. A chemiluminescence solution (Amersham) was added to the membrane, and theprotein complexes were visualized using a chemiluminescent film [61].
Supporting InformationS1 Dataset. Identification of miRNA candidates that are differentially regulated by tissueelasticity.(XLS)
S2 Dataset. Comparison of up and downregulated gene sets to a set of genes unchanged bytissue elasticity.(XLS)
S3 Dataset. GO biological process terms enriched by genes differentially regulated betweenPS and PAA.(XLS)
S4 Dataset. GO cellular component terms enriched by differentially regulated probes.Probes differentially regulated (FC> |2|) were compared to a background gene expression todetermine enriched terms using DAVID v6.7 software.(XLS)
S5 Dataset. GO molecular function terms enriched by genes differentially regulated be-tween PS and PAA.(XLS)
S6 Dataset. KEGG pathways enriched by genes differentially regulated between PS andPAA.(XLS)
AcknowledgmentsWe thank Dr. Merri Lynn Casem, Dr. Robert Koch, and Dr. Douglas Eernisse for their criticalreading of the manuscript. We thank Brent A. Dethlefs, Maria Minon, MD, Leonard S. Sender,MD, Philip H. Schwartz, PhD; John H. Weiss, MD, PhD; Hong Zhen Yin, MD, Robert A.Koch, PhD for their enthusiasm and support. Keri Zabokrtsky’s editorial help is acknowledged.
Tissue Elasticity Regulated Tumor Gene Expression
PLOS ONE | DOI:10.1371/journal.pone.0120336 March 16, 2015 29 / 32
Author ContributionsConceived and designed the experiments: SCL. Performed the experiments: LTV XZ. Analyzedthe data: LTV VK XZ JFZ QS MHKWGL SCL. Contributed reagents/materials/analysis tools:JFZ. Wrote the paper: LTV SCL.
References1. Li SC, LoudonWG (2008) A novel and generalizable organotypic slice platform to evaluate stem cell
potential for targeting pediatric brain tumors. Cancer Cell International 8: 9 (page 1–11).
2. Chen J, Li Y, Yu TS, McKay RM, Burns DK, Kernie SG, et al. (2012) A restricted cell population propa-gates glioblastoma growth after chemotherapy. Nature 488: 522–526. doi: 10.1038/nature11287PMID: 22854781
3. Li SC, Lee KL, Luo J (2012) Control dominating subclones for managing cancer progression and post-treatment recurrence by subclonal switchboard signal: implication for new therapies. Stem Cells Dev21: 503–506. doi: 10.1089/scd.2011.0267 PMID: 21933025
4. Reya T, Morrison SJ, Clarke MF, Weissman IL (2001) Stem cells, cancer, and cancer stem cells. Na-ture 414: 105–111. PMID: 11689955
5. Cobaleda C, Cruz JJ, Gonzalez-Sarmiento R, Sanchez-Garcia I, Perez-Losada J (2008) The EmergingPicture of Human Breast Cancer as a Stem Cell-based Disease. Stem Cell Rev 4: 67–79. doi: 10.1007/s12015-008-9012-6 PMID: 18401767
6. Gonzalez-Sarmiento R, Perez-Losada J (2008) Breast cancer, a stem cell disease. Curr Stem Cell ResTher 3: 55–65. PMID: 18220924
7. Tu SM (2013) Cancer: a "stem-cell" disease? Cancer Cell Int 13: 40. doi: 10.1186/1475-2867-13-40PMID: 23647946
8. Charles N, Holland EC (2010) The perivascular niche microenvironment in brain tumor progression.Cell Cycle 9: 3012–3021. doi: 10.4161/cc.9.15.12710 PMID: 20714216
9. Li SC, Jin Y, LoudonWG, Song Y, Ma Z, Weiner LP, et al. (2011) From the Cover: Increase develop-mental plasticity of human keratinocytes with gene suppression. Proc Natl Acad Sci U S A 108:12793–12798. doi: 10.1073/pnas.1100509108 PMID: 21768375
10. Li SC, Vu LT, Ho HW, Yin HZ, Keschrumrus V, Lu Q, et al. (2012) Cancer stem cells from a rare form ofglioblastoma multiforme involving the neurogenic ventricular wall. Cancer Cell Int 12: 41–54. doi: 10.1186/1475-2867-12-41 PMID: 22995409
11. Agus DB, Alexander JF, ArapW, Ashili S, Aslan JE, Austin RH, et al. (2013) A physical sciences net-work characterization of non-tumorigenic and metastatic cells. Sci Rep 3: 1449. doi: 10.1038/srep01449 PMID: 23618955
13. Saha K, Keung AJ, Irwin EF, Li Y, Little L, Schaffer DV, et al. (2008) Substrate modulus directs neuralstem cell behavior. Biophys J 95: 4426–4438. doi: 10.1529/biophysj.108.132217 PMID: 18658232
14. Fletcher DA, Mullins RD (2010) Cell mechanics and the cytoskeleton. Nature 463: 485–492. doi: 10.1038/nature08908 PMID: 20110992
15. Calin GA, Sevignani C, Dumitru CD, Hyslop T, Noch E, Yendamuri S, et al. (2004) Human microRNAgenes are frequently located at fragile sites and genomic regions involved in cancers. Proc Natl AcadSci U S A 101: 2999–3004. PMID: 14973191
16. Cheng G, Tse J, Jain RK, Munn LL (2009) Micro-environmental mechanical stress controls tumorspheroid size and morphology by suppressing proliferation and inducing apoptosis in cancer cells.PLoS One 4: e4632. doi: 10.1371/journal.pone.0004632 PMID: 19247489
17. Favre G, Banta Lavenex P, Lavenex P (2012) miRNA regulation of gene expression: a predictive bioin-formatics analysis in the postnatally developing monkey hippocampus. PLoS One 7: e43435. doi: 10.1371/journal.pone.0043435 PMID: 22952683
19. Wang Y, Medvid R, Melton C, Jaenisch R, Blelloch R (2007) DGCR8 is essential for microRNA biogen-esis and silencing of embryonic stem cell self-renewal. Nat Genet 39: 380–385. PMID: 17259983
20. Keklikoglou I, Koerner C, Schmidt C, Zhang JD, Heckmann D, Shavinskaya A, et al. (2012) MicroRNA-520/373 family functions as a tumor suppressor in estrogen receptor negative breast cancer by
Tissue Elasticity Regulated Tumor Gene Expression
PLOS ONE | DOI:10.1371/journal.pone.0120336 March 16, 2015 30 / 32
21. Liu P, Wilson MJ (2012) miR-520c and miR-373 upregulate MMP9 expression by targeting mTOR andSIRT1, and activate the Ras/Raf/MEK/Erk signaling pathway and NF-kappaB factor in human fibrosar-coma cells. J Cell Physiol 227: 867–876. doi: 10.1002/jcp.22993 PMID: 21898400
22. Han YP, Tuan TL, Hughes M, Wu H, Garner WL (2001) Transforming growth factor-beta—and tumornecrosis factor-alpha-mediated induction and proteolytic activation of MMP-9 in human skin. J BiolChem 276: 22341–22350. PMID: 11297541
23. Han YP, Yan C, Zhou L, Qin L, Tsukamoto H (2007) A matrix metalloproteinase-9 activation cascadeby hepatic stellate cells in trans-differentiation in the three-dimensional extracellular matrix. J BiolChem 282: 12928–12939. PMID: 17322299
24. Deb S, Zhang JW, Gottschall PE (1999) Activated isoforms of MMP-2 are induced in U87 human glio-ma cells in response to beta-amyloid peptide. J Neurosci Res 55: 44–53. PMID: 9890433
25. Lovett DH, Mahimkar R, Raffai RL, Cape L, Maklashina E, Cecchini G, et al. (2012) A novel intracellularisoform of matrix metalloproteinase-2 induced by oxidative stress activates innate immunity. PLoS One7: e34177. doi: 10.1371/journal.pone.0034177 PMID: 22509276
26. Huang Q, Gumireddy K, Schrier M, le Sage C, Nagel R, Nair S, et al. (2008) The microRNAsmiR-373and miR-520c promote tumour invasion and metastasis. Nat Cell Biol 10: 202–210. doi: 10.1038/ncb1681 PMID: 18193036
27. Chou YC, Sheu JR, Chung CL, Chen CY, Lin FL, Hsu MJ, et al. (2010) Nuclear-targeted inhibition ofNF-kappaB on MMP-9 production by N-2-(4-bromophenyl) ethyl caffeamide in humanmonocytic cells.Chem Biol Interact 184: 403–412. doi: 10.1016/j.cbi.2010.01.010 PMID: 20093109
28. Liu Z, Zhao X, Wang Y, Mao H, Huang Y, Kogiso M, et al. (2014) A patient tumor-derived orthotopic xe-nograft mouse model replicating the group 3 supratentorial primitive neuroectodermal tumor in children.Neuro Oncol 16: 787–799. doi: 10.1093/neuonc/not244 PMID: 24470556
29. Munchar MJ, Sharifah NA, Jamal R, Looi LM (2003) CD44s expression correlated with the InternationalNeuroblastoma Pathology Classification (Shimada system) for neuroblastic tumours. Pathology 35:125–129. PMID: 12745459
30. Chellaiah MA, Ma T (2013) Membrane localization of membrane type 1 matrix metalloproteinase byCD44 regulates the activation of pro-matrix metalloproteinase 9 in osteoclasts. Biomed Res Int 2013:302392. doi: 10.1155/2013/302392 PMID: 23984338
31. Yang K, Handorean AM, Iczkowski KA (2009) MicroRNAs 373 and 520c are downregulated in prostatecancer, suppress CD44 translation and enhance invasion of prostate cancer cells in vitro. Int J Clin ExpPathol 2: 361–369. PMID: 19158933
32. Port M, Glaesener S, Ruf C, Riecke A, Bokemeyer C, Meineke V, et al. (2011) Micro-RNA expression incisplatin resistant germ cell tumor cell lines. Mol Cancer 10: 52. doi: 10.1186/1476-4598-10-52 PMID:21575166
33. Sunyer R, Jin AJ, Nossal R, Sackett DL (2012) Fabrication of hydrogels with steep stiffness gradientsfor studying cell mechanical response. PLoS One 7: e46107. doi: 10.1371/journal.pone.0046107PMID: 23056241
35. Pelz CR, Kulesz-Martin M, Bagby G, Sears RC (2008) Global rank-invariant set normalization (GRSN)to reduce systematic distortions in microarray data. BMC Bioinformatics 9: 520. doi: 10.1186/1471-2105-9-520 PMID: 19055840
36. HsiehWP, Chu TM, Lin YM, Wolfinger RD (2011) Kernel density weighted loess normalization im-proves the performance of detection within asymmetrical data. BMC Bioinformatics 12: 222. doi: 10.1186/1471-2105-12-222 PMID: 21631915
37. Stephens PJ, Greenman CD, Fu B, Yang F, Bignell GR, Mudie LJ, et al. (2011) Massive genomic rear-rangement acquired in a single catastrophic event during cancer development. Cell 144: 27–40. doi:10.1016/j.cell.2010.11.055 PMID: 21215367
38. Li M, Lee KF, Lu Y, Clarke I, Shih D, Eberhart C, et al. (2009) Frequent amplification of a chr19q13.41microRNA polycistron in aggressive primitive neuroectodermal brain tumors. Cancer Cell 16: 533–546.doi: 10.1016/j.ccr.2009.10.025 PMID: 19962671
39. Noguer-Dance M, Abu-Amero S, Al-Khtib M, Lefevre A, Coullin P, Moore GE, et al. (2010) The primate-specific microRNA gene cluster (C19MC) is imprinted in the placenta. HumMol Genet 19: 3566–3582.doi: 10.1093/hmg/ddq272 PMID: 20610438
40. Rippe V, Dittberner L, Lorenz VN, Drieschner N, Nimzyk R, Sendt W, et al. (2010) The two stem cellmicroRNA gene clusters C19MC and miR-371–3 are activated by specific chromosomal
Tissue Elasticity Regulated Tumor Gene Expression
PLOS ONE | DOI:10.1371/journal.pone.0120336 March 16, 2015 31 / 32
rearrangements in a subgroup of thyroid adenomas. PLoS One 5: e9485. doi: 10.1371/journal.pone.0009485 PMID: 20209130
41. Subramanyam D, Lamouille S, Judson RL, Liu JY, Bucay N, Derynck R, et al. (2011) Multiple targets ofmiR-302 and miR-372 promote reprogramming of human fibroblasts to induced pluripotent stem cells.Nat Biotechnol 29: 443–448. doi: 10.1038/nbt.1862 PMID: 21490602
42. Saini HK, Griffiths-Jones S, Enright AJ (2007) Genomic analysis of humanmicroRNA transcripts. ProcNatl Acad Sci U S A 104: 17719–17724. PMID: 17965236
43. Lockwood CJ, Oner C, Uz YH, Kayisli UA, Huang SJ, Buchwalder LF, et al. (2008) Matrix metalloprotei-nase 9 (MMP9) expression in preeclamptic decidua and MMP9 induction by tumor necrosis factoralpha and interleukin 1 beta in human first trimester decidual cells. Biol Reprod 78: 1064–1072. doi: 10.1095/biolreprod.107.063743 PMID: 18276934
44. Seguin CA, Pilliar RM, Madri JA, Kandel RA (2008) TNF-alpha induces MMP2 gelatinase activity andMT1-MMP expression in an in vitro model of nucleus pulposus tissue degeneration. Spine (Phila Pa1976) 33: 356–365.
45. Baumann F, Leukel P, Doerfelt A, Beier CP, Dettmer K, Oefner PJ, et al. (2009) Lactate promotes glio-ma migration by TGF-beta2-dependent regulation of matrix metalloproteinase-2. Neuro Oncol 11:368–380. doi: 10.1215/15228517-2008-106 PMID: 19033423
46. Gantier MP, McCoy CE, Rusinova I, Saulep D, Wang D, Xu D, et al. (2011) Analysis of microRNA turn-over in mammalian cells following Dicer1 ablation. Nucleic Acids Res 39: 5692–5703. doi: 10.1093/nar/gkr148 PMID: 21447562
47. Tse JR, Engler AJ (2010) Preparation of hydrogel substrates with tunable mechanical properties. CurrProtoc Cell Biol Chapter 10: Unit 10 16.
48. Li C, HungWongW (2001) Model-based analysis of oligonucleotide arrays: model validation, design is-sues and standard error application. Genome Biol 2: RESEARCH0032. PMID: 11532216
49. Maragkakis M, Alexiou P, Papadopoulos GL, Reczko M, Dalamagas T, Giannopoulos G, et al. (2009)Accurate microRNA target prediction correlates with protein repression levels. BMC Bioinformatics 10:295. doi: 10.1186/1471-2105-10-295 PMID: 19765283
50. Maragkakis M, Reczko M, Simossis VA, Alexiou P, Papadopoulos GL, Dalamagas T, et al. (2009)DIANA-microT web server: elucidating microRNA functions through target prediction. Nucleic AcidsRes 37: W273–276. doi: 10.1093/nar/gkp292 PMID: 19406924
51. Alexiou P, Maragkakis M, Papadopoulos GL, Simmosis VA, Zhang L, Hatzigeorgiou AG (2010) TheDIANA-mirExTra web server: from gene expression data to microRNA function. PLoS One 5: e9171.doi: 10.1371/journal.pone.0009171 PMID: 20161787
52. Huang daW, Sherman BT, Lempicki RA (2009) Systematic and integrative analysis of large gene listsusing DAVID bioinformatics resources. Nat Protoc 4: 44–57. doi: 10.1038/nprot.2008.211 PMID:19131956
53. Huang daW, Sherman BT, Lempicki RA (2009) Bioinformatics enrichment tools: paths toward the com-prehensive functional analysis of large gene lists. Nucleic Acids Res 37: 1–13. doi: 10.1093/nar/gkn923 PMID: 19033363
54. Kanehisa M (2002) The KEGG database. Novartis Found Symp 247: 91–101; discussion 101–103,119–128, 244–152. PMID: 12539951
56. Pruitt KD, Tatusova T, KlimkeW, Maglott DR (2009) NCBI Reference Sequences: current status, policyand new initiatives. Nucleic Acids Res 37: D32–36. doi: 10.1093/nar/gkn721 PMID: 18927115
57. Li S, Galbiati F, Volonte D, SargiacomoM, Engelman JA, Das K, et al. (1998) Mutational analysis ofcaveolin-induced vesicle formation. Expression of caveolin-1 recruits caveolin-2 to caveolae mem-branes. FEBS Lett 434(1–2): 127–134.
58. Li S, Song KS, Lisanti MP (1996) Expression and characterization of recombinant caveolin: Purificationby poly-histidine tagging and cholesterol-dependent incorporation into defined lipid membranes. JBiol-Chem 271: 568–573. PMID: 8550621
59. Li S, Kirov I, Klassen HK, Schwartz PH (2007) Characterization of stem cells using reverse transcrip-tase polymerase chain reaction. In: Loring JF, Wesselschmidt RL, Schwartz PH, editors. Human stemcell manual: a laboratory guide. Boston, New York, London: Academic Press, Elsevier. pp. 127–148.
60. Li S, Seitz R, Lisanti MP (1996) Phosphorylation of caveolin by Src tyrosine kinases: The à-isoform ofcaveolin is selectively phosphorylated by v-Src in vivo JBiolChem 271: 3863–3868.
61. Li S, Okamoto T, Chun M, SargiacomoM, Casanova JE, Hansen SH, et al. (1995) Evidence for a regu-lated interaction between heterotrimeric G proteins and caveolin. JBiolChem 270: 15693–15701.PMID: 7797570
Tissue Elasticity Regulated Tumor Gene Expression
PLOS ONE | DOI:10.1371/journal.pone.0120336 March 16, 2015 32 / 32