VULNERABILITY AND RISK ASSESSMENT IN THE INDIAN HIMALAYAN REGION UNDER THE NATIONAL MISSION FOR SUSTAINING THE HIMALAYAN ECOSYSTEM - MANIPUR STATE Dr. Braja kumar Deputy Director Environment Department Government of Manipur
Transcript
VULNERABILITY AND RISK ASSESSMENT IN THE INDIAN HIMALAYAN REGION UNDER THE NATIONAL MISSION FOR SUSTAINING THE HIMALAYAN ECOSYSTEM- MANIPUR STATE
Dr. Braja kumarDeputy Director
Environment DepartmentGovernment of Manipur
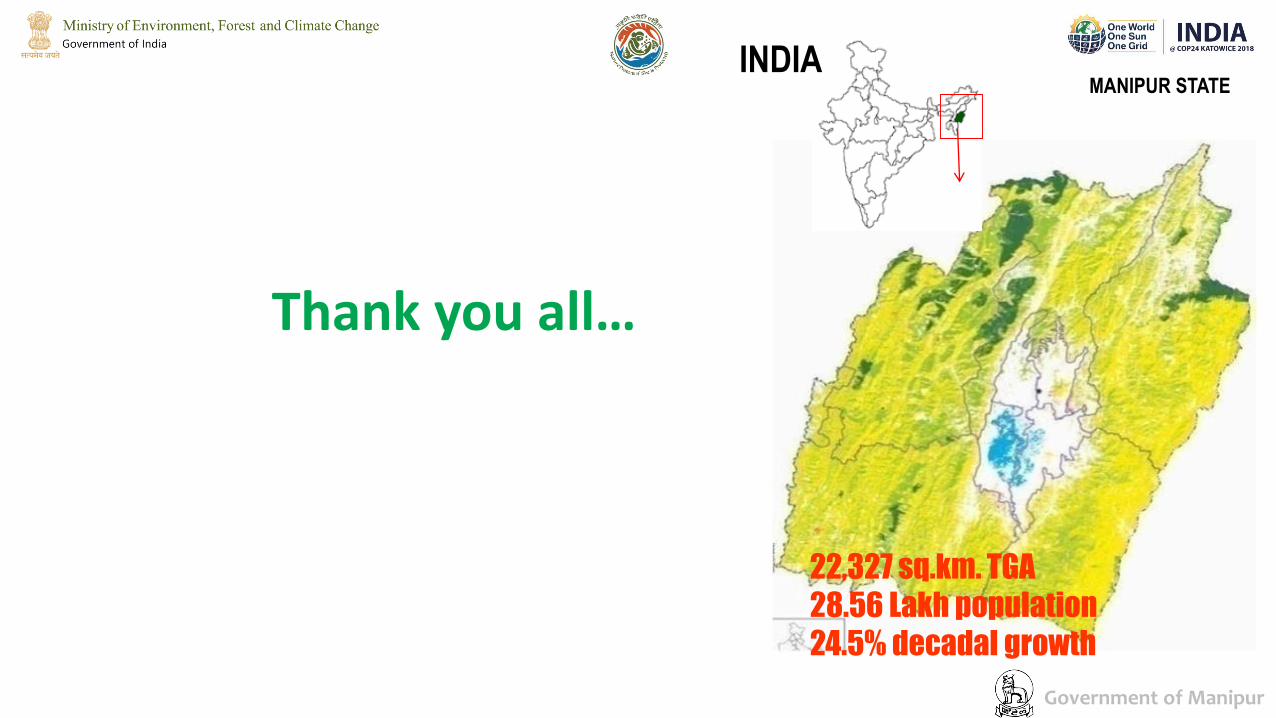
Manipur, an Eastern Himalayan state at NER of India, rich in biodiversity i.e. about 76 % of TGA in under forest coverage
Target of India in Forest Coverage by 2030 • 33% of TGA under forest cover • Additional carbon sink of 2500 to 3000 million tonnes of CO2
Manipur State – Now and Target in 2030• Increase of 263 sq. km of forest area [ISFR 2017]
i.e. 1.18 % forest cover of the state
• Total carbon stock of 143.091 million tonnes [ISFR 2017] (524.667 million tonnes of CO2 equivalent)i.e. 2.02% of total forest carbon stock of the country
• As such, carbon sink will be 148.204 million tonnes in 2030
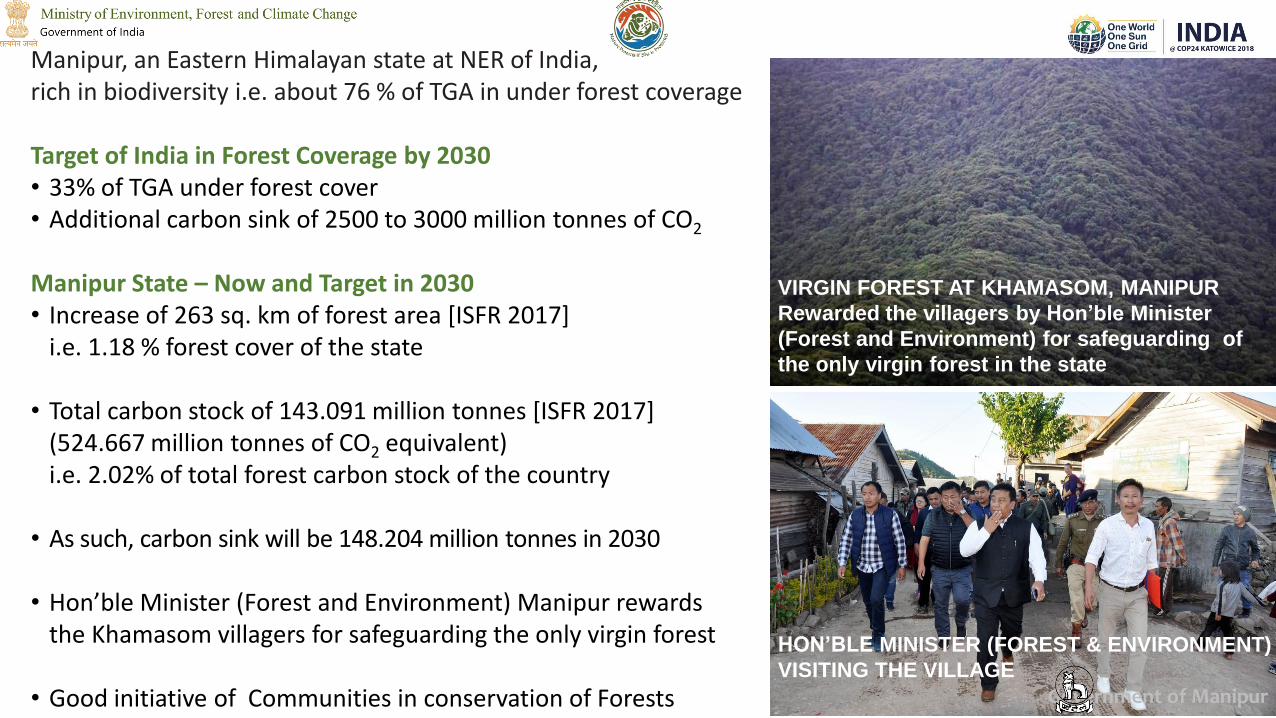
• Hon’ble Minister (Forest and Environment) Manipur rewards the Khamasom villagers for safeguarding the only virgin forest
• Good initiative of Communities in conservation of Forests
VIRGIN FOREST AT KHAMASOM, MANIPUR
Rewarded the villagers by Hon’ble Minister
(Forest and Environment) for safeguarding of
the only virgin forest in the state
HON’BLE MINISTER (FOREST & ENVIRONMENT)
VISITING THE VILLAGE
Government of Manipur
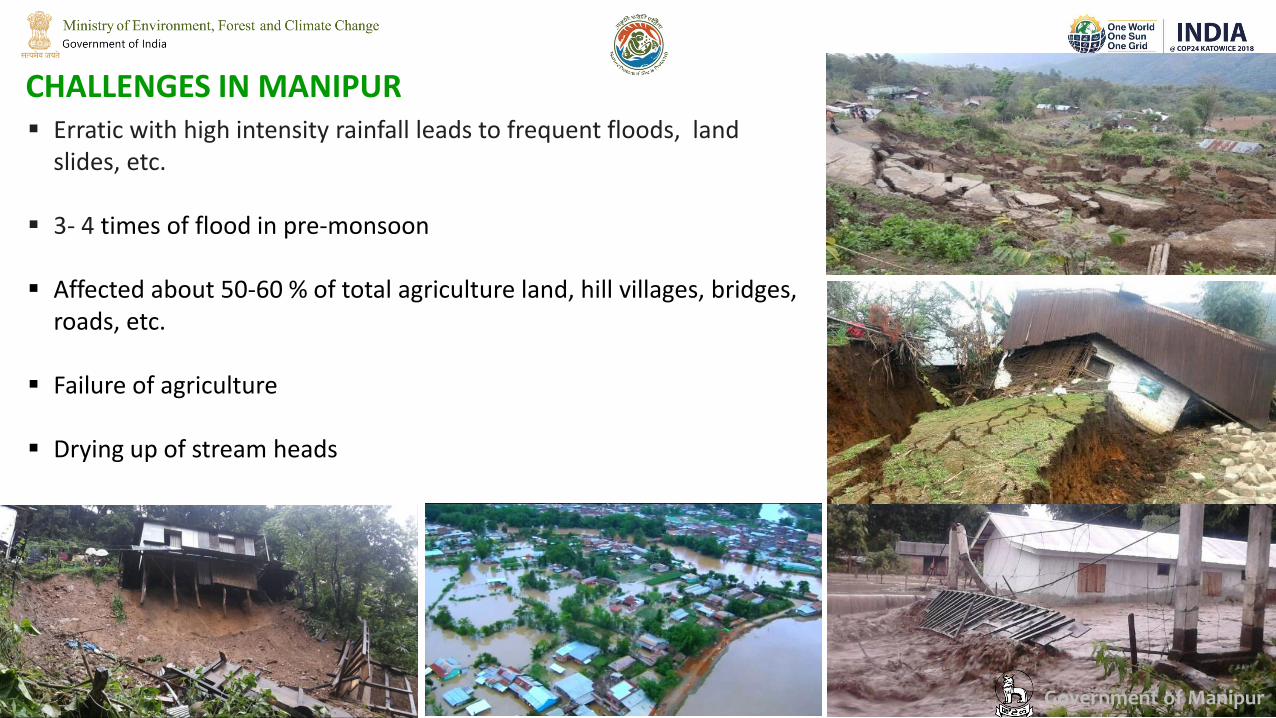
Erratic with high intensity rainfall leads to frequent floods, land slides, etc.
3- 4 times of flood in pre-monsoon
Affected about 50-60 % of total agriculture land, hill villages, bridges, roads, etc.
Failure of agriculture
Drying up of stream heads
CHALLENGES IN MANIPUR
Government of Manipur
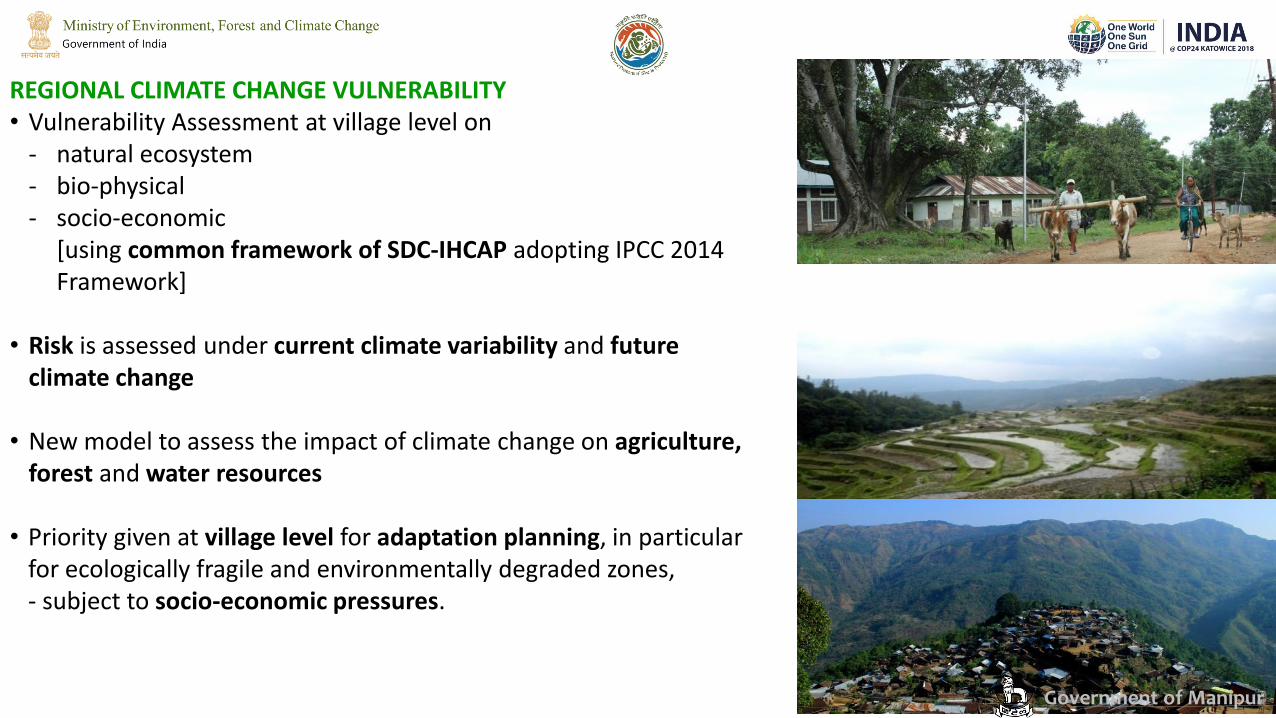
REGIONAL CLIMATE CHANGE VULNERABILITY• Vulnerability Assessment at village level on
- natural ecosystem- bio-physical- socio-economic
[using common framework of SDC-IHCAP adopting IPCC 2014 Framework]
• Risk is assessed under current climate variability and future climate change
• New model to assess the impact of climate change on agriculture, forest and water resources
• Priority given at village level for adaptation planning, in particular for ecologically fragile and environmentally degraded zones, - subject to socio-economic pressures.
Government of Manipur
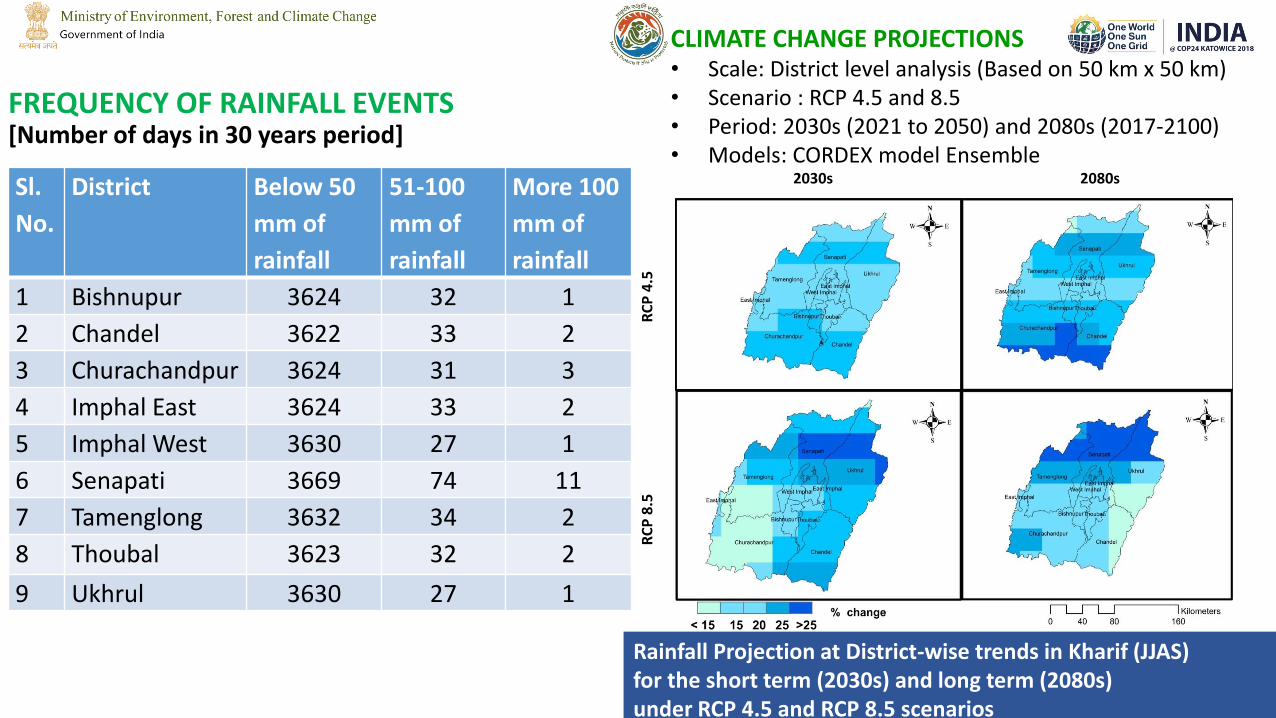
FREQUENCY OF RAINFALL EVENTS [Number of days in 30 years period]
Government of Manipur
Sl.
No.
District Below 50
mm of
rainfall
51-100
mm of
rainfall
More 100
mm of
rainfall
1 Bishnupur 3624 32 1
2 Chandel 3622 33 2
3 Churachandpur 3624 31 3
4 Imphal East 3624 33 2
5 Imphal West 3630 27 1
6 Senapati 3669 74 11
7 Tamenglong 3632 34 2
8 Thoubal 3623 32 2
9 Ukhrul 3630 27 1
CLIMATE CHANGE PROJECTIONS• Scale: District level analysis (Based on 50 km x 50 km)• Scenario : RCP 4.5 and 8.5• Period: 2030s (2021 to 2050) and 2080s (2017-2100)• Models: CORDEX model Ensemble
2030s 2080s
RC
P 4
.5
R
CP
8.5
Rainfall Projection at District-wise trends in Kharif (JJAS) for the short term (2030s) and long term (2080s) under RCP 4.5 and RCP 8.5 scenarios
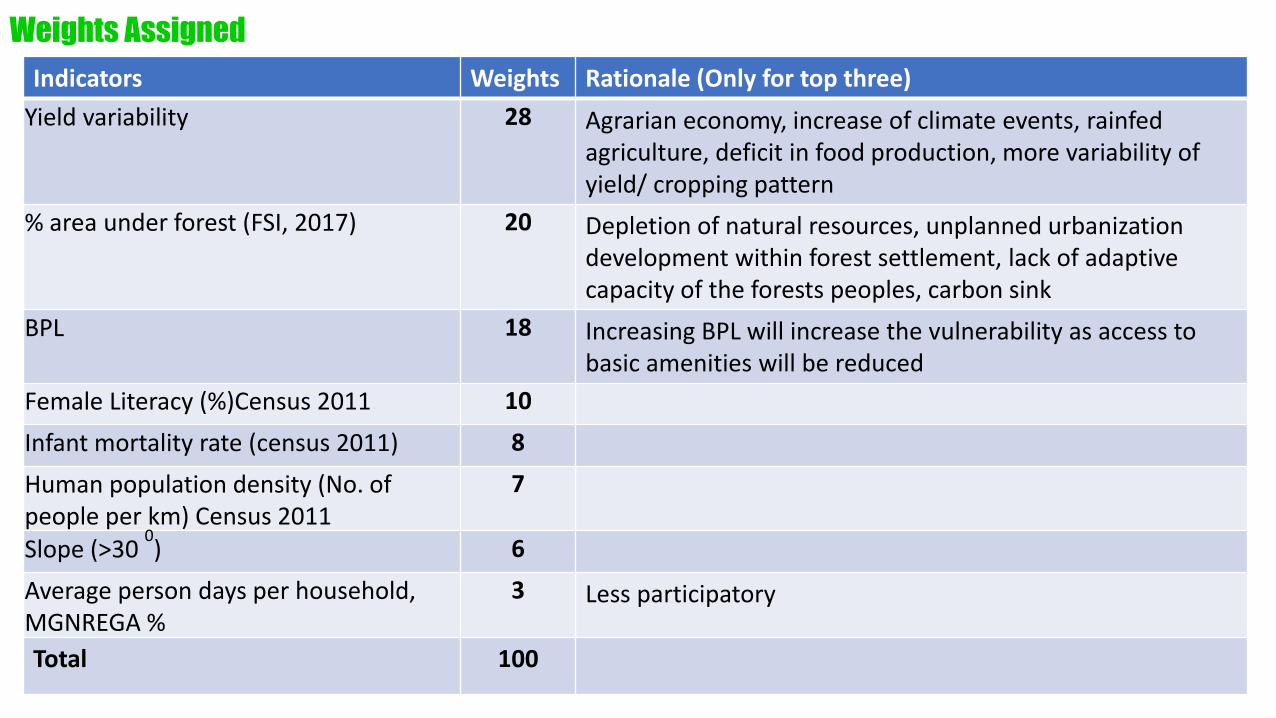
Weights Assigned
Indicators Weights Rationale (Only for top three)
Yield variability 28 Agrarian economy, increase of climate events, rainfed agriculture, deficit in food production, more variability of yield/ cropping pattern
% area under forest (FSI, 2017) 20 Depletion of natural resources, unplanned urbanization development within forest settlement, lack of adaptive capacity of the forests peoples, carbon sink
BPL 18 Increasing BPL will increase the vulnerability as access to basic amenities will be reduced
Female Literacy (%)Census 2011 10
Infant mortality rate (census 2011) 8
Human population density (No. of people per km) Census 2011
7
Slope (>30 0) 6
Average person days per household, MGNREGA %
3 Less participatory
Total 100
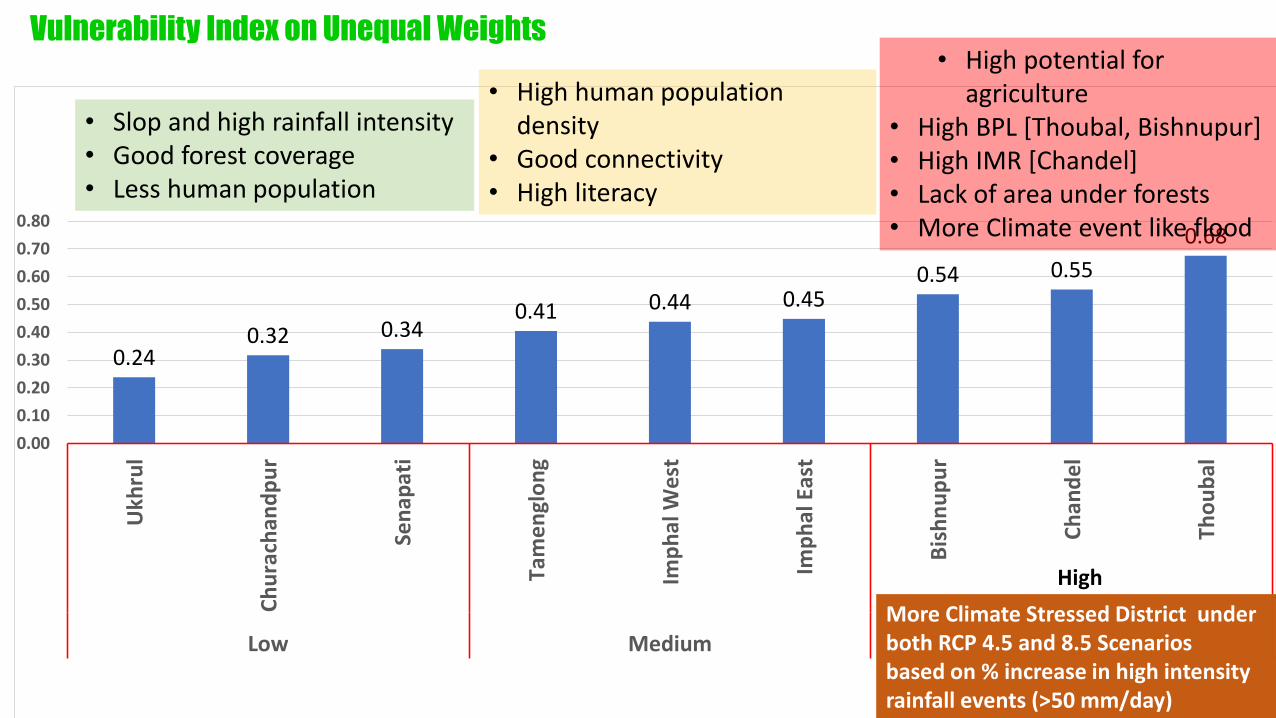
0.240.32 0.34
0.41 0.44 0.450.54 0.55
0.68
0.00
0.10
0.20
0.30
0.40
0.50
0.60
0.70
0.80
Ukh
rul
Ch
ura
chan
dp
ur
Sen
apat
i
Tam
en
glo
ng
Imp
hal
We
st
Imp
hal
Eas
t
Bis
hn
up
ur
Ch
and
el
Tho
ub
al
Low Medium High
• High potential for agriculture
• High BPL [Thoubal, Bishnupur]• High IMR [Chandel]• Lack of area under forests • More Climate event like flood
• High human population density
• Good connectivity• High literacy
• Slop and high rainfall intensity • Good forest coverage • Less human population
More Climate Stressed District under both RCP 4.5 and 8.5 Scenariosbased on % increase in high intensity rainfall events (>50 mm/day)
High
Vulnerability Index on Unequal Weights
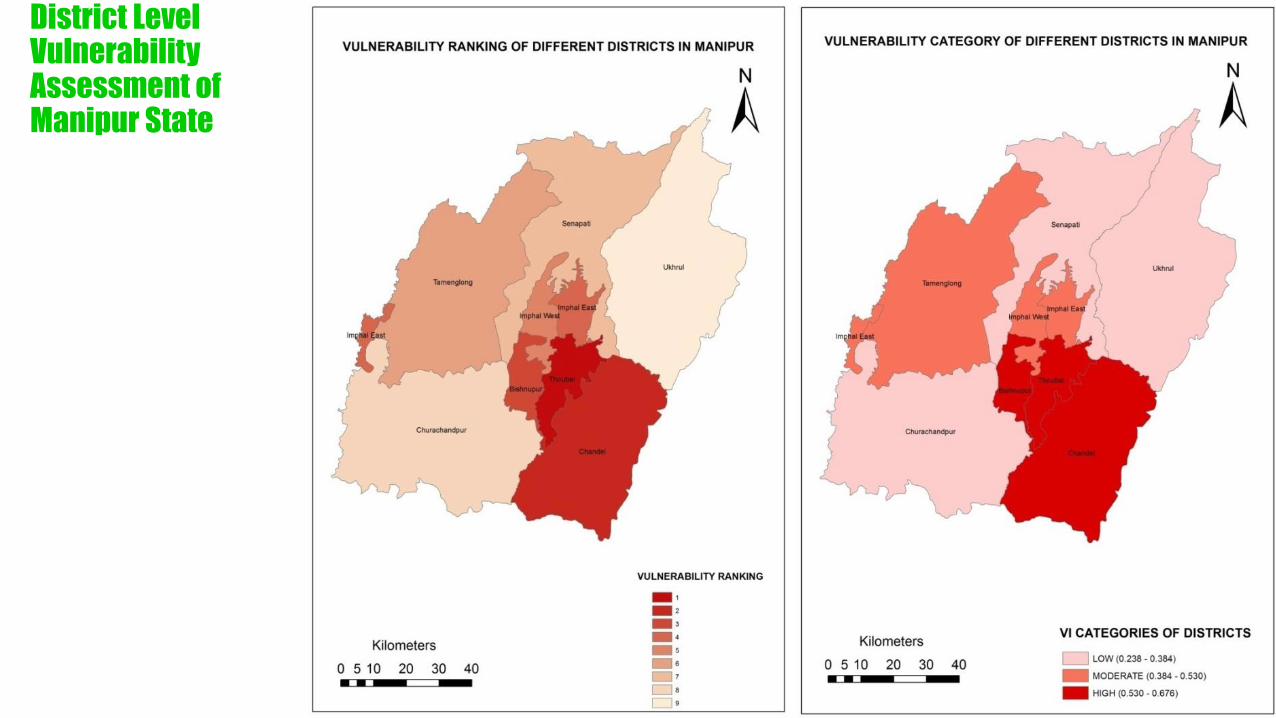
District Level Vulnerability Assessment of Manipur State