Vulnerability of Common Urban Forest Species to Projected Climate Change: A Case Study of Mississauga, Ontario
Talha Khan
Master of Science
Department of Geography
University of Toronto
2017 Abstract
Changes in temperature regimes, precipitation regimes, and extreme weather events as a result of
climate change can cause physiological stress to urban tree species. This study examines the City
of Mississauga’s urban forest species composition to explore the vulnerability of commonly
planted native and non-native species under projected climate change scenarios. A vulnerability
matrix was created to highlight the potential vulnerability of species to particular climate
conditions and weather. Interviews with urban forest professionals were conducted to gather
current perspectives on urban forest management in relation to climate change. Results show that
all species analyzed are impacted by the cumulative effects of climate change, but proper urban
forest management can mitigate some of those effects. This study addresses a gap in our
knowledge of how urban forests may respond to future climate conditions in Mississauga and
which species may fare better in projected conditions.
iii
Acknowledgements Thank you to my supervisor, Dr. Tenley Conway, for assisting and supporting me through the process of my research project. Thank you to Dr. Monika Havelka and Dr. William Gough for being part of my defence committee and their guidance. Thank you to Dan McKenney, John Pedlar, Kevin Lawrence, and Pia Papadopol at Natural Resources Canada for providing me the necessary data sets. Thank you to all participants that agreed to be interviewed for this research project. Special thanks to my family, friends, peers at University of Toronto Mississauga, and communities that I’ve had the pleasure of being part of during my research project.
iv
Table of Contents Abstract…………………………………………………………………………………… ii Acknowledgements……………………………………………………………………….. iii
Table of Contents………………………………………………………………………… iv
List of Tables……………………………………………………………………………… vii List of Figures…………………………………………………………………………….. viii
List of Appendices………………………………………………………………………... ix
Chapter 1 Introduction & Research Objectives………………………………………... 1
1.0 Introduction………………………………………………………………………….. 1
1.1 Research Objectives………………………………………………………………….. 2
Chapter 2 Literature Review……………………………………………………………. 3
6.1 Recommendations for Future Research……………………………………………… 75
References………………………………………………………………………………… 77
vii
List of Tables
Table 1. Tree sample data variables collected for tree sample…………………..………... 22
Table 2. List of species chosen for this study.…………………………………………….. 23
Table 3. Six bioclimatic variables used for species distribution modeling……………….. 25
Table 4. Data definitions for climate tolerances used in vulnerability matrix.…………… 27
Table 5. Projections of 8 bioclimatic variables under RCP 4.5 and RCP 8.5 scenarios….. 31
Table 6. Projected change in mean monthly temperature (MMT) relative to historic values under RCP 4.5 and 8.5 scenarios, over the next century...………………………… 32
Table 7. Historic fluctuations in CMI over 30-year time period………………………….. 35
Table 8. Factors considered when managing urban forest species………………………... 59
Table 9. Participant responses of their planting preferences and reasoning………………. 61
viii
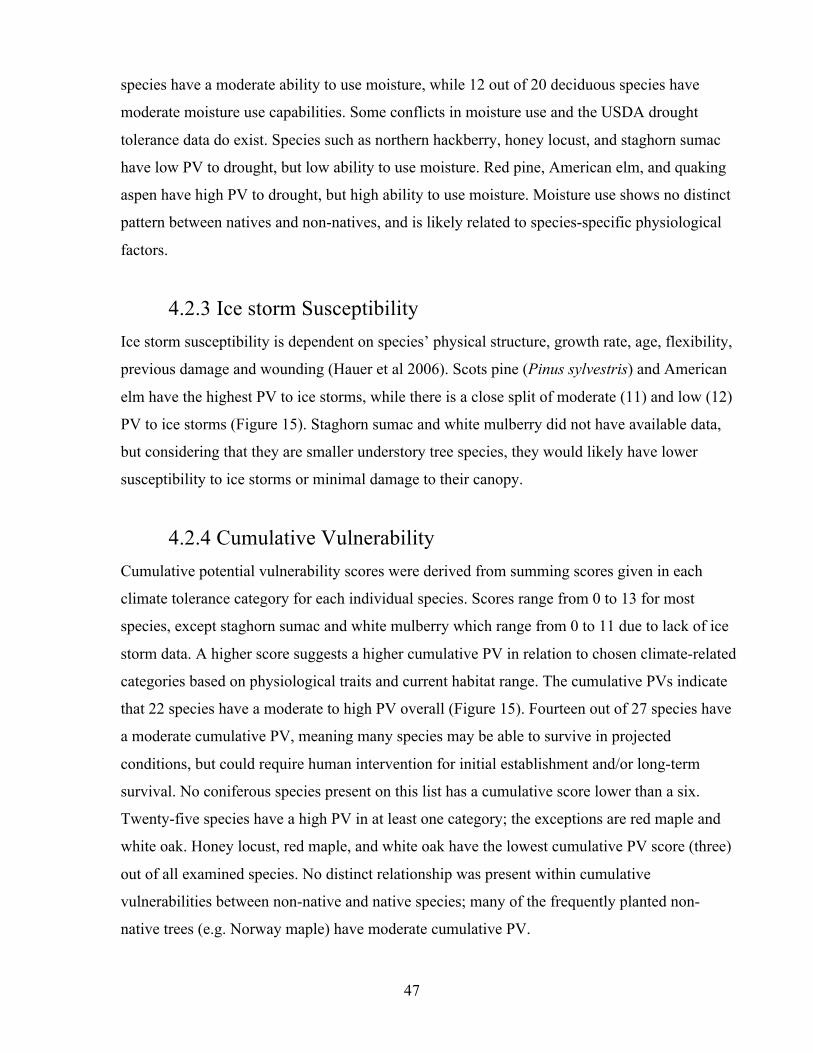
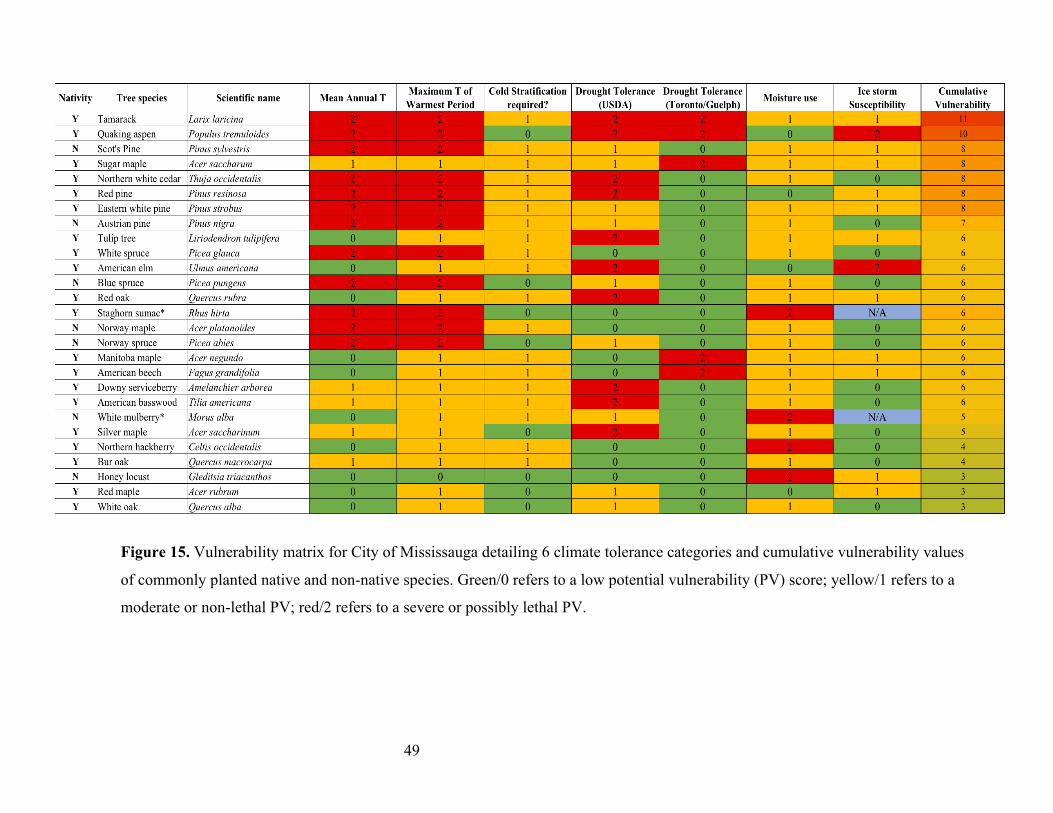
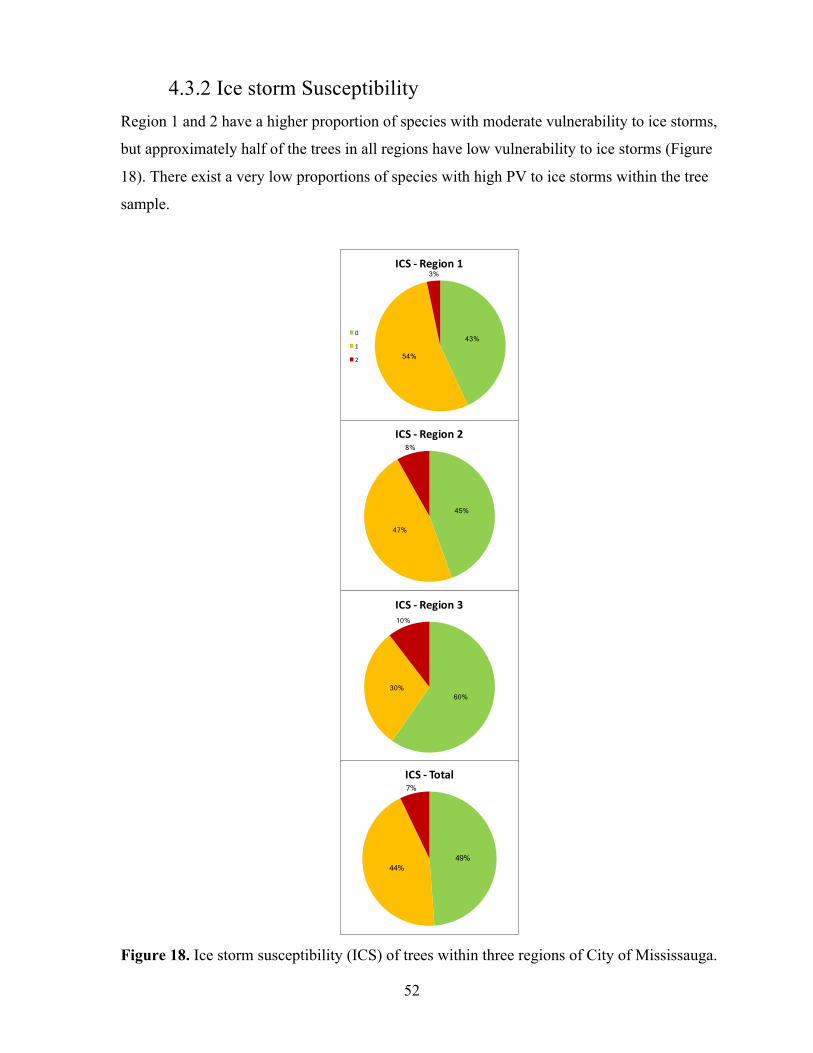
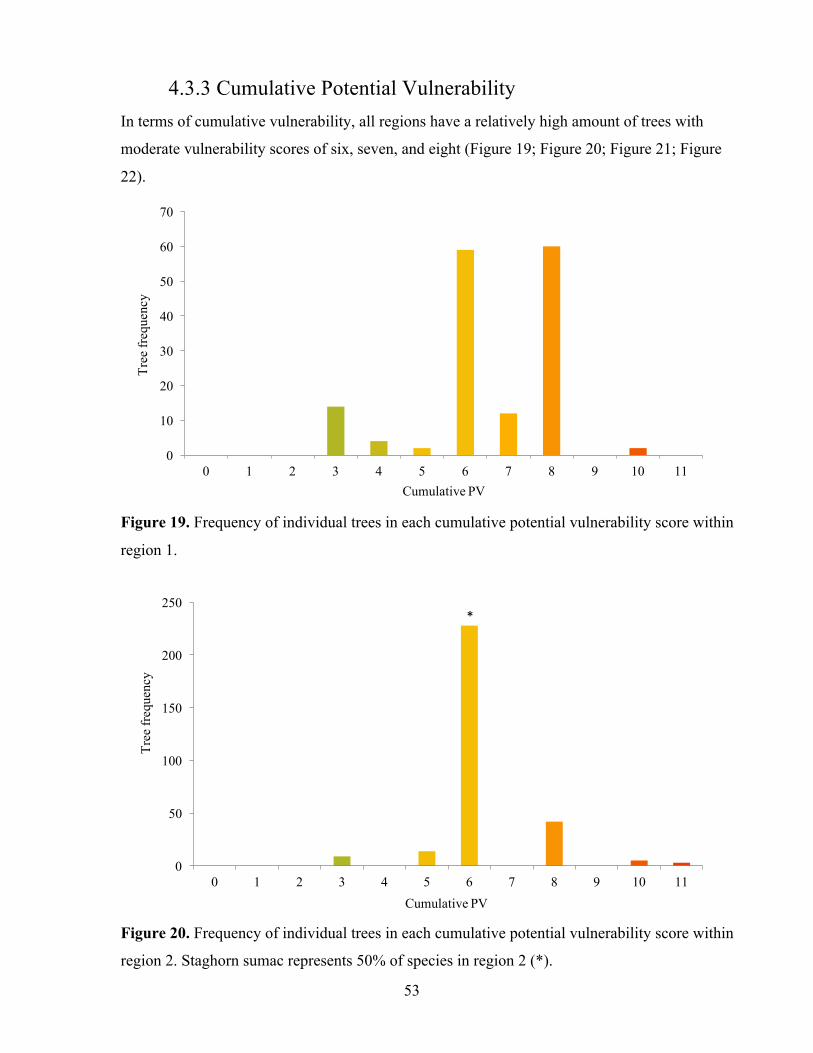
List of Figures Figure 1. Influences on urban trees in comparison to forest trees.………………………..... 15 Figure 2. Visual summary of methods used in this study…………………………………... 18 Figure 3. Map of the regions analyzed in City of Mississauga including tree sample data points ……………………………………………………………………………………….. 19 Figure 4. Historic and projected mean monthly precipitation under RCP 4.5 scenario over the next century……………………………………………………………………………... 33 Figure 5. Historic and projected mean monthly precipitation under RCP 8.5 scenario over the next century……………………………………………………………………………... 34 Figure 6. Average, minimum and maximum climate moisture index values from 1971-2000. ………………………………………………………………………………………... 35 Figure 7. Monthly climate moisture index values projected from RCP 4.5 scenario over the next century.…………………………………………………………………………….. 36 Figure 8. Monthly climate moisture index values projected from RCP 8.5 scenario over the next century. ……………………………………………………………………………. 36 Figure 9. Core climatic range of common native and non-native tree species compared to historic and projected (2071-2100) growing season start and end days in Julian days…….. 38 Figure 10. Core climatic range of common native and non-native tree species compared to historic mean annual temperatures………………………………………………………….. 41 Figure 11. Core climatic range of common native and non-native tree species compared to historic maximum temperatures of the warmest period…………………………………….. 42 Figure 12. Core climatic range of common native and non-native tree species compared to historic and projected (2071-2100) mean annual temperatures…………………………….. 43 Figure 13. Core climatic range of common native and non-native tree species compared to maximum temprature of the warmest period, historic and projected (2071-2100)……....... 44 Figure 14. Core climatic range of common native and non-native tree species compared to minimum temprature of the coldest period, historic and projected (2071-2100)………….. 45 Figure 15. Vulnerability matrix for City of Mississauga detailing 6 climate tolerance categories and cumulative vulnerability values…………………………………………….. 49 Figure 16. Relative temperature-related vulnerability of trees within 3 regions of City of Mississauga………………………………………………………………………………….. 50 Figure 17. Relative drought (DT1 & DT2) and moisture use (MU) vulnerabilities of trees within 3 regions of City of Mississauga……………..……………………………………… 51 Figure 18. Relative ice storm susceptibility (ICS) of trees within 3 regions of City of Mississauga. ………………………………………………………………………………… 52 Figure 19. Frequency of trees in each cumulative potential vulnerability score within region 1……………………………………………………………………………………… 53 Figure 20. Frequency of trees in each cumulative potential vulnerability score within region 2. ………………………………………………………...…………………………... 53 Figure 21. Frequency of trees in each cumulative potential vulnerability score within region 3…..………………………………………………………………………………….. 54 Figure 22. Frequency of trees in each cumulative potential vulnerability score within all regions. ……………………………………………………………………………………... 54
ix
List of Appendices
Appendix A – Introductory information letter for interview……………………………... 93
Appendix B – Information letter and informed consent form for interviews…………….. 94
Appendix C – Interview guide……………………………………………………………. 96
Appendix D – Abundances of species analyzed in each region…………………………... 98
1
Chapter 1
Introduction & Research Objectives
1.0 Introduction The Intergovernmental Panel on Climate Change (IPCC) projects that warming temperatures,
changing precipitation regimes, and increasing intensity and frequency of extreme weather
events will lead to drastic social and ecological changes within the next century (IPCC 2013;
IPCC 2014). The changing climate as well as extreme weather events are testing the limits of
many species and ecosystems, especially in urban areas (Ste-Marie 2011). For example, in
natural forests in western Canada and other parts of North America drought-induced mortality is
increasing (Allen et al 2010). Increased summer precipitation is also creating opportunities for
tree diseases to arise in British Colombia, Canada (Woods et al 2005). Urban forests are often
seen as important resources in climate change adaptation and mitigation (Hotte et al 2015).
Urban forests can sequester large amount of carbon and moderate local temperature extremes
(Hotte et al 2015; Nowak & Crane 2002) As well, urban forests provide a number of benefits,
including improving air quality, reducing stormwater surges, and promoting psychological well-
being (Kowarik 2011; McPherson et al 1997; Yamaguchi et al 2006).
At the same time, the effects of climate change are certain to impact urban forests globally
(Gauthier et al 2014). A December 2013 ice storm in Mississauga caused over 16 million dollars
in damage to infrastructure and caused substantial harm to the urban forest (City of Mississauga
2016). Over 2,000 trees needed to be removed and 8,000 required pruning due to structural
damage. While this event may not have been caused by climate change directly, events like
these could become more frequent in the future (Cheng et al 2007). However, relatively little
has attention has been given to assessing the vulnerability of urban forests to climate change (for
exceptions see Brandt et al 2017; Fahey et al 2013; Foran et al 2015; Orodóñez & Duinker
2015). Tree species present in the urban forest are in a vastly different habitat from their native
environment and have to deal with many stressors that are not present in their historical habitats
(Roloff 2013). Stressed trees are often at greater risk of mortality from cumulative factors than
trees that grow in high-quality low-stress habitats (Brune 2016). Due to the highly disturbed
nature of urban areas and the integral function that urban forests serve, it is essential for urban
forest managers to examine urban forest vulnerability relative to regional climate change.
2
1.1 Research Objectives The purpose of this research is to conduct a case study examining the potential vulnerabilities of
commonly planted native and non-native tree species in Mississauga's urban forest under two
different climate change scenarios. Specifically, the research questions being answered are:
1. How do physiological requirements and tolerances make commonly planted urban forest
species vulnerable or resilient to projected climate change in the City of Mississauga?
2. What are the experiences and perceptions of urban forest professionals currently
managing urban forests in regards to climate change?
The objectives of this research are to build a climate change vulnerability matrix for City of
Mississauga’s urban forest, highlight vulnerable regions within the City of Mississauga, and to
gather perspectives from urban forest professionals working in the city. Data gathered from
various sources such as tree samples, climate models, species climate envelopes, and plant
characteristic databases were consolidated into a visual matrix to assess climate vulnerability.
Responses from interviews were used to inform climate models and the vulnerability matrix
from an urban forest practitioner’s lens.
A better understanding of the vulnerability of individual tree species to climate change will aid
urban forest practitioners and municipal managers in selecting species for planting and devising
mitigation strategies to maintain the urban forest in Mississauga and the broader region. More
generally, this study contributes to a small but growing literature examining urban forest climate
change vulnerability and practitioners understanding of the issue, as well as their current
response.
This thesis includes a review of the relevant urban forestry and climate change literature, a
description of the study site and the methods employed, and the results – the species
vulnerability matrix and interview results. The implications of the research, recommendation for
urban forest management in Mississauga, and future research recommendations are then
presented in the discussion and conclusion sections.
3
Chapter 2
Literature Review
2.0 Urban Forests 2.0.0 Urban Forest Overview
Urban forests are defined as “vegetation in urban areas acting in conjunction with other natural
and cultural components of the ecosystem” (Rowntree & Sanders 1984) They are a dynamic
system that includes trees, shrubs, and understory plants, as well as the soils that sustain them,
located on public and private property (TRCA 2011a). Urban forests are considered part of
green urban infrastructure (GUI), an interconnected network of green space that exists within
cities, which provide many benefits for human populations (Gill et al 2007). Interest in urban
forest research has grown due to urbanization occurring in Canada and elsewhere around the
world. Past research focuses mainly on forest structure, ecosystem services, valuation, and
ecology as important aspects of the urban forest (Ferrini et al 2017; McPherson et al 1997).
Urban forests are considered novel ecosystems due to the variety of factors that affect their
species composition and diversity (Kowarik 2011; Morgenroth et al 2016). Novel implies that
these ecosystems are human-made, and have unique landscape features and species composition
relative to natural forest ecosystems. Factors affecting species composition include, but are not
limited to: climate, soil morphology, natural disturbance legacy, historical land use trends, and
various anthropogenic disturbances (McPherson et al 1997). Urban landscapes are structurally
complex because they exhibit varying gradients of land use, infrastructure, population density,
socio-economic characteristics and municipal policy (Conway & Hackworth 2007; Conway &
Urbani 2007; Heynen & Lindsay 2003; Martin et al 2004).
In contrast to the structure of natural forest ecosystems, human activity in urban areas creates
systems that are spatially heterogeneous, highly fragmented, and frequently disturbed (Kowarik
2011); they often exhibit elevated levels of pollutants and non-native species (Hotte et al 2015;
McKinney 2006). Heterogeneous systems are areas where patches are unevenly interspersed on
the landscape with varying features, usually as a result of habitat fragmentation and degradation
(Grimm et al 2008).
4
Given the complex nature of urban landscapes, various compositions of native and non-native
species may thrive as compared to non-urban ecosystems. Species composition has a direct
impact on forest structure (Kowarik 2011; Ordóñez & Duinker 2014). Forest structure refers to
how vegetation is interspersed in relation to the surrounding objects such as buildings, parking
lots, and other built forms (Rowntree 1984). Urban forest structure is measured by physical
characteristics such as tree abundance, forest density, biomass, leaf area, and canopy cover
(McPherson et al 1997; TRCA 2011a). The composition and structure of an urban forest affects
its functional capabilities (including ecosystem services) (Kowarik 2011). Urban forests are
often characterized by their shorter tree lifespans relative to natural forests, low species
diversity, and homogeneous assemblages that leaves them at higher risk of species-loss and
ecosystem collapse (Orodóñez & Duinker 2014).
2.0.1 Ecosystem Services & Climate Change Ecosystem services are defined as “the direct and indirect contributions of ecosystems to human
well-being” (Hotte et al 2015). Ecosystem services are categorized into provisioning (e.g. food
products), regulating (e.g. temperature control), supporting (e.g. wildlife habitat), and cultural
(e.g. aesthetic or spiritual) groups (Millennium Ecosystem Assessment 2005). Proper
management can maximize the ecosystem potential of urban forests, creating greater benefits for
both natural and human systems (TRCA 2011a). These benefits are tied to the structure and
design of the forest (Hotte et al 2015); the amount and types of ecosystem services provided will
differ across cities based on the structure and species composition of the urban forest
(McPherson et al 1997). In recent years, ecosystem service provisioning is the main driver for
cities to maintain and expand their urban ecosystems (Zhu & Zhang 2005).
Within the ecosystem services framework, urban forests are a potential resource in climate
change mitigation and adaptation strategies because of the key regulating services they provide.
Mitigation and adaptation strategies typically involve the reduction of greenhouse gasses, and
adjusting infrastructure to new social and environmental conditions caused by climate change.
Carbon dioxide emission is a main driver of climate change. Trees are able to sequester a large
amount of carbon dioxide as biomass during their growth cycles (Pedro et al 2015). Organic
matter produced by forests becomes part of carbon pools, going through processes of
decomposition, and uptake by organisms, forming source sink/dynamics. Nowak and Crane
5
(2002) estimate that urban trees across the United States sequester 22.8 million tonnes of carbon
per year (tC/year) and store 700 million tonnes of carbon. Thus, growth and maintenance of
urban forests can directly offset anthropogenic carbon emissions potentially slowing down the
progression of climate change (Nowak & Crane 2002).
Urban environments will experience shifts in weather patterns as the climate changes (Revi et al
2014). Urban forests play a key role in moderating impacts from changes in microclimate, as
well as more extreme weather events (Gill et al 2007; Hotte et al 2015; TRCA 2011b). Urban
forests can reduce urban heat island effects through evapotranspiration and reflecting of solar
radiation, as well as moderate surface water runoff, and reduce stormwater surges by providing
permeable surfaces (Mathey et al 2011; Revi et al 2014; Tyler & Moench 2012). Dense canopy
cover can also substantially reduce wind speed and alter wind direction at a neighborhood-scale
(Nowak & Dwyer 2007). Urban forests and city design play an important role in climate
adaptation. For example, larger, denser, and well-connected urban forests have stronger cooling
effects than smaller and less connected forests (Hale et al 2015; Mathey et al 2011). While
urban forests can act as compensatory mechanisms for dealing with climate change, the shifts in
climate may have negative effects on urban tree species themselves.
2.1 Climate Change & Tree Vulnerability 2.1.0 Climate Change
Climate change is caused by the increased anthropogenic pollution associated with
industrialization and urbanization. It has rapidly become a global concern. Earth’s climate has
warmed 0.6oC over the past 100 years and is expected to continue to warm with rising
atmospheric CO2 concentrations (IPCC 2013, Walther et al 2002). The IPCC (2014) concluded
based on global climate change models (GCMs) that the Earth will be subject to increasing
global temperatures, rising sea levels, loss of major ice sheets, and more frequent and intense
extreme weather events such as hurricanes, floods, ice storms, heat waves, droughts, and forest
fires (Dale et al 2001; Masson et al 2014). In regards to climate prediction, extremes and
variability in climate are more important than mean values given that extreme weather events
have more drastic impacts than average conditions (Katz & Brown 1992).
6
Extensive research efforts have focused on monitoring the impacts of climate change over the
last 40 years. Changes in weather and climate are already causing considerable impacts on
ecosystems and inhabiting species, leaving them at potential risk of collapse and extinction
(Allen et al 2010; Parmesan 2006). Regional and local scales are more relevant than the global-
scale when measuring climate impacts on ecosystems and their heterogeneous responses
(Walther et al 2002). However, the impacts of climate change can be complex at different
spatial and temporal scales, making it hard to predict how different scales of ecosystems may be
affected (Allen et al 2010).
Vulnerability refers to the absence of characteristics of a system that make it resilient (i.e. the
ability to recover from disturbance) to changes in its environments (Adger 2006). Vulnerability
can also be looked at as the susceptibility of the system to the adverse effects of climate change
(IPCC 2007). In the context of ecosystems, adaptive capacity (i.e. resilience) of species is
dependent on plasticity, evolutionary traits, population size, and dispersion abilities, which
affect how they will respond to climate change and disturbances (Adger et al 2004). Functional
diversity (i.e. the amount and variety of functional traits and roles filled by species in an
ecosystem) determines resilience at the ecosystem-scale (Ordóñez & Duinker 2014). Functional
diversity is based on the species composition of the ecosystem, while species-level resilience
depends on a given species genetic diversity, growth and reproduction traits, phenology, and
physiological requirements such as adequate nutrients, temperature range, and soil hydrology
(Ordóñez & Duinker 2014). The multitude of factors at different scales create the complex and
unique heterogeneous responses of ecosystems to disturbance.
Available literature states that changes in temperature, precipitation, atmospheric CO2
concentrations, ozone (O3), and seasonal patterns of climate can have large impacts on plant
physiology and phenology, as well as regional forest processes (Isebrands et al 2001; Kendal &
McDonnell 2014; McNulty & Aber 2000; Woodward 1987). The exact effects of climate change
on urban forests are not well researched, but some inferences can still be made using forestry
and plant physiology literature (Gauthier et al 2013; Johnston 2004).
7
2.1.1 Effects of Climate Change on Tree Species
2.1.1.0 Species Distribution Species distribution is correlated with climatic regimes. There is consensus within the literature
that distribution is affected by the physiological tolerances different species have to temperature
ranges and precipitation within their respective ecosystems (Anderson 2016; Hoffmann &
Parsons 1997; Woodward 1987). The warming climate is causing the poleward movement of
many climatic zones, which is expected to affect resource availability and the habitat range of
species (Anderson 2016; Dale et al 2001; Wilby & Perry 2008) These temperature shifts can
elicit northward expansion of boreal species such as white spruce (Picea glauca) (Caccianiga &
Payette 2006). There is potential that many other species might shift towards northern latitudes
as well (Iverson & Prasad 1998). Modeled climate envelopes of 130 tree species in North
America are projected to decrease on average of 12% in size and shift northward 700km, when
water availability is not limited (McKenney et al 2007b). If water availability is limited, models
show that species climate envelopes could decrease on average by 58% and a northward shift
would be limited to 330km (McKenney et al 2007b). Although a northward shift in climate
envelopes may occur in North America, this does not mean that species will be able to migrate
in response to their changing habitat range at the same pace (Johnston et al 2009; McKenney et
al 2007b).
Species abundance and habitat quality are important factors in determining the success of
species migration. Species that are rare or have low abundance may be at risk for extirpation if
they are not assisted in their migration through human intervention, especially considering that
(rapid) long distance migration events (+20 km) are unlikely (Iverson et al 2004). Physical
barriers such as the soil, lakes, vast tracts of farmland, cities, and even existing forest patches
can impede successful migrations (Colombo 2008). It is important to note that the correlation of
range shifts to temperature are often not linear and are likely impacted by a range of
confounding factors such as light requirements and dispersal mechanisms (Montoya & Raffaelli
2010; Walther 2010). Distribution responses can be extremely complex; species can differ in
response to environmental requirements, natural earth oscillations (i.e. El Niño/Southern
Oscillation; ENSO), and to the heterogeneous nature of regional climates (Walther 2010;
Walther et al 2002). However, shifts in regional species composition may be required if urban
8
forests are to survive changing climate regimes and maintain ecosystem services (Hotte et al
2015; Hunter 2011).
2.1.1.1 Phenology Phenological shifts (i.e. changes in seasonal activities of species) are becoming more apparent in
various ecosystems globally (Christidis et al 2007; Root et al 2003; Walther 2004). Previous
research indicates that growing seasons have been expanding globally, primarily as the earlier
onset of spring (Christidis et al 2007; Root et al 2003). Growing season in this case is defined by
the period between the last spring freeze and first fall freeze determined by minimum
temperature (Brandt et al 2017). Evidence shows that certain bird species are breeding earlier
and various plant species are exhibiting earlier leaf flushes (Johnston et al 2009; Walther et al
2002). Other evidence suggests that in urban environments, higher temperatures due to grey
infrastructure already result in longer growing seasons than surrounding rural areas. Zhou et al
(2004) documented that urban areas gained about 15 additional days to their growing season
relative to rural areas, given their warmer climates. These shifts can present problematic
conditions for species and ecosystems that rely on timed events for their continuation. For
example, earlier on-set of spring and thus earlier leaf flushes can result in tree damage if buds or
flowers are exposed to spring frosts; multiple exposure of buds to frost can result in tree
mortality (Cannell 2012).
It is important to note that shifts in phenological patterns are not always consistent, and at times
contradictory, between regions meaning they are not dependent exclusively on regional climate
(Gazal 2008; Walther 2010). Traditionally, shorter day length and lower temperatures are
considered important triggers for autumn phenology in temperate deciduous forests (Archetti et
al 2013). Environmental factors such as seasonal changes in photoperiod, humidity, chilling
requirements, frosts, heat stress, rainfall patterns, and drought stress can play important roles in
phenological responses depending on the species and ecosystem (Edwards & Richardson 2004;
Gazal et al 2008). Studies show that impacts from multiple climate factors could work in concert
to affect autumn phenology in temperate deciduous forests (Xie et al 2015).
Interspecies phenological synchrony is important for mutualistic species interactions, however,
warming climate and shifting growing seasons can cause asynchrony in these species
9
relationships (Johnston et al 2009). Phenological shifts can affect the trophic dynamics of a food
web by creating mismatches in resource requirements (i.e. moisture, food, etc.) and availability,
negatively affecting species survival (Edwards & Richardson 2004). However, adaptive
responses to shifting phenological regimes have been shown to occur. A recent study suggested
that phenological shifts in plants, herptiles, and insects in response to climate change can
synchronize between species assemblages at the community-level, meaning there are potential
community-level adaptive responses that maintain ecosystem stability (Ovaskainen et al 2013).
2.1.1.2 Drought Stress & Temperature High temperatures, droughts, and heat waves are projected to occur with increasing intensity
and for longer periods of time in the future (IPCC 2007; IPCC 2013; Romero-Lankao et al
2014). Signs of increasing drought-related mortality have been recorded in various tree species
globally (Allen et al 2010; IPCC 2014). In Algeria, multiple severe droughts between 1999 and
2002 have caused mass mortality across all age classes in cedar forests of species such as atlas
cedar (Cedrus atlantica), cork oak (Quercus suber), and Aleppo pine (Pinus halapensis)
(Chenchouni et al 2008; Touchan et al 2008). In the 1980s, a drought followed by unusual
spring thaw in eastern North America contributed to the decline and mortality of many maples
in Québec (Hendershot & Jones 1989).
Conditions in which there is limited precipitation, low air humidity, lack of soil moisture,
lowered ground water table, and high evaporative demands are often referred to as droughts
(McDowell et al 2008; Brune 2016). Site conditions such as wind effects and soil properties also
play a role in drought (Gartner et al 2009; Roloff & Grundman 2008). For trees, hydraulic
failure or desiccation in conjunction with carbon starvation from reduced soil moisture and high
evaporative demands leads to xylem cavitation (air bubbles that restrict water flow in plants)
and in turn, cell death (McDowell et al 2008). Trees will acclimate to persistent drought
conditions by deforming and shedding leaves, or even shedding whole branches to decrease
water loss and foliage surface (Brune 2016). Overall, drought stress can restrict tree growth and
also make trees vulnerable to attack by pests and disease (Roloff 2010).
Predicting the effects of drought on tree species can be troublesome due to the multitude of
factors that can result in acclimation or mortality such as adaptive traits and secondary effects of
10
pests. For example, the temperate deciduous species Kentucky coffeetree (Gymnocladus
dioicus) is less negatively impacted by drought than sugar maple (Acer saccharnum) because
sugar maple is adapted to less-disturbed mesic environments (Brandt et al 2017; Fahey &
Bailecki 2013). However, the ability of Kentucky coffeetree and sugar maple to withstand
drought can differ across land-use types in urban landscapes (Fahey & Bialecki 2013). Certain
species have developed physiological adaptations to drought such as dehydration postponement
in black spruce (Picea mariana), and dehydration tolerance in jack pines (Pinus banksiana)
(Johnston et al 2009). Individual species response to drought can also vary across urban land use
gradients making it problematic when trying to predict responses to drought events (Fahey &
Bailecki 2013), thus looking at species on an individual level and their site conditions is
important for management practices to be successful.
Although drought mortality is greatest in drier landscapes, site factors may interact with density-
dependent factors such as competition, to create complex patterns of mortality (Fensham &
Holman 1999; Lloret et al 2004). Even if site factors are favorable, greater mortality can occur
where tree density is high due to increased competition for water and the presence of insects
(Allen et al 2010). However, severe droughts can cause extensive tree mortality independent of
tree density (Floyd et al 2009). Severe droughts may also increase fire disturbance frequency
and severity in natural forests (Colombo 2008).
Timing of drought occurrence can also impact species’ response to drought. Species that
experience growth earlier in the season are not as affected by late-season droughts (Hanson &
Weltzin 2000). Some species predisposed to drought may be more resilient to later droughts
while others have greater mortality when exposure persists (Roloff 2013). Studies have shown
that longer growing seasons, in combination with increased tree growth, and warmer
temperatures can increase drought stress (Dale et al 2001; Hanson & Weltzin 2000).
With warming climate and rising atmospheric CO2 concentrations, it is possible that tree species
may increase their net primary productivity to adapt to changes and potentially have greater
drought tolerance (Keenan 2015; Swann et al 2016). However, Lévesque et al (2014) show that
in xeric or mesic environments, temperature-induced drought stress can override any potential
benefits of CO2 fertilization to tree growth.
11
Tree mortality during elevated temperatures can be intensified when combined with reduced
precipitation and soil moisture (McDowell et al 2008). Recently, climate change-induced
drought and heat-stress have been linked to increased tree mortality in species such as trembling
aspen (Populus tremuloides) in Canadian boreal forests (Hogg et al 2008). However, studies
show that elevated temperatures can increase water stress on trees independent of precipitation
(Barber et al 2002).
Tree metabolism and vitality is impacted by heat stress caused by elevated air temperatures or
solar radiation. Heat stress is the result of large heat loads, or too much inflow of energy that is
not redirected fast enough by processes such as transpiration and convective cooling. Trees and
shrubs have optimum growing conditions in temperatures ranging from 21°C to 30°C. When
living tissue reaches a temperature of about 46°C, it reaches its thermal death threshold, causing
cell damage (Coder 1996). This thermal death threshold relies on many factors such as duration
of extreme hot temperatures, tissue age, thermal mass, tissue water content, and ability of plant
to make physiological adjustments to temperature changes (Coder 1996). Deciduous trees in
temperate zones experience heat damage during the vegetative period at approximately TL50 =
50°C; TL50 is a measure of the temperature at which 50% damage occurs after 30 minutes of
heat treatment (Brune 2016).
During hot temperatures, plants will close stomata to conserve water stores, however, during
this time they will not be able to intake CO2 for photosynthesis or use evaporative cooling
mechanisms. This can result in overheating or carbon starvation if extreme temperatures last
beyond carbon reserves; this deleterious process can be enhanced by greater respiration caused
by increased temperatures (McDowell et al 2008). Trees can acclimate to heat stress using
mechanisms such as changing leaf shape and position (Roloff 2010). Seedling, saplings, and
younger trees are greatly affected by increased surface and soil temperatures, while mature tree
crowns and leaves are less affected (Roloff 2010). Saplings, seedlings, and trees within the first
5 years of planting are at the highest risk of drought-related and heat-related mortality (Dale et
al 2001).
With increasing temperatures, some species may not be affected at all or may gain a competitive
advantage as is seen with the movement of climate envelopes, while others may suffer if they
12
lack appropriate adaptive traits to handle elevated temperatures. For example, in piñion-juniper
woodlands, one-seed juniper (Juniperus monosperma) populations were not affected by
increased temperatures due to their higher temperature optima for peak photosynthetic rates,
whereas Colorado pinyon (Pinus edulis) populations showed mass mortality as a result of
carbon starvation (Plaut et al 2012). Generally, the net impact of heat stress will depend on
exposure temperatures, duration of exposure, time of year, soil water availability, and ability to
tolerate or rapidly acclimate (Teskey et al 2015).
2.1.1.3 Wind and Ice Storms Extreme wind events can cause damage to urban forests, but are often rare in Canadian urban
regions (Orodóñez & Duinker 2015). Trees experience windthrow damage when winds exceed
the resistance of stem or root systems (Mitchell 2012). Urban microclimates can be affected by
higher winds than surrounding landscapes due to wind tunneling effects created by closely
quartered buildings (Arnfield 2003). In natural forest, wind speeds can be greatly reduced by
large canopy cover, but given the sparse and patchy nature of urban forests, trees are at greater
risk of windthrow damage (Burley et al 2008; Mitchell 2012). For example, Halifax lost
approximately 70% of its canopy due to hurricane Juan in 2003 (Burley et al 2008).
Ice storms occur where a warm, moist air front meets a cooler layer of surface-air to create
super-cooled water droplets that then fall and immediately freeze onto solid surfaces, covering
them in a layer of ice (Hauer et al 2006). Ice storms can result in costly damage to homes, city
infrastructures, transportation, and energy systems (Smith 2015). Southern regions of Canada
will have temperatures hovering closer to 0oC for more days as the region warms over time.
This could lead to increased occurrences of ice storms, which have caused city-wide damage to
urban forests in the past (Cheng et al 2007; City of Mississauga 2014; Dale et al 2001; Johnston
2004).
Ice storms may be infrequent, but can leave a lasting effect on forest communities. The impacts
of ice storms on urban trees depend on species, age, size, location, tree health, and soil
conditions (Hauer et al 2006; Irland 2000; Smith 2015). Factors that predispose trees to ice
storm damage include weak branch junctions, pre-existing dead branches, previous wounding
and stress, unstable root structure, and large unhealthy tree crowns (Hauer et al 2006; Smith,
13
2015). Typical damage to tree structure includes broken branches, bent stems, splits trunks, or
complete uprooting (Forest Ontario 2014). Ice storms have the greatest impact on mature trees,
species with lower structural strength, and individuals with previous damage and wounding
(Irland 2000; Orodóñez & Duinker 2015). Combined effects of high winds and ice formation
can cause increased breakage of trees (Irland 2000; Mitchell 2012).
2.1.1.4 Pests Climatic shifts can also make way for invasive pest species to destroy large populations of
native species. Invasive species are those that vastly outcompete or cause damage to species in
the historically native assemblage of an ecosystem, affecting the overall integrity of that system.
Invasive pests can significantly change the species composition, diversity, and structure of a
given area in a decade or less (Dale et al 2001; Gauthier et al 2014). Pest populations can
increase rapidly with the warming climate due to lack of natural predators and increased
overwintering survival, as can be seen with the mountain pine beetle (MPB) and emerald ash
borer (EAB) (Hotte et al 2015; Thomas et al 2004). Pests are increasingly likely to disperse to
different regions due to global trade markets, by hitching a ride on exported goods (McKinney
2006). Drought or heat stressed tree species are more likely to suffer mortality from pests and
disease (Allen et al 2008; McDowell et al 2008). However, wet periods can also increase
susceptibility to emerging disease (Woods et al 2006). Thus, anthropogenic disturbance with
the addition of invasive pest species and climate change could have long lasting detrimental
effects on global biodiversity.
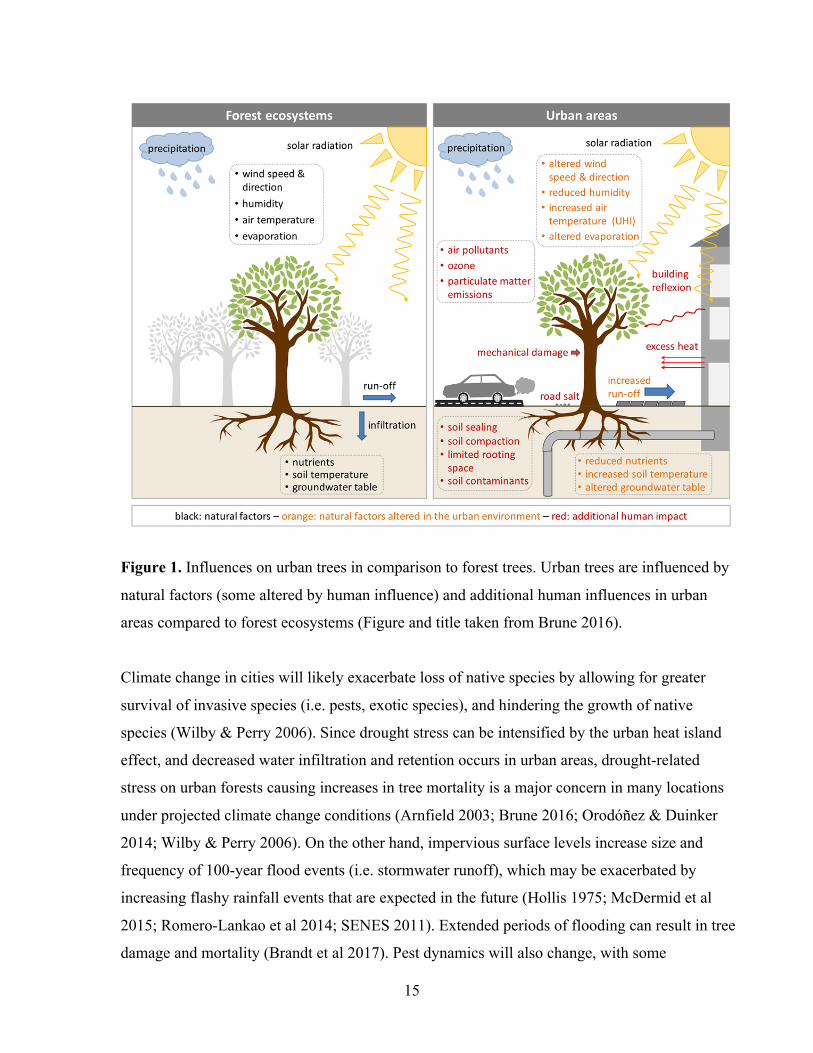
2.1.2 Current and Future Stressors in Urban Forests Urban forests are vastly different in structure compared to natural ecosystems (Figure 1). Due to
their small fragmented patches, urban forests provide similar ecosystem services as natural
forests, but on a much smaller scale and magnitude (Gauthier et al 2014). The urban tree
assemblages lack the diversity and balanced interspecies dynamics of natural forests (Montoya
& Raffaelli 2010). As a result, urban species are often at greater risk of local extinctions due to
the high level of human interference and various stressors and because communities are
dominated by a small number of species of which a majority can be exotic and/or invasive
(Grimm et al 2008; Kowarik 2011; McKinney 2002; McKinney 2006; Wilby & Perry 2006).
14
Overall, urban forests lack the level of resiliency natural forests have towards disturbance events
(Adger 2005). For example, flooding is less of a concern in natural forest systems because a
large percentage of precipitation will enter groundwater storage or be absorbed and
evapotranspired by vegetation (Dale et al 2001). However, urban forests are surrounded by a
high amount of hard impervious surfaces which inhibit percolation of water into the ground
leading to more intense floods (Kirnbauer et al 2013).
Urban areas are defined by their dense human populations, and yet many urban tree species still
manage to persist in these highly modified environments. Generally, species able to survive in
urban habitats (synanthropes) tolerate poor site conditions and disturbance extremely well (i.e.
low water and air quality, drought, salt, heavy metals, human activity, etc. (Brune 2016; Hotte et
al 2015, McKinney 2002). Unlike natural forests, urban species composition and dispersal are
primarily controlled by human influence (Nowak 2010). Artificial selection forces not only alter
local species composition, but accelerate global species homogenization caused by the import
and export of (invasive) exotic species, which may then spread to natural ecosystems outside
urban areas (McKinney 2006).
Urban forests are potentially vulnerable to climate change due to intensified climate effects in
urban regions (Solecki & Marcotullio 2013). One example of this is how hot air masses that
surround metropolitan areas, named urban heat islands (UHI), are exacerbated by heat waves,
leading to an already warm area becoming hotter (Gabriel & Endlicher 2011). Urban areas with
populations greater than 1 million people can be 1 to 3°C hotter than surrounding rural areas
(Akbari 2005). Additionally, stormwater surges and flooding are common problems in urban
areas (Dale et al 2014; Demuzere et al 2014). Thus, further climatic warming or intensification
of precipitation events will cause even greater challenges for urban forests.
15
Figure 1. Influences on urban trees in comparison to forest trees. Urban trees are influenced by
natural factors (some altered by human influence) and additional human influences in urban
areas compared to forest ecosystems (Figure and title taken from Brune 2016).
Climate change in cities will likely exacerbate loss of native species by allowing for greater
survival of invasive species (i.e. pests, exotic species), and hindering the growth of native
species (Wilby & Perry 2006). Since drought stress can be intensified by the urban heat island
effect, and decreased water infiltration and retention occurs in urban areas, drought-related
stress on urban forests causing increases in tree mortality is a major concern in many locations
2014; Wilby & Perry 2006). On the other hand, impervious surface levels increase size and
frequency of 100-year flood events (i.e. stormwater runoff), which may be exacerbated by
increasing flashy rainfall events that are expected in the future (Hollis 1975; McDermid et al
2015; Romero-Lankao et al 2014; SENES 2011). Extended periods of flooding can result in tree
damage and mortality (Brandt et al 2017). Pest dynamics will also change, with some
!
10
shading, and sensitivity to artificial light (Roloff 2013a). However, not all criteria are objective. Aesthetic value for example is also a question of personal preferences. Nevertheless, some criteria are necessary to consider, because they are affecting traffic security of security of pedestrians (e.g. risk of breakage or fruit fall) (Roloff 2013a). An extensive list of criteria can be found in Roloff (2013a).
Fig. 1 Influences on urban trees in comparison to forest trees. Urban trees are influenced by natural factors (some altered by human influence) and additional human influences in urban areas compared to forest ecosystems (source: own illustration).
16
populations allowed to flourish in warmer, drier urban conditions that can leave trees stressed
and vulnerable (Woods et al 2006)
A recent study by Foran et al (2015) suggests that in Cambridge, Massachusetts the predicted
cumulative effects of pests, temperature shifts, precipitation changes, and extreme weather
events (i.e. flooding, tropical storms, snow and ice loading) on the urban forest could lead to
58% tree mortality. While it was not a complete impact assessment due to only accounting for
publicly owned trees, this study brings to light the potential susceptibility of urban forests to
climate change factors (Foran et al 2015). The vulnerability of urban forests to climate change
could present costly management problems in the future given the already short lifespans of
urban forest species, which often require replacement after every 13-20 years (Roman &
Scatena 2011). If lifespans were even further shortened by climate shifts then adaptive measures
would need to be taken. Thus, climate stressors need to be considered when managing urban
forests for optimal growth and survival.
In regards to assessing climate stressors within urban forests, the idea of climate change
vulnerability assessments (CCVAs) in the context of urban forests have recently seen traction in
research from Ordóñez and Duinker (2014) and by various other researchers with the support of
city governments like Chicago, Vancouver, and Melbourne (Brandt et al 2017; Kendal &
Baumann 2016; Needoba et al 2016). Relative to studies like those conducted by Foran et al
(2015), CCVAs include a wider variety of factors when assessing urban forest climate
sensitivity and adaptive capacity, such as: species physiology and phenology, growing
conditions, species composition, community awareness, and socio-economic factors (Brandt et
al 2017; Ordóñez and Duinker 2014). An in-depth study conducted by Ordóñez and Duinker
(2015) lays out an appropriate framework for assessing exposure, sensitivities, impacts, and
adaptive capacities of urban forest species categorized by their general physiological
characteristics. CCVAs serve as important indicators of best management practices when
applied alongside adaptive management with the goal of maintaining ecosystem services in a
quickly changing climate.
While there is a growing body of research looking into the vulnerability of urban forests to
climate change, there is still much to be accomplished. Climate change will impact regions
heterogeneously across different spatial and temporal scales. Urban forests will be uniquely
17
affected by climate change based on their specific geography, pre-existing stressors, species
composition, as well as the ability of those species to adapt to the changing climate. Therefore,
it is important that regions individually assess future climate and the potential impacts on their
specific urban forests.
Mississauga has an extensive urban forest management plan detailing the efforts required to
maintain a healthy canopy (TRCA, 2011a), but have yet to address the impacts climate change
may have on the regions green infrastructure. This study aims to fill this gap by using some of
the methodology of a climate change vulnerability assessment to address factors such as
projected climate and species vulnerability on a regional scale. Measuring species composition
on a large scale can better inform the vulnerability of urban forests to future climate change and
how to ameliorate species loss. Considering that there is a strong lack of CCVA’s addressing
urban forests in Ontario, this study can potentially act as an indicator to other cities prompting
them to keenly address their urban forests as well.
18
Chapter 3
Methodology
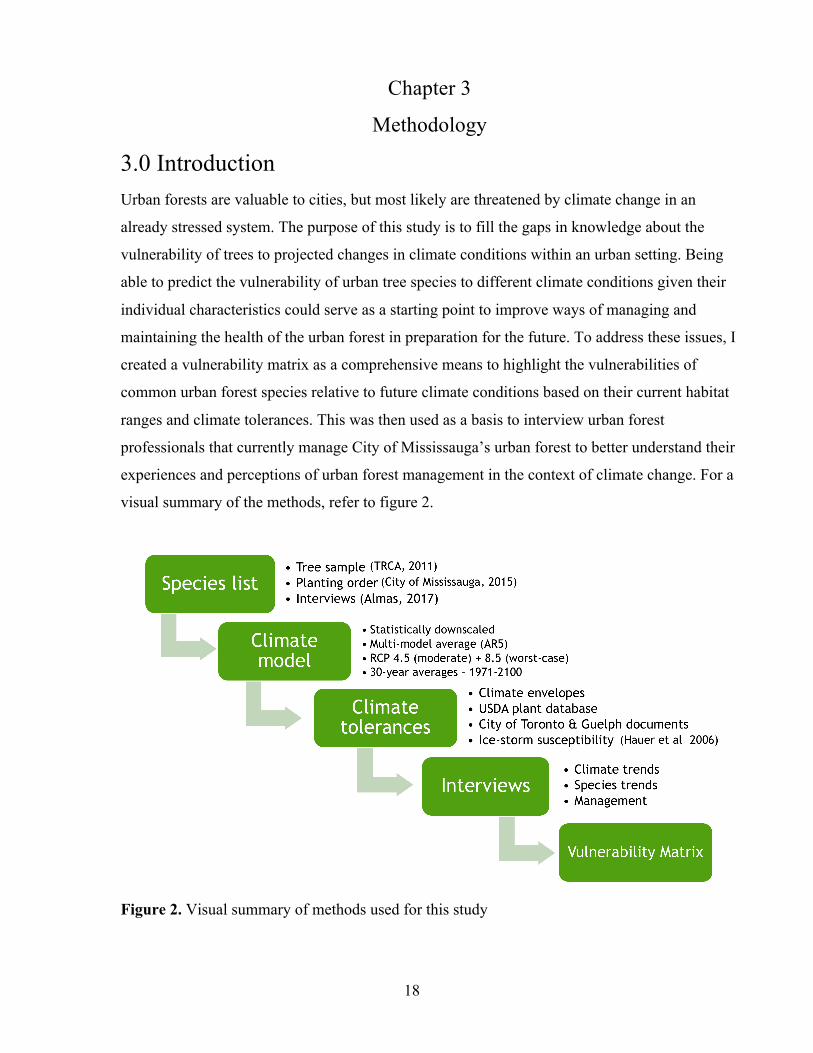
3.0 Introduction Urban forests are valuable to cities, but most likely are threatened by climate change in an
already stressed system. The purpose of this study is to fill the gaps in knowledge about the
vulnerability of trees to projected changes in climate conditions within an urban setting. Being
able to predict the vulnerability of urban tree species to different climate conditions given their
individual characteristics could serve as a starting point to improve ways of managing and
maintaining the health of the urban forest in preparation for the future. To address these issues, I
created a vulnerability matrix as a comprehensive means to highlight the vulnerabilities of
common urban forest species relative to future climate conditions based on their current habitat
ranges and climate tolerances. This was then used as a basis to interview urban forest
professionals that currently manage City of Mississauga’s urban forest to better understand their
experiences and perceptions of urban forest management in the context of climate change. For a
visual summary of the methods, refer to figure 2.
Figure 2. Visual summary of methods used for this study
19
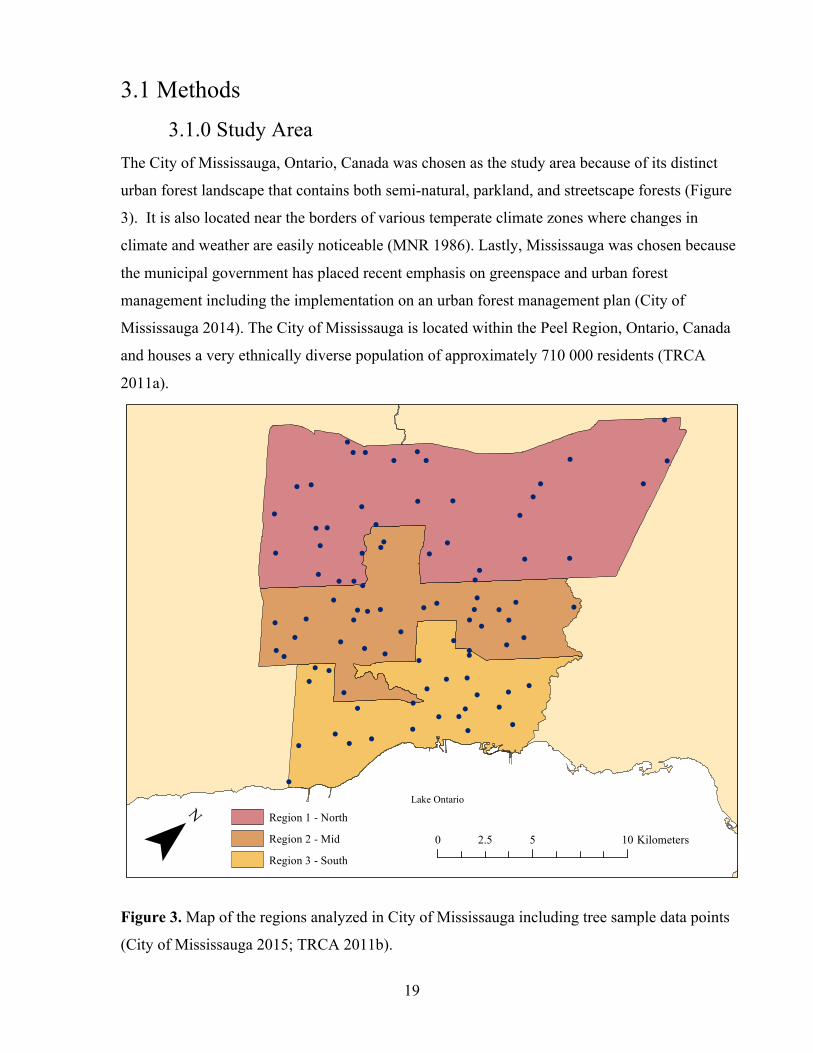
3.1 Methods 3.1.0 Study Area
The City of Mississauga, Ontario, Canada was chosen as the study area because of its distinct
urban forest landscape that contains both semi-natural, parkland, and streetscape forests (Figure
3). It is also located near the borders of various temperate climate zones where changes in
climate and weather are easily noticeable (MNR 1986). Lastly, Mississauga was chosen because
the municipal government has placed recent emphasis on greenspace and urban forest
management including the implementation on an urban forest management plan (City of
Mississauga 2014). The City of Mississauga is located within the Peel Region, Ontario, Canada
and houses a very ethnically diverse population of approximately 710 000 residents (TRCA
2011a).
Figure 3. Map of the regions analyzed in City of Mississauga including tree sample data points
(City of Mississauga 2015; TRCA 2011b).
!
!
!
!
!
!
!
!
!
! !
!
!
!
!
!
!
!
!
!
!
!
!
!!
!
! !
!
!
! !
!
!
! !
!
!
!
!
!
!
!
!
!
!
!
!
!!
!
!
!
!
!
!
!
!!
!
!!
!
!!
!
!
!
!
!
!
!
!!
!
!
!
!
!
!
!
!
!
!
!
!
!
!
!
!!
¯ 0 5 102.5 Kilometers
Region 1 - North
Region 2 - Mid
Region 3 - South
Lake Ontario
20
This region was heavily forested before European colonization. After, it was cleared for
agricultural use, and subsequently urbanized over time (City of Mississauga 2014). The total
land area is approximately 290km2 consisting mainly of residential (29.3%), roadways (20.5%),
and industrial (15.3%) land uses (City of Mississauga 2017). The urban tree canopy is
approximately 43.5km2 (15%) of the land, while impervious surfaces cover approximately half
of the total land area (TRCA 2011b).
The city is bordered by the Credit River Watershed to the east and the Etobicoke and Mimico
Creeks Watersheds to the west. It is located in northernmost region of ecodistrict 7E-4, a
mixedwood plans ecozone within the Lake Erie-Lake Ontario ecoregion. The 7E designation
refers to the Carolinian Forest Region/Deciduous Forest Region (Natural Resources Canada
2011) that covers the most southern parts of Ontario along Lake Erie up to the City of Toronto
(MNR 2009).
The climate of 7E region is one of the mildest in Canada, classified in the Humid Moderate
Temperate Eco-climactic Region (MNR 1986). Mississauga’s climate is classified as humid
continental climate, or DfB, under the Koppen climate classification system (Climate-Data,
2015). Mean annual temperature range is 6.3-9.4oC, with a growing season length of 217-243
days. Highest average temperatures occur in July (21oC) and lowest in January (-5.8oC)
(Climate-Data, 2015). Mean annual precipitation is 776-1018mm and mean summer
precipitation is 196-257mm within the region (MNR 1986). The least amount of rainfall occurs
in February, with an average of only 50mm of precipitation; the most rainfall occurring in
August, with an average of 83mm of precipitation. Microclimate effects such as warmer and
moister climates can occur near the lakeshore due to lake effects (Climate-Data, 2015).
Mississauga is considered to have a 6B rating on the plant hardiness index based on its climatic
features (Natural Resources Canada, 2004). Rare Carolinian species such as the Kentucky
coffeetree (Gymnocladus dioicus), cucumber-tree (Magnolia acuminate), tulip tree
(Liriodendron tulipifera), and sycamore (Platanus occidentialis) are found almost nowhere else
in Ontario except this southern region. Coniferous species such as eastern white pine (Pinus
strobus) are found mixed with deciduous species such as basswood (Tilia americana), among
many other species (TRCA 2011b).
21
There are ~2.1 million trees within the boundaries of this municipality, 1 million of which are
located on private property (i.e. residential, industrial, etc.; TRCA 2011b). There are ~234 tree
species within the area (TRCA 2011b). The species evenness is quite low as maples (Acer)
represent 31% of the total leaf area. However, species diversity of the urban forest is high in
residential areas due to frequent planting of exotic ornamental species (TRCA 2011b). Norway
and Manitoba maples represent half of all maple species and 15% of total leaf area.
Approximately 64% of all trees are less than 15.3cm diameter at breast height (DBH) and only
7% have a DBH of 38.2cm or greater, meaning that most of the tree population is quite young if
size is used as a proxy for age. Recently, ash (Fraxinus) populations have been greatly reduced
by the emerald ash borer, and approximately 56% of the live tree population is susceptible to
Asian long-horned beetle (TRCA 2011b). Most trees are in good to excellent condition (TRCA
2011b). Mississauga has an urban forest management plan in place that aims to improve tree
establishment, management, and protection; the city has set a goal to plant 1 million trees
between the years 2012 to 2024 (City of Mississauga 2014).
By-laws, such as the Private Tree Protection and Street Tree by-laws, have been created by the
City to regulate the injury and removal of trees on private and public property, respectively.
Aside from the by-laws limiting the removal of trees and mandatory requirements for new
development, there is often insufficient management and maintenance of the trees located on
private properties (TRCA 2011b).
3.1.1 Tree Data Tree species analyzed for this study were chosen based on their abundance in the City of
Mississauga tree sample data, presence in city’s planting order lists, and from interviews with
urban forest professionals (Almas 2017, personal communication). The City of Mississauga tree
sample was collected by the Toronto and Region Conservation Authority in collaboration with
the municipalities involved (TRCA 2011a). Data collection was intended for the i-Tree Eco
analysis, a model developed by the USDA Forest Service to evaluate the monetary value that
urban forests provide by analyzing ecosystem services. Two field crews collected data during
the summer leaf-on season in 2008. The dataset used randomized grid sampling of
approximately 207 circular plots that were 400 m2 in size. Density of plots was 1 plot per 1.4
km2. A sampling size of 200 yields approximately 10% of standard error in the i-Tree protocol.
22
Plots are geotagged, so they are available for use in GIS programs such as ArcGIS. The sample
includes both privately owned and public trees on a variety of land-uses.
It is important to note that samples taken were on urbanized and semi-naturalized locations
where natural regeneration would be possible. This analysis includes factors such as cold
stratification because some species have the opportunity to naturally regenerate in certain parts
of Mississauga’s urban forest. This dataset is the most comprehensive tree dataset available for
Mississauga at this time. Detailed vegetation information was recorded using i-Tree
specifications (USDA, 2007). For each tree species with a diameter at breast height (DBH)
above 2.5cm, several variables were recorded (Table 1).
Table 1. i-Tree data variables collected for tree sample i-Tree Data Collection
Species Percent canopy missing Number of stems Tree condition Diameter at breast height Distance and direction from building Tree height Street tree indicator Height to base of live crown Land use type Percent tree cover Percent ground cover
The list of species analyzed in this study was narrowed down by calculating the abundances of
each species from the City of Mississauga tree sample, and then isolating the data of the most
abundant native and non-native species. This list was further refined by utilizing a recent
planting order obtained from the City of Mississauga urban forestry department to highlight
species currently being planted. Remaining species were cross-referenced with data from
interviews with urban forest professionals conducted by Andrew Almas (2017, personal
communication). Species were either added or subtracted based on their prioritization by urban
forest professionals and the number of individual trees ordered by the city. Species that did not
have available climate envelope data, low abundances, or had unspecified references to genus
names were also removed from the final species list. Finally, some species present in the tree
sample have high pest vulnerability and are no longer planted in Mississauga and therefore
removed from the final list. For example, the Fraxinus (ash) genus was removed as it is being
highly threatened by the emerald ash borer even though it had a relatively high abundance in the
2008 sampled data.
23
From these sources, 27 species were identified as the most commonly planted or abundant
native (20) and non-native species (seven). Eight species were coniferous, 19 were deciduous,
and one species was deciduous-coniferous. It is assumed that if species are abundant or being
planted within the existing urban forest, then they are able to thrive in the current climatic
conditions of Mississauga.
Table 2. List of species chosen for this study. Brackets indicate the number of species on the
planting order list.
3.1.2 Climate Data and Species Distribution Models Climate projections were used to outline the historic and potential projected trends in the climate
of City of Mississauga. Species distribution models, also referred to as climate envelopes, were
used to highlight climate tolerances of species given their current distribution, and to highlight
their potential vulnerability if the projected climate of Mississauga creates environmental
circumstances outside of their suitable habitat range. Climate projections were retrieved from
Natural Resources Canada. Historical climate data (1971-2000) is data generated by the
ANUSPLIN program suite as a spatially continuous model using weather station data from
across North America (Hutchinson 2004). Projection data were averaged over four 30-year time
periods from 1971-2100. A statistical interpolation approach, developed by McKenney et al
(2007a; 2007b), was then used to downscale monthly climate projections from general
24
circulation models (GCMs). Given the relatively small land area of City of Mississauga, a
central point (43.5789 latitude, -79.6583 longitude) was chosen for model projections. The
spatial resolution of this model is 300-arc-seconds or approximately 10 km grid cells. The
GCMs used in the downscale projections were:
Ø CanESM2 – Canadian Earth System Model Version 2
Ø MIROC-ESM-CHEM – Model for Interdisciplinary Research – Earth System Model
developed by the University of Tokyo
Ø CESM1-CAM5 – Community Earth System Model Version 1 (CESM1), includes
Community Model Version 5 (CAM5)
Ø HadGEM2-ES – Hadley Global Environment Model 2 - Earth System
The outputs from these four GCMs were averaged to create the Composite AR5 model which is
the primary output used for this study. The outputs for the GCM models, and thus the AR5
composite, are based on a set of scenarios called Representative Concentration Pathways (RCP)
used by the Intergovernmental Panel on Climate Change (IPCC) for the Fifth Assessment
Report (AR5). These scenarios represent time-dependent projections for greenhouse gas (GHG)
concentrations and corresponding emission; however, they are not tied to socio-economic
storylines like the Special Report of Emissions Scenarios (SRES) were (IPCC 2013). Two
scenarios were chosen for this study: RCP 4.5, which is a low-moderate concentration pathway;
and RCP 8.5, which is a high concentration pathway similar to the “business-as-usual” scenario.
The numbers are in reference to the radiative forcings of each RCP (IPCC 2013).
Climate envelopes were generated using ANUCLIM software that produces estimates of all
climate variables of interest where the species were observed. This is done through the use of
weather station data. In total, this program generates nineteen bioclimatic variables when
inputted with spatially continuous climate models (McKenney et al 2007a). Boundaries for the
climate envelopes are defined by the minimum and maximum values within that species’ range
using rectilinear modeling. To reduce sampling density bias, single occurrences of species are
randomly chosen from 300-arc-second (approximately 10 km) grids. The species’ core range is
defined by the climate values between the 5th and 95th percentiles (i.e. 90% of the climate values
where the species exist; McKenney et al 2007b). Six of these nineteen bioclimatic variables are
used to specify and project the habitat ranges of these species under future climate conditions
(Table 3).
25
Table 3. Six bioclimatic variables used for species distribution modeling under future climate
conditions.
Temperature-based variables Precipitation-based variables Mean annual temperature Annual precipitation Minimum temperature of the coldest quarter Precipitation of the coldest quarter Maximum temperature of the warmest quarter Precipitation of the warmest quarter
These six variables are used because they are highly correlated with other environmental
variables such as extreme minimum temperature, growing degree days, and course-scale water
budget models that control plant habitat ranges (McKenney et al 2007b). While they are
correlated, they do not add exaggerated constraints to the models, giving a more accurate picture
of species’ habitat ranges. Detailed definitions for these and other bioclimatic variables can be
found in the ANUCLIM manual (Xu & Hutchinson 2013).
Climate Moisture Index (CMI) was also retrieved from model outputs as a measure of regional
moisture balance, calculated by subtracting Monthly Potential Evapotranspiration (PET) from
Monthly Precipitation (P). CMI has been shown to be correlated with drought-stress mortality in
aspen in Western Canada (Hogg et al 2008). Positive CMI values signal moist climates that can
sustain closed-forest canopies, negative values denote drier climates with patchy forest cover or
grassland habitats (Hogg et al 2013; McKenney et al 2013).
Variables such as dew point at surface and total cloud cover, among others, were used by Cheng
et al (2007) for future ice storm frequency projections. These data variables were not available
through the outputs of the models used for this study, therefore, results of future ice storm
projections from Cheng et al (2007) were used to speak on and emphasize the ice storm
Temperature-based bioclimatic variables and length of growing season for 27 tree species were
graphically compared to historic and future projections of these bioclimatic variables. This was
done to determine if future climate of Mississauga will still fall within the current climate
requirements of these species alluding to their potential vulnerability. Core ranges were graphed
26
as floating bar charts for each temperature-related bioclimatic variable and growing days, with
full ranges (2.5th and 97.5th percentiles) being represented as error bars for each variable. The
coloured bars represent the core range of the species, or the range of values in which 90% of the
species reside. Although they may look like box plots, this is not the case. Precipitation
variables were not graphed due to lack of major changes in values over time and across
scenarios.
3.2.1 Species’ Physiological Characteristics Species physiological data (i.e. Climate tolerances; CT) were collected to highlight the
vulnerability of species to certain environmental conditions. Morphological features vary
between species, giving certain species a competitive advantage or disadvantage depending on
the environmental conditions. Species-specific CTs for the 27 tree species were collected from
the United States Department of Agriculture (USDA) plant characteristic database (USDA,
2017). This database contains a wide suite of information pulled from many professional
sources for various native and non-native plant species, as well as their estimated range maps
and other valuable information. The USDA plant characteristic database was the main source of
plant growth requirement data such as drought tolerance, moisture use, and cold stratification
based on field and lab data (USDA, 2017). Drought tolerance was also obtained from municipal
planting reports put out by the City of Toronto and City of Guelph suggesting which species to
plant in drought-like conditions (City of Toronto, 2012; City of Guelph, 2017). Species that
were not on the list were not considered drought tolerant in this study. Moisture use is related to
a species ability to physiologically control moisture loss (Potts & Herrington 1982). It is
assumed that data from each source had consistent procedures for observing and testing plant
traits and requirements. Definitions for the climate tolerance categories can be found in Table 4.
Some definitions were shortened or altered.
27
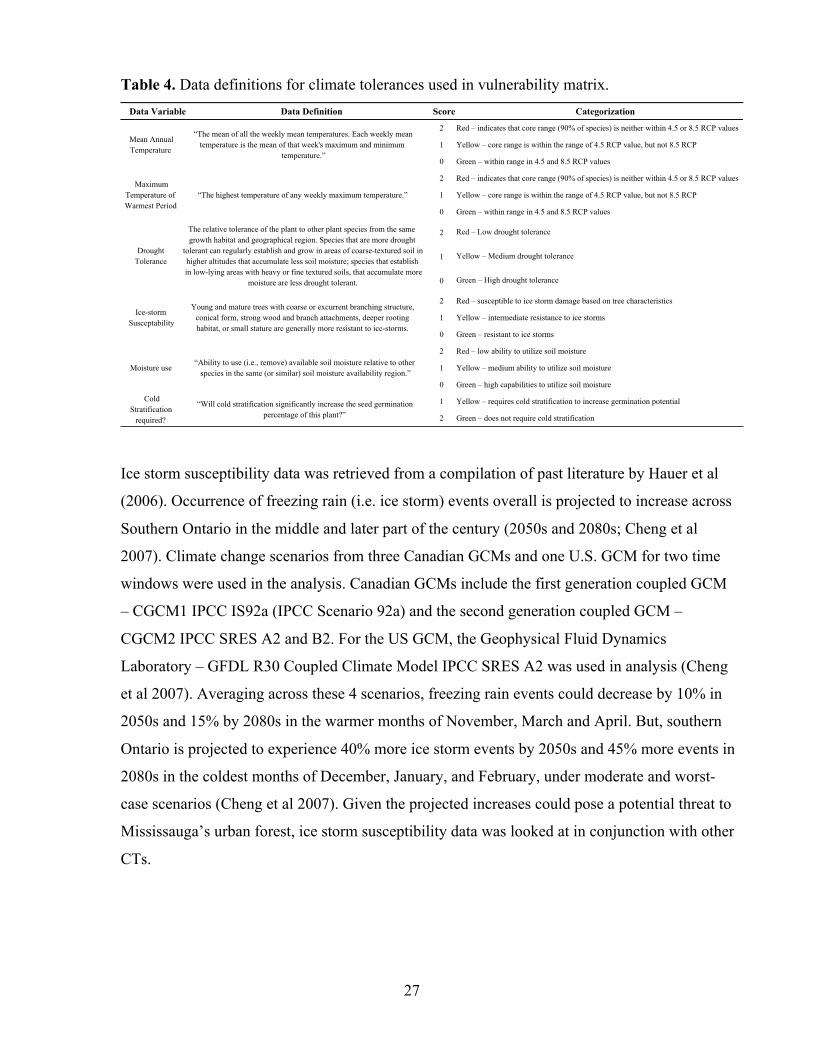
Table 4. Data definitions for climate tolerances used in vulnerability matrix.
Ice storm susceptibility data was retrieved from a compilation of past literature by Hauer et al
(2006). Occurrence of freezing rain (i.e. ice storm) events overall is projected to increase across
Southern Ontario in the middle and later part of the century (2050s and 2080s; Cheng et al
2007). Climate change scenarios from three Canadian GCMs and one U.S. GCM for two time
windows were used in the analysis. Canadian GCMs include the first generation coupled GCM
– CGCM1 IPCC IS92a (IPCC Scenario 92a) and the second generation coupled GCM –
CGCM2 IPCC SRES A2 and B2. For the US GCM, the Geophysical Fluid Dynamics
Laboratory – GFDL R30 Coupled Climate Model IPCC SRES A2 was used in analysis (Cheng
et al 2007). Averaging across these 4 scenarios, freezing rain events could decrease by 10% in
2050s and 15% by 2080s in the warmer months of November, March and April. But, southern
Ontario is projected to experience 40% more ice storm events by 2050s and 45% more events in
2080s in the coldest months of December, January, and February, under moderate and worst-
case scenarios (Cheng et al 2007). Given the projected increases could pose a potential threat to
Mississauga’s urban forest, ice storm susceptibility data was looked at in conjunction with other
CTs.
Data Variable Score
2
1
0
2
1
0
2
1
0
2
1
0
2
1
0
1
2
Categorization
“The highest temperature of any weekly maximum temperature.”
“The mean of all the weekly mean temperatures. Each weekly mean temperature is the mean of that week's maximum and minimum
temperature.”
The relative tolerance of the plant to other plant species from the same growth habitat and geographical region. Species that are more drought
tolerant can regularly establish and grow in areas of coarse-textured soil in higher altitudes that accumulate less soil moisture; species that establish in low-lying areas with heavy or fine textured soils, that accumulate more
moisture are less drought tolerant.
Green – within range in 4.5 and 8.5 RCP values
Red – indicates that core range (90% of species) is neither within 4.5 or 8.5 RCP values
Yellow – core range is within the range of 4.5 RCP value, but not 8.5 RCP
Green – within range in 4.5 and 8.5 RCP values
Red – indicates that core range (90% of species) is neither within 4.5 or 8.5 RCP values
Yellow – core range is within the range of 4.5 RCP value, but not 8.5 RCP
“Ability to use (i.e., remove) available soil moisture relative to other species in the same (or similar) soil moisture availability region.”
Mean Annual Temperature
Maximum Temperature of Warmest Period
Drought Tolerance
Data Definition
Cold Stratification
required?
“Will cold stratification significantly increase the seed germination percentage of this plant?”
Yellow – requires cold stratification to increase germination potential
Green – does not require cold stratification
Red – Low drought tolerance
Yellow – Medium drought tolerance
Green – High drought tolerance
Red – susceptible to ice storm damage based on tree characteristics
Yellow – intermediate resistance to ice storms
Green – resistant to ice storms
Red – low ability to utilize soil moisture
Yellow – medium ability to utilize soil moisture
Green – high capabilities to utilize soil moisture
Ice-storm Susceptability
Moisture use
Young and mature trees with coarse or excurrent branching structure, conical form, strong wood and branch attachments, deeper rooting habitat, or small stature are generally more resistant to ice-storms.
28
3.2.2 Vulnerability Matrix Climate tolerances gathered from climate models and plant databases were amassed into a
matrix. Visualizing these vulnerabilities in an easy to read format can help urban forest
professional and municipalities make more informed planting and maintenance decisions for the
future. The matrix provides an effective and practical way to visualize and compare species’
vulnerabilities to different environmental conditions, and also allows for easy comparison of
various species using cumulative vulnerabilities.
Each climate tolerance category was assigned with either tri-colored or dual-colored
vulnerability classes as well as a corresponding numerical score (Table 4). These vulnerability
classes indicate the amount of management and attention a species may require if modeled
climate predictions are correct or if certain environmental conditions persist. Green represents
low potential vulnerability (0) to a climate variable, yellow a moderate potential vulnerability
(1), and red a high potential vulnerability (2). Low potential vulnerability means that a particular
environmental condition will have little to no effect on that species; moderate potential
vulnerability means a particular environmental condition will lead to non-lethal problems but
may require intervention if problems are persistent over time; high potential vulnerability refers
to particular environmental conditions that will require some sort of management to be
implemented or will otherwise result in the death or premature removal of that species. For
example, intense ice storms, such as the one in 2013 that hit most of southern Ontario, can result
in lethal damage and mortality of many tree species, but unevenly affect species depending on
their structure and size (City of Mississauga 2016; Hauer et al 2006). Drought tolerance scores
for species not included in the municipal reports were high or 2 meaning they have higher
potential vulnerability due to not being chosen for drought tolerant landscaping within city
boundaries. However, if they were included they were given a low score or 0 (i.e. low potential
vulnerability). No moderate score was given due to the binary nature of the reports.
Cumulative potential vulnerabilities were calculated by giving each color-coded vulnerability
class a numerical value from 0 to 2 (i.e. 0 = low vulnerability, 1 = moderate vulnerability, 2 =
high vulnerability), adding up scores from each climate tolerance for each species, and assigning
summed scores a color on a gradient using conditional formatting tools in Excel. The lowest
score possible was a 0 suggesting low cumulative vulnerability, the highest score of 13 (or 11
29
for some species due to unavailable ice storm susceptibility data) suggesting a high cumulative
vulnerability. This categorization technique makes it easy to see which species have the highest
or lowest overall potential vulnerability, as opposed to only looking at each individual climate
tolerance.
3.2.3 Regional Tree Vulnerability Regional vulnerability to climate change was assessed using a combination of mapping and
species frequency data to highlight vulnerability of regions to each climate variable analyzed in
this study (Figure 3). In ArcGIS tree sample plots were first divided into 3 distinct regions:
region 1 - North, region 2 – Middle or Mid, and region 3 - South. Mapped regions were based
on existing wards in the City of Mississauga. Region 1 consists of wards five, nine, 10, and 11.
Region 2 consists of wards three, four, six, and eight. Region 3 consists of one, two, and seven.
Using Excel software and ArcGIS, tree sample data from the TRCA (2011a) was filtered to
include only species chosen for this study. Species frequencies were then extracted based on the
region in which they were sampled. Assigned vulnerability scores were retrieved from the
vulnerability matrix, and regional vulnerability was analyzed by graphing the frequency of
species in each vulnerability score, ranging from zero to two, for each climate tolerance
category. Cumulative vulnerability was graphed based on frequency of species in each
cumulative vulnerability score, ranging from zero to 13 or zero to 11 for some species, for each
region and as a total of all regions.
3.3 Interviews Semi-structured interviews were conducted with urban forestry professionals to gather
perspectives on historic and current trends of climate, trends in species composition,
consideration of climate change and other factors in urban forest management, as well as to test
the validity of the vulnerability matrix relative to first-hand experiences. Interviewed
participants were those employed by the municipality, as well as self-employed arborists. All
participants work in the City of Mississauga, or have conducted urban forestry projects within
the region. Interviews were conducted between February 2017 and May 2017. Participants were
chosen by researching urban forestry organizations and directories such as the International
Society of Arborists (ISA).
30
Participants were initially contacted with a brief email explaining the project and asking if they
wished to participate in an interview. A total of 20 people were invited to be interviewed and
seven agreed to be interviewed. Relevant documents such as the introductory letter, consent
form, interview questions, and results summary were sent only if participants were interested
(Appendix A, Appendix B). After having the opportunity to review and sign the documents,
semi-structured interviews were conducted in the workspaces of the participant. An interview
question list was used as a guide to frame questions and lead the conversation (Appendix C).
Interviews were digitally recorded.
The questions asked fell into four general categories of their perceptions about: recent climate
trends, changes in species composition, thoughts on the vulnerability matrix, and current and
future practises of management. Questions related to recent climate trends considered shifts in
weather patterns, seasonality, microclimates, and extreme weather events. Participants were
asked about any shifts noticed in the species composition of the urban forest, and give any
reasons they believed were the cause of the compositional shifts. Participants were also asked to
comment on the results of the vulnerability matrix and voice any disagreements they had.
Lastly, participants were asked about the biggest challenges to maintaining and managing the
urban forest, what factors are considered in management and how they are prioritized, as well as
what they are considering for future management. Recordings and notes from each interview
were then reviewed and a partial transcript was created highlighting the main themes and
important points mentioned by participants. Results from partial transcripts were then narrowed
down into commonly mentioned themes for each question category, and any controversy or
conflicting points were noted.
This section of the research project was approved by the University of Toronto’s Office of
Research Ethics and followed normal ethics protocol. Identities of the participating individuals
were kept confidential. Participants were given the option to be referred to by their professional
title if they gave consent.
31
Chapter 4
Results
4.0 Introduction The results from the climate analysis and answers from interviewed participants had many
commonalities in regards to species vulnerability and shifts in climate. Overall, summers are
projected to get hotter, drier, and longer; winters are projected to be shorter, warmer and wetter;
and weather is projected to fluctuate more, as well as more intense weather events are projected
to occur. Many of the commonly planted native and non-native species have at least one climate
factor that is identified as a moderate potential vulnerability, meaning human intervention may
be required in the future to increase the chances of survival of that species in that particular
climate scenario.
4.1 Climate Projections 4.1.0 Summary of Bioclimatic Variables Results from the downscaled climate models obtained from Natural Resources Canada were for
30-year periods between 2011 to 2100 (Natural Resources Canada 2017), using two different
scenarios: RCP 4.5 as a moderate scenario and RCP 8.5 as a worst-case scenario. Projections
associated with each set of variables is discussed below (Table 5).
Table 5. Projections of 8 bioclimatic variables under RCP 4.5 and RCP 8.5 scenarios over the
4.2.1 Drought Tolerance Based on the USDA data, ten species have high PV to drought (i.e. low drought tolerance;
Figure 15). There are nine species that have moderate PV to drought, while the other eight have
low PV to drought. Collectively, 19 species have moderate to high PV to drought. Six out of
seven coniferous species had moderate or higher drought tolerance, white spruce (Picea glauca)
was the exception. Out of the seven non-native species examined, only Norway maple and
honey locust have a low PV to drought. However, none of the non-native species analyzed have
high drought vulnerability as compared to ten native species that have high drought
vulnerability.
Based on the City of Toronto (2012) and City of Guelph (2017) municipal reports, Manitoba
maple (Acer negundo), American beech (Fagus grandifolia), sugar maple (Acer saccharum),
quaking aspen and tamarack, all of which are native species, are considered susceptible to
drought (Figure 15). Most native species are considered more drought tolerant and require less
watering than non-native species according to these reports. All non-native species analyzed
were included on this list. A few conflicts in the drought tolerance of species exist between the
reports and USDA data. Northern white cedar (Thuja occidentalis), red pine (Pinus resinosa),
tulip tree, American elm, red oak, downy serviceberry (Amelanchier arborea), American
basswood (Tilia americana), and silver maple were considered to be drought tolerant by the
Toronto and Guelph reports, but were considered intolerant to drought in the USDA database.
Manitoba maple and American beech were considered to be very drought tolerant in the USDA
data, but were not considered drought tolerant by the municipal reports. Sugar maple was not
considered drought tolerant by the reports, but had moderate drought tolerance in the USDA
data.
4.2.2 Moisture Use According to USDA data, only four species have high efficiency in removing and utilizing soil
moisture relative to other species in the same soil moisture region (Figure 15). Red maple (Acer
rubrum), American elm, red pine, and quaking aspen, are all species that have high capacity to
remove soil moisture. Most species considered in this study (19) have a moderate ability to use
soil moisture, while staghorn sumac, white mulberry (Morus alba), northern hackberry (Celtis
occidentalis), and honey locust having low moisture use abilities. Six out of seven coniferous
47
species have a moderate ability to use moisture, while 12 out of 20 deciduous species have
moderate moisture use capabilities. Some conflicts in moisture use and the USDA drought
tolerance data do exist. Species such as northern hackberry, honey locust, and staghorn sumac
have low PV to drought, but low ability to use moisture. Red pine, American elm, and quaking
aspen have high PV to drought, but high ability to use moisture. Moisture use shows no distinct
pattern between natives and non-natives, and is likely related to species-specific physiological
factors.
4.2.3 Ice storm Susceptibility Ice storm susceptibility is dependent on species’ physical structure, growth rate, age, flexibility,
previous damage and wounding (Hauer et al 2006). Scots pine (Pinus sylvestris) and American
elm have the highest PV to ice storms, while there is a close split of moderate (11) and low (12)
PV to ice storms (Figure 15). Staghorn sumac and white mulberry did not have available data,
but considering that they are smaller understory tree species, they would likely have lower
susceptibility to ice storms or minimal damage to their canopy.
4.2.4 Cumulative Vulnerability Cumulative potential vulnerability scores were derived from summing scores given in each
climate tolerance category for each individual species. Scores range from 0 to 13 for most
species, except staghorn sumac and white mulberry which range from 0 to 11 due to lack of ice
storm data. A higher score suggests a higher cumulative PV in relation to chosen climate-related
categories based on physiological traits and current habitat range. The cumulative PVs indicate
that 22 species have a moderate to high PV overall (Figure 15). Fourteen out of 27 species have
a moderate cumulative PV, meaning many species may be able to survive in projected
conditions, but could require human intervention for initial establishment and/or long-term
survival. No coniferous species present on this list has a cumulative score lower than a six.
Twenty-five species have a high PV in at least one category; the exceptions are red maple and
white oak. Honey locust, red maple, and white oak have the lowest cumulative PV score (three)
out of all examined species. No distinct relationship was present within cumulative
vulnerabilities between non-native and native species; many of the frequently planted non-
native trees (e.g. Norway maple) have moderate cumulative PV.
48
4.3 Regional Vulnerability Regional vulnerability of the City of Mississauga’s urban forest was assessed using the species
vulnerability matrix and a tree sample conducted in 2008 (TRCA 2011b). This section details
the frequency of vulnerable species in the northern (1), mid (2), and southern (3) regions of
Mississauga, as well as the number of species in each cumulative vulnerability score. This
analysis highlights the regional patterns of vulnerability and which parts of the urban canopy
may be at the most risk. Figure 3 shows tree sample plots and outlined regions for this study.
Dominant species in region 1, region 2, and region 3, are sugar maple, staghorn sumac and
northern white cedar, respectively. It is important to note that within the tree sample that
staghorn sumac represents approximately 50% of the sampled population in region 2 (Rhus
hirta). Also, while red oak was part of the chosen species list, it was not present within the tree
sample and is underrepresented in the results of this part of the study. Specific abundances for
each species in each region can be found in Appendix D.
49
Figure 15. Vulnerability matrix for City of Mississauga detailing 6 climate tolerance categories and cumulative vulnerability values
of commonly planted native and non-native species. Green/0 refers to a low potential vulnerability (PV) score; yellow/1 refers to a
moderate or non-lethal PV; red/2 refers to a severe or possibly lethal PV.
50
4.3.0 Temperature-Related Vulnerability In most regions, more than half of the individuals within the tree sample have high PV to MAT
and MaxWT (Figure 16). Region 2 and 3 are particularly vulnerable to MAT and MaxWT,
while region 1 is vulnerable to MaxT. These results are not surprising as many of the analysed
species are highly vulnerable to MAT and MaxWT; there are very few low vulnerability species
in both categories. In terms of cold stratification, region 1 and 3 have high proportion of species
that require cold stratification. The dominant species in region 1 and 3 are sugar maple,
respectively.
Figure 16. Relative temperature-related vulnerability of trees within three regions of the City of
Mississauga.
21%
34%
45%
MAT- Region1
0
1
2
7%
48% 45%
MaxWT- Region1
0
1
2
20%
80%
CS- Region1
0
1
18%
12%
70%
MAT- Region21%
29%
70%
MaxWT- Region2
59%
41%
CS- Region2
24%
22% 54%
MAT- Region3
19%
81%
CS- Region3
27%
73%
MaxWT- Region3
20%
20% 60%
MAT- Total2%
34%
64%
MaxWT- Total
39%
61%
CS- Total
51
4.3.1 Drought Tolerance & Moisture Use Using USDA drought tolerance data (DT1), region 1 and 3 are abundant with trees that are
moderately or highly vulnerable to drought (Figure 17). Region 2 contains a high proportion of
highly drought tolerant trees. This is because of the large proportion staghorn sumac present in
region 2. Across all regions, half the trees in the sample have low drought tolerance. By City of
Toronto’s and Guelph’s standards (DT2), region 1 has the lowest proportion of trees used in
drought tolerant landscaping, however majority of species in all regions are considered drought
tolerant. Region 2 has a high proportion of species with low ability to use moisture, while other
regions have moderate moisture use abilities. Majority of trees have moderate moisture use
capabilities.
Figure 17. Drought (DT1 & DT2) and moisture use (MU) vulnerabilities of trees within three
regions of the City of Mississauga.
37%
52%
11%
DT1- Region1
0
1
259%
41%
DT2- Region1
0
1
2
8%
84%
8%
MU- Region1
0
1
2
70%
15%
15%
DT1- Region2
80%
20%
DT2- Region25%
38% 57%
MU- Region2
24%
22% 54%
DT1- Region3
80%
20%
DT2- Region3
16%
77%
7%
MU- Region3
50%
26%
24%
DT1- Total
75%
25%
DT2- Total
9%
59%
32%
MU- Total
52
4.3.2 Ice storm Susceptibility Region 1 and 2 have a higher proportion of species with moderate vulnerability to ice storms,
but approximately half of the trees in all regions have low vulnerability to ice storms (Figure
18). There exist a very low proportions of species with high PV to ice storms within the tree
sample.
Figure 18. Ice storm susceptibility (ICS) of trees within three regions of City of Mississauga.
43%
54%
3% ICS- Region1
0
1
2
45%
47%
8% ICS- Region2
60% 30%
10% ICS- Region3
49% 44%
7% ICS- Total
53
4.3.3 Cumulative Potential Vulnerability In terms of cumulative vulnerability, all regions have a relatively high amount of trees with
moderate vulnerability scores of six, seven, and eight (Figure 19; Figure 20; Figure 21; Figure
22).
Figure 19. Frequency of individual trees in each cumulative potential vulnerability score within
region 1.
Figure 20. Frequency of individual trees in each cumulative potential vulnerability score within
region 2. Staghorn sumac represents 50% of species in region 2 (*).
0
10
20
30
40
50
60
70
0 1 2 3 4 5 6 7 8 9 10 11
Tree
freq
uenc
y
Cumulative PV
0
50
100
150
200
250
0 1 2 3 4 5 6 7 8 9 10 11
Tree
freq
uenc
y
Cumulative PV
*
54
Figure 21. Frequency of individual trees in each cumulative potential vulnerability score within
region 3.
Figure 22. Frequency of individual trees in each cumulative potential vulnerability score within
all regions.
0
10
20
30
40
50
60
70
0 1 2 3 4 5 6 7 8 9 10 11
Tree
freq
uenc
y
Cumulative PV
0
10
20
30
40
50
60
70
0 1 2 3 4 5 6 7 8 9 10 11
Tree
freq
uenc
y
Cumulative PV
55
4.4 Interviews Interviews were conducted with seven urban forest professionals working in the City of
Mississauga, including practising arborists and municipal employees. The following sections
describe participants experiences and challenges with urban forest management, recent trends in
climate, changes in species composition over time, and their judgement of the vulnerability
matrix.
4.4.0 Perceptions of Recent Trends in Climate and Weather
Events All participants mentioned that they had noticed changes in climate over the time period they
had worked and/or lived in the area. In general, they mentioned or alluded to noticing hotter,
drier, and longer summers; warmer and shorter winters; longer growing seasons accompanied
often by phenological changes in species; more frequent and intense extreme weather events;
and greater variability and fluctuations in weather patterns. All participants mentioned they
agreed with the results of the climate models used in this study. Most of the statements from
participants on climate conditions were in line with modeled changes of future climate.
Participants described various types of extreme weather events they have noticed, including but
not limited to an increasing number and intensity of ice storms, wind storms, droughts over
time, as well as the potential for tornadoes to track up into Ontario given the northward shifts in
climate zones. Some participants referred to 100-year storms, and even 200-year storms,
becoming more common in the past decades. One participant mentioned that ice storms should
be considered with greater priority because they may become more frequent. His explanation
was that the “boundary between warm and cold seems to be moving towards the Mississauga
region”, clarifying that the moisture laden air from the south coming to meet the northern cold
air would freeze on trees and cause “devastating” damage. Multiple participants stated that ice
storms have become more common in southern Ontario.
Participants mentioned how gradual seasonal changes have been replaced by less gradual and
more fluctuating seasonal changes. One participant specified that patterns of weather have
become unpredictable from the regular pattern of wet spring, summer, wet fall, and winter,
56
stating that “moisture and heat are now appearing at different times less predictably”. Another
participant mentioned that there is “almost no spring and fall seasons”. The fluctuations were
also linked to phenological shifts in species, such as earlier budding and leaf flushes. One
arborist suggested that native species that rely mainly on light, as opposed to temperature, for
their phenological rhythms will be more vulnerable to shifting conditions, also stating some
non-native species may not be as vulnerable in this sense. Multiple participants mentioned warm
swings in spring were resulting in earlier leaf flushes that were often followed by cold spells,
killing the forming buds, stressing trees, and frequently driving younger trees to mortality. One
participant stated that “if you have warm winters over a decade and decide to bring in more
Carolinian species, then if you have -40 in some years, those species will die”. This suggest that
these types of extremes within seasons would be very stressful particularly for more southern
Carolinian species that grow in warmer climate ranges.
Precipitation was seen to be more flashy and variable today than in the past in the experience of
participants. Unpredictable flashy winter precipitation as rain was noted to erode top soil layers
due to added water not being able to percolate into the frozen, thus less-absorbent, soil. Multiple
participants suggested that the amount of snow and time period of snow cover has been
decreasing, referring to warmer winters being the primary cause of this phenomenon. One
participant suggested that given the unusually high amount of precipitation as rain this winter
(2016), Southern Ontario will have much drier conditions in the coming summer (2017) due to
the lack of water in the groundwater table.
Summers were also seen to be longer, hotter, and drier with the increasing temperatures
resulting in drought stress, the dropping of leaves, and scorch damage in trees. The rising
temperatures has been creating longer growing seasons in participants’ experiences. One
participant stated that “fall-time leaf collection was originally in September, but is now
occurring in October and even into November some years”. Wind patterns were also noted to be
at higher velocities and more turbulent than before. This was said to result in tree tipping when
combined with water-saturated soils.
57
4.4.1 Species Composition Participants were in agreement that there was a significant lack of diversity in plantings in the
past 60 years and a heavy reliance on one or two species for canopy cover (i.e. elms and ashes).
The canopy suffered heavy losses when the planted monocultures were subject to disease and
pests. Older tree planting lists considered species of lindens, locusts, Norway maple, Austrian
pine, and blue spruce for heavy plantings. Many of these species are abundant within the tree
sample. Over the past 60 years, learning from these mistakes and heavy losses, more diverse
species were chosen and prioritized by municipalities. Hence, five to seven different species per
street are now considered for planting. These are also mixed in with perennials and shrubs for
greater diversity and soil health. Municipal urban foresters are also shifting towards prioritizing
more native species when planting, where site conditions allow, by “planting more diverse
pallets” and “changing the patterns and locations of species”. Participants stated that the species
list chosen for this study was representative of the current urban forest composition based on
their experience.
4.4.2 Vulnerability Matrix Participants independently stated that the species vulnerability matrix was generally
representative in its scoring of the different climate tolerances for each species. A few
participants expressed some minor differences in species selection preference and their climate
tolerances. For example, one participant was surprised by tulip tree’s lack of heat sensitivity
given that it is a woodland species that likes moist environments. Another participant pointed
out that sugar maple may be more vulnerable than the matrix suggests. One participant
suggested that there would be an eventual reduction of coniferous species, especially long-lived
ones because they won’t thrive in the warmer climate. While the vulnerability matrix suggested
similar ideas, most participants saw the coniferous species present on the species list to be hardy
to drought and heat conditions.
Finally, participants pointed out that the vulnerability matrix may change over time due to
species adaptation. They suggested that species vulnerability is affected by how “plastic”.
"competitively fit”, and adaptable a species is to change, some species being more plastic and
vigorous than others over time. Species were seen to adapt better to gradual shifts in climate,
58
rather than multiple acute stressors over consecutive years, and that older established trees are
better able to adapt than younger individuals.
4.4.3 Urban Forest Management All participants suggested to some degree that urbanization was their biggest challenge when
managing the urban forest. Under the term urbanization were physical factors such as low soil
quality and volume, soil compaction and erosion, lack of water penetration in urban soils,
anthropogenic pollution, urban intensification, lack of growing space, isolation of individual
trees (e.g. planters), as well as social issues such as lack of protection during development, low
prioritization of green infrastructure, limited reach and resources of municipalities, and lack of
resident education on maintenance and planting. Many, if not all these factors were seen to be
mainly anthropogenic.
Pruning was suggested as another key challenge because it causes (intentional) damage to trees
opening them up to decay and pests. This is a risk for species such as basswood that do not
compartmentalize wounds well. Pruning methods seemed to be a point of debate within the for
some participants and was dependent on individuals’ preferences. Some participants felt that
pruning “makes individual less fit” and “causes [tree] failure”. One participant suggesting that it
is “overdone” by practitioners, even though pruning is considered to be a standard practise in the
industry. Other challenges mentioned were unpredictable weather and climate, disease and
pests, invasive species, lack of diverse species available at nurseries, as well as an overall
shortage of tree stock.
Participants suggested that climate change was not a top priority when managing urban forest
species, but still part of their management process. A list of factors considered by participants
when managing urban forests is shown in Table 8. Limiting site factors and social concerns
were seen to be of greater priority because these were factors that participants “could control”.
One participant suggested that he has the ability to give a particular tree the “best competitive
advantage” by mimicking conditions in its natural environment and using management
techniques such as mulching, but could not ultimately control climate conditions. This
participant also suggested that trees are now growing in isolation as opposed to in communities
unlike in their natural environment and this is exacerbating stressors. Many participants add
59
organic content into the soil using compost or specific soil mixes when planting to increase
chances of establishment and survival. Apparently, this procedure is a common practise in urban
areas due to degraded soils.
Table 8. Factors considered when managing urban forest species.
Trees Hardiness zones (i.e. climate) Mature tree size Tree hardiness Growth rate Native vs. Non-native Root structure Soil factors Species compatibility Quantity/volume Quality Compaction Soil pH Erosion Organic matter content Composition (i.e. clay, silt, sand) Microclimates Wind direction Light exposure Salt exposure Urban heat islands Social Resident needs and opinions Messiness Public safety Willingness to have a tree Use of site by public Aesthetics Site-specific Accessibility for maintenance Major roadways Visibility Available space
When climate change was considered, participants would address it by selecting more southern
Carolinian species or hardy non-natives when site factors and nursery stocks would allow.
Species such as Ohio buckeye (Aesculus glabra), Kentucky coffeetree (Gymnocladus dioicus),
swamp white oak (Quercus bicolor), eastern red buds (Cercis canadensis), tulip tree, lindens
(Tilia spp.), among others were considered for current planting. These species were mentioned
to not be viable for planting in the past 30-40 years because climate conditions were not
conducive to their survival. However, the current climate was considered viable for the survival
of these species. Only one participant went into detail about the consideration of long
timeframes for tree assessment in regards to climate change, and how that would impact safety
for both the tree and surrounding infrastructure. He stated an example about how tulip trees, a
Carolinian species, planted in Washington DC were highly susceptible to microbursts. He stated
60
there is potential that “microbursts and tornadoes may become more common as the tornado
alley zone moves north”. Therefore, he is hesitant to plant many tulip trees even though they are
considered a “survivor” in urban contexts. Some participants mentioned that future management
should involve planting species that can survive both extremes of hot and cold conditions if
extremes are becoming more likely. Specific species were not suggested.
An issue was raised by some participants about nurseries not having the appropriate stock in
recent years. Nursery stock was seen to limit what participants were able to plant, thus limiting
the species diversity in the urban canopy. A participant suggested that nurseries had long
turnover times for being able to produce tree stocks and that issues would occur when trees went
unsold after years of nursing due to change in planting preferences. One participant expressed
that this problem was currently being addressed by municipal governments and nurseries
meeting to collaborate on the issue.
Several participants noted that the large area of hard, impervious surfaces is resulting in
amplification of urban heat islands, as well as intensifying the effects of climate change. One
arborist stated that disease and pests have caused larger problems than climate change so far, but
also noted that climate change ultimately would increase pest survival. Multiple participants
stated that urban tree mortality could increase as climate change intensifies with some species
already seeing a decrease in that lifespan. This was stated in the context that one participant
believed that tree species survive only 20-30 years in urban spaces due to lack of suitable
conditions.
A majority of participants stated that native species, while highly recommended in municipal
planning documents, are not always preferred for planting. In participants’ experiences, many
non-native species were better able to handle urban conditions especially along streets, while
natives were generally more susceptible to the low quality conditions present in urban areas.
Specifically, sugar maple was avoided by many practitioners for planting. While non-native
species like honey locust, Norway maple, and Norway spruce were preferred by a majority of
participants (Table 9). When asked why non-native species were preferred, participants often
used words such as “hardy”, “genetically fit”, “high vigor”, “more adaptable”, “survivor”, and
“more plastic” to describe these species. However, there were some native species considered to
61
be hardy in urban conditions such as red maple, silver maple, Northern hackberry, white
mulberry, and red pine.
Participants have differing opinions on which species are preferred for planting or considered
resilient in their work, as well as various reasons as to why they preferred or avoided those
species (Table 9). From here on, the idea of preference also implies that the chosen species was
also considered resilient in urban areas by practitioners. Practitioners were congruent on
avoiding sugar maple, seeing it as a non-resilient species, and had a clear preference for honey
locust as an urban tolerant species. However, many responses were contradictory, such as one
participant stating that basswood was extremely hardy in urban settings, while another said that
it was often prone to decay in these locations. Sixteen out of 27 species received more
contradictory responses to open-ended questions about which species are preferred for planting
or not.
Table 9. Participant responses of their planting preferences and reasoning.
When planting preferences are compared to the vulnerability matrix, there is both agreement and
discrepancy as to what the matrix shows for future potential vulnerability and what practitioners
prefer for planting. In terms of agreements, honey locust, silver maple, northern hackberry,
white mulberry, and downy serviceberry have relatively low cumulative PVs and are preferred
for planting. In terms of discrepancies, Norway maple and Norway spruce are preferred by
Nativity Tree species Scientific name Prefered Not prefered Sum Reason for preference Reason for avoidanceY Sugar maple Acer saccharum 0 4 -4 Lack of hardiness in urban env.Y Tamarack Larix laricina 0 2 -2 Heat intolerantY Tulip tree Liriodendron tulipifera 1 3 -2 Not many disease/pests
Woodland species, wind susceptible
N Austrian pine Pinus nigra 1 3 -2 Hardy in urban Disease (Diplodia)N Scot's pine Pinus sylvestris 1 2 -1Y American beech Fagus grandifolia 2 2 0 In more naturalized areas Disease and stressY White spruce Picea glauca 1 1 0
Susceptible soil and sun changes
Y Eastern white pine Pinus strobus 2 2 0 Diversity Loss of white pines recentlyY Manitoba Maple Acer negundo 2 1 1 Hardy in urban InvasiveY Quaking aspen Populus tremuloides 2 1 1 Provides shade, fast growingY White oak Quercus alba 2 1 1 Shoe string root rotY Bur oak Quercus macrocarpa 3 2 1 Hardy, diversityY Red oak Quercus rubra 2 1 1 DiseaseY Staghorn Sumac Rhus hirta 1 0 1Y Northern white cedar Thuja occidentalis 2 1 1 Better for hedges Heat and drought susceptibleY American basswood Tilia americana 2 1 1 Hardy in urban Decay susceptibleY American elm Ulmus americana 2 1 1
Hardy in urban, some resistant varieties Dutch elm disease
N Blue spruce Picea pungens 3 2 1Y Red maple Acer rubrum 2 0 2Y Downy serviceberry Amelanchier arborea 2 0 2 Diversity Susceptible to diseasesY Red pine Pinus resinosa 3 0 3N White mulberry Morus alba 3 0 3Y Silver maple Acer saccharinum 4 0 4 Disease tolerantY Northern hackberry Celtis occidentalis 4 0 4 Hardy in urban areasN Norway maple Acer platanoides 5 1 4 Hardy in urban Very invasive, fail in ice stormsN Norway spruce Picea abies 5 0 5
Disease resistant, Drought/heat resistant
N Honey locust Gleditsia triacanthos 6 0 6 Very hardy, urban tolerant
Count Reasoning
62
many for planting, but have a moderate cumulative PV. White oak has a very low cumulative
vulnerability, but was not highly preferred for planting mainly due to issues with shoestring root
rot. Some participants did not even mention their (lack of) preference for white oak. Bur oak
also has a low cumulative PV, but has contradicting views in terms of overall preference among
practitioners. Red pine has a high cumulative PV, but is preferred by practitioners. Non-natives
received more preference and less opposition than native species, even though the vulnerability
matrix shows no specific pattern when considering cumulative vulnerability.
Finally, some participants mentioned that they had limited reach relative to private landowners
where a majority of the urban canopy resides. Educating homeowners on proper planting and
maintenance practises were seen as important actions towards growing a healthy urban canopy.
As one participant noted, home owners would often overwater or improperly mulch trees on
their property leading to death of that tree. Addressing these issues could effectively increase
urban tree survival and growth.
63
Chapter 5
Discussion
5.0 Introduction This study highlights the cumulative impact climate change may have on the urban forest within
the City of Mississauga. In general, summers are expected to become hotter, drier and longer;
while winters are expected to become warmer, wetter, and shorter; and extreme weather events
are expected to increase. Urban trees, particularly coniferous species, are projected to be most
vulnerable to increasing average and extreme temperatures; lack of water availability in hotter
months could be highly detrimental in the future; the cumulative impacts of stressors must be
considered in urban forest management; non-native species showed no difference in overall
vulnerability as compared to native species; and finally, while climate change is considered in
urban forest management, factors such as site conditions and social needs are greater priorities
for urban forest managers.
5.1 Temperature Most of the commonly planted species chosen for this study had moderate or high PV to
temperature-related climate variables. Average (MAT) and extreme (MaxWT) temperatures are
projected to exceed the optimal distribution range within which the chosen species grow
competitively. Species that are out of their optimal temperature range could suffer heat damage
as the climate warms. Heat stress is known to cause leaf scorch and burns (e.g. cell damage) to
trees, and also reduces photosynthetic rates resulting in decreased growth rates and early leaf
senescence (Teskey et al 2015). Heat stress can be further exacerbated in urban areas,
particularly near dark surfaces such as asphalt, making the probability of heat-related damage to
trees more likely. Regionally this is a concern because a large proportion of species are
considered potentially vulnerable to increasing average and extreme temperatures.
In regards to climate projections, climatic extremes and variability (in temperature,
precipitation, etc.) are more important than changes in average conditions because they can
result in a greater degree of damage to ecosystems and infrastructure (Katz & Brown 1992).
Extremes may have less of an impact in areas where temperatures and moisture are optimal
relative to species’ tolerances, but in areas where conditions are closer to species’ physiological
64
limitations, climatic extremes can be much more stressful (Zimmermann et al 2009). In
Mississauga, if average temperatures rise close to species’ limits this could predispose many
species to stress, which can then be exacerbated by extremes. Taking into account that urban
heat islands further exacerbate the effects of both average and extreme temperatures is essential
for tree health and management.
Evergreen coniferous species are predicted to be more vulnerable to average and extreme
temperatures than broadleaf deciduous species. In contrast, multiple urban forest professionals
interviewed considered coniferous species to be more tolerant of heat and drought stress in their
experiences. It is unclear in the literature whether conifers have greater adaptive capacity to heat
stress. When exposed to heat wave conditions, loblolly pine (Pinus taeda) seedlings were less
susceptible than red oak (Quercus rubra) seedlings, in part because because P. taeda has a less
vulnerable photosynthetic apparatus to heat effects (Ameye et al 2012; Bauweraerts et al 2014).
However, a study using a multi-method climate change vulnerability assessment to measure the
vulnerability of forest species to climate change across the US Mid-West showed that conifer-
dominated forests tend to have higher vulnerability ratings than oak-dominated forests (Brandt
2014). Conifer-dominated forests were considered to be more vulnerable in this analysis
because these ecosystems were adapted to high elevation or colder, northern climates (Brandt
2014).
It is possible this coniferous vulnerability result is a limitation of using climate envelopes for
vulnerability studies. Climate envelopes do not illustrate the full possible range of
environmental conditions a species can survive (i.e. fundamental niche), they only suggest a
spatial range within which the species is currently distributed (i.e. realized niche) (Brandt et al
2017; McKenney et al 2007b). Additionally, studies suggest that maximum temperature alone is
a weak factor for defining plant distribution ranges (Woodward 1987; Zimmermann et al 2009).
Tree species are more likely to be limited by faster-growing competition at their most southern
range limits, where climate conditions are more favourable for the growth of a broader range of
species (Brown et al 1996; Loehle 1998). If resources are abundant, conifers may be able to
survive in urban areas where trees have little interspecific competition and are maintained by
humans. Boreal coniferous species have shown to grow in southern states (Loehle 1998; Yang
2009) meaning these species would likely survive in the projected warmer climate of City of
Mississauga. Although, with warming climate, northern species that require cold stratification
65
may not be able to naturally regenerate in remnant forest patches that are present throughout
Mississauga. Other species that are not inhibited by cold stratification requirements would likely
take their place resulting in a composition shift in semi-natural forests near ravines and on
conservation lands within the municipalities boundaries.
Results predict that deciduous species, could fare better over the next century as (winter)
temperatures increase and growing seasons expand in Mississauga, if moisture, nutrients, and
other factors are not limiting growth (Colombo 2008; Loehle 1998). Specifically more southern
species such as American basswood (Tilia americana) and honey locust (Gleditsia triacanthos)
may thrive. This is in line with the movement of many species’ climate envelopes northward in
North America (Goldblum & Rigg 2005; McKenney et al 2007b). The northern limits of these
species are controlled by extreme minimum temperatures, growing season length, phenology,
and frost resistance (Charrier et al 2015; Jennerette et al 2016), but it is possible that as
temperatures warm these factors could be less limiting to the growth of deciduous species.
However, as participants noted, survival of all trees in Mississauga will likely be affected by the
increasing variability in climate. Specifically late-spring frosts were mentioned as a highly
detrimental climatic event to the urban forest canopy. Late-spring freezing can often result in
bud and leaf damage, and tree mortality if damage is severe, especially in younger trees
(Cannell 2012; Charrier et al 2015; Loehle 1998). The range of climate extremes could pose a
serious species selection problem for urban forest managers trying to balance environmental
conditions while maintaining urban canopy.
5.2 Water Availability Plant distribution is dependent on many other factors besides temperature. Other factors such as
precipitation, phenology, soil conditions, growing season length also have impacts on plant
distribution (Brown et al 1996; Mathys et al 2014). Changes in spatial and temporal patterns of
water can have substantial impacts on species distribution and performance (Mathys et al 2014;
Weltzin et al 2003). Precipitation in Mississauga is projected to increase in colder months and
remain relatively stable in warmer months over the next century. To make a meaningful
conclusion about water stress, this information needs to be addressed in conjunction with the
projected increasing temperatures, decreasing CMI over time from May to October, and
extending growing season. Together, these results suggest a very different precipitation regime
66
than historic patterns. In these climate scenarios, summers would become drier over time
moving to a more grassland-like climate, with likely less precipitation as snow in the winter, and
shorter winters overall. Interview participants confirmed that these changes are already
occurring. A climate change study conducted for the City of Toronto, located adjacent to the
City of Mississauga, also projected similar conditions in 2050 (SENES 2011). Additionally, the
study suggested that rain events would become less frequent but more intense, a recent trend
also identified by interviewed participants (SENES 2011).
Water availability in these conditions for urban trees could be very unstable, presenting issues of
too little water (i.e. drought) or too much water (i.e. flooding) at different times of the year.
Urban environments are particularly susceptible to drought and flooding due to the high amount
of dark impervious surfaces. While short periods of flooding are less of a concern, extended
flooding could lead to greater tree stress, and mortality if prolonged flooding occurs (Bratkovich
et al 1993). Decreased precipitation as snow, or rapid melting following a snow storm could
make flooding more frequent annually over the next century (Brandt et al 2017). Some
participants mentioned that winter rain events while the soil is frozen could lead to runoff and
reduced water availability in summers. It is possible shifts in snowcover, soil frost, and freeze-
thaw regimes could lead to reduced water availability in spring and summer (Brandt et al 2017).
Trees are known to be susceptible to winter soil water recharge regimes depending on the
patterns present in their native habitats (Lévesque et al 2014). However, there is limited research
available on the complex relationship between these factors and tree health.
Hotter and drier climates will have substantial impacts on urban species (Fahey et al 2013).
Large portions of the canopy are vulnerable to drought and generally only have moderate
abilities to use water efficiently. If climate moves towards a more grassland-like habitat over the
next century, many trees will be vulnerable to hydraulic failure and carbon starvation, if they are
not provided with adequate watering (McDowell et al 2008). It is important to note that moisture
availability has a stronger impact on tree stress and mortality than heat stress, but warmer
temperatures can exacerbate the impacts of moisture deficits (Bauweraerts et al 2014;
McDowell et al 2008).
Finally, historic CMI had large variations in all months over a 30-year period. While CMI
averages are projected to decrease, monthly CMI could greatly fluctuate over future years,
67
meaning that future moisture deficits could be much more or much less severe over time than is
suggested by climate model averages. The extent of drought-based mortality is known to depend
on duration, frequency, intensity, timing, and the spatial extent of drought, as well as an
individual species’ phenology, site conditions, and ability to acclimate to conditions (Brandt et
al 2017; Fahey et al 2013; Maherali et al 2004; McDowell et al 2008, Xie et al 2015). IPCC
reports predict that droughts will increase in frequency and intensity over the next century
(IPCC 2013). Allen et al (2010) show these trends are already occurring in North America and
leading to wide-spread tree mortality in natural forests, so it is reasonable to assume that
variation may lean towards greater drought-like conditions in urban forests when assessed in
conjunction with IPCC reports and previous literature (IPCC 2014).
5.3 Ice Storms In Mississauga, there are very few species that are highly vulnerable to ice storms both within
the matrix and regionally. Although, a high proportion of species have moderate vulnerability to
ice storms. Trees that are moderately vulnerable are more likely to incur non-lethal structural
damage than trees that have low vulnerability. A likely scenario is that damage would weaken
moderately vulnerable species and eventually lead to mortality if exposed to other stressors such
as disease and future storms (Forest Ontario 2014). While a high proportion of species
regionally in Mississauga have low potential vulnerability scores to ice storms, this does not
mean that these species are entirely invulnerable.
The overall impacts of ice storms on the urban canopy are dependent on storm duration,
intensity of winds, and ice accumulation, in addition to individual tree life history and structure
(Hauer et al 2006; Irland 2000; Smith 2015). Factors that predispose trees to ice storm damage
include weak branch junctions, pre-existing dead branches, previous wounding and stress,
unstable root structure, and large unhealthy tree crowns (Hauer et al 2006; Smith 2015).
Additionally, tree species is a better indicator of whether a tree will recover from an ice storm
than age or size (Luley & Bond 2006). In this respect, the individual life history and structure in
combination with knowing a species particular vulnerability can help improve identification of
trees that will be most vulnerable to ice storms than either factor alone. Preventative actions
such as pruning or taking down the tree can be done before storm events occur once an
68
unhealthy tree is identified. This can not only help to maintain the health of the urban forest, but
can also avoid costly damage to infrastructure caused by damaged or tipped trees.
5.4 Cumulative Impacts Cumulative potential vulnerability (CPV) in this study showed that most species had high PV to
at least one climate tolerance category, and most species analyzed in this study had moderate or
higher CPV. Regionally, a high proportion of moderately vulnerable species exist within the
canopy. Research by Brandt et al (2017) assessing the climate vulnerability of Chicago’s urban
forest also showed that a high proportion of species had moderate or higher vulnerability
overall. This is reasonable considering that rather than single stress events, urban forests will
likely face multiple climate shifts and stressors throughout future years that may have
interacting impacts. As previously mentioned, ice storm damage can be more severe for
unhealthy trees that have suffered previous injuries or stress. Water availability strongly
influences the effects of heat stress on tree mortality (Bauweraerts et al 2014; Teskey et al
2015). Also, extended growing seasons could potentially exacerbate water stress, especially in a
warmer climate (Brandt et al 2017; McDowell et al 2008).
Other examples of interacting impacts are the ways drought and ice storms can cause trees to be
more vulnerable to secondary effects of insects, pests, and disease (Fahey et al 2013; Hauer et al
2006); prolonged warm and wet periods can also facilitate transmission of emerging disease
(Woods et al 2005); heat events can cause earlier budburst depending on the species (Teskey et
al 2014); and frost events, heat stress, rainfall patterns, and drought stress can lead to later fall
dormancy in deciduous forest communities, but can also lead to earlier dormancy as well (Xie et
al 2015). Spatial and temporal patterns also play a large role in how stressors impact species.
Site conditions, such as soil characteristics and land-use, play a role in drought tolerance and
species survival (Fahey et al 2013; Mathys et al 2014). Trees that are native to mesic habitats are
less affected by water availability previous to the growing season (i.e. summer) (Hanson &
Weltzin 2000; Lévesque et al 2013). Lagged responses in trees to droughts and ice storms can
occur years after the events (Bigler et al 2007; Hauer et al 2006).
In the City of Mississauga, one possibility is that over time many trees will be cumulatively
weakened by heat, drought, and extreme weather events, in addition to various other urban
69
stressors that are present. If trees are not killed by the immediate impacts of stress, these
changes would then act as the catalyst for further damage and stress by other contributing
factors such as pests and disease, eventually leading to tree mortality and possibly large
reductions in the urban canopy. Overall, the net effects of multiple stressors are complex to
predict and largely unknown because they can have opposing, compounding, or unknown
outcomes, in addition to being species and site-specific (Allen et al 2010; Fahey et al 2013).
Mechanisms of how drought and other stressors affect tree survival are still poorly understood
across various research fields (Allen et al 2010). Thus, while this study has explored the effects
of climate change on species, cumulative effects represents a knowledge gap within the
literature that has yet to be fully addressed.
5.5 Native vs. Non-native Species The results of this analysis were surprising in that no clear difference was found between natives
and non-native trees overall. However, multiple interview participants showed strong preference
for non-native species because they considered them requiring as less maintenance and also as
more resilient in urban environments based on their past experiences. It is likely that because
only a few variables were used in this climate vulnerability assessment, the analysis was not
comprehensive enough to show a definitive relationship between native and non-native species.
Brandt et al (2017) conducted a more comprehensive climate change vulnerability assessment
using a larger dataset and including variables such as adaptive capacity in their analysis. They
show that that 77 percent of trees that have low vulnerability scores in Chicago’s urban forest
are (non-native) invasive species, a more defined relationship than this studies’ results.
Native species are important because they help to maintain balanced ecosystem dynamics in
their respective regions (Bassuk & Sutton 2012; McKinney 2002). Restoring native plant
species can increase the species richness of native animal populations (Sears & Anderson 1991).
There is some anecdotal evidence to suggest that native species had less damage than non-native
species during the 2013 ice storm that occurred in Southern Ontario (Cary 2014). Other
evidence leans in favour of non-native species. Some studies suggest that non-native species can
be more resilient, and even restorative in certain environments. In Puerto Rico, non-native
species were able to colonize eroded soils that were once pasture, while native species in the
area could not (Lugo 1997; Rodriguez 2006). Non-natives have also shown to provide suitable
70
habitat for native species years after non-native colonization, whereas only one native species
was able to colonize the degraded areas in control plots (Parrotta 1999). In the United States,
studies found that there was a strong positive correlation found between abundance of non-
native berry trees and abundance of birds, and that non-native berry trees acted as signal for
food availability that then enhanced the seed dispersal of native species present in non-native
dominated forests (Davis 2011).
A report from the Oregon Department of Forestry states that native trees from their region can
often not survive urban conditions as they are adapted to swampy environments that were
existent historically (Ramstad & Orlando 2009). The report suggests that homeowners should
consider site conditions and the environmental context when choosing between natives and non-
native trees in urban areas. These consideration were also emphasized by interview participants.
It is possible that definitions of native and non-native species will have to be redefined as
climate change leads to shifts in plant distributions, especially if changes are drastic. If species
currently native to a region cannot survive in future climate and site conditions, compromises
will have to be made to introduce non-native species that can integrate into the urban canopy
and maintain ecosystem services (Bassuk & Sutton 2012; Ste-Marie 2011). Although, cultivars
of native species also present a possible solution for urban forests in response to climate change.
For example, some nurseries within the United States have been working to breed more resilient
cultivars of native species that can withstand changing climate conditions. Species products
such as Redpointe® Maple and Emerald Sunshine® Elm have proven to be more resilient to wide
range of climate and growing conditions than their naturally occurring counterparts (Warren
2014).
5.6 Interviews and Management Recommendations Generally, conditions in urban areas tend to become harsher as resemblance of environmental
conditions diverges from a species natural habitat (Roloff 2013). While this is not a rule, it is a
suitable starting point to address the several issues that exist within urban areas, given that
climate change may exacerbate the spectrum of stressors. It is evident that site conditions such
as soil quality and volume, microclimates, public use, and various other factors can impact tree
health tremendously (Bassuk & Sutton 2012; Brune 2016;). In line with this research, all study
71
participants stated that the site conditions of an individual tree play an integral role in urban
forest management. So much so that urban forest managers considered it one of the top
priorities, above climate change, when planting. Participants’ reasoning was quite clear: if urban
trees do not have quality conditions in their immediate environment they will likely not survive
long enough to be exposed the effects of long-term climate change.
Many trees in urban environments that can make it past the first 3-5 year establishment period
generally only live to be 13-20 years old, then have to be replaced (Roman & Scatena 2011).
This is because the accumulation of stress tends to impact these species relatively early and
more intensely. Not only is this costly, but continual replanting doesn’t achieve the goal of
carbon sequestration that is often stated as an important role of urban forests to mitigate climate
change (Nowak et al 2002). As was suggested by one participant, resources should be placed
into planting smaller number of trees and maintaining them more intensively so they live longer.
This is a better strategy because larger, older trees sequester carbon at a much quicker rate than
smaller trees of the same species (Nowak et al 2002). Moreover, larger, mature trees provide a
higher of level ecosystem services overall than younger, smaller trees (Nowak et al 1990).
Water availability will be a key factor in the determining the long term survival of urban tree
species. The increasing impacts of drier, hotter, and longer summers can be abated if sufficient
water is made available for them. Withlow and Bassuk (1987) show that trees in locations with
city infrastructure can be less susceptible to droughts is they are well maintained and provided
with adequate soil water. Various techniques such as mulching and polyethylene bags can also
be used to keep moisture in the soil (City of Toronto 2012; City of Toronto 2013; Vogt et al
2015). However, these will have to be combined with consistent deep watering and maintenance
if droughts become more severe. In the long term, if urban water systems become limited, the
urban canopy may have to be gradually replaced with a completely different mixture of drought-
tolerant species and also use different planting practises (i.e. drought tolerant landscaping) if
climate moves towards a grassland-like habitat.
Species selection will be another key factor in the long term survival of species. One participant
clearly stated that given the variability in climate, newly planted species will need to be able to
handle both warm and cold, and wet and dry extremes. Species considered for future planting
need to be able to survive winter temperatures and potential frosts, as well as able to handle
72
hotter, drier summers. The vulnerability matrix suggests native species such as red maple and
white oak that have low CPV could be especially useful in these scenarios given that they have
high drought tolerance and can survive Ontario’s winters. However, it is possible that
fluctuating and extreme climatic conditions could narrow the selection of viable species, thus
species diversity of the urban canopy would decrease, especially if only native species are being
chosen for planting. Therefore, the process of bringing non-native species appropriate to the
future climate and site conditions into the urban canopy within the City of Mississauga may
have to be employed to maintain ecosystem services (Aitken & Whitlock 2013). In this scenario,
managers would have to be cautious of non-native species that have the potential to become
highly invasive in both urban and natural habitats (Bassuk & Sutton 2012). Alternatively, if the
appropriate cultivars can be bred to handle the changing climate, urban canopies may not
require as big of an adjustment (Warren 2014). However, a greater diversity of species may be
able to be planted as climate warms, if adequate amounts of water are made available.
Participants were also clear that their reach within the urban canopy is limited. A large
proportion of urban trees are located on private land, giving landowners a considerable amount
of control over the health and survival of a majority of the urban canopy (TRCA 2011a). One
example of this is that homeowners were stated to be “loving their trees to death” by either
inappropriately mulching or overwatering trees. Thus, homeowner education and involvement
was considered necessary for a healthy urban tree canopy. If homeowners are more involved
with the lifecycle of their trees and provide regular maintenance, then they can prolong the
benefits that the trees provide (Vogt et al 2015). This can bring homeowners financial savings in
the form of reduced energy use, and avoid costly infrastructural damage, especially in the event
of ice storms.
These factors mentioned all require thoughtful and consistent management through the life cycle
of a tree. If climate conditions are to change as projected, all stakeholders will have to play their
part in maintaining the urban forest canopy. Ultimately, species that are managed and watered
according to the needs of individual species will likely survive longer, maintaining benefits for
an extended period of time (Brune, 2016; Vogt et al 2015). If species cannot be managed
adequately on certain landscapes or locations, then hardy natives and cultivars, and even non-
native species may be the best options for urban landscapes (Bassuk & Sutton 2012). In the long
73
run, species from other regions may need to be considered if climatic conditions no longer allow
the survival of the species assemblages currently planted (Aitken & Whitlock 2013).
74
Chapter 6
Conclusion & Future Research
6.0 Conclusion In order to assess the vulnerability of commonly planted native and non-native species to
climate change, climate projections over the next century, climate envelopes and the species’
physiological characteristics were analyzed for common Mississauga tree species. Interviews
were also conducted with urban forest professionals such as arborists and city employees
working in the municipal urban forestry department.
In general, all commonly planted urban forest species are moderately vulnerable to at least one
aspect of the changing climate. Most species are predicted to be moderately or highly vulnerable
when all climate tolerance categories are summed. Many of the species analyzed are predicted
to be quite vulnerable, or out of their optimal distribution range, in regards to increasing
temperatures. More northern species like conifers may still be able to survive in warmer, drier
climates with adequate watering and management. Rainfall may become less frequent and more
intense over time putting urban species at risk of flooding. On the other hand, reduced water
availability in summers in conjunction with hotter temperatures could have substantial impacts
on all species, especially if droughts become severe or frequent. Ice storms may increase in the
future leaving individual species vulnerable in the long term if adequate management measures
are not taken to prevent structural damage. Preventative measure include tree pruning and taking
down unhealthy trees. Surprisingly, no relationship was found between the cumulative
vulnerability scores of native and non-native species. It is likely more variables need to be
assessed to examined whether native or non-natives may be more vulnerable.
Overall, urban forest managers agree that site conditions play a vital role in the survival of the
urban forest species more directly than climate change. This emphasized the need for providing
tree species with better quality conditions in urban environments if species survival is a priority.
In cases which species cannot be adequately managed, hardier species will have to be chosen for
harsh city environments. Finally, adequate management can only be achieved if all stakeholders,
particularly private landowners within the city, are involved and educated to the primary needs
of the urban forest.
75
6.1 Recommendations for Future Research Future research projects using climate change vulnerability assessment methodologies would
benefit from the following recommendations.
The climate models used for this study only considered bioclimatic variables as 30-year
averages. To extract more meaningful and accurate representation of future climate, it would be
worth projecting yearly and monthly values for temperature, precipitation, and other bioclimatic
variables if data is made available in the future. This would allow the analysis of year-to-year
variations and extremes in climate, as well as overall trends giving a clearer picture of potential
climate shifts. This type of data, however, is currently not available.
The tree sample used for this study provided a sufficient representation of the City of
Mississauga’s urban forest. However, the sample was quite small in comparison to the full
extent of the urban forest. Thus, some species were under represented, even though they were
part of recent municipal planting orders and potentially abundant in the current urban forest.
Additionally, tree health and species composition can change over time with the development of
urban areas and preference of landowners, respectively. A larger tree sample or full tree
inventory should be considered for future projects.
Future climate vulnerability assessments in the City of Mississauga should include local and
regional site and landscape characteristics such as, soil traits, microclimates, hydrology, land-
use categories, and if locations are maintained as part of their analysis. This can give a more
accurate picture of how trees may fare in particular locations and how distributions could
change over time. Urban forest managers could then refine the use of resources and more easily
assess areas that require more or less management, as well as choosing the appropriate species
for that location.
Acclimation and adaptation of species to particular environmental conditions can play important
roles in species survival. As participants said, the vulnerability matrix may look very different in
the future than it does now due to species adaptation. Assessing a species genetic potential to
adapt to certain conditions as well as reassessing this matrix in the next decade or so could be
appropriate measures for addressing these points. In addition, assessing the species’ current
76
adaptive capacity to a wide-range of urban and natural conditions would give a more
comprehensive picture of individual species vulnerability to climate. Cultivars should also be
included in future analyses because they can have very different tolerances to environmental
conditions that their natural counterparts.
Finally, future research needs to further consider the cumulative impacts of climate change,
rather than individual impacts alone. While assessing impacts of individual events can offer a
reasonable perspective of how trees may respond to changing conditions, the complex spatial
and temporal patterns of climate change and extreme weather events will ultimately determine
the mortality or survival of individual species uniquely.
77
References Adger, W. N. (2006). Vulnerability. Global Environmental Change, 16(3), 268–281. Adger, W. N., Brooks, N., Bentham, G., Agnew, M., & Eriksen, S. (2004). New indicators of
vulnerability and adaptive capacity. Tyndall Centre for Climate Research. Technical Report Number 7. Norwich, UK.
Aitken S. N., & Whitlock, M. C. (2013). Assisted gene flow to facilitate local adaptation to
climate change. Annual Review of Ecology, Evolution, and Systematics, 44, 367–388. Akbari, H. (2005). Energy saving potentials and air quality benefits of urban heat island
mitigation. Report LBNL–58285. Available at http://www.osti.gov/scitech//servlets/purl/860475-UlHWIq/
Alberti, M. (2005). The effects of urban patterns on ecosystem function. International Regional
Science Review. 28, 168-192. Almas, A. (2017). Commonly selected species for planting in Mississauga. Personal
communication. Ameye, M., Wertin, T. M., Bauweraerts, I., McGuire, M. A., Teskey, R. O., & Steppe, K.,
(2012). The effect of induced heat waves on Pinus taeda and Quercus rubra seedlings in ambient and elevated CO2 atmospheres. New Phytologist, 196, 448–461.
Anderson, J. T. (2016). Plant fitness in a rapidly changing world. New Phytologist, 210(1), 81–
87. Archetti, M., Richardson, A. D., O’Keefe, J., & Delpierre, N. (2013). Predicting climate change
impacts on the amount and duration of autumn colors in a New England forest. PLoS One, 8(3), e57373
Arnfield, A. J. (2003). Two decades of urban climate research: a review of turbulence,
exchanges of energy and water, and the urban heat island. International Journal of Climatology, 23, 1-26
Barber, V. A., Juday, G. P., & Finney, B. P. (2000). Reduced growth of Alaskan white spruce in
the twentieth century from temperature-induced drought stress. Nature, 405, 668–673. Bassuk, N., & Sutton, M. (2012). Moving beyond the native/exotics debate. Urban Habitats.
Retrieved from http://www.urbanhabitats.org/v07n01/nativesdebate_full.html
78
Bauweraerts, I., Ameye, M., Wertin, T. M., McGuire, M. A., Teskey, R. O., & Steppe, K.
(2014). Water availability is the decisive factor for the growth of two tree species in the occurrence of consecutive heat waves. Agricultural and Forest Meteorology, 189-190, 19–29.
Bigler, C., Gavin, D. G., Gunning, C., & Veblen, T. T. (2007). Drought induces lagged tree
mortality in a subalpine forest in the Rocky Mountains. Oikos, 116, 1983–1994. Brandt, L. (2014) Assessing Climate Change Vulnerability of Urban Forests and Natural
Ecosystems in the Midwest. Morton Arboretum. Brandt, L. A., Lewis, A. D., Scott, L., Darling, L., Fahey, R. T., et al. (2017). Chicago
wilderness region urban forest vulnerability assessment and synthesis: A report from the urban forestry climate change response framework Chicago wilderness pilot project. United States Forest Service. Chicago, Illinois.
and its effect on trees. Newtown Square, PA: U.S. Department of Agriculture, Forest Service, Northern Area State & Private Forestry. 58 p.
Brown, J. H., Stevens, G. C., & Kaufman, D. M. (1996). The geographic range: size, shape,
boundaries, and internal structure. Annual Review of Ecology and Systematics, 27(1), 597–623.
Brune, M. (2016). Urban trees under climate change: potential impacts of dry spells and heat
waves in three German regions in the 2050s. Report 24. Climate Service Center. Germany, Hamburg.
Burley, S., Robinson, S. L., & Lundholm, J. T. (2008). Post-hurricane vegetation recovery in an
urban forest. Landscape and Urban Planning, 85(2), 111–122. Caccianiga, M., & Payette, S. (2006). Recent advance of white spruce (Picea glauca) in the
coastal tundra of the eastern shore of Hudson Bay (Québec, Canada). Journal of Biogeography, 33(12), 2120–2135.
Cannell, M. G. R. (2012). Spring phenology of trees and frost avoidance. Weather, 52(2), 46-52. Cary, J. (2014). Ice storm retrospective – native trees are better at weathering the storm. Maple
Leaves Forever. Toronto, Ontario. Retrieved from http://www.mapleleavesforever.com/ice-storm-retrospective-native-trees-are-better-at-weathering-the-storm/
79
Charrier, G., Ngao, J., Saudreau, M., & Améglio, T. (2015). Effects of environmental factors and management practices on microclimate, winter physiology, and frost resistance in trees. Frontiers in Plant Science, 6, 259.
Chenchouni, H., Abdelkrim, S. B., Athmane, B., (2008). The deterioration of the Atlas
Cedar (Cedrus atlantica) in Algeria. Oral presentation at: International Conference ‘‘Adaptation of Forests and Forest Management to Changing Climate with Emphasis on Forest Health: A Review of Science, Policies, and Practices’’. Umea, Sweden: FAO/IUFRO, 25–28 August 2008.
Cheng, C. S., Auld, H., Li, G., Klaassen, J., & Li, Q. (2007). Possible impacts of climate change on freezing rain in south-central Canada using downscaled future climate scenarios. Natural Hazards and Earth System Science, 7(1), 71–87.
Christidis, N., Stott, P. A., Brown, S., Karoly, D. J., & Caesar, J. (2007). Human contribution to
the lengthening of the growing season during 1950-99. Journal of Climate, 20(21), 5441-5454.
City of Guelph (2017). Healthy landscapes – plant list native and drought-tolerant plants.
Guelph, Ontario. Retrieved from http://guelph.ca/living/house-and-home/healthy-landscapes/landscape-planning/plant/native-drought-tolerant-plants/
City of Mississauga (2014). Natural heritage and urban forest strategy. Mississauga, Ontario.
Retrieved from www7.mississauga.ca/Departments/Rec/parks/nhufs/pdf/FINAL_nhufs.pdf
City of Mississauga (2015). City of Mississauga wards map. Mississauga, Ontario. Retrieved
from https://www.mississauga.ca/file/COM/MississaugaWardsApril2015.pdf City of Mississauga (2016). City of Mississauga receives final installment from Ontario’s ice
storm assistance program. Mississauga, Ontario. Retrieved from http://www.mississauga.ca
City of Mississauga (2017). 2017 Existing Land Use. Mississauga, Ontario. Retrieved from
http://www5.mississauga.ca/research_catalogue/N_33_2017ExistingLandUseProfile.pdf City of Toronto (2012). Drought tolerant landscaping: A resource for development. Toronto,
Ontario. Retrieved from http://www1.toronto.ca/ City of Toronto (2013). Sustaining & expanding the urban forest: Toronto’s strategic forest
management plan. Toronto, Ontario. Retrieved from http://www1.toronto.ca/ Climate-Data (2015). Climate trends of Mississauga area. Retrieved from http://en.climate-
80
data.org/location/1676/ Coder, K. D. (1996). Tree heat stress syndrome. University of Georgia, School of Forest
resources. Athens, Georgia. Colombo, S. J. (2008). Ontario’s forests and forestry in a changing climate. Applied Research
and Development Branch, Ontario Ministry of Natural Resources. Peterborough, Ontario. Conway, T. M., & Hackworth, J. (2007). Urban pattern and land cover variation in the Greater
Toronto Area. The Canadian Geographer / Le Géographe canadien, 51, 43-57. Conway, T. M., & Urbani, L. (2007). Variations in municipal urban forestry policies: a case
study of Toronto, Canada. Urban Forestry and Urban Greening, 6, 181-192. Conway, T. M., Shakeel, T., & Atallah, J. (2011). Community groups and urban forest activity:
drivers of uneven canopy cover. Landscape and Urban Planning, 101(2011), 321-329 Dale, V. H., Joyce, L. A., McNulty, S., Neilson, R. P., Ayres, M. P., et al. (2001). Climate
change and forest disturbances. BioScience, 51, 723–734. Davis, M. (2011). Do native birds care whether their berries are native or exotic? No.
BioScience, 61(7), 501–502. Ditchknoff, S. S., Saalfeld, S. T., & Gibson, C. J. (2006). Animal behavior in urban ecosystems:
modification due to human-induced stress. Urban Ecosystems, 9, 5-12. Edwards, M., & Richardson, A. J. (2004). Impact of climate change on marine pelagic
phenology and trophic mismatch. Nature, 430(7002), 881–884. Fahey, R. T. (2016). Variation in responsiveness of woody plant leaf out phenology to
anomalous spring onset. Ecosphere, 7(2), e01209. Fahey, R. T., Bailecki, M. B., & Carter, D. R. (2013). Tree growth and resilience to extreme
drought across an urban land-use gradient. Arboriculture & Urban Forestry, 39(6), 279-285.
Fensham, R. J., & Holman, J. E. (1999). Temporal and spatial patterns in drought-related tree
dieback in Australian savanna. Journal of Applied Ecology, 36, 1035–1050. Ferrini, F., Van Den Bosch, C. C. K., & Fini, A. (Eds.). (2017). Routledge Handbook of Urban
Forestry. Taylor & Francis.
81
Floyd, M. L., Clifford, M., Cobb, N. S., Hanna, D., Delph, R., Ford, P., & Turner, D. (2009).
Relationship of stand characteristics to drought-induced mortality in three Southwestern piñon–juniper woodlands. Ecological Applications, 19(5), 1223–1230.
Foran, C. M., Baker, K. M., Narcisi, J. M., & Linkov, I. (2015). Susceptibility assessment of
urban tree species in Cambridge, MA, from future climatic extremes. Environmental Systems and Decisions, 35, 389-400.
Forests Ontario. (2014). Homeowner's guide: maintaining your trees following ice storms and
how to prevent future damage. Toronto, Ontario. Fuller, R. A., Irvine, K. N., Devine-Wright, P., Warren, P. H., & Gaston, K. J. (2007).
Psychological benefits of greenspace increase with biodiversity. Biology Letters, 3(4), 390–394.
Gabriel, K., & Endlicher, W. R. (2011). Urban and rural mortality rates during heat waves in
Berlin and Brandenburg, Germany. Environmental Pollution, 159, 2044–2050. Gartner, K., Nadezhdina, N., Englisch, M., Čermak, J., & Leitgeb, E. (2009). Sap flow of birch
and Norway spruce during the European heat and drought in summer 2003. Forest Ecology and Management, 258 (5), 590–599.
Gauthier, S., Bernier, P., Burton, P. J., Edwards, J., Isaac, K., Isabel, N., et al. (2014). Climate
change vulnerability and adaptation in the managed Canadian boreal forest. Environmental Reviews, 22, 256–285.
Gazal, R., White, M. A., Gillies, R., Rodemaker, E., Sparrow, E., & Gordon, L. (2008). GLOBE
students, teachers, and scientists demonstrate variable differences between urban and rural leaf phenology. Global Change Biology, 14(7), 1568–1580.
Gill, S. E., Handley, J. F., Ennos, A. R., & Pauleit, S. (2007). Adapting cities for climate
change: the role of green infrastructure. Built Environment, 33, 115-133. Goldblum, D., & Rigg, L. S. (2005). Tree growth response to climate change at the deciduous-
boreal forest ecotone, Ontario, Canada. Canadian Journal of Forest Research-Revue Canadienne De Recherche Forestiere, 35(11), 2709–2718.
Grimm, N. B., Faeth, S. H., Golubiewski, N. E., Redman, C. L., Wu, J., Bai, X., & Briggs, J. M.
(2008). Global change and the ecology of cities. Science (New York, N.Y.), 319(5864), 756–760.
82
Hale, J., Pugh, T., Sadler, J., Boyko, C., Brown, J., et al. (2015). Delivering a multi-functional and resilient urban forest. Sustainability, 7(4), 4600–4624.
Hanson, P. J., & Weltzin, J. F. (2000). Drought disturbance from climate change: response of
United States forests. The Science of the Total Environment, 262(3), 205–220. Hauer, R. J., Dawson J. O., & Werner, L. P. (2006). Trees and ice storms: the development of
ice storm-resistant urban tree populations, Second Edition. Joint Publication 06-1, College of Natural Resources, University of Wisconsin-Stevens Point, and the Department of Natural Resources and Environmental Sciences and the Office of Continuing Education, University of Illinois at Urbana-Champaign. 20 pages.
Hendershot, W. H., & Jones, A. R. C. (1989). Maple decline in Quebec: a discussion of possible causes and the use of fertilizers to limit damage. Forestry Chronicle, 65 (4), 280–287.
Heynen, N. C., & Lindsey, G. (2003). Correlates of urban forest canopy cover: implications for local public works. Public Works Management & Policy, 8(3), 33–47. doi:10.1177/1087724X03008001004.
Hoffmann, A. A., & Parsons, P. A. (1997). Extreme environmental change and evolution.
Cambridge University Press. Hogg, E. H. T., Brandt, J. P., & Michaelian, M. (2008). Impacts of a regional drought on the
productivity, dieback, and biomass of western Canadian aspen forests. Canadian Journal of Forest Research-Revue Canadienne De Recherche Forestiere, 38(6), 1373–1384. http://doi.org/10.1139/X08-001
Hogg, E. H., Barr, A. G., & Black, T. A. (2013). A simple soil moisture index for representing
multi-year drought impacts on aspen productivity in the western Canadian interior. Agricultural and Forest Meteorology, 178-179, 173–182.
Hollis, G. E. (1975). The effects of urbanization on floods of different recurrence interval.
Water Resources Research, 11(3), 431-435. Hopkin, A., Williams, T., Sajan, R., Pedlar, J., & Nielsen, C. (2003). Ice storm damage to
eastern Ontario forests: 1998-2001. The Forestry Chronicle, 79(1), 47-53. Hotte, N., Lorien, N., Barron, S., Cowan, J., & Zhaohua, C. C. (2015). The social and economic
values of Canada’s urban forests: a national synthesis. Canadian Forest Services. Houle, D., Bouffard, A., Duchesne, L., Logan, T., & Harvey, R. (2012). Projections of future
soil temperature and water content for three southern Quebec forested sites. Journal of Climate, 25(21), 7690-7701.
83
Hunter, M. (2011). Using ecological theory to guide urban planting design an adaptation strategy for climate change. Landscape Journal, 30(2), 173–193.
Hutchinson, M. F. (2004). ANUSPLIN Version 4.3. Canberra: Centre for Resource and
Environmental Studies, Australian National University. (8 October 2007; http://cres.anu.edu.au/outputs/anusplin.php)
IPCC (2007). Climate change 2007: impacts, adaptation and vulnerability. Parry, M. L.,
Canziani, O. F., Palutikof, J. P., Van Der Linden, P. J., Hanson, C. E. (eds.), Contribution of Working Group II to the Fourth Assessment Report of the Intergovernmental Panel on Climate Change. Cambridge University Press, Cambridge, UK, 976 pp.
IPCC (2013). The physical science basis: contribution of working group I to the fifth assessment
report of the Intergovernmental Panel on Climate Change. Cambridge University Press, Cambridge, United Kingdom and New York, NY, USA (pp. 2216).��
IPCC (2014). Climate Change 2014: Impacts, Adaptation, and Vulnerability. Part A: Global and
Sectoral Aspects. Contribution of Working Group II to the Fifth Assessment Report of the Intergovernmental Panel on Climate Change [Field, C. B., Barros, V. R., Dokken, D. J., Mach, K. J., Mastrandrea, M. D., Bilir, T. E., Chatterjee, M., Ebi, K. L., Estrada, Y. O., Genova, R. C., Girma, B., Kissel, E. S., Levy, A. N., MacCracken, S., Mastrandrea, P. R. & White, L.L. (eds.)]. Cambridge University Press, Cambridge, United Kingdom and New York, NY, USA, 1132 pp.
Irland, L. C. (2000). Ice storms and forest impacts. The Science of the Total Environment, 262,
231-242. Isebrand, J. G., McDonald, E. P., Kruger, E., Hendrey, G., Percy, K., Pregitzer, K., et al. (2001).
Growth responses of Populus tremuloides clones to interacting elevated carbon dioxide and tropospheric ozone. Environmental Pollution, 115(3), 359–371.
Iverson, L. R., & Prasad, A. M. (1998). Predicting abundance of 80 tree species following
climate change in the eastern united states. Ecological Monographs, 68(4), 465–485. Iverson, L. R., Schwartz, M. W., & Prasad, A. M. (2004). How fast and how far might tree
species migrate in eastern United States due to climate change? Global Ecology and Biogeography, 13(3), 209-219.
Jenerette, G. D., Clarke, L. W., Avolio, M. L., Pataki, D. E., Gillespie, T. W., et al. (2016).
Climate tolerances and trait choices shape continental patterns of urban tree biodiversity. Global Ecology and Biogeography, 25(11), 1367–1376.
84
Johnston, M. (2004). Impacts and adaptation for climate change in urban forests. 6th Canadian Urban Forest Conference. Kelowna, British Colombia, Canada.
Johnston, M., Campagna, M., Gray, P., Kope, H., Loo, J., et al. (2009). Vulnerability of
Canada's tree species to climate change and management options for adaptation: An overview for policy makers and practitioners. Canadian Council of Forest Ministers.
Katz, R. W., & Brown, B. G. (1992). Extreme events in a changing climate: variability is more
important than averages. Climatic Change, 21(3), 289–302. Keenan, R. J. (2015). Climate change impacts and adaptation in forest management: a review.
Annals of Forest Science. 72(2): 145–167. Kendal, D., & Baumann, J. (2016, November). The city of Melbourne's future urban forest.
Retrieved December 5, 2016, from http://www.nespurban.edu.aupublications-resourcesresearch-reports CAULRRCoMFutureUrbanForestNov.pdf
Kendal, D., & McDonnell. M. J. (2014). Adapting urban forests to climate change. Centre for
Urban Greenery and Ecology, 8, 130-137. Keenan, R. J. (2015). Climate change impacts and adaptation in forest management: a review.
Annals of Forest Science, 72(2), 145–167. http://doi.org/10.1007/s13595-014-0446-5 Kirnbauer, M. C., Baetz, B. W., & Kenney, W. A. (2013). Estimating the stormwater attenuation
benefits derived from planting four monoculture species of deciduous trees on vacant and underutilized urban land parcels. Urban Forestry & Urban Greening, 12(3), 401–407.
Kowarik, I. (2011). Novel urban ecosystems, biodiversity, and conservation. Environmental
Pollution (Barking, Essex: 1987), 159(8-9), 1974–1983. Lévesque, M., Saurer, M., Siegwolf, R., Eilmann, B., Brang, P., Bugmann, H., & Rigling, A.
(2013). Drought response of five conifer species under contrasting water availability suggests high vulnerability of Norway spruce and European larch. Global Change Biology, 19(10), 3184–3199. http://doi.org/10.1111/gcb.12268
Lévesque, M., Siegwolf, R., Saurer, M., Eilmann, B., & Rigling, A. (2014). Increased water-use
efficiency does not lead to enhanced tree growth under xeric and mesic conditions. New Phytologist, 203(1), 94–109.
Lloret, F., Siscart, D., & Dalmases, C. (2004). Canopy recovery after drought dieback in holm-
oak Mediterranean forests of Catalonia (NE Spain). Global Change Biology, 10, 2092–2099.
85
Loehle, C. (1998). Height growth rate tradeoffs determine northern and southern range limits for
trees. Journal of Biogeography, 25(4), 735–742. Luley, C. J., & Bond, J. (2006). Evaluation of the fate of ice storm-damaged urban maple (Acer)
trees. Aboriculture & Urban Forestry, 35(5), 214-220. Lugo, A. E. (1997). The apparent paradox of re-establishing species richness on degraded lands
with tree monocultures. Forestry Ecology and Management, 99, 9–19. MacAurthur, R. H. (1972). Geographical ecology: patterns in the distribution of species.
Princeton University Press. Maherali, H., Pockman, W. T., & Jackson, R. B. (2004). Adaptive variation in the vulnerability
of woody plants to xylem cavitation. Ecology, 85(8), 2184–2199. Martin, C. A. Warren, P. S., & Kinzig, A. P. (2004). Neighborhood socio-economic status is a
useful predictor of perennial landscape vegetation in residential neighborhoods and embedded small parks of Phoenix, AZ. Landscape and Urban Planning, 69, 355–368.
Masson, V., Marchadier, C., Adolphe, L., Aguejdad, R., Avner, P., Bonhomme, M., et al.
(2014). Adapting cities to climate change: A systemic modelling approach. Urban Climate, 10, 407–429.
Mathey, J., Röbler, S., Lehmann, I., & Bräuer, A. (2011). Urban green spaces: potentials and
constraints for urban adaptation to climate change. In K. Otto-Zimmermann (Ed.), Resilient Cities (pp. 479–485). Springer Netherlands.
Mathys, A., Coops, N. C., & Waring, R. H. (2014). Soil water availability effects on the
distribution of 20 tree species in western North America. Forest Ecology and Management, 313, 144–152.
McDermid, J., Fera, S., & Hogg, A. (2015). Climate change projections for Ontario: an updated
synthesis for policymakers and planners. Ontario Ministry of Natural Resources and Forestry, Science and Research Branch, Peterborough, Ontario. Climate Change Research Report CCRR-44.
McDowell, N., Pockman, W. T., Allen, C. D., Breshears, D. D., Cobb, N., et al. (2008).
Mechanisms of plant survival and mortality during drought: why do some plants survive while others succumb to drought? New Phytologist, 178(4), 719–739.
86
McKenney, D. W., Pedlar, J. H., Lawrence, K., Campbell, K., & Hutchinson, M. F. (2007a). Beyond traditional hardiness zones: using climate envelopes to map plant range limits. BioScience, 57(11), 929–937.
McKenney, D. W., Pedlar, J. H., Lawrence, K., Campbell, K., & Hutchinson, M. F. (2007b).
Potential impacts of climate change on the distribution of North American trees. BioScience, 57(11), 939–948.
McKenney, D. W., Pedlar, J., Hutchinson, M., Papadopol, P., Lawrence, K., et al. (2013).
Spatial climate models for Canada’s forestry community. The Forestry Chronicle, 89(05), 659–663.
McKinney, M.L. (2002). Urbanization, biodiversity, and conservation. Bioscience, 52, 883e890. McKinney, M.L. (2006). Urbanization as a major cause of biotic homogenization. Biological
Conservation, 127, 247e260. McNulty, S. G., & Aber, J. D. (2001). US national climate change assessment on forest
ecosystems: an introduction. BioScience, 51(9), 720–722. McPherson, E. G., Nowak, D., Heisler, G., Grimmond, S., Souch, C., Grant, R., & Rowntree, R.
(1997). Quantifying urban forest structure, function, and value: the Chicago urban forest climate project. Urban Ecosystems, 1(1), 49–61.
Mitchell, S. J. (2012). Wind as a natural disturbance agent in forests: a synthesis. Forestry,
86(2), cps058–157. Millennium Ecosystem Assessment Board, World Health Organization. (2005). Ecosystems and
human well-being. Ecosystems, 5, 1–100. Ministry of Natural Resources. (2009). The ecosystems of Ontario, part 1: ecozones and
ecoregions. Science and Information Branch, Ministry of Natural Resources. Ontario, Canada. Retrieved from http://www.ontario.ca/document/ecosystems-ontario-part-1-ecozones-and-ecoregions
Montoya, J. M., & Raffaelli, D. (2010). Climate change, biotic interactions and ecosystem
services. Philosophical Transactions of the Royal Society of London B: Biological Sciences, 365(1549), 2013–2018.
Morgenroth, J., Östberg, J., Konijnendijk Van Den Bosch, C., Nielsen, A. B., Hauer, R., et al.
(2016). Urban tree diversity—Taking stock and looking ahead. Urban Forestry & Urban Greening, 15, 1–5.
87
Natural Resources Canada (2011). Climate change impacts and adaptations: A Canadian perspective. Natural Resources Canada. Retrieved from http://www.nrcan.gc.ca/sites/www.nrcan.gc.ca. earth-sciences/ les/pdf/perspective/pdf/report_e.pdf �
Natural Resource Canada. (2004). The Atlas of Canada: Map of Forest Regions of Canada.
Natural Resources Canada. Retrieved from http://atlas.nrcan.gc.ca/site/english/learningresources/theme_modules/borealforest/forest_regions.jpg/image_view
Needoba, A., Porter, E., LeFrancois, C., Dobbs, C., Allen, B., Cox, T., & Coulthard, M. (2016).
Urban forest climate adaptation framework for metro Vancouver: tree species selection, planting, and management. Metro Vancouver. Retrieved from http://www.metrovancouver.org/services/regional-planning/PlanningPublications/UrbanForestClimateAdaptationFrameworkTreeSpeciesSelection.pdf
Nowak, D. J. (1994). Air pollution removal by Chicago’s urban forest. In E. McPherson & D.
Nowak (Eds.), Chicago’s Urban Forest Ecosystem: Results of the Chicago Urban Forest Climate Project (pp. 63–81). Radnor: United States Department of Agriculture.
Nowak, D. J. (2010). Urban biodiversity and climate change. In Urban Biodiversity and Design
(pp. 101 –117). Wiley-Blackwell. Nowak, D. J., & Crane, D. E. (2002). Carbon storage and sequestration by urban trees in the
USA. Environmental Pollution, 116, 381–389. Nowak, D. J., Crane, D. E., & Stevens, J. C. (2006). Air pollution removal by urban trees and
shrubs in the United States. Urban Forestry and Urban Greening, 4, 115–123. Nowak, D. J., & Dwyer, J. F. (2007). Understanding the benefits and costs of urban forest
ecosystems. In J. E. Kuser (Ed.), Urban and Community Forestry in the Northeast (pp. 25–46). Springer Netherlands.
Nowak, D. J., McBride, J. R., & Beatty, R. A. (1990). Newly planted street tree growth and
mortality. Journal of Arboriculture, 16(5), 124–129. Nowak, D. J., Stevens, J. C., Sisinni, S. M., & Luley, C. J. (2002). Effects of urban tree
management and species selection on atmospheric carbon dioxide. Journal of Arboriculture, 28(3), 113–122.
88
Ordóñez, C., & Duinker, P. N. (2014). Assessing vulnerability of urban forests to climate change. Environmental Reviews, 22, 311-321.
Ordóñez, C., & Duinker, P. N. (2015). Climate change vulnerability assessment of the urban
forest in three Canadian cities. Climatic Change, 131(4), 531–543. Ovaskainen, O., Skorokhodova, S., Yakovleva, M., Sukhov, A., Kutenkov, A., et al. (2013).
Community-level phenological response to climate change. Proceedings of the National Academy of Sciences of the United States of America, 110(33), 13434–13439.
Parmesan, C. (2006). Ecological and evolutionary responses to recent climate change. Annual
Review of Ecology, Evolution, and Systematics, 37(1), 637–669. Parrotta, J. A. (1999). Productivity, nutrient cycling, and succession in single- and mixed-
species plantations of Casuarina equisetifolia, Eucalyptus robusta, and Leucaena leucocephala in Puerto Rico. Forest Ecology and Management, 124, 45–77.
Pedro, M. S., Rammer, W., & Seidl, R. (2015). Tree species diversity mitigates disturbance
impacts on the forest carbon cycle. Oecologia, 177(3), 619–630. Plaut, J. A., Yepez, E. A., Hill, J., Pangle, R., Sperry, J. S., Pockman, W. T., & McDowell, N.
G. (2012). Hydraulic limits preceding mortality in a piñon-juniper woodland under experimental drought. Plant, Cell & Environment, 35(9), 1601–1617.
Potts, D. F., & Herrington, L. P. (1982). Drought resistance adaptations in urban honeylocust,
Journal of Arboriculture, 8(3), 75-80. Ramstad, K., & Orlando, C. (2009). Tree choices: native? non-native? invasive? The terms can
be relative. Oregon Department of Forestry. Portland, Oregon. Retrieved from https://juneautrees.files.wordpress.com/2008/01/natives_vs_nonnatives-or-09.pdf
Reichstein, M., Ciais, P., Papale, D., Valentini, R., Running, S., et al. (2007). Reduction of
ecosystem productivity and respiration during the European summer 2003 climate anomaly: a joint flux tower, remote sensing and modelling analysis. Global Change Biology, 13, 634–651.
Revi, A., Satterthwaite, D. E., Aragón-Durand, F., Corfee-Morlot, J., Kiunsi, R. B. R., et al.
(2014). Urban areas. In Field, C. B., Barros, V. R., Dokken, D. J., Mach, K. J., Mastrandrea, M. D., Bilir, T. E., & White L. L., (Eds.), Climate Change 2014: Impacts, Adaptation and Vulnerability. Part A: Global and Sectoral Aspects. Contribution of Working Group II to the Fifth Assessment Report of the Intergovernmental Panel on Climate Change (pp. 535–612). New York, NY: Cambridge University Press.
89
Rodriguez, L. F. (2006). Can invasive species facilitate native species? Evidence of how, when,
and why these impacts occur. Biological Invasions, 8, 927–939. Roloff, A. (2010). Trees: encyclopedia of practical tree biology. Weinheim, Wiley-VCH. pp.
215. Roloff, A. (2013). Trees in the city: special features, function, benefits, types, risks. Stuttgart:
Ulmer Eugen Verlag. pp. 256. Roloff, A., & Grundmann, B. M. (2008). Forest tree species and their use in climate change.
Berlin, Landesforstanstalt Eberswalde. pp. 16. Retrieved from https://www.researchgate.net/publication/259192589_Waldbaumarten_und_ihre_Verwe ndung_im_Klimawande
Roman, L. A., & Scatena, F. N. (2011). Street tree survival rates: Meta-analysis of previous
studies and application to a field survey in Philadelphia, PA, USA. Urban Forestry & Urban Greening, 10(4), 269–274.
Romero-Lankao, P., Smith, J. B., Davidson, D. J., Diffenbaugh, N. S., Kinney, P. L., Kirshen,
P., Kovacs, P., & Villers Ruiz, P. (2014). North America. In: Climate Change 2014: Impacts, Adaptation, and Vulnerability. Part B: Regional Aspects. Contribution of Working Group II to the Fifth Assessment Report of the Intergovernmental Panel on Climate Change [Barros, V. R., Field, C. B., Dokken, D. J., Mastrandrea, M. D., Mach, K. J., Bilir, T. E., Chatterjee, M., Ebi, K. L., Estrada, Y. O., Genova, R.C., Girma, B., Kissel, E. S., Levy, A. N., MacCracken, S., Mastrandrea, P. R., & White, L. L. (eds.)]. Cambridge University Press, Cambridge, United Kingdom and New York, NY, USA,1439-1498.
Root, T. L., Price, J. T., Hall, K. R., Schneider, S. H., Rosenzweig, C., & Pounds, J. A. (2003).
Fingerprints of global warming on wild animals and plants. Nature, 421(6918), 57-60. Rowntree, A. (1984). Ecology of the urban forest — introduction to part I. Urban Ecology, 8, 1–
11. Rowntree, A., & Sanders, R. A. (1982). The urban forest resource: New York state forest
resources assessment report no. 73. New York State Department of Environmental Conservation. Albany, New York.
Sears, A. R., & Anderson, S. H. (1991). Correlation between birds and vegetation in Cheyenne,
Wyoming. In Adam LW, Leedy KL, eds. Wildlife Conservation in Metropolitan Environments. Columbia (MD): National Institute for Urban Wildlife, pp. 76-80.
90
SENES Consultants Limited. (2011). Toronto’s future weather and climate driver study. Toronto, Ontario. Retrieved from http://www1.toronto.ca/city_of_toronto
Smith, K. T. (2015). Tree recovery from ice storm injury. Ontario Arborist, 24-26. Solecki, W., & Marcotullio, P. J. (2013). Urbanization, biodiversity and ecosystem services:
challenges and opportunities (pp. 485–504). Springer Netherlands. Ste-Marie, C., Nelson, E. A., Dabros, A., & Bonneau, M. E. (2011). Assisted migration:
introduction to a multifaceted concept. The Forestry Chronicle, 87(6), 723-730. Swann, A. L. S., Hoffman, F. M., Koven, C. D., & Randerson, J. T. (2016). Plant responses to
increasing CO2 reduce estimates of climate impacts on drought severity. Proceedings of the National Academy of Sciences of the United States of America, 113(36), 10019–10024.
Teskey, R., Wertin, T., Bauweraerts, I., Ameye, M., McGuire, M. A., & Steppe, K. (2015).
Responses of tree species to heat waves and extreme heat events. Plant, Cell & Environment, 38(9), 1699–1712.
Thomas, C. D., Cameron, A., Green, R. E., Bakkenes, M., Beaumont, L. J., Collingham, Y. C.,
et al. (2004). Extinction risk from climate change. Nature, 427(6), 145–148. Toronto and Region Conservation Authority (2011a). Peel region urban forest strategy.
Mississauga, Ontario. Retrieved from http://www.mississauga.ca/file/COM/2012eacagendapart2_june5.pdf
Toronto and Region Conservation Authority. (2011b). City of Mississauga urban forest study.
Mississauga, Ontario. Retrieved from http://www.mississauga.ca/portal/home Touchan, R., Anchukaitis, K. J., Meko, D. M., Attalah, S., Baisan, C., & Aloui, A. (2008). Long
term context for recent drought in northwestern Africa. Geophysical Research Letters. 35, L13705.
Tyler, S., & Moench, M. (2012). A framework for urban climate resilience. Climate and
Development, 4(4), 311–326. USDA, Forest Service (2007). i-tree Software Suite v1.2: User’s Manual. USDA, NRCS. (2017). The PLANTS Database (http://plants.usda.gov, 13 February 2017).
National Plant Data Team. Greensboro, NC 27401-4901 USA.
91
Vogt, J. M., Watkins, S. L., Mincey, S. K., Patterson, M. S., & Fischer, B. C. (2015). Explaining planted-tree survival and growth in urban neighborhoods: a social–ecological approach to studying recently-planted trees in Indianapolis. Landscape and Urban Planning, 136, 130–143.
Walther, G. R. (2004). Plants in a warmer world. Perspectives in Plant Ecology, Evolution, and
Systems, 6, 169–185. Walther, G. R. (2010). Community and ecosystem responses to recent climate change.
Philosophical Transactions of the Royal Society of London, Series B, Biological Sciences, 365(1549), 2019–2024.
Walther, G. R., Post, E., Convey, P., Menzel, A., Parmesan, C., et al. (2002). Ecological
responses to recent climate change. Nature, 416(6), 389–395. Warren, K. (2014). Urban trees, climate change, nursery availability. Morton Arboretum.
Retrieved from https://www.youtube.com/watch?v=I9bWTQRdGAg Weltzin, J. F., Loik, M. E., Schwinning, S., Williams, D. G., Fay, P. A., et al. (2003). Assessing
the response of terrestrial ecosystems to potential changes in precipitation. BioScience, 53(10), 941–952.
Wilby, R. L., & Perry, G. L. W. (2006). Climate change, biodiversity and the urban
environment: a critical review based on London, UK. Progress in Physical Geography, 30(1), 73–98.
Whitlow, T. H., & Bassuk, N. L. (1987). Trees in difficult sites. Journal of Arboriculture, 13,
10–17. Woods, A., Coates, K. D., & Hamann, A. (2005). Is an unprecedented Dothistroma needle blight
epidemic related to climate change?. BioScience, 55(9), 761. Woodward, F. I. (1987). Climate and plant distribution. Cambridge University Press, Cam-
bridge. 190 pages. Xie, Y., Wang, X., & Silander, J. A. J. (2015). Deciduous forest responses to temperature,
precipitation, and drought imply complex climate change impacts. Proceedings of the National Academy of Sciences of the United States of America, 112(44), 13585–13590.
Xu, T., & Hutchinson, M. F. (2013). New developments and applications in the ANUCLIM
Yamaguchi, M., Deguchi, M., & Miyazaki, Y. (2006). The effects of exercise in forest and
urban environments on sympathetic nervous activity of normal young adults. Journal of International Medical Research, 34(2), 152-159.
92
Yang, J. (2009). Assessing the Impact of Climate Change on Urban Tree Species Selection: A Case Study in Philadelphia. Journal of Forestry, 107(7), 364-372
Zhou, L., Tucker, C., Kaufmann, R., Slayback, D., Shabanov, N., & Myneni, R. (2001).
Variations in northern vegetation activity inferred from satellite data of vegetation index during 1981 to 1999. Journal of Geophysical Research – Atmospheres, 106, 20069-20083.
Zhu, P., & Zhang, Y. (2008). Demand for urban forests in United States cities. Landscape
Urban Plan, 84, 293-300. Zimmermann, N. E., Yoccoz, N. G., Edwards, T. C., Meier, E. S., Thuiller, W., et al. (2009).
Climatic extremes improve predictions of spatial patterns of tree species. Proceedings of the National Academy of Sciences of the United States of America, 106 Suppl 2(S), 19723–19728.
93
Appendix A – Introductory Information Letter for Interview I am contacting you in hopes that you would be willing to participate in an interview as part of my Master's research. My research is looking at the vulnerability of urban tree species to climate change within the City of Mississauga. This research can aid urban forest management plans in species selection and extend the life expectancy of individual trees, thus saving time and money, and retain provisioning ecosystem services. This research is important due to the essential ecosystem services that urban forests provide such as urban heat island mitigation, filtration of air pollution, and regulation of stormwater. This information is useful in developing adaptive urban forest management plans and aid planting procedures in selecting species which can survive future climate conditions. Interviews can be completed either in-person or over-the-phone, at your convenience, to discuss the changing climate and urban forest. Interviews will be approximately 30-60 minutes long. Interview questions will be provided to you ahead of time for your convenience. They will focus on expertise and knowledge of common species in the urban forest. There are no known risks to you for assisting with this project. Benefits of participation include receiving a summary of the results upon completion of the study. Interview data will be stored in a secured laboratory controlled by the researcher, and will be destroyed at the end of the research project. Participation in the interview is voluntary, and you may decline to answer certain questions. Your response, however, will help provide a more complete understanding of the vulnerability of Mississauga’s urban forest. If you have any questions, please feel free to contact me at the address above, by email ([email protected]) or telephone (519-933-4797). The research supervisor Tenley Conway ([email protected]) is also available for questions regarding the research. You may also contact the Office of Research Ethics at the University of Toronto ([email protected]; 416- 946-3273) if you have any questions about your rights as a participant. Thank you for your time and consideration. Your participation is much appreciated in this research. Sincerely, Talha Khan MSc Geography Candidate Appendix B – Information Letter and Informed Consent form for Interviews
94
RE: Assessing local and regional climate vulnerability of the urban forest: a case study of Mississauga, Ontario - Master’s Research Project You have received this letter because you indicated a willingness to participate in an interview regarding the vulnerability of City of Mississauga’s urban forest to climate change, species selection, and climate-based planting procedures. We are interested in interviewing people to learn more about the observed changes in regional and urban climate, and health of commonly planted native and non-native species within the City of Mississauga. The interview will include questions about observed climate change within the Mississauga region, observed trends in urban species health and survival, and changes in species selection and planting procedures due to climate change. We anticipate that the interview will take approximately 30-60 minutes to complete. Interviews will be scheduled at your convenience, occurring at your office. There are no known risks or benefits to you for assisting with this project. Participation in this interview is voluntary and you can withdraw at any time during or after the interview, without negative consequences. If you are quoted a general job title and your municipality or organization name will be used in the study. Your name will remain confidential unless you state otherwise. You may decline to answer any question(s) during the interview. Notes will be taken during the interview, and an audio recording will be made if you give permission. Notes and recordings will be stored in a secured laboratory controlled by the researcher and encrypted if moved to any other location. Data will be destroyed five years after the end of the research project or should you withdraw from the study. The Office of Research Ethics will have confidential access to the data to help ensure participant protection procedures and law are followed. If chosen, (a) representatives(s) of the Human Research Ethics Program may access study-related data and/or consent materials as part of the review. All information accessed by the HREP will be upheld to the same level of confidentiality that has been stated by the research team. This collected data could be published in an academic journal, a public report, or presented at an academic conference. If you would like a copy of the research results and any subsequent publications, please provide the researcher with your address on the consent form. If you have further questions regarding this research or would like to schedule an interview, you can contact Talha Khan ([email protected]) or telephone (519-933-4797). The research supervisor Tenley Conway ([email protected]) is also available for questions regarding the research. If you have any questions about your rights as a participant, please contact the University of Toronto, Office of Research Ethics ([email protected]; 416-946-3273). Sincerely, Talha Khan
95
Assessing local and regional climate vulnerability of the urban forest: a case study of Mississauga, Ontario
Talha Khan, MSc Candidate I acknowledge that that topic of this interview has been explained to me and that any question that I have asked have been answered to my satisfaction. I have received an information sheet that explains the purpose of the interview and agree to participate. I know that I may ask, now and in the future, any questions that I may have about this project. I understand my participation is voluntary and that I can withdraw from the interview at any time. Only the researchers involved in this study will have access to the notes, and if permission is given, audio recordings from my conversation. This information will be destroyed in a timely fashion once the study is over. I will be given a copy of this consent form for my records, if requested.
Choose/check any options that apply: Yes No
I agree to be recorded during our interview
I agree to be quoted in research publications by name
I agree to be quoted in research publications by my general job description
I would like a copy of the consent form
Name (please print) ________________________________________________________________
If you would like to be referred to or quoted with a specific title within the study, please indicate the title below: _____________________________________________________________________________________ To receive a copy of the results, please provide your email address. _________________________________________________________ Contact Information Talha Khan ([email protected]) telephone: (519-933-4797)
96
Appendix C – Interview Guide
Master’s Study on Impacts of Climate Change on Urban Forest Species within the City of Mississauga
Background: I thought it would be helpful to share my interview guide with you in advance of our meeting; I am a master’s student at the University of Toronto researching the impact climate change on urban forest species present within the City of Mississauga. Using climate prediction models, I am assessing whether the physiological growth requirements of native and non-native species will be met under future climate conditions based on conservative and worst-case climate scenarios. Specifically, my research question is: under future climate scenarios, what climate requirements are being met for City of Mississauga’s abundant urban forest species between the years 2011 and 2100? Prior to finalization of my research, I will send you a copy of my summary regarding for confirmation. Thank you very much for your help; I look forward to speaking with you! - Talha Khan
1) Observed trends in the urban forest a) What tree species are known to be the most resilient or are preferred for planting in
Mississauga’s urban areas? And natural areas? b) What tree species are known to be the least resilient or are not preferred for planting in
Mississauga’s urban areas? And natural areas? c) What changes has Mississauga’s urban forest seen in the past 30 years? Any changes due
to climate change? If so, what? d) Has the list of planted tree species changed within Mississauga over the past 30 years (or
more)? If so, how and why? 2) Observed trends in local and regional climate
a) What shifts, if any, has City of Mississauga’s climate seen in the past 30 years? b) Have you noticed any differences in local/micro climatic conditions when comparing
areas with varying amounts of grey infrastructure in Mississauga? 3) Mississauga’s future regional climate
a) What are your thoughts and comments on the modeled changes in climate conditions from 2011-2100? Do you agree or disagree? Why?
b) What changes do you expect for the future or have you noticed in climate, aside from the models?
4) Validation and critique of tree vulnerability matrix and climate envelopes
a) What are your thoughts and comments on the results of the vulnerability matrix? Do you agree or disagree with the results? Why?
b) Are there any results that are surprising? What? Why is it/are they surprising? 5) Urban forest management and climate change
a) What have been the biggest challenges to the urban forest?
97
b) What climate-related factors are considered when selecting tree species for a specific site?
c) What other factors are prioritized before climate, if any, when considering species for a planting site?
d) What tools or methods are used to aid the survival of species relative to the climate of Mississauga?
e) What changes do you expect in species composition or selection in Mississauga’s urban forest if the climate models are correct in their predictions?
f) How is future climate/climate change taken into consideration when selecting tree species? If not, why?
6) Is there any other important information, experiences, trends, or comments you would
like to add or mention?
98
Appendix D – Abundances of Species Analyzed in Each Region