18
Bespoke Consultancy
| Date post: | 05-Aug-2015 |
| Category: |
Documents |
| Upload: | vesselsvaluecom-seasure-shipping-ltd |
| View: | 46 times |
| Download: | 0 times |

Bespoke Consultancy

Pick and mix from our data and analytics to create your report, data feed or tool.
ContentsDemand / Supply Ton Mile Demand (AIS) 4
Net Fleet Growth 5
S&P Stats Momentum 6
Volatility 7
Asset Class Correlation 8
Liquidity 9
Alternative With Charter Valuations 10
Valuations Income Valuations 10
Option Pricing 11
Haircut Model 11
AIS Analytics Automatic Position Lists 12
Trade Flows 13
Average Speed 14
Congestion 15
Operating Performance 16
Interactive Tools LSFO Bunker Demand 17
Fleet at Risk 18

4
Demand /Supply
Ton Mile Demand What is the demand for vessels by type, route and/or region?
What is the trend?
How does this affect rates and values?
Methodology
• Demand = Cargo quantity X laden distance travelled
• Distance travelled = Real time laden/ballast movements (satellite and terrestrial AIS) & filtration for piloting, at anchor etc
• Laden/ballast information from vessel draft and specification database
• Port, country or region level zoning to improve the granularity of the analysis
• Commodity type, loading and discharging port database
0
2000
4000
6000
8000
10000
12000
14000
16000
18000
200
210
220
230
240
250
260
270
280
Jan-13 Feb-13 Mar-13 Apr-13 May-13 Jun-13 Jul-13 Aug-13 Sep-13 Oct-13 Nov-13 Dec-13 Jan-14 Feb-14 Mar-14 Apr-14
USD
/ D
ay (E
nd o
f Mon
th)
Ton
Mile
s (B
illio
n)
BSI-TCA
Supramax Ton Mile
Supramax ton mile demand vs TCA.
Supramax Ton Mile vs TCA
Demand /Supplycontinued
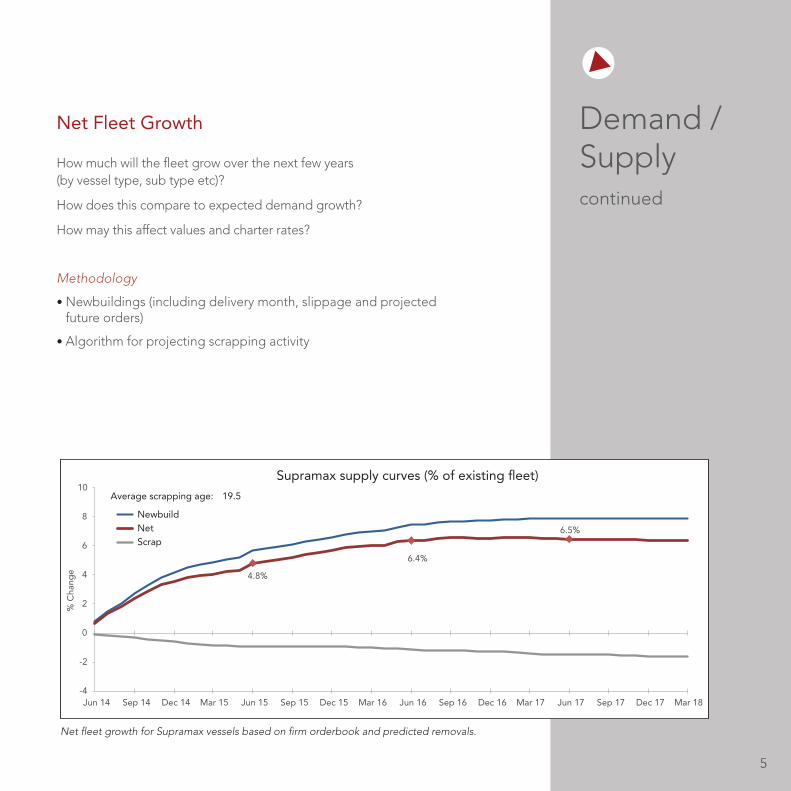
Net Fleet Growth How much will the fleet grow over the next few years (by vessel type, sub type etc)?
How does this compare to expected demand growth?
How may this affect values and charter rates?
Methodology
• Newbuildings (including delivery month, slippage and projected future orders)
• Algorithm for projecting scrapping activity
55
Net fleet growth for Supramax vessels based on firm orderbook and predicted removals.
4.8%
6.4%
6.5%
-4
-2
0
2
4
6
8
10
Jun 14 Sep 14 Dec 14 Mar 15 Jun 15 Sep 15 Dec 15 Mar 16 Jun 16 Sep 16 Dec 16 Mar 17 Jun 17 Sep 17 Dec 17 Mar 18
% C
hang
e
NewbuildNetScrap
Average scrapping age: 19.5
Supramax supply curves (% of existing fleet)
6
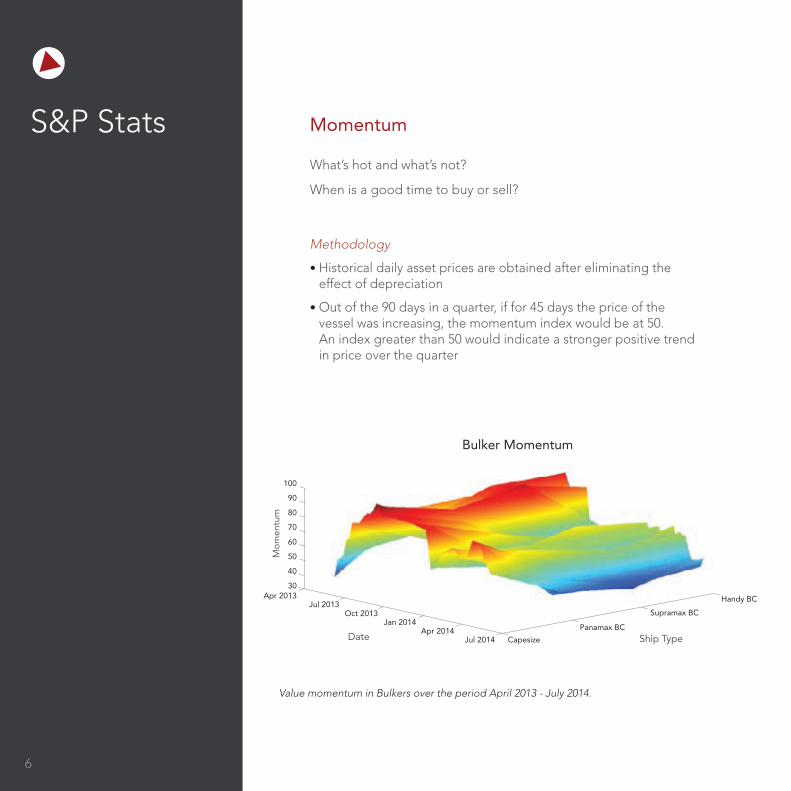
S&P Stats Momentum What’s hot and what’s not?
When is a good time to buy or sell?
Methodology
• Historical daily asset prices are obtained after eliminating the effect of depreciation
• Out of the 90 days in a quarter, if for 45 days the price of the vessel was increasing, the momentum index would be at 50. An index greater than 50 would indicate a stronger positive trend in price over the quarter
Value momentum in Bulkers over the period April 2013 - July 2014.
BULKER Momentum
Mo
men
tum
Date Ship Type
Bulker Momentum
100
90
80
70
60
50
40
30Apr 2013
Jul 2013Oct 2013
Jan 2014Apr 2014
Jul 2014 Capesize
Panamax BC
Supramax BC
Handy BC

7
S&P Statscontinued
7
Volatility How much risk?
How does risk compare across vessel types?
How has risk changed over time?
Methodology
• Eliminate effects of depreciation for daily historical values for different vessel types and ages using our ‘Fixed Age Report’
• Run conditional volatility models, e.g. GARCH (1,1)
0.0
0.1
0.2
0.3
0.4
Jun 13 Jul 13 Aug 13 Sep 13 Oct 13 Nov 13 Dec 13 Jan 14 Feb 14 Mar 14 Apr 14 May 14
Vo
lati
lity
Conditional Volatility
CapesizeVLCCPost Panamax ContVLGC LPG
Dry Bulk Volatility with depreciation removed from June 2013 - May 2014 for 5 year old vessels.
Conditional Volatility

Asset Class Correlation
What is the relationship of value between different vessel types?
How best to diversify?
How has this changed over time?
Methodology
• Eliminate effects of depreciation for daily historical values for different vessel types and ages using the ‘Fixed Age Report’
• Esimating Engle’s (2002) Dynamic Conditional Correlation model on asset prices after allowing for the effects of depreciation and volatility
8
S&P Statscontinued
8
0
0.25
0.50
0.75
1.00
Apr 07 Apr 08 Apr 09 Apr 10 Apr 11 Apr 12 Apr 13 Apr 14
Co
rrel
atio
n
Capesize - Panamax BulkerPanamax Bulker - SupramaxSupramax - Handy Bulker
Changes in asset value correlation in the dry bulk sector.
Dynamic conditional correlation (DCC)

9
S&P Statscontinued
Liquidity How many vessels are being bought and sold?
What vessel types are in or out of fashion?
Which types are the most or least liquid?
How has this changed over time?
Methodology
• Intra-daily accurate and timely transaction information
• Intuitive 3D visualisation and filtering
9
S&P activity in Capesize vessels back to 2007. 12 year old vessels have had numerous periods of popularity throughout the last 7 years.
Num
ber
of
vess
els
sold
Age at the time of sale
Year of sale
Capesize - Sale and Purchase Activity18
16
14
12
10
8
6
4
2
02007
2008
2009
2010
2011
2012
20140 5 10 15 20 25 30 35 40
2013

10
AlternativeValuations
With Charter Valuations What is the value of a charter?
Methodology
• Scenario analysis
• DCF models
• Charter premium vs market analysis
• Vessel type, age and market specific non-linear depreciation profiles
Income Valuations What is the estimated long term (DCF) value of vessels, fleets, portfolios?
What are the best estimates of charter rates, OPEX etc over the life of a vessel(s)?
What is the breakeven charter rate for the current market value?
Is it time to buy or sell?
Methodology
• Predicted average charter income over vessel life
• Predicted OPEX, survey costs
• Discounted Cash Flow (DCF) models calculated for all sectors, ages and sizes
• Discount rates unique to vessel types
Key Functionality
• Assumptions can be adjusted by user
• Charter rate adjusted for features, ages etc of vessel
• Easy to use interface and exports

11
Source: Baltic Exchange
AlternativeValuationscontinued
Option Pricing What is the value of a purchase option, charter option or other structure?
Methodology
• Time varying non-linear depreciation profile of underlying assets is allowed for
• Computation of historical (conditional) volatility of the underlying after eliminating depreciation
• Incorporates non-linear profile of the strikes in a Bermudan framework
Haircut Model What is the expected Rate of Recovery following arrest and auction of a vessel?
For different vessels?
For different vessel types?
Over different market conditions?
Methodology
• Analysis of historical distressed sales/auctions and related conditions
• Comparison of distressed sale price vs VV market value at the time
• Inclusion of ‘asset recovery model’, ‘foreclosure delay densities’ and ‘asset value recovery densities’
11
8200000 8400000 8600000 8800000 9000000 9200000 9400000 9600000 9800000
60%
IMO Numbers
80%
40%
100%
% R
eco
very
0
5
10
15
20
25
30
35
40
45
50
Aug 10 Feb 11 Sep 11 Apr 12 Oct 12 May 13 Nov 13 Jun 14 Dec 14
Ass
et v
alue
s ($
M U
SD)
Asset valuePredicted recovery valueDemolition Value
Recovery rates of sample Capesize vessel through time.
Recovery rates of the Capsize fleet plotted against IMO numbers.
Recovery Rates (Capesize fleet)
Capesize Recovery : Sample Vessel

12
AIS Analytics
Automatic Position Lists* What vessels may be available – when and where?
What vessels are competing with my vessel?
What vessels are available for me to charter?
Will there be over or under-supply of vessels in certain regions or ports (supply pressure)?
Methodology
• Satellite and terrestrial AIS signal processing
• Filtration algorithms for signal processing
• Unique for vessel types and sizes
• Comprehensive combination of distances and routes
• Forward looking probabilistic framework
• Linked to VV vessels specification and ownership database
• Search, group and display by full specifications and features (VV+ functionality)
• Real time updates and on demand access
* Coming Q4 2014

Trade Flows What vessel types, fleets or owners are trading where?
How has this changed over time?
What may happen in the future?
Methodology
• Satellite and terrestrial AIS signal processing
• Complexity reduction algorithms from graph theory, computational geometry and spatial econometrics
• Filtration algorithms for signal processing
• Visualisation of trade relationships (colour) and trade volumes (thickness)
13
Source: Baltic Exchange
AISAnalyticscontinued
13
VLCC trade flows: Visualisation of trade relationships (colour) and trade volumes (thickness).

14
AIS Analyticscontinued
Average Speed What speed are vessels sailing at and are they laden or ballast?
How do different vessel types compare?
How has this changed over time and how may this affect rates?
Methodology
• Satellite and terrestrial AIS signal processing
• Vessel, operator and port database with accurate specifications
• Port, country or region level zoning to improve the granularity of the analysis
14
11.0
11.2
11.4
11.6
11.8
12.0
12.2
12.4
Spee
d (K
nots
)
Supramax Average Ballast Speed
Supramax Average Laden Speed
01/2
013
02/2
013
03/2
013
04/2
013
05/2
013
06/2
013
07/2
013
08/2
013
09/2
013
10/2
013
11/2
013
12/2
014
01/2
014
02/2
014
03/2
014
04/2
014
Average Supramax laden and ballast speed.
Supramax Average Speed

15
AISAnalyticscontinued
Congestion What is the total congestion as percentage of fleet?
What is localised congestion in particular zones, ports and regions?
How much load or discharge port congestion?
What is the correlation with rates?
Methodology
• Satellite and terrestrial AIS signal processing
• Vessel, operator and port database with accurate specifications
• Port, country or region level zoning to improve the granularity of the analysis
15
0
5
10
15
20
25
30
35
40
45
50
01/2013 02/2013 03/2013 04/2013 05/2013 06/2013 07/2013 08/2013 09/2013 10/2013 11/2013 12/2013 01/2014
No.
of
Ves
sels
Date
120hr Mov. Avg. (Port Hedland)120hr Mov. Avg. (Port Walcott)120hr Mov. Avg. (Dampier)
Number of vessels in selected Australian iron ore ports.
Australian Ports Iron Ore Congestion

Operating Performance How well are vessels operated by owners and pools?
How do owners and pools operation of vessels compare and who is the best?
What are the operational strategies of different owners and pools?
Methodology
• Satellite and terrestrial AIS signal processing
• Vessel, operator and port database with accurate specifications
• Port, country or region level zoning to improve the granularity of the analysis
16
AIS Analyticscontinued
16
These graphs show the breakdown of tanker pool performance.
8
10
12
14Jan
Feb
Mar
Apr
May
Jun
Jul
Aug
Sep
Oct
Nov
Dec
Average Ballast Speed
VLCC fleetKEY
Nova Tankers PoolSeawolf Tankers PoolTankers International PoolUnique Tankers PoolVL8 Pool
0
1
2
3
4Jan
Feb
Mar
Apr
May
Jun
Jul
Aug
Sep
Oct
Nov
Dec
Laden Underway / Ballast Underway
8
10
12
14Jan
Feb
Mar
Apr
May
Jun
Jul
Aug
Sep
Oct
Nov
Dec
Average Ballast Speed
VLCC fleetKEY
Nova Tankers PoolSeawolf Tankers PoolTankers International PoolUnique Tankers PoolVL8 Pool

17
InteractiveTools
17
LSFO Bunker Demand How much LSFO is needed in the special or restricted areas ?
What level of emissions may be produced in these areas?
Methodology
• Real time vessel movements, speed, laden/ballast using satellite and terrestrial AIS data
• Consumption estimations
• SECA / ECA and MARPOL regions included
1818
InteractiveToolscontinued
18
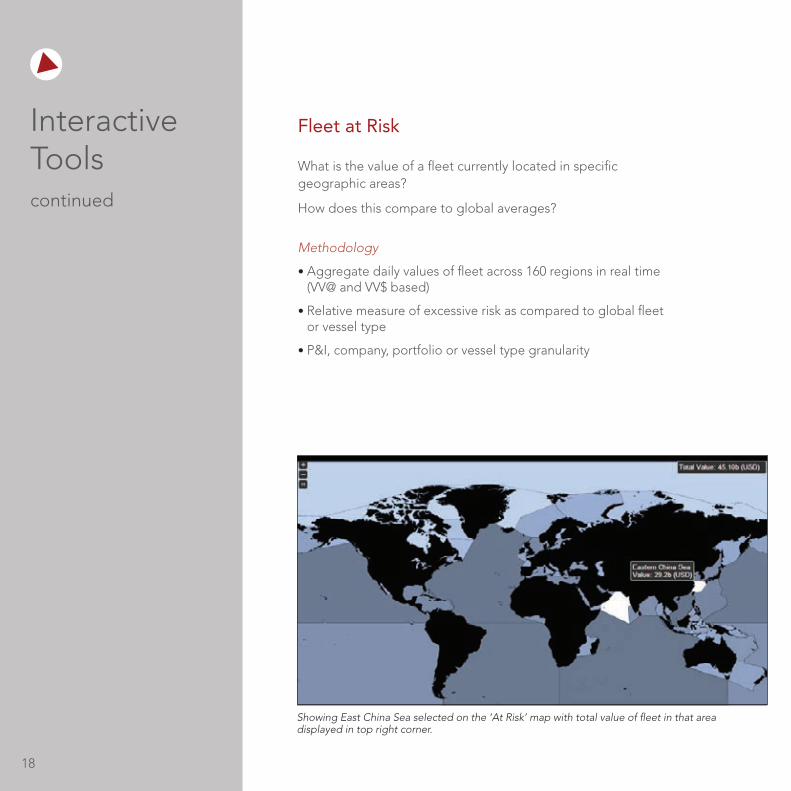
Fleet at Risk What is the value of a fleet currently located in specific geographic areas?
How does this compare to global averages?
Methodology
• Aggregate daily values of fleet across 160 regions in real time (VV@ and VV$ based)
• Relative measure of excessive risk as compared to global fleet or vessel type
• P&I, company, portfolio or vessel type granularity
Showing East China Sea selected on the ‘At Risk’ map with total value of fleet in that area displayed in top right corner.
VesselsValue Ltd 10 Barley Mow Passage Chiswick, London W4 4PH, [email protected]+44 (0) 20 8995 4364
VesselsValue Ltd is registered in England
AE0914


