1 The potential of solar photovoltaic systems for residential homes in Lagos city of Nigeria 1 K.E. Enongene* 1 , F.H. Abanda 2 , I.J.J Otene 3 , S. I. Obi 4 , and C. Okafor 5 2 1 FOKABS INC, 955 Rotary Way, K1T 0L2 Ottawa ON, Canada. 3 2 School of the Built Environment, Faculty of Technology, Design and Environment, Oxford 4 Brookes University, Oxford, OX3 0BP, UK 5 3 Department of Soil and Environmental Management, Faculty of Agriculture, Kogi State 6 University, Anyigba, P.M.B. 1008, Anyigba, Kogi State, Nigeria. 7 4 Department of Electrical/Electronics Engineering Technology, Akanu Ibiam Federal 8 Polytechnic Unwana, PMB 1007, Ebonyi State, Nigeria. 9 5 Department of Soil Science, University of Nigeria Nsukka 410001, Nigeria. 10 *Corresponding author: [email protected]11 12 Abstract: The development and use of solar photovoltaic (PV) technologies worldwide is 13 considered crucial towards fulfilling an increasing global energy demand and mitigating climate 14 change. However, the potential of a solar PV-system is location specific, influenced by the local 15 solar resource, energy demand and cost among other factors. The main aim of this study is to 16 conduct a detailed assessment of the potential of solar PV-systems in residential buildings in 17 Lagos Metropolitan Area, Nigeria. Nigeria has enormous solar energy potential, it is the most 18 populous country in Africa and occupies a significant place in the development of Africa. Yet, it 19 is a county with one of the lowest per capita electricity consumption in the world – at 149 kWh 20 per capita for a population of about 170 million, about 7% of Brazil’s and 3% of South Africa’s. 21 To achieve this goal, this study employed the survey of 150 residential buildings in three local 22 government areas (LGAs) in Lagos State, Nigeria to obtain electric load data. HOMER Pro was 23 used to size the PV-systems and to determine the levelized cost of electricity (LCOE). The 24 computed energy results of the study for the base case scenario revealed the PV array, lead acid 25
Transcript
1
The potential of solar photovoltaic systems for residential homes in Lagos city of Nigeria 1
K.E. Enongene*1, F.H. Abanda2, I.J.J Otene3, S. I. Obi4, and C. Okafor5 2
2 School of the Built Environment, Faculty of Technology, Design and Environment, Oxford 4 Brookes University, Oxford, OX3 0BP, UK 5
3 Department of Soil and Environmental Management, Faculty of Agriculture, Kogi State 6 University, Anyigba, P.M.B. 1008, Anyigba, Kogi State, Nigeria. 7
4 Department of Electrical/Electronics Engineering Technology, Akanu Ibiam Federal 8 Polytechnic Unwana, PMB 1007, Ebonyi State, Nigeria. 9
5 Department of Soil Science, University of Nigeria Nsukka 410001, Nigeria. 10
Nigeria has set a renewable energy target in the transport and electricity sectors (IRENA, 2015). 175
With respect to electricity generation, the country has a target of electricity generation from 176
renewable sources set at 9.74 %, 18 % and 20 % by 2015, 2020 and 2030 respectively (Bamisile 177
et al., 2017). Electricity generation from solar energy alone stands at 1.26 %, 6.92 % and 15.27 178
% for 2015, 2020 and 2030 respectively while the target of renewable electricity from solely 179
solar is at 12.96 %, 38.43 % and 76.36 % for 2015, 2020 and 2030 respectively indicating that 180
solar will dominate in the long-term. The revised version (November 2012) of the REMP 181
provides a list of economic and financial instruments/incentives that should be employed in order 182
to reduce the high initial investment cost of renewables so as to bolster the penetration of 183
renewables into the energy supply mix of the nation (Ozoegwu et al., 2017). These energy targets 184
and supportive renewable energy policies highlighted in the REMP are not yet binding since the 185
REMP is yet to be approved and signed into a law by the National Assembly and the Executive 186
respectively. However, the National Renewable Energy and Energy Efficiency Policy (NREEEP) 187
developed in 2013/2014 by the Federal Ministry of Power and approved in 2015 by the Federal 188
Executive Council stands in as a binding document for the REMP (Nigerian Energy Support 189
Programme, 2015). The solar electricity target of the NREEEP stands at 117 MW, 1343 MW and 190
6831 MW by 2015, 2030 and 2030 respectively. In an attempt to create a conducive environment 191
that will promote the entry of renewable energy into Nigeria, NREEEP empowers relevant 192
government ministries and federal government agencies and departments to adopt and develop 193
any of the following instruments: mandatory or voluntary renewable portfolio standards, net 194
metering framework, feed-in-tariffs, adoption of a public benefit funds, power production tax 195
credits, provision of capital grants, tax holidays and exemptions and other incentives for 196
renewable energy projects, bidding rounds through national renewable energy independent 197
10
power producer procurement program and generation disclosure requirement. According to the 198
Renewables 2015 global status report, support policies for renewable energy in Nigeria include: 199
feed-in-tariffs, biofuel obligation/mandate, public investments, loans or grants, reductions in 200
sales, energy, CO2, value-added tax (VAT), or other taxes and capital subsidy, grant or rebate. 201
Characteristics of favourable environment for the adoption and use of solar PV-Systems 202
Generally, the adoption and use of PV systems for electricity generation in residential homes 203
mainly depend on knowledge of the environmental benefit of PV systems over other source of 204
fuels for electricity generation especially fossil fuel. The consciousness of the population on the 205
environmental benefit of using PV systems over fossil fuel constitutes an enabling environment 206
for its adoption (Palm & Tengvard, 2017). Some households adopt PV systems as a way to 207
promote environmental sustainability. Furthermore, the initial cost of investment (purchase and 208
installation) of PV systems in residential homes may be high compared to electricity supply from 209
the grid system. Vasseur and Kemp (2015) reported that the competitiveness of the price of PV 210
generated electricity with the electricity supplied from the grid plays an important role in its 211
adoption and use. Hence, PV adoption and use will be favourable where electricity from PV is 212
competitive with that supplied from the grid. Also, reduced investment cost of solar PV and 213
increased dissemination of knowledge on its environmental benefits among the population are 214
favourable conditions for their adoption and use. 215
3. Methodology 216
This study surveyed residential buildings from three Local Government Areas (LGAs): Kosofe, 217
Oshodi and Alimosho in Lagos Metropolitan Area, Lagos State of Nigeria. The survey was 218
conduced using a structured questionnaire. The approach consisted of using purposeful 219
11
sampling. The purposive sampling enabled the selection of units based on particular purposes 220
linked to achieving research objectives of the study as well as representativeness and 221
comparisons among different types of cases. Lagos is divided into five Administrative Divisions 222
(Lagos, Epe, Badagry, Ikorodu and Ikeja) which are further divided into 20 Local Government 223
Areas (LGAs) and 37 Local Council Development Areas (LCDAs). The “Lagos Metropolitan 224
Area” also known as Metropolitan Lagos contains about 85 % of the population of Lagos State, 225
and includes semi-rural areas. The three LGAs (Alimosho, Kosofe, and Oshodi) selected for this 226
study fall under the five largest LGAs out of the 16 LGAs in Metropolitan Lagos - 2006 227
population census (National Population commission Nigeria, 2010). In each of the LGAs, the 228
different residential building types were identified and an equal number (10) of each building 229
type were surveyed for the collection of data. In each household surveyed, the questionnaire 230
administrator together with a household member completed the energy audit section of the 231
questionnaire while the time-of-use diary section of the questionnaire was left with the 232
household for completion. The data from the time-of-use diary was used in Microsoft Excel for 233
the computation of the hourly electricity load profile for the seven days of the week for each 234
building surveyed. The hourly energy load (in watts) for each building was obtained by summing 235
up the power rating of all the appliances used during the 24 hours period of the day and the 236
obtained value converted to kWh by dividing by 1000. The daily load profile for each dwelling 237
was obtained as an average of the load profile for the seven days of the week. The technical, 238
economic and environmental potential for the use of solar PV-systems for the onsite generation 239
and use of electricity to meet the electricity needs of the buildings was analyzed. The technical 240
and economic assessments were conducted using HOMER Pro and the economic analysis was 241
based on the Levelized Cost of Electricity (LCOE). Sensitivity analysis was performed using 242
12
HOMER Pro by varying the economic parameters (inflation and discount rates) and the solar 243
PV-system sizing parameters. 244
4. Description of survery and analysis 245
4.1. Household surveys 246
Jiboye (2014) reported five categories of residential buildings in Nigeria: duplex, single family 247
bungalow, traditional court yard, flat/apartment dwelling and ‘face-me-I-face-you’. These five 248
categories of buildings were considered for this study. Hence, while the study is conducted for 249
Lagos, results for each building type obtained in this study could be relevant for similar building 250
types in other parts of Nigeria. In each of the LGAs, 50 households (10 per building category) 251
were randomly sampled with the use of a questionnaire amounting to a total of 150 households 252
for the entire study (Table 2). The number of local governments and buildings selected in Lagos 253
Metropolitan Area were based on the existing challenges to sustainable development in these 254
areas such as limited and inefficient power supply from the grid system, environmental, 255
sociocultural, economic and administrative/legislative problems reported in previous studies 256
(Oduwaye, 2009; Otegbulu, 2011; Adama, 2017). The questionnaire was structured into four 257
different sections. Section 1 was designed to obtain socio-econimic data of the households, 258
section 2 was geared at capturing characteristics of the buildings, section 3 was desgined to 259
obtain information about the electrical applicances used in the surveyed buildings while section 4 260
was designed as a time-of-use diary to capture information related to the time and duration of use 261
of the different appliances in the buildings, as used by Enongene et al. (2017) and Manjia et al. 262
(2016). The survey had a response rate of 100%. This high response rate was due to the fact that 263
research assistants walked through the neigbourhood, handed the questionnaire and return later 264
13
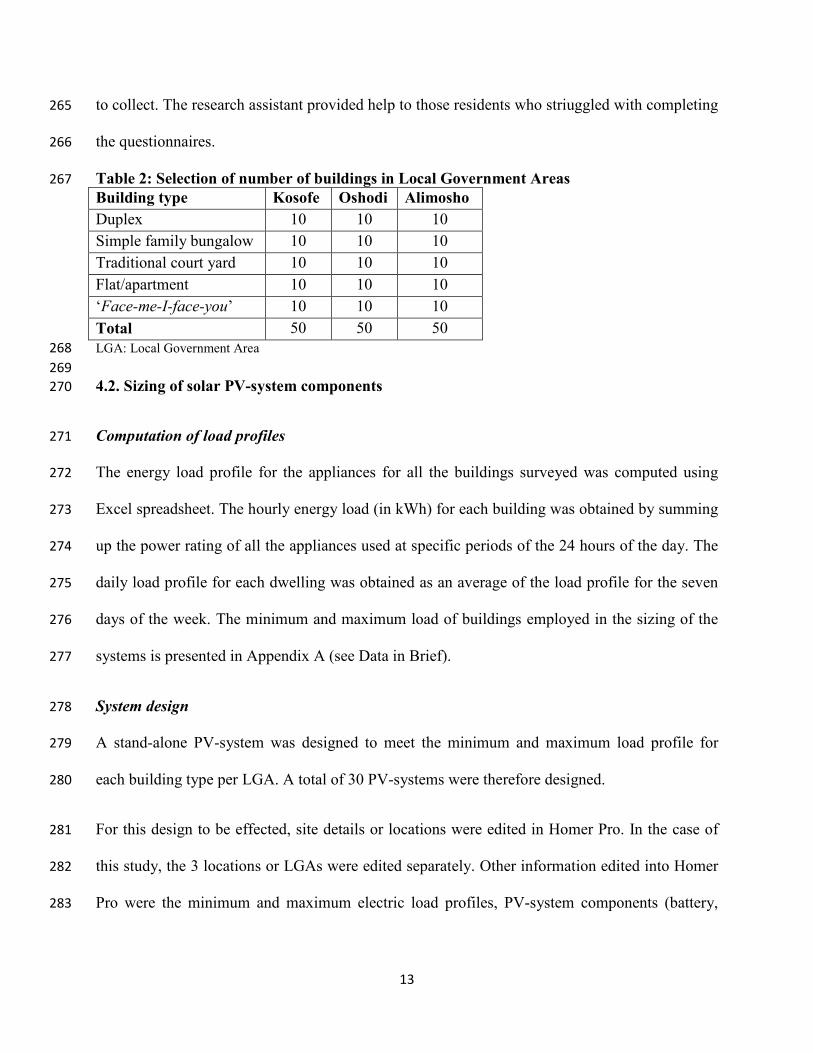
to collect. The research assistant provided help to those residents who striuggled with completing 265
the questionnaires. 266
Table 2: Selection of number of buildings in Local Government Areas 267 Building type Kosofe Oshodi Alimosho Duplex 10 10 10 Simple family bungalow 10 10 10 Traditional court yard 10 10 10 Flat/apartment 10 10 10 ‘Face-me-I-face-you’ 10 10 10 Total 50 50 50 LGA: Local Government Area 268 269 4.2. Sizing of solar PV-system components 270
Computation of load profiles 271
The energy load profile for the appliances for all the buildings surveyed was computed using 272
Excel spreadsheet. The hourly energy load (in kWh) for each building was obtained by summing 273
up the power rating of all the appliances used at specific periods of the 24 hours of the day. The 274
daily load profile for each dwelling was obtained as an average of the load profile for the seven 275
days of the week. The minimum and maximum load of buildings employed in the sizing of the 276
systems is presented in Appendix A (see Data in Brief). 277
System design 278
A stand-alone PV-system was designed to meet the minimum and maximum load profile for 279
each building type per LGA. A total of 30 PV-systems were therefore designed. 280
For this design to be effected, site details or locations were edited in Homer Pro. In the case of 281
this study, the 3 locations or LGAs were edited separately. Other information edited into Homer 282
Pro were the minimum and maximum electric load profiles, PV-system components (battery, 283
14
PV-system array and converter) technical and cost details and the solar resource data (Global 284
Horizontal Irradiation-GHI) for the study locations (LGAs). 285
Based on the edited data, HOMER Pro was used to conduct the simulation process by modelling 286
the behaviour of the system configuration each hour of the year in order to determine the 287
system’s technical feasibility and life cycle cost. This includes the optimization of the system by 288
simulating different system configurations with the objective of searching for the system that 289
satisfies the technical constraints at the lowest life cycle cost. The base case scenario calculation 290
was performed based on the following: a minimum battery state of charge (SOC) of 40%, 0% 291
maximum annual capacity shortage, 5% discount rate, 2% inflation rate and a PV-system 292
lifetime of 25 years. The capacity shortage was set at 0% in order to investigate the potential of 293
the system to serve 100% of the buildings’ load while 40% battery SOC coincides with the 294
recommended depth of discharge of the battery bank that will safeguard its lifespan. 295
Sensitivity analysis 296
HOMER Pro was used to perform sensitivity analysis based on five different variables: 297
maximum annual capacity shortage, PV-system lifetime, minimum battery SOC, inflation and 298
discount rate in order to determine their effect on the system’s LCOE. Table 3 presents the 299
sensitivity parameters used. 300
Table 3: Sensitivity parameters employed in the HOMER Pro modelling 301
Sensitivity variable Base case Sensitivity case(s) Maximum annual capacity shortage 0% 5%, 10% and 15% Discount rate 5% 10% PV-system lifetime 25 years 20 years and 30 years (e.g.
Overall, reducing the load of the buildings would reduce the PV array size and consequently, the 424
required rooftop area. Observations from field survey revealed that power ratings of appliances 425
of the residents is a major contributor to electric loads. As pointed out by Edomah and Nwaubani 426
(2014), it is imperative that minimum efficiency standards for domestic appliances be set in 427
Lagos since residential energy consumption accounts for 70 % power demand in the state. 428
Implementing policies or enforcing minimum standards for appliances will influence consumer 429
behaviour to adopting energy efficient appliances and also prohibit the importation, production 430
and sales of energy- consuming appliances. However, the Nigerian governance system on energy 431
efficiency of residential electrical appliances is weakly formulated due to lack of policy, non-432
engagement of the key stakeholders (households) in the design of agenda and participation in 433
decision-making processes, shortage of allocated resources, and the over-lapping work of 434
different governmental organizations (Gana & Hoppe, 2017). Therefore, awareness/sensitization 435
of the residents on the adoption of energy efficient appliances in their homes can be an effective 436
way to reduce electric loads. 437
Sensitivity analysis for technical specifications for system components 438
Sensitivity analysis was conducted on the annual capacity shortage (5%, 10% and 15%) and the 439
minimum battery state of charge (30%). The effect of varying annual capacity shortage and 440
minimum battery state of charge on the technical specifications of the systems designed for the 441
minimum loads of the single family bungalow building type is presented in Table 7 (See 442
Appendix B in Data in Brief for other types of buildings). 443
An overview of the results of the sensitivity analysis shows that increase in maximum annual 444
capacity shortage (from 0 – 15 %) will lead to decrease in the size of PV-system array and lead 445
23
acid battery. This is supported by the claim of Enongene (2016) that an increase in capacity 446
shortage decreases the amount of the load of the dwelling that must be met by the system and 447
consequently a reduction in the PV-system array and battery bank. However, the case is different 448
for lead acid battery in Alimosho (increase between 5- 10 % and subsequent decrease at 15 %). 449
For minimum battery state of charge (at sensitivity value of 30 %), results reveal that Alimosho 450
will require the largest size of PV-system array and lead acid battery (7 kW and 24 kWh 451
respectively). In contrast, Kosofe will require the smallest size of PV-system array (0.5 kW) and 452
lead acid battery (3 kWh). 453
Table 7: Effects of minimum battery state of charge and capacity shortage on system components 454 (for minimum loads of single family bungalow building type) 455
LGA Sensitivity value (%) PV-system array (kW)
1 kWh lead acid battery
PV-system power output (kWh/year)
Sensitivity variable: Maximum annual capacity shortage
Kosofe
0 0.6 3 839 5 0.3 3 419
10 0.3 2 419 15 0.3 2 419
Oshodi
0 4.5 19 6 291 5 2.5 12 3 495
10 2 12 2 796 15 2 8 2 796
Alimosho
0 7 28 9 787 5 4 20 5 593
10 3 22 4 194 15 3 14 4 194
Sensitivity variable: Minimum battery state of charge
Kosofe 40% 0.6 3 839 30% 0.5 3 699
Oshodi 40% 4.5 19 6291 30% 4 19 5 592
Alimosho 40% 7 28 9787 30% 7 24 9 787
456
24
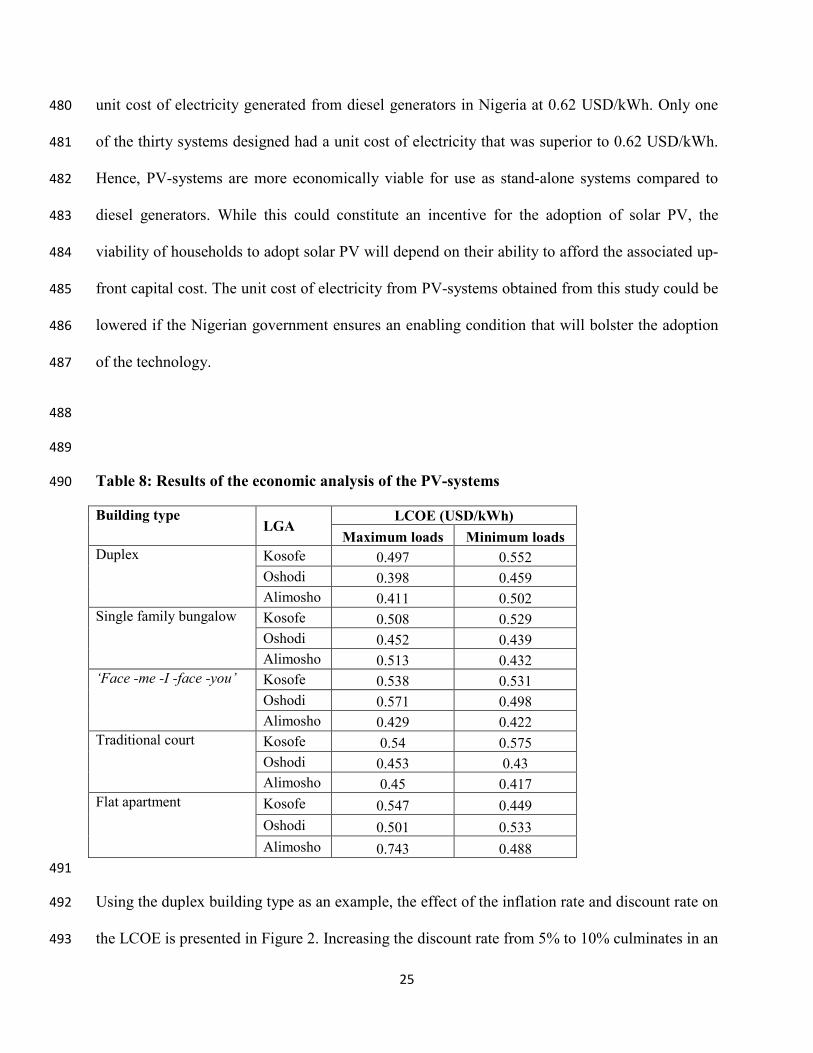
5.3. Economic analysis 457
The economic analysis results of the PV-systems in terms of the LCOE (for the base case 458
scenario) are presented in Table 8. The LCOE of electricity of the designed systems (30 systems) 459
for the base case scenario ranges from 0.398 USD/kWh (Oshodi, maximum load for duplex 460
building) to 0.743 USD/kWh (Alimosho, maximum load for flat apartment). This wide variation 461
in the LCOE could be due to the fact that there exists a difference in the nature of the loads of the 462
buildings. There are some buildings with very high loads that occur after sunshine hours and 463
such buildings require a large battery bank for energy storage to support these high night loads, 464
culminating in higher LCOE. The values of the LCOE obtained in this study are higher 465
compared to USD 0.098/kWh cost of electricity from the grid power system in some locations in 466
Nigeria. This supports the claim of Baurzhan and Jenkins (2016) that solar PV is unaffordable to 467
rural households in Sub Sahara Africa from an economic and financial perspective. Such 468
households are unable to afford the up-front capital cost of the system due to low or irregular 469
income. The range of LCOE obtained from this study is higher compared to that (0.206 470
USD/kWh to 0.502 USD/kWh) obtained by Okoye et al. (2016) for selected cities (Onitsha, 471
Kano and Lagos) in Nigeria. The LCOE obtained for the city of Lagos by the authors were 0.417 472
and 0.495 USD/kWh. Meanwhile the study by Okoye et al. (2016) considered all the components 473
of a stand-alone PV system as our study, their study used an estimated energy load data of a 474
hypothetical building (typical large household in Onitsha) for the design of the PV-system using 475
intuitive and numerical methods while in our case, household specific electricity load data for 50 476
buildings (covering five building types) were considered in the simulation of the PV systems 477
using the HOMER Pro software. Hence, the disparity that exists between the range of LCOE 478
from our study and theirs is not unexpected. Studies by Ohijeagbon & Ajayi (2014) estimated the 479
25
unit cost of electricity generated from diesel generators in Nigeria at 0.62 USD/kWh. Only one 480
of the thirty systems designed had a unit cost of electricity that was superior to 0.62 USD/kWh. 481
Hence, PV-systems are more economically viable for use as stand-alone systems compared to 482
diesel generators. While this could constitute an incentive for the adoption of solar PV, the 483
viability of households to adopt solar PV will depend on their ability to afford the associated up-484
front capital cost. The unit cost of electricity from PV-systems obtained from this study could be 485
lowered if the Nigerian government ensures an enabling condition that will bolster the adoption 486
of the technology. 487
488
489
Table 8: Results of the economic analysis of the PV-systems 490
Using the duplex building type as an example, the effect of the inflation rate and discount rate on 492
the LCOE is presented in Figure 2. Increasing the discount rate from 5% to 10% culminates in an 493
26
increase in the LCOE while an increase in the inflation rate from 2% to 5% reduces the LCOE. 494
Using the duplex building type (maximum load) for the Kosofe LGA as an example, an increase 495
in the discount rate from 5% to 10% results in an increase in the LCOE from 0.497 USD/kWh to 496
0.706 USD/kWh. The other building types for the different LGA observed the same trend 497
(Appendix C - see Data in Brief). Ayompe and Duffy (2014) witnessed a similar increasing trend 498
of the LCOE as a result of an increase in the discount rate. According to Enongene (2016), as the 499
discount rate increases, the present value of future cash flows of the PV- system is decreased 500
culminating in an increased LCOE of the system. 501
502
Figure 2: Influence of discount rate (left) and inflation rate (right) on the LCOE for the system 503 designed for the maximum load for the duplex building type. 504
An increase in the maximum annual capacity shortage decreases the LCOE of the systems. The 505
LCOE for the flat apartment building type (maximum load) for Kosofe decreased from 0.547 506
USD/kWh (0% capacity shortage) to 0.459 USD/kWh (15% capacity shortage) as can be verified 507
from Figure 3. Such a reduction in LCOE could be explained by the fact that, as the capacity 508
shortage is increased, the proportion of the building’s load to be left unmet increases and 509
consequently, load culminating in an increase in LCOE of the system (such as high load 510
0.497
0.398
0.411
0.706
0.578
0.765
0 0.2 0.4 0.6 0.8 1
Kosofe
Oshodi
Alimosho
LCOE (USD/kWh)
LG
A
LCOE (10% DR) Base case (5%)
0.497
0.398
0.411
0.388
0.307
0.411
0 0.2 0.4 0.6
Kosofe
Oshodi
Alimosho
LCOE (USD/kWh)
LG
A
LCOE (5% IR) Base case (2%)
27
occurring after sunshine hours) is left unserved. The reduction in LCOE associated with an 511
increase in capacity shortage is indicative of the fact that hybrid PV-systems are more 512
economically viable compared to the stand-alone ones. The effect of capacity shortage for the 513
other building types for the different LGAs is presented in Appendix C. A remarkable difference 514
is observed between the LCOE at 0% capacity shortage and 5% capacity shortage. Using Kosofe 515
as an example (Figure 3), the LCOE (USD/kWh) at 0% and 5% capacity shortage is 0.547 and 516
0.461 respectively culminating in a difference of 0.088. This difference is large when compared 517
to 0.002 which represents the difference in the LCOE between 5% (0.461) and 15% (0.459). 518
519
Figure 3: Influence of capacity shortage on LCOE for the maximum load of flat apartments 520
521
Regarding the effect on the PV-system lifetime on the LCOE, the PV-system lifetime is 522
inversely proportional to the LCOE of the system. A decrease in the PV-system’s lifetime from 523
25 to 20 years increases the LCOE of the system while the reverse is true for an increase in the 524
PV-system’s lifetime from 25 years to 30 years as presented in Figure 4 for the case of flat-525
0.5470.4610.4590.459
0.5010.387
0.3760.376
0.7430.475
0.4360.421
0 0.1 0.2 0.3 0.4 0.5 0.6 0.7 0.8
0% CS5% CS
10% CS15% CS0% CS5% CS
10% CS15% CS0% CS5% CS
10% CS15% CS
Kos
ofe
Osh
odi
Alim
osho
LCOE (USD/kWh)
Cap
acity
shor
tage
/LG
A
28
apartment (See Appendix C for details for the other buildings types). As reported by Enongene 526
(2016), increase in the lifetime of the PV-systems translates into more energy generated by the 527
system for the same initial capital cost and this explains a decrease in the system’s LCOE. 528
529
Figure 4: Effect of PV-system lifetime on the LCOE for the system designed for the 530 maximum load for the Flat-apartment building type 531
5.4. Environmental potential of the PV-systems 532
The environmental analysis associated with the use of solar PV-system generated electricity for 533
meeting the entire load of the buildings (0% capacity shortage) is presented in Table 9. The 534
emission reduction associated with the use of electricity from the PV-system varies with 535
different buildings. Pertaining to the high loads, the annual emission reduction varies from 76.90 536
(Traditional Court, Kosofe) to 7456.44 kgCO2eq (‘Face- me –I- face –you’, Alimosho). For the 537
low loads, the emission reduction varies from 35.95 (traditional court, Kosofe) to 2115.95 538
kgCO2eq (duplex, Alimosho). This observed variation is due to the existence of differences in 539
the daily loads of the buildings. In a nutshell, the use of electricity generated from PV-system in 540
0.591
0.547
0.83
0.529
0.482
0.707
0.529
0.466
0.678
0 0.1 0.2 0.3 0.4 0.5 0.6 0.7 0.8 0.9
Kosofe
Oshodi
Alimosho
LCOE (USD/kWh)
LG
A/P
V li
fetim
e
30 Years 25 Years 20 Years
29
each building reduces annual emissions by 63.2% compared to the business-as-usual scenario in 541
which case the buildings would solely rely on the grid to satisfy their respective electricity 542
requirements. 543
Table 9: Annual emission reductions (kgCO2eq) associated with the use of PV-system 544 generated electricity in buildings 545
Building types Kosofe Oshodi Alimosho Maximum loads
Single family bungalow 493.56 3025.76 2001.86 Flat Apartment 370.58 1887.20 2615.87 ‘Face- me –I- face –you’ 254.56 3673.65 7456.44 Duplex 697.97 3930.15 3723.08 Traditional court 76.90 748.85 1830.43
Minimum loads Single family bungalow 66.46 528.95 822.69 Flat apartment 84.29 99.95 587.58 ‘Face -me –I- face- you 31.24 382.61 1394.63 Duplex 132.49 347.39 2115.95 Traditional court 35.95 71.32 173.88 546
6. Conclusion and Policy implications 547
This study focused on the assessment of the technical, economic and environmental potential of 548
onsite PV-systems for generating electricity in different residential building types in the Lagos 549
Metropolitan Area of Nigeria. 550
The computed energy results of the study for the maximum load of buildings for the base case 551
scenario revealed the PV array, lead acid battery and the converter (inverter) of the PV-systems 552
to be in the following range: 0.3 to 76 kW; 2 to 176kWh; and 0.1 to 13.2 kW respectively. For 553
the minimum load of the buildings, the results of the PV array, lead acid battery and converter of 554
the system were found to be in the following order: 0.3 to 7kW; 2 to 80 kWh; 0.1 to 5.4kW 555
respectively. Results of the economic analysis revealed a LCOE of the systems in the range of 556
30
0.398 USD/kWh to 0.743 USD/kWh for maximum loads and 0.422 USD/kWh to 0.552 557
USD/kWh for minimum loads. The use of PV-system generated electricity in the dwellings have 558
potential for an annual reduction of greenhouse gas emissions in the range of 76.90 gCO2eq to 559
7456.44 kgCO2eq (for maximum loads) and 31.24 gCO2eq to 2115.95 kgCO2eq (for minimum 560
loads). Generally, from a technical perspective, solar PV-systems have the potential for use as a 561
stand-alone source of electrical energy in the different categories of residential buildings in 562
Lagos, Nigeria. While the LCOE for the PV-systems is lower than that of diesel generator used 563
by households, it is high compared to the LCOE of the grid. 564
The promotion of an enabling environment for the adoption and use of solar PV-system in 565
residential buildings will support the attainment of Nigeria’s mitigation target spelt out in the 566
country’s nationally determined contribution (NDC). However, just creating a favourable 567
environment for the adoption and use of PV-systems may not constitute a solution to all 568
dwellings. For instance, this study revealed a building with high electric load which requires a 569
PV array size greater than the available rooftop area. For such a building, a reduction in the 570
electric load through energy efficiency measures would reduce the size of the PV-array, 571
rendering the rooftop adequate to accommodate the PV array. Therefore, there is need for the 572
government of Nigeria to use a mix of energy policy options that can support the deployment and 573
uptake of solar PV-systems in the country on the one hand, while reducing residential energy 574
consumption through the promotion of energy efficiency on the other hand. 575
Future research should investigate periods during the day which power outages occur and based 576
on this information, explore the possibility of designing a solar PV-system grid-connected hybrid 577
system for the residential buildings. 578
31
Acknowledgement 579
The authors would like to thank the Economic Community of West African States (ECOWAS) 580
Centre for Renewable Energy and Energy Efficiency (ECREEE) for funding this study. We 581
would also like to thank Monica Maduekwe, Yuri Lima Handem and Francis Kemausuor for 582
reviewing the manuscript. Lastly, we thank Ana Apueyo for developing a poster from this work 583
for presentation at the ECOWAS Centre for Renewable Energy and Energy Efficiency 584
(ECREEE) 2nd Edition of the ECOWAS Sustainable Energy Forum (ESEF2018) from 13 -15 585
November 2018 at the Radisson Blu Hotel in Dakar, Senegal. 586
587
588
32
References 589
Abanda, F., Manjia, M., Enongene, K., Tah, J., & Pettang, C. (2016). A feasibility study of a 590 residential photovoltaic system in Cameroon. Sustainable Energy Technologies and Assessments, 591 17, 38-49. 592
Adama, O. (2017). Urban imaginaries: funding mega infrastructure projects in Lagos, Nigeria. 593 GeoJournal. doi: 10.1007/s10708-016-9761-8 594
Adaramola, M. S. (2014). Viability of grid-connected solar PV energy system in Jos, Nigeria. 595 International Journal of Electrical Power & Energy Systems, 61, 64-69. 596
Adaramola, M. S., Paul, S. S., & Oyewola, O. M. (2014). Assessment of decentralized hybrid PV 597 solar-diesel power system for applications in Northern part of Nigeria. Energy for Sustainable 598 Development, 19, 72-82. 599
Adejumobi, I., Adebisi, O., & Oyejide, S. (2013). Developing small hydropower potentials for 600 rural electrification. International Journal of Research and Reviews in Applied Sciences, 17(1), 601 105-110. 602
Aldossary, N. A., Rezgui, Y. & Kwan, A. (2014). Domestic energy consumption patterns in a hot 603 and arid climate: A multiple-case study analysis. Renewable Energy 62, 369-378. 604
Ahemen, I., Amah, A. N., & Agada, P. O. (2016). A survey of power supply and lighting 605 patterns in North Central Nigeria -The energy saving potentials through efficient lighting 606 systems. Energy and Buildings, 133, 770-776. doi: 607 http://dx.doi.org/10.1016/j.enbuild.2016.10.029 608
Ajao, K., Oladosu, O., & Popoola, O. (2011). Using HOMER power optimization software for 609 cost benefit analysis of hybrid-solar power generation relative to utility cost in Nigeria. 610 International Journal of Research and Reviews in Applied Sciences, 7(1), 14. 611
Ajayi, O. O., & Ajayi, O. O. (2013). Nigeria's energy policy: Inferences, analysis and legal ethics 612 toward RE development. Energy Policy, 60, 61-67. doi: 613 http://dx.doi.org/10.1016/j.enpol.2013.05.095 614
Akinyele, D., Rayudu, R., & Nair, N. (2017). Life cycle impact assessment of photovoltaic 615 power generation from crystalline silicon-based solar modules in Nigeria. Renewable Energy, 616 101, 537-549. 617
Akorede, M., Ibrahim, O., Amuda, S., Otuoze, A., & Olufeagba, B. (2017). Current status and 618 outlook of renewable energy development in Nigeria. Nigerian Journal of Technology, 36(1), 619 196-212. 620
Akpan, U. S., Isihak, S. R., & Udoakah, Y.-O. N. (2013). Electricity access in Nigeria: Viability 621 of off-grid photovoltaic system. Paper presented at the AFRICON, 2013. 622
Akuru, U. B., Onukwube, I. E., Okoro, O. I., & Obe, E. S. (2017). Towards 100% renewable 623 energy in Nigeria. Renewable and Sustainable Energy Reviews. doi: 624 http://dx.doi.org/10.1016/j.rser.2016.12.123 625
Ayompe, L. M. and Duffy, A. (2014). An assessment of the energy generation potential of 626 photovoltaic systems in Cameroon using satellite-derived solar radiation datasets. Sustainable 627 Energy Technologies and Assessments 7, 257-264. 628
Ayodele, T. R. & Ogunjuyigbe, A. S. O. (2015). Increasing household solar energy penetration 629 through load partitioning based on quality of life: The case study of Nigeria. Sustainable Cities 630 and Society, 18, 21 – 31. 631
Azodo, A. P. (2014). Electric power supply, main source and backing: A survey of residential 632 utilization features. International Journal of Research Studies in Management, 3(2). 633
Bamisile, O., Dagbasi, M., Babatunde, A., & Ayodele, O. (2017). A review of renewable energy 634 potential in Nigeria; solar power development over the years. Engineering and Applied Science 635 Research, 44(4), 242-248. 636
Baurzhan, S. & Jenkins, P. (2016). Off-grid solar PV: Is it an affordable or appropriate solution 637 for rural electrification in Sub-Saharan African countries? Renewable and Sustainable Energy 638 Reviews, 60, 1405-1418. 639
Brander, M., Sood, A., Wylie, C., Haughton, A. & Lovell, J. (2011). Technical Paper | 640 Electricity-specific emission factors for grid electricity. Retrieved from: 641 https://ecometrica.com/assets/Electricity-specific-emission-factors-for-grid-electricity.pdf 642
Bukar, A. L., Modu, B., Gwoma, Z. M., Mustapha, M., Buji, A. B., Lawan, M. B., Mai, K. B. 643 (2017). Economic Assessment of a PV/Diesel/Battery Hybrid Energy System for a Non-644 Electrified Remote Village in Nigeria. European Journal of Engineering Research and Science, 645 2(1). 646
Diemuodeke, E. O., Hamilton, S., & Addo, A. (2016). Multi-criteria assessment of hybrid 647 renewable energy systems for Nigeria’s coastline communities. Energy, Sustainability and 648 Society, 6(1), 26. doi: 10.1186/s13705-016-0092-x 649
Edomah, N., & Nwaubani, S. (2014). Energy security challenges in developing African mega 650 cities: the Lagos experience. Built Environment, 1-9. 651
Elum, Z. A., Modise, D. M., & Nhamo, G. (2016). Climate change mitigation: the potential of 652 agriculture as a renewable energy source in Nigeria. Environmental Science and Pollution 653 Research, 1-14. doi: 10.1007/s11356-016-8187-7 654
Emagbetere, E., Odia, J., & Oreko, B.U. (2016). Assessment of Household Energy Utilized For 655 Cooking In Ikeja, Lagos State, Nigeria. Nigerian Journal of Technology (NIJOTECH), 35 (4), 656 796 – 804. 657
Enongene, K. E. (2016). Feasibility of a solar photo-voltaic system as an energy source for 658 lighting in grid-connected residential buildings in Cameroon: Case study of Buea (master’s 659 thesis, Massey University, Palmerston North, New Zealand). 660
Enongene, K. E., Murray, P., Holland, J. & Abanda, F. H. (2017). Energy savings and economic 661 benefits of transition towards efficient lighting in residential buildings in Cameroon. Journal of 662 Renewable and Sustainable Energy Reviews, 78, 731-742. 663
Fadare, D. (2009). Modelling of solar energy potential in Nigeria using an artificial neural 664 network model. Applied Energy, 86(9), 1410-1422. 665
Fotsing, F. I. M., Njomo, D. & Tchinda, Rene (2014). Analysis of Demand and Supply of 666 Electrical Energy in Cameroon: Influence of Meteorological Parameters on the Monthly Power 667 Peak of South and North Interconnected Electricity Networks. International Journal of Energy 668 and Power Engineering. 3(4), 168-185. doi: 10.11648/j.ijepe.20140304.12 669
Gana, J., & Hoppe, T. (2017). Assessment of the Governance System Regarding Adoption of 670 Energy Efficient Appliances by Households in Nigeria. Energies, 10(1), 132. 671
Giwa, A., Alabi, A., Yusuf, A., & Olukan, T. (2017). A comprehensive review on biomass and 672 solar energy for sustainable energy generation in Nigeria. Renewable and Sustainable Energy 673 Reviews, 69, 620-641. 674
Guda, H. A. & Aliyu, U. O. (2015). Design of a Stand-Alone Photovoltaic System for a 675 Residence in Bauchi. International Journal of Engineering and Technology, 5(1), 34-44. 676 Ikejemba, E. C., & Schuur, P. (2016). Locating solar and wind parks in South-Eastern Nigeria 677 for maximum population coverage: a multi-step approach. Renewable Energy, 89, 449-462. 678
International Energy Agency. (2010). Energy Poverty: How to make modern energy access 679 universal? Special early excerpt of the World Energy Outlook (WEO) 2010 for the UN General 680 Assembly on the Millennium Development Goals. (Paris, 2010) p. 9, 20. Available from 681 http://www.iea.org/publications/freepublications/publication/weo-2010---special-report---how-682 to-make-modern-energy-access-universal.html 683
International Renewable Energy Agency (IRENA), Renewable Energy Target Setting June 2015. 684
International Energy Agency (IEA, 2017). Key World Energy Statistics; International Energy 685 Agency: Paris, France. 686
Jiboye, A. D. (2014). Significance of house-type as a determinant of residential quality in 687 Osogbo, Southwest Nigeria. Frontiers of Architectural Research, 3(1), 20-27. 688
IPCC, 2014: Summary for Policymakers. In: Climate Change 2014: Mitigation of Climate 689 Change. Contribution of Working Group III to the Fifth Assessment Report of the 690 Intergovernmental Panel on Climate Change [Edenhofer, O., R. Pichs-Madruga, Y. Sokona, E. 691 Farahani, S. Kadner, K. Seyboth, A. Adler, I. Baum, S. Brunner, P. Eickemeier, B. Kriemann, J. 692 Savolainen, S. Schlömer, C. von Stechow, T. Zwickel and J.C. Minx (eds.)]. Cambridge 693 University Press, Cambridge, United Kingdom and New York, NY, USA. 694
Manjia, M. B., Abanda, F. H. & Pettang C. (2015). Household energy appliances in Cameroon. 695 Environmental Management and Sustainable Development, 4(1): 73–84. 696
Mellersh N. (2015) A scramble for power – the Nigerian energy crisis explained. Available from 697 https://www.africanlawbusiness.com/news/5679-a-scramble-for-power-the-nigerian-energy-698 crisis-explained 699
National Bureau of Statistics (NBS, 2016). LSMS-Integrated Surveys on Agriculture General 700 Household Survey Panel 2015/2016. National Bureau of Statistics Abuja, Nigeria. 701
National Bureau of Statistics (NBS, 2017). Premium Motor Spirit (Petrol) Price Watch for April 702 2017. National Bureau of Statistics Abuja, Nigeria. 703
National Population commission Nigeria (2010). 2006 Population and Housing Census. Pp 64. 704 Retrieved from catalog.ihsn.org/index.php/catalog/3340/download/48521 705
Nigerian Electricity Regulatory Commission (NERC, 2017). How Much Do I Pay for 706 Electricity? Retrieved from http://nerc.gov.ng/index.php/home/consumers/how-much-do-i-pay-707 for-electricity 708
Njoku, H. (2016). Upper-limit solar photovoltaic power generation: Estimates for 2-axis tracking 709 collectors in Nigeria. Energy, 95, 504-516. 710
Novoselac, A. Cetin, K. S. & Tabares-Velasco, P. C. (2014). Appliance daily energy use in new 711 residential buildings: Use profiles and variation in time-of-use. Energy and Buildings, 84, 716-712 726. 713
Oduwaye, L. (2009). Challenges of Sustainable Physical Planning and Development in 714
Metropolitan Lagos. Journal of Sustainable Development, 2(1), 159-171. 715
Ofikhenua, J. (2014). Power supply drops to 2,954.51 MW. The Nation Newspaper 14th 716 December 2014. Retrieved from: http://thenationonlineng.net/new/power-supply-drops-2954-717 51mw/ 718
Ogunjuyigbe, A.S.O., Ayodele T.R. & Oladimeji, O.E. (2016). Management of loads in 719 residential buildings installed with PV system under intermittent solar irradiation using mixed 720 integer linear programming. Journal of Energy & Buildings, 130 (15), 253-271 721
Okoye, C. O., & Taylan, O. (2017). Performance analysis of a solar chimney power plant for 722 rural areas in Nigeria. Renewable Energy, 104, 96-108. 723
Okoye, C. O., Taylan, O., & Baker, D. K. (2016). Solar energy potentials in strategically located 724 cities in Nigeria: Review, resource assessment and PV system design. Renewable and 725 Sustainable Energy Reviews, 55, 550-566. doi: http://dx.doi.org/10.1016/j.rser.2015.10.154 726
Olaoye, T., Ajilore, T., Akinluwade, K., Omole, F., & Adetunji, A. (2016). Energy Crisis in 727 Nigeria: Need for Renewable Energy Mix. American Journal of Electrical and Electronic 728 Engineering, 4(1), 1-8. 729
Olaniyi O. (2017) Research: Tackling the energy crisis in Nigeria – a case for solar. Available 730 from https://www.ntusbfcas.com/african-business-insights/content/research-tackling-the-energy-731 crisis-in-nigeria-a-case-for-solar 732
Olatomiwa, L., Mekhilef, S., & Ohunakin, O. S. (2016). Hybrid renewable power supply for 733 rural health clinics (RHC) in six geo-political zones of Nigeria. Sustainable Energy Technologies 734 and Assessments, 13, 1-12. 735
Olaniyan, K., McLellan, B.C., Ogata S., & Tezuka, T. (2018). Estimating Residential Electricity 736 Consumption in Nigeria to Support Energy Transitions. Sustainability, 10(.;1440), 1-22. 737 doi:10.3390/su10051440 738
Oluseyi, P. O., Babatunde, O. M., & Babatunde, O. A. (2016). Assessment of energy 739 consumption and carbon footprint from the hotel sector within Lagos, Nigeria. Energy and 740 Buildings, 118, 106-113. doi: http://dx.doi.org/10.1016/j.enbuild.2016.02.046 741
Oparaku, O. (2002). Photovoltaic systems for distributed power supply in Nigeria. Renewable 742 Energy, 25(1), 31-40. 743
Osunmuyiwa, O., & Kalfagianni, A. (2016). Transitions in unlikely places: Exploring the 744 conditions for renewable energy adoption in Nigeria. Environmental Innovation and Societal 745 Transitions. 746
Otegbulu, A.C. (2011). Economics of Green Design and Environmental Sustainability. Journal 747 of Sustainable Development, 4(2), 240-248. 748
Oyedepo, S. O. (2012). Energy and sustainable development in Nigeria: the way forward. 749 Energy, Sustainability and Society, 2(1), 15. 750
Ozoegwu, C. G., Mgbemene, C. A., & Ozor, P. A. (2017). The status of solar energy integration 751 and policy in Nigeria. Renewable and Sustainable Energy Reviews, 70, 457-471. doi: 752 http://dx.doi.org/10.1016/j.rser.2016.11.224 753
Ozoegwu, C. G., Mgbemene, C. A., & Ozor, P. A. (2017). The status of solar energy integration 754 and policy in Nigeria. Renewable and Sustainable Energy Reviews, 70, 457-471. doi: 755 http://dx.doi.org/10.1016/j.rser.2016.11.224 756
Palm, J. & Tengvard, M. (2017). Motives for and barriers to household adoption of small-scale 757 production of electricity: examples from Sweden. Sustainability: Science, Practice and Policy, 6-758 15. 759
REN21 (2015). Renewables 2015 global status report. REN21 Secretariat, Paris. Retrieved from: 760 http://www.ren21.net/wp-content/uploads/2015/07/REN12-GSR2015_Onlinebook_low1.pdf 761
Riti, J. S., & Shu, Y. (2016). Renewable energy, energy efficiency, and eco-friendly environment 762 (R-E5) in Nigeria. Energy, Sustainability and Society, 6(1), 13. doi: 10.1186/s13705-016-0072-1 763
Sambo, A. S. (2008a). Matching electricity supply with demand in Nigeria. 764 International Association of Energy Economics. Fourth Quarter, Pp.32-36. 765 Retrieved from https://www.iaee.org/documents/newsletterarticles/408sambo.pdf 766 767 Sambo, A. S. (2008b). Renewable energy options for the environment and sustainable 768 development in Nigeria. Natl. Work. Energy Invest. Priv. Sect. Particip. Pet. Train. Inst. Warri; 769 4th–5th June, 2008 770
Sesan, T. (2008). Status of renewable energy policy and implementation in Nigeria. Institute of 771 Science and Society, Faculty of Social Sciences, Law and Education, University of Nottingham, 772 United Kingdom. Retrieved from: http://www.gbengasesan.com/temidocs/REPStatusNigeria.pdf 773
Shabaan, M. & Petinrin, J. O. (2014). Renewable energy potentials in Nigeria: Meeting rural 774 energy needs. Renewable and Sustainable Energy Reviews, 29, 72 – 78. 775
Sherwani, A. F., Usmani, J. A., & Varun. (2010). Life cycle assessment of solar PV based 776 electricity generation systems: A review. Renewable and Sustainable Energy Reviews, 14(1), 777 540-544. doi: http://dx.doi.org/10.1016/j.rser.2009.08.003 778
Su, M., Chen, C., & Yang, Z. (2016). Urban energy structure optimization at the sector scale: 779 considering environmental impact based on life cycle assessment. Journal of Cleaner 780 Production, 112, Part 2, 1464-1474. doi: http://dx.doi.org/10.1016/j.jclepro.2015.01.059 781
The Nigerian Energy Support Programme (2015). The Nigerian Energy Sector -an Overview 782 with a Special Emphasis on Renewable Energy, Energy Efficiency and Rural Electrification, 2nd 783 Edition, June 2015 784
United Nations (2015). Goal 7 - Ensure Access to Affordable, Reliable, Sustainable and Modern 785 Energy for All. Retrieved from: https://unchronicle.un.org/article/goal-7-ensure-access-786 affordable-reliable-sustainable-and-modern-energy-all 787
Vasseur, V. & Kemp, R. (2015). The adoption of PV in the Netherlands: A statistical analysis of 788 adoption factors. Renewable & Sustainable Energy Reviews, 41, 483-494. 789
Vera, I., & Langlois, L. (2007). Energy indicators for sustainable development. Energy, 32(6), 790 875-882. doi: http://dx.doi.org/10.1016/j.energy.2006.08.006 791