35
WA T E R ACCOUNTING Guidance on Good practices for Cement Sustainability Initiative (CSI)

W A T E R
Accounting
guidance on good practices for
Cement Sustainability Initiative (CSI)

IV
Contents
1 INTRODUCTION ........................................................................................................................................... 2
2 WATER ACCOUNTING REQUIREMENTS ................................................................................................... 2
2.1 Operational site boundaries ............................................................................................................... 2
2.2 Site water flow ..................................................................................................................................... 2
3 WATER ACCOUNTING ................................................................................................................................. 3
3.1 Water accounting requirements and principles ................................................................................. 4
4 MEASUREMENT METHODS ....................................................................................................................... 7
4.1 Forced flow (full pipe) meters ............................................................................................................. 7
4.1.1 Selecting forced flow meters .................................................................................................... 8
Flow meters: Installation, maintenance and callibration ................................................................ 10
4.2 Open channel / free flow meters ...................................................................................................... 11
4.2.1 Sharp-crested weirs ................................................................................................................ 11
Measuring open channels ................................................................................................................ 13
Open channels: Installation, maintenance and calibration ............................................................. 14
4.2.2 Parshall flume .......................................................................................................................... 15
Parshall flumes: Installation, maintenance and calibration ............................................................ 17
5 CALCULATION BY MEASUREMENT ........................................................................................................ 18
5.1 Volume measurement ....................................................................................................................... 18
5.2 Speed area method........................................................................................................................... 18
5.3 Calculating water use of dust control container .............................................................................. 20
5.4 Analysis of water content in the end product .................................................................................. 20
5.5 Pump flow rate and pump operating hours ..................................................................................... 21
5.6 Third-party invoices .......................................................................................................................... 21
6 CALCULATION BY ESTIMATION METHODS ............................................................................................ 22
6.1 Pump capacity and pump operating hours ..................................................................................... 22
6.2 Calculating natural evaporation ....................................................................................................... 23
6.3 Calculating precipitation ................................................................................................................... 23
7 DATA MANAGEMENT ................................................................................................................................ 24
8 GLOSSARY................................................................................................................................................. 26

V
Annexes
Annex 1 Water flow diagrams ......................................................................................................................... 28
Annex 2 Secondary elements ......................................................................................................................... 31
Annex 3 Indicative values for process water consumption (generic ranges) ............................................... 31
Tables
Table 1 Water withdrawal sources and CSI reporting requirements ............................................................. 4
Table 2 Receiving bodies for water discharge and CSI reporting requirements .......................................... 4
Table 3 Water consumption ............................................................................................................................. 5
Table 4 Most common meters ......................................................................................................................... 8
Table 5 General guidelines for pressurized pipe flow meters ........................................................................ 8
Table 6 Values for Parshall flumes by size and discharge. .......................................................................... 16
Table 7 Advantages and disadvantages of continuous and periodic monitoring ....................................... 24
Figures
Figure 1 Three main water accounting methodologies defined ..................................................................... 3
Figure 2 Example of volumetric flow rate for reusing or recycling water ....................................................... 6
Figure 3 Front and side views of a sharp-crested weir ................................................................................. 11
Figure 4 Measuring water height .................................................................................................................... 13
Figure 5 Diagram of a weir .............................................................................................................................. 14
Figure 6 Parshall flume illustration ................................................................................................................. 15
Figure 7 Flow speed distribution in a channel by cross-section and speed profile ..................................... 18
Figure 8 Cross-section of a watercourse divided into equal sections .......................................................... 19
Figure 9 A manufacturer’s pump performance curve .................................................................................... 22
Figure 10 Water accounting balance sheet ...................................................................................................... 25

2
1 INTRODUCTION
This Guidance is a companion document to the Protocol
for Water Reporting for the Cement Industry1 (‘the
Protocol’) of the Cement Sustainability Initiative (CSI).
The Protocol sets out the requirements for disclosure
and benchmarking, based on the kind of operations,
and specific reporting requirements for cement plant
operations, aggregate installations and ready-mix
concrete (RMC) operations.
The Guidance offers recommendations, technical
direction and methodologies on measurement and
making estimates for a reliable accounting of water
withdrawals, discharges and consumption, to improve
the accuracy of water accounting by companies.
The recommendations featured in this document cover
cement, aggregates and RMC operations.
Recommendations cover these areas:
• Pre-requisites for water accounting, defining site
boundaries and identifying water in-flows and water
out-flows from the site;
• Measuring, selecting, installing and maintaining
measurement devices;
• Methodologies to calculate by measurement, when
continuous or direct readings from meters are not
available, and for calculating by estimation as a third
option. Alternatives to gauging water consumption in
aggregate and RMC operations are included;
• Recording and managing meters and water data; and
• Indicative values for cement operations to help users
assess water consumption for accounting purposes.
2 WATER ACCOUNTING REQUIREMENTS
2.1 Operational site boundaries
The first step in water accounting is to set clear
operational site boundaries. The boundaries define
the limit or extent to which water data and indicators
are considered. Site boundaries are defined according
to the Protocol and include all activities and operations
on-site for the production of goods and related
activities,including offices, housekeeping, and
landscaping.
Not included in the operational site boundaries:
• On-site captive power plant;
• Water supplied to communities or on-site housing; and
• Storm water run-off and discharges.
2.2 Site water flow
Credible data on water flow relies on a clear
understanding of all site water flows. The site water
flows are presented in the Protocol (refer to the Protocol,
page 5, for a diagram of site perimeter and CSI water-
associated indicators). This step must be followed at
each facility with the operational managers, as they
understand and control the processes.
A site water flow diagram is the equivalent of the process
flow diagram for production. It illustrates water flows
into all site boundaries and identifies the sources from
where the water is withdrawn, as well as the sites where
the water is used, consumed, recycled and discharged.
It is a visual of all water flows and is easy for someone
unfamiliar with the site to understand.
1 The CSI Protocol for Water Reporting, www.wbcsdcement.org/water
Calculation by estimation
Calculation by measurement Measurement
De�nition: Water volume is gauged by multiplying rated capacity of the pump manufacturer and pump operating hours; or by using an empirical formula with assumed factors, such as calculating evaporation or in�ltration rates.
De�nition: Water volume is gauged by short-term or instant measurement, by multiplying measured �ow rate and pump operational hours; or by the difference between two measurements, such as water withdrawal and discharge.
De�nition: Quanti�cation of water volume according to the water instantaneously passing by the cross-section of a channel or a pipe, using �ow measurement or a meter.
Accuracy

3
To develop a water flow diagram, identify the following
items:
• Operational site boundaries
• All water in-flows and out-flows
• Water withdrawals and discharges and receiving
bodies, if possible
• Water use distribution, focusing on major water
consumers
• Where meters should be installed, and where
calculation by measurement or estimation is
acceptable
Typical water flow diagrams for cement plant operations,
aggregates installations and ready-mix concrete
operations are in Annex 1 (page 28).
3 WATER ACCOUNTING
Select the appropriate measurement or calculation
methodology to fit the monitoring location. This Guidance
include methodologies provided by CSI company
members, to help determine the CSI water indicator
volumes.
CSI water indicators are the following:
• Total water withdrawal by source (G4 EN8)
• Total water discharge by quality and destination
(G4EN22)
• Total water consumption (GWT – CSI)
• Percent of sites with water recycling. For a
operations, this is comprised of two indicators:
(i) Percent of sites with water process; (ii) Percent
of sites with a water recycling system
CSI companies are free to use other methodologies
for specific conditions, if they comply with Protocol
requirements and conform to the principles in this
Guidance.
Broadly speaking there are three categories of water
accounting methodologies:
• Measurement
• Calculation by measurement
• Calculation by estimation
Calculation by estimation
Calculation by measurement Measurement
De�nition: Water volume is gauged by multiplying rated capacity of the pump manufacturer and pump operating hours; or by using an empirical formula with assumed factors, such as calculating evaporation or in�ltration rates.
De�nition: Water volume is gauged by short-term or instant measurement, by multiplying measured �ow rate and pump operational hours; or by the difference between two measurements, such as water withdrawal and discharge.
De�nition: Quanti�cation of water volume according to the water instantaneously passing by the cross-section of a channel or a pipe, using �ow measurement or a meter.
Accuracy
Figure 1 Three main water accounting methodologies defined

4
3.1 Water accounting requirements and principles
Water indicator definitions, discussed in detail in the
Protocol, and water accounting requirements, are
detailed here.
Total water withdrawal: All water drawn into the
boundaries of the reporting organization from all sources,
including surface water, groundwater, used quarry
water, municipal water, and harvested rainwater,
for any use during the reporting period. Table 1 below
summarizes water withdrawal sources and the
Protocol reporting requirements.
Specific conditions exist for rain and storm water runoff,
collected on the site and discharged without being used,
and for water collected in the quarry and discharged
without being used (refer to the Protocol).
Rain, storm water runoff and water collected in the quarry
and discharged without being used are not included in
water withdrawal, discharge or consumption.
Total water discharge: Water effluents discharged during
the reporting period to ocean, surface, subsurface/well,
off-site water treatment, through a defined discharge
point (point source discharge), over land in a dispersed
or undefined manner (non-point source discharge),
or wastewater removed from the reporting organization
by truck.
Domestic sewage discharge should be included in total
water discharge.
Water source Withdrawal source
Freshwater source
Non-fresh water source
Surface water from rivers, lakes, natural ponds2
Yes Yes Yes6
Groundwater from wells, boreholes2
Yes Yes Yes6
Used quarry water, collected in the quarry3
Yes Yes Yes6
Municipal potable water4
Yes Yes No
External wastewater
Yes Yes Yes6
Harvested rainwater5
Yes No No
Sea water, water extracted from the sea or the ocean
Yes No Yes6
Table 1 Water withdrawal sources and CSI
reporting requirements
Table 2 Receiving bodies for water
discharge and CSI reporting requirements
Receiving water body
Discharge
Freshwater Non-fresh water
Ocean Yes Yes
Surface water Yes Yes6
Subsurface / well Yes Yes6
Off-site water treatment
Yes Yes6
Beneficial / other use Yes Yes6
2 Includes sources inside or outside site boundaries
3 Could be from rain, groundwater or surface water
4 Includes water bought from the public grid
5 Includes water collected, stored and used for process and non-process purposes.
6 Includes brackish or saline sources

5
Total water consumption: Consumption removes water
from a system and makes it unavailable for further use.
It includes water evaporated for cooling purposes or
from water storage facilities, lost via transmission,
or incorporated into an organization’s products and
onsite uses.
It can be calculated as follows:
This Guidance recommend identifying and quantifying
major water consumption items as listed in Table 3 below.
Total water
consumption includes
rainwater harvested on site
for any use. It differs from
total freshwater consumption,
which excludes harvested
rainwater.
Cement Aggregate RMC
Slurry for wet process or granulation for the semi-dry or semi-wet process
Wet screening Concrete production
Cooling mechanical equipment (such as cement coolers)
Aggregates washing Mixer & equipment washing
Cooling of materials (e.g. injection into clinker cooler)
Ready-mix truck washing
Exhaust gas conditioning
Emission controls such as flame cooling, deNOx SNCR, and SO2 scrubber
Waste heat recovery systems
Dust control by watering roads, materials and stockpiles
Support and ancillary operations such as office buildings, general services, maintenance workshops and garages
Irrigation for greening and rehabilitation within site boundaries
Domestic use
Natural evaporation
Leakage and loss
Table 3 Water consumption *(Excludes reusing or recycling water)
water consumption =
water withdrawal -
water discharge

6
Water recycling and reuse: Water can be recycled and
reused within a site boundary. Water can be reused for
the same purposes, in a closed cooling loop for cement,
or in a washing process for aggregate; or for other
purposes, such as cleaning equipment and trucks,
and for road maintenance and irrigation.
Quarry dewatering: Pumping water from a quarry to
lower the water level in the quarry to obtain a dry area.
The water collected could be from rain, ground or surface
water. The portion of water from quarry dewatering used
on site should be reported as ‘quarry water used’ and is
included in water withdrawal in Table 1 (page 4). In areas
under water stress or high water stress as defined by the
Global Water Tool for the Cement Sector 2 the unused
portion of water from quarry dewatering should be
publicly reported as ‘quarry water not used’ because (i) of
its potential impact on the local watershed, which must
be assessed, and (ii) it is not water withdrawal according
to the Protocol. In other areas, public reporting of this Key
Performance Indicator (KPI) is a company decision.
For more information on data management see
Chapter 7 (page 24). Indicative values for cement water
processing are provided in Annex 3 (page 31). Links are
given to a source for indicative values for other industries.
FromIn�uentSources
Q=1000m3/yr
To ReceivingWaterbody/ EntityZ=1000m3/yr
RA = 200 m3/yr
RB = 100 m3/yr
QA = 800 m3/yr
QB = 400 m3/yr
Y = 1200 m3/yr
Note: In this example it is assumed that there are no losses from Process A and Process B
ZS = 1100 m3/yr
ZA = 600 m3/yr
ZB = 500 m3/yr
Water Recycling/Reuse Flowate = RA + RB = 300m3/yrWater Recycling/Reuse (%) = (RA + RB)/Q = 30%
Site Boundary
Process A
Process B
Figure 2 Example of volumetric flow rate for reusing or recycling water
2 www.wbcsdcement.org/index.php/key-issues/water

7
4 MEASUREMENT METHODS
Measurement offers the most accurate and reliable
methodology for water accounting. However, it is a
company decision to install measurement devices
on water withdrawal, water discharge and the major
consumption points.
There are different devices for measuring the volume or
flow rate of water passing through a pipe or channel.
Meters offer the most accurate and reliable way to gauge
water flow, and ensure accurate and continuous flow
records. It is important to choose a suitable water meter
based on:
• Water quality – In some cases, such as for turbine
meters, trash caught in the meter causes readings
to be high, low or non-existent. This problem can
be solved by using a strainer or filters ahead of the
meter. Others, such as electromagnetic meters require
water containing ions, and an electrical insulating pipe
surface requires a rubber-lined steel tube.
• Range of flow – the lowest to highest pumping rate
needed by the operator. In some cases, a meter that
measures the lowest rate for a system may not be
able to measure the highest rate. A meter should be
selected so the lowest anticipated flow is measured
at or near 100% accuracy. Also, for highest accuracy,
the meter should operate near the midrange of its
capability.
• Consistency of flow or turbulence – some meters are
usually best for measuring medium to high flows but
occasionally for low flows as well.
• Availability of power – When selecting meters for
remote locations, consider if the meter can run
accurately on solar power, batteries or even without
power.
• Ease of access – The meter must be easily accessible
for reading and inspection. It must not be blocked by
equipment or other obstacles or be located in a site of
frequent flooding.
• Cost – Generally the more accurate and reliable the
meter, the more expensive it is. Other costs than
the purchase price to consider are for installation,
maintenance, data collection, calibration and longevity.
Meters may be equipped with many options, such as data
loggers and telemetry that can relay real time data. In-line
meters fall into two categories.
4.1 Forced flow (full pipe) meters
Two main methods of flow measurement are commonly
used for water accounting:
• Volume displacement
• Velocity
Displacement meters, such as rotary piston meters or
rotating disk meters, are based on the movement of a
mobile element in direct relation to the amount of water
passing through. They are suitable and are most accurate
at low to moderate flow rates of clean water sources,
such as boreholes, municipal networks, and springs.
Velocity meters measure the speed of the fluid through
an element of a known internal capacity. The speed can
be converted into a volume. This includes single- or multi-
jet meters, turbine meters, electromagnetic meters and
ultrasonic meters.

8
Each meter has pros and cons. To ensure accurate and robust monitoring, pay attention to selection, installation and maintenance.
4.1.1 Selecting forced flow meters
A meter should match the system configuration, otherwise the readings and recordings will not be accurate.
Turbine meters / impeller meters Electromagnetic meters
•a rotor or turbine is turned by water flowing through it
•The rotor is mechanically connected to a register on the outside of the pipe, which records the amount of water that has passed through the meter
•No power needed
•Special versions allow some weeds or small particles to pass through
•Work by electromagnetic induction
•No moving parts, more reliable
•Less prone to fouling
•Little or no head loss
•Power supply or battery required
Table 4 Most common meters
Meters Advantages Disadvantages
Displacement meters
Rotary piston meters
•High accuracy and, repeatability
•High resistance to wear
•Used with fairly clean liquids only
Nutating disk meters
•Constructed from a variety of materials.
•High accuracy and repeatability
•Accuracy harmed by viscosities below the meter's designated threshold
Velocity meters
Multi-jet meters
•Highly reliable metering technology
•Pipe preceding the meter does not need to be straight
•Good resistance to suspended solids
•Competitive price
•Not suitable for very small diameters
•For high flows, registering capacity is small
•Starting flow rates not low enough to detect most leaks
Turbine meters
•High accuracy and repeatability
•Handles viscous flow
•Cost-effective
•Accuracy by changes in viscosity
•Requires little maintenance
•Typical construction materials susceptible to corrosion
Table 5 General guidelines for pressurized pipe flow meters

9
Meters Advantages Disadvantages
Velocity meters
Electromagnetic meters
•Low pressure drop
•No moving parts means less wear, no routine maintenance
•Insensitive to density, viscosity, pressure, temperature and flow profile
•Usable for a variety of otherwise difficult to meter waters
•Accurate
•Relatively low cost
•Measures independently of temperature, pressure, density, viscosity, and electrical conductivity
•Measures forward and reverse flow
•Liquids must be conductive
•Nearby electromagnetic noise causes interference
•Will not work in partially full pipes, even if electrodes are wet
•Requires lengths of straight pipe upstream and downstream
•Allowing sludge and greasy waters to flow too slowly causes buildup, which affects measurement
Ultrasonic meters
•Non-invasive, so no drop in pressure
•Eliminates local mechanical and electrical noise, allowing use in a variety of locations
•Works with a variety of pipe sizes and flow conditions
•Measures independently of temperature, pressure, density, viscosity, and electrical conductivity
•High resistance to wear and sensor fouling
•Easy installation
•Requires relatively clean water
•Excess solids or entrained gases may block ultrasonic pulses

10
Flow meters: Installation, maintenance and calibration
installation
A poorly installed water meter will give incorrect readings. Follow manufacturer’s instructions when installing and operating meters.
Installation includes these instructions:
• Locatemeternearaspracticallypossibletothesourceofabstraction.
• Nobranchconnectionsbetweenthemeterandthesource.
• Fitastrainerbeforefittingthemeter.
• Protectmeterfromfrost.
• Avoidhighpointsthattrapair.
• Fitturbinemeterswithlengthsofstraightrigidpipeofthesamediameterasthemeteronbothsides.
Inlet or upstream length should be at least 10 times, and outlet or downstream length should be at least
five times the nominal diameter of the meter.
• Metersshouldbeatleast20timestheirnominaldiameterdownstreamofapump.
• Metersmustalwaysbefullofwaterwhenrunning.
• Metersmustbesafelyaccessibleforreading,maintaining,andinspecting.
• Registermustbeclearlyreadable.
• Handlemeterwithcare.
• Forameterwithanelectronicoutput,anywiringbetweenmeterandregistermustbeaccessibleforinspection.
• Protectreadingsonelectronictotalizersfromsupplyinterruptions.
Maintenance and calibration
A meter’s performance declines with time, leading to inaccurate readings. As a result, a maintenance protocol must be set up according to the manufacturer’s instructions. Systematic records must be kept of maintenance and calibration checks.
These steps must be taken so the meter functions optimally:
• Metersmustbestoredwiththeirendssealed.
• Examinemetersregularlyforwearandtear,corrosionanddamage,accordingtohowcleanthewater
is and the meter type.
• Keepinsidesofthemetercleanandfreefromfouling.
• Changebatteriesregularly.
• Conductcalibrationcheckstomakesuremetersareperformingatanacceptablestandard.Thefrequencyof
these checks often depends on water quality, use of meter, and environmental factors concerning the water
source. For example, turbine meters in sand and gravel should be checked every three years, electromagnetic
meters on a clean water source every seven years. A calibration laboratory should conduct full checks and be
certified.
10

11
4.2 Open channel / free flow meters
An open channel system refers to any conduit in which
liquid flows within a free surface via gravity, and not under
pressure. For the permanent and precise measurement
of the flow in open channels it is recommended to use
structures (known as primary elements). If properly
calibrated, a flow equation can be used to calculate the
instantaneous flow, depending on the geometry of the
structure, hydraulic characteristics of flow, losses and
hydraulic heads. The most used structures are sharp-
crested weirs and Parshall flumes.
4.2.1 Sharp-crested weirs
Sharp-crested weirs are fixed or removable hydraulic
devices that consist of vertical plates with a sharp edge in
the upstream face (see Figure 3 below). This type of weir
operates on the principle that any blockage in a channel
will cause water to back up, creating a high level head
behind the barrier. The head, or depth of water flowing
over the weir, relates to the flow rate over the weir. The
deeper the water flowing over the weir blade, the higher
the flow rate.
Front view
L
H
p
p’
B
Side view
Nappe
Figure 3 Front and side views of a sharp-crested weir
Where:H = Hydraulic head on the crest L = Length of the crestB = Width of the access channel
Sharp-crested weirs can be classified according to the following criteria:
• Shape of notch or weir blade: rectangular, triangular (v-notch), and trapezoidal.
• Relative height of crest: full or free weirs (p > p’) and incomplete or submerged weirs (p < p’).
• Length of crest: weirs without side contractions (L = B) and weirs with contractions (L < B).

12
When a weir is built and installed properly, measurement accuracy ranges from 85% to 95%.
The experimental equations of the most commonly used weirs for flow measurement in open channels are the following:
Rectangular with contraction:
Rectangular without contraction:
Triangular (v-notch):
This type of weir is widely used for measuring small flows (< 120 L/s). The most commonly used have a notch
angle of 90° and 60°.
Trapezoidal:
Where:Q = Flow C = Experimental coef�cient
Q = C * L * H3/2
L
H
Where:Q = Flow C = Experimental coef�cient (1.859)
Q = C * tan (φ/2) * H5/2
L
H Ø
Where: Q = Flow
Q = Flow
Q = 3,3 * L * H3/2 L
H
Where:Q = C * L * H3/2 L
H

13
Measuring open channels
Please take these factors into account when measuring flow in a weir:
• Flowdependsonhowfastthewaterarrivesintheweir.Ifitisrapid,flowincreasesandmeasurementisaffected,
so it is important to dam the water by expanding the upstream channel section to get minimum speeds
(<0.15 m/s).
• Checkforcontinuousflowinthechannel,sowaterremainsataconstantheight,andmakesurethereis
no turbulence, so surface waves are avoided.
• Becausethenappeiscontractedneartheweir,headHshouldbemeasuredupstreamatadistanceequal
to or greater than six times the expected maximum hydraulic head, but never below 2.5H. Use a piezometer
to get the measurement of head H, or place a stake level with the crest of the weir; and measure the height
of the water above the stake with a rule, as in Figure 4 below.
Figure 4 Measuring water height (H)
• Tocalculateflow,aweirmusthaveacalibrationequation.Anexperimentalwaytogetthisequationisby
assuming the following factors: a hydrostatic pressure distribution exists upstream, implying velocity distribution
is uniform; the free surface is horizontal until the plane of the weir and all particles that pass over it are moved
horizontally; viscosity and surface tension are negligible; pressure across the nappe is atmospheric. To get the
calibration equation, several volumetric gauges must be taken, measuring about 10 in each hydraulic head H.
Using a spreadsheet such as Excel, a relationship between variables H and Q can be established and a trend line
can be added to get the equation.
• Therearetwomaindrawbackstothismethod:highheadloss;andifthewatercontainssuspendedsolids,
they will be deposited in the pool forming upstream, which gradually modifies the discharge coefficient.
H Nappe
WeirStake
Channel bottom
Rule
6H
13

14
Open channels: Installation, maintenance and calibration
installation
Figure 5 below shows parts of the weir that must be taken into account during installation:
Figure 5 Diagram of a weir
These instructions should be generally followed:
•Aimtoinstalltheweiratthehighendofalongchannel,longenoughorabouteighttimesthewidthoftheweir;
and deep enough so the water near the weir is free of eddies and turbulence is at a speed below 0.15 m/s.
•Placetheweirperpendiculartothestreamonastraightuniformsectionofthechannel,suchthatupstreamthe
distance is at least 10 times the length of the crest (10xL).
• Buildthecrestandsidesoftheweirnotchatamaximumthicknessof1/8”(3mm).
• Designthestructureforthemaximumheadinthewatercourse,ofnomorethanonethirdthelengthofthecrest.
• Theweircrestshouldbeedge-shaped,toreducetheeffectsofviscosityandsurfacetensionandtoallowforlow
heads on the crest, so the nappe does not easily stick.
• Avoidblockagesintheupstreamsideoftheweirtopreventimmersionoftheweirdischarge.
• Makesurethecrestisstraight,level,andwellcut.
• Theheightoftheweircrestabovethechannelbottom(D)mustbeaboutthreetimesthewaterhead(H).The
distance between sides of the weir notch and the channel walls (C) should be not less than twice the head (H),
except in weirs without contraction.
• Thewidthofthechannelmustbecompletelycoveredbytheweirsotheentireflowpassesovertheweir.
• Hvaluesshouldbebetween0.06and0.6m.
• Thev-notchweirsarerecommendedforsmallheads.
• Forrectangularortrapezoidalweirs,theheightmustbemaximum1/3thelengthoftheweir.
• Sharp-crestedweirsareusuallycutonwood,plastic,fiberglass,metalplates,orothersmoothmaterials,which
increases the coefficient in the calibration equation. The notches can be made of beveled metal.
• Sharp-crestedweirsaretypicallyusedtomeasureflowratesbelow300L/s.
Maintenance and calibration
Channels and regular elements of the structure must be reviewed regularly for preventive maintenance as follows:
• Aimtomaintaindesignconditions.
B
D
HC
L
14

15
• Regularlyreviewchannelsandperformperiodicalremovalofsedimentandaquaticweedsatthebottom
of the channel upstream, Sediments and other obstructions alter the flow direction, resulting in inaccurate readings.
• Revisetheconditionandpositionoftherulesandotherinstrumentsusedforheadmeasurement,checkingwith
topography when necessary.
• Verifythepositionandlevel(horizontal)oftheweircrest,andconducttheproperconservationwork.
• Fixleaksinweirwall.
• Checktheconditionofsideandfloorwallsandconductconservation.
• Twiceayear,updatethecalibrationcurve(headvsflow)byperformingdetailedmeasurementsatdifferentlevels.
Compare the calibration curve with the theoretical curve (obtained from empirical equation).
4.2.2 Parshall flume
Parshall flume is a sort of open Venturi tube which
consists of an input section with converging vertical
walls and horizontal bottom, a narrowed throat of parallel
walls and descendant bottom and an outlet section with
diverging walls and ascendant bottom (see Figure 6 below).
This throat causes an elevation of the water level as a
function of flow. The throat width (W) is used to indicate
the size of the flume, i.e., a Parshall flume of 9" has a
throat width of 9" (0.23 m).
Head measurement point (Ha)
Head measurement point (Hb)
Diverging section
CW
A
D 2/3 A
Crest
Throat
Converging section
Plan view
Side view
Slope: 1/4
HaHbChannel bottom
Free discharge
Water surface
Figure 6 Parshall flume illustration
Where:
W = throat widthA = length of the sidewall of the converging section2/3 A = distance from the crest to the point of head (Ha) measurementHa = head in the converging sectionHb = head in the throatD = width of the upstream end of the �ume at the inlet of the convergent sectionC = width of the downstream end of the �ume at the exit of the divergent section

16
These flumes have the following advantages:
self-cleaning; operate with a relatively low head loss
so they can be used in fairly shallow channels with low
slope; increasing speed in the throat prevents particle
sedimentation; resistance to chemicals, as they can be
built in different materials, and for permanent facilities,
they can be built with concrete. A measurement accuracy
of nearly 98% can be achieved.
A Parshall flume usually operates under free flow
conditions with the critical depth in the contracted
section (throat) and a hydraulic jump in the diverging
section. However, sometimes the hydraulic jump can be
submerged (submerged flow) when the downstream level
is high enough to influence and delay the flow through the
flume.
In free flow conditions, measuring the head Ha is enough
to gauge the flow (at a distance equivalent to two-thirds
the length of the sidewall of the converging section,
i.e., 2/3A according to Figure 6 above). If the meter is
submerged, a second head Hb must be measured at a
point close to the final section of the throat (see Figure 6
above). For example, for flumes of 0.15 m to 2.4 m, the
position for Hb measurement should be placed 0.05 m
upstream of the final part of the throat. For measuring
hydraulic heads, install a ruler in the channel wall, or
use piezometers. The ratio Hb/Ha is the degree of
submergence (S). This relation determines whether the
discharge is free flow or submerged flow.
When the degree of submergence is over 95%, ability to
determine flow is uncertain.
The following equations can be used to gauge the
discharge in Parshall flumes:
Free flow:
The constants K and n can be calculated experimentally to
get the calibration equation of the flume. Tables of K and n
values are available for flumes of different widths (W).
Submerged flow:
Submergence delays the flow, reducing discharge.
In this case, the actual flow rate is lower than flow rate
using the free flow equation above. To get the actual flow
rate correct, a correction factor (C) must be applied using
the following expression:
The value of c can be measured, where C is related with
Ha, S and W.
Flume size (m) Free discharge Submerged discharge
W < 0.30 S < 0.6 (60%) 0.6 < S < 0.95 (95%)
0.30 < W < 2.50 S < 0.7 (70%) 0.7 < S < 0.95 (95%)
2.50 < W < 15 S < 0.8 (80%) 0.8 < S < 0.95 (95%)
Table 6 Values for Parshall flumes by size and discharge
Q = K Han
Where: C = Correction (L/s)Q = K Han - C
Q = K Han
Where: C = Correction (L/s)Q = K Han - C

17
Parshall flumes: Installation, maintenance and calibration installation
For proper installation, follow these guidelines:
• Avoidmajorturbulenceintheinitialsection,anddonotinstallrightafteragateorcurve,becauseturbulence
could create waves or eddies that would damage accuracy. Install in a straight section of the channel without
obstructions, such as gravel or sandbars to ensure a uniform flow. The distance upstream of the flume should be
at least 10 times the channel width.
• Watercoursespeedalongtheupstreamchannelshouldbelowerthanthecriticalspeed.
• Buildarampwithanupwardslopeof1:4rightbeforetheconvergingsection,ifpossible.
• Thewidthoftheflumethroatmustbehalftoone-thirdthechannelwidth.
• Installtheflumecresttocreateafreedischargedownstream.Butifconditionsdonotallow,maintaintherate
of submergence Hb/Ha below 95%.
• Goodoperationofafumereliesoninstallingitatthecrest,atasuitableheightabovethechannelbottom,to
make sure that at the water level upstream the flume is not above the free edge of the channel.
Maintenance and calibration
Conduct these activities to properly manage the structures:
• Reviewdesigndimensionsperiodically.
• Checkthelevelorslopeofbottomplatesandverticalwalls.
• Checkhydraulicconditionsofoperation,suchasthetypeofflowordegreeofsubmergence.
• Becauseweedsusuallygrowonthewallsandsedimentaccumulatesatthebottomoftheentrancetotheflume,
periodic cleaning of these areas is recommended. For metal flumes, oxides must be removed with a metal brush.
• Topreventcorrosionandrustformation,coattheflumewithasphaltpainttoextendthelifeofthedevice.
• Atleasttwiceayeardodetailedgaugingatdifferentlevelstogetthecalibrationcurve(relationhead–flow)
and compare with the theoretical curve from equations.
17

18
5 CALCULATION BY MEASUREMENT
For the flows that are not metered, calculation by
measurement could be used. Such methodologies
include:
• Volume measurement
• Speed – area method
• Dust control consumption
• Laboratory measurement of water in product
• Pump instant measured flow rate and pump operating
hours (hour meter)
• Invoices from third parties
5.1 Volume measurement
A container of known capacity is filled with water.
The total volume is recorded to quantify water use.
This method can be used when the watercourse or
discharge has a drop of water in which a bucket can
be placed. It can be used to gauge small discharges,
by measuring the filling time (t) of a bucket of known
volume (V). The flow rate (Q) is determined by dividing
the volume of water collected in the container by the
elapsed time in collecting it. The longer it takes, the
greater the accuracy.
Follow this equation:
Graduated buckets with marked lines to indicate
calibrated volumes are commonly used. In other
cases, the measurement is done on larger tanks with
exact dimensions. The bucket must get 100% of the
flow, with no loss, and the time measurement must be
accurate by using a stopwatch, which must be activated
simultaneously when the bucket fills and stopped when
the bucket is removed. Once the flow rate is taken, it is
multiplied with the running hours of this flow to calculate
total water flow for a specific period. Because this is
done manually, and manipulating the instruments can
cause errors, it is not recommended as a permanent
measurement system.
5.2 Speed area method
Since the flow rate of a watercourse can be gauged
by multiplying the cross sectional area of the channel
by the average flow speed, this procedure is based on
these variables. In this method flow is laminar and flow
lines are normal to the cross section. The speed should
be measured at points of the cross section where the
average speed has been attained.
In a channel, the maximum speed occurs between 5%
and 25% of the depth, and the minimum speed shifts
onto the walls of the channel, where the roughness tends
to stop the advance of the current. The average speed is
located at about 60% of the depth. Figure 7 below shows
the typical speed distribution for a channel.
Where:Q = Flow rate (L/s)V = Collected volume (L)t = Filling time (s)
Q = V / t
Maximum speed
DepthAverage speed
Minimum speed
Channel bottom
b)a)
Figure 7 Flow speed distribution in a channel by a) cross-section and b) speed profile
19
The most reliable way to measure flow speed is using a
secondary element (see appendix for more information).
For example, the most common instrument is a current
meter. When it is immersed in a watercourse, it rotates in
proportion to the speed of the watercourse.
To measure the speed of a watercourse with a current
meter follow these recommendations:
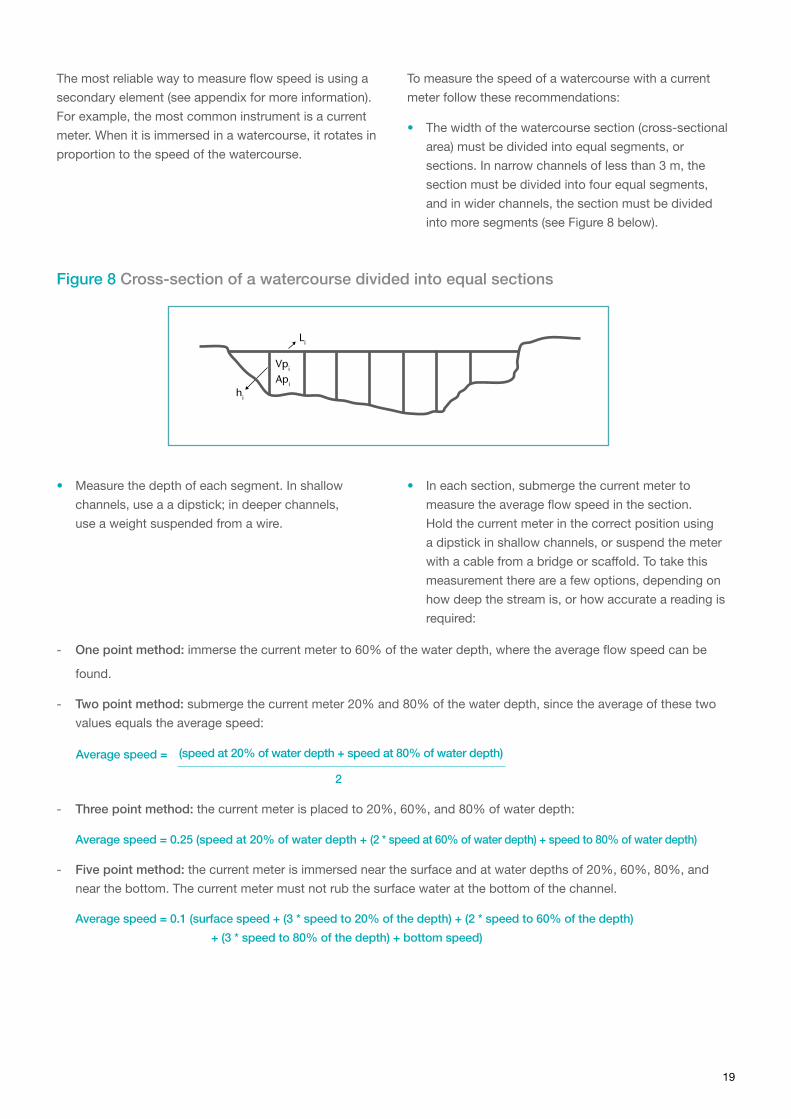
• The width of the watercourse section (cross-sectional
area) must be divided into equal segments, or
sections. In narrow channels of less than 3 m, the
section must be divided into four equal segments,
and in wider channels, the section must be divided
into more segments (see Figure 8 below).
Li
hi
Vpi
Api
Figure 8 Cross-section of a watercourse divided into equal sections
• Measure the depth of each segment. In shallow
channels, use a a dipstick; in deeper channels,
use a weight suspended from a wire.
• In each section, submerge the current meter to
measure the average flow speed in the section.
Hold the current meter in the correct position using
a dipstick in shallow channels, or suspend the meter
with a cable from a bridge or scaffold. To take this
measurement there are a few options, depending on
how deep the stream is, or how accurate a reading is
required:
- One point method: immerse the current meter to 60% of the water depth, where the average flow speed can be
found.
- Two point method: submerge the current meter 20% and 80% of the water depth, since the average of these two
values equals the average speed:
(speed at 20% of water depth + speed at 80% of water depth)
2
- Three point method: the current meter is placed to 20%, 60%, and 80% of water depth:
Average speed = 0.25 (speed at 20% of water depth + (2 * speed at 60% of water depth) + speed to 80% of water depth)
- Five point method: the current meter is immersed near the surface and at water depths of 20%, 60%, 80%, and
near the bottom. The current meter must not rub the surface water at the bottom of the channel.
Average speed = 0.1 (surface speed + (3 * speed to 20% of the depth) + (2 * speed to 60% of the depth)
+ (3 * speed to 80% of the depth) + bottom speed)
Average speed =

20
• Measure the total flow rate based on the partial
flows, as follows:
The total flow rate is calculated by adding up the
partial flows, as follows:
To calculate total water flows for a specific period,
the total flow rate is multiplied with the running hours
of the flow. For more information on secondary elements
for measuring water flow using the speed-area method,
see Annex 2 (page 31).
5.3 Calculating water use of dust control container
In many sites, small water tank wagons are used to reduce dust on roads. Always count this as a withdrawal when water
is taken from outside operational boundaries. This formula can be used to estimate water use:
5.4 Analysis of water content in the end product
This method applies to aggregates and to RMC
operations. To calculate the volume of water consumed
in the end product, the laboratory analysed water content
in the final product can be multiplied by the production
volume.
Water consumed for aggregates washing can be gauged
by laboratory measurement of the water content, using
samples collected from the product stockpile.
The water content in the product should be evaluated
periodically for each aggregate specification according
to grading. The evaluation should be done once a month.
Take the sample from freshly produced material, to
eliminate effects of precipitation and natural evaporation.
This procedure is based on a standard quality control
test. The water content is calculated by the differential of
the mass between a raw aggregate sample (with humidity)
and once it has been dried. Use the following guidance
to develop a formal procedure that a quality control
technician can support.
• Sample the material in freshly-produced aggregates,
to avoid humidity loss
• Vary the mass of material sampled by size. Small
aggregates require less material
• Weigh the raw material: The volume of aggregates
sample is weighed as it is sampled, and humidity is
determined. The mass is noted
• Dry the material of the sample in an oven at 110°C
until the mass is constant, then cool at room temperature
• 12 hours at 110 °C is usually sufficient. Material will
dry easily if sprayed in a pan
• Once the material is at room temperature, weigh the
sample and note its dry mass
• Assess the water content, by subtracting the dry mass
from the raw mass divided by the dry mass:
% of water = (weight of raw sample) – (weight of dry sample) * 100
weight of dry sample
Where:Qpi = Partial �ow rate of section iApi = Partial area of section iVpi = Partial average speed of section i
Qpi = Api * Vpi
Where: QT = Total �ow rate QT = ΣQpi
Where:Qpi = Partial �ow rate of section iApi = Partial area of section iVpi = Partial average speed of section i
Qpi = Api * Vpi
Where: QT = Total �ow rate QT = ΣQpi
WV = TwV x no. of loads Where:
wv = Water volume(i.e. discharged)TwV = Volume of the tank

21
In ready-mix operations, weighing systems used in the
ready mix concrete mixer can be used to measure the
water added in concrete production and for other uses,
such as mixer washing. These systems are usually
linked to a recording device or software for online data
acquisition, such as the batch plant Programmable Logic
Controller (PLC) .
Alternatively, measurement of the water in the ready-mix
concrete can be determined through measurement
on-site of the water content in the freshly-produced
concrete. A sample of freshly produced concrete is dried
at 80°C to 110°C in a pan or an oven until its mass is
constant, and the total water content is determined.
5.5 Pump flow rate and pump operating hours
The volume of water pumped during a period of time is
calculated using this equation:
Volume of water
=
time * measured flow rate
To determine the pump flow rate, measure the water flow
periodically with a portable flow meter and use measured
flow, instead of pump capacity. Hour meters only record
the pumping time. The flow rate must be measured at
least once a quarter in stable conditions and more often
if operating conditions change significantly. For example,
if the water level changes in the pump basin that
generates a head lift, or if a pump is relocated or
replaced. The main drawback with this method is that it
does not account for pump fluctuation over time, which
could cause less precise readings of flow rates.
5.6 Third-party invoices
Meters belonging to a third party can at times be as
reliable as direct readings from meters. Measuring
devices belonging to third parties, such as city meters,
should be verified, if there is access to read a meter on
site. Check invoices to make sure accurate data are
reported.
Where:WV = Water volume (i.e. discharged)
WV = TwV x no. of loads

22
6 CALCULATION BY ESTIMATION METHODS
For unmeasured flows, calculation by estimation techniques can be useful, including:
• Pump capacity and pump operating hours
• Calculating evaporation and storm water flow volumes
6.1 Pump capacity and pump operating hours
Use of theoretical pump flow rate is not recommended
because it may deviate significantly from the actual flow
rate. However, in the absence of other information, this
method may be used.
Theoretical pumping flow
The theoretical flow rate at the final discharge outlet can
be calculated by combining the pump capacity and the
head losses through the piping system. The manufacturer
typically provides a graphical representation of the
performance of its pump.
The pump curve describes the behaviour of the flow rate
as a function of the total head loss. According to the
pump setup, the pump manufacturer calculates the total
head losses and then the theoretical flow rate, using the
pump performance curve.
Once the theoretical pump rate is calculated, it is
multiplied with the running/operating time of the pump
to get the total water flow for a certain period.
Total Head
300
280
260
240
220
200
180
160
140
120
100
80
60
40
20
0
FTM
90
80
70
60
50
40
30
20
10
0
PSI130
120
110
100
90
80
70
60
50
40
30
20
10
00 1 2 3 4 5 6 7 8 9 10 11 12 13 14 15 16 17 18 19 20
0 2 4 6 8 10 12 14 16 18 20 22 24 26 28 30 32 34 36 38 40 42 44 46
0 1 2 3 4 5 6 7 8 9 10 11 12 13
S6 B
S6 A
S6 C
CUBIC METERSPER HOUR
LITERSPER SECOND
U.S. GALLONSPER MINUTE x 100
x 10
x 10
COMPOSITE OF PERFORMANCE CURVES - 6“Curves are based on a speci�c gravity of 1.0
Figure 9 A manufacturer’s pump performance curve

23
6.2 Calculating natural evaporation
Natural evaporation can have a huge impact on water
consumption. In large open areas, wind, temperature, and
humidity affect the evaporation rate.
Natural evaporation cannot be measured, but it can be
estimated using available empirical equations.
6.3 Calculating precipitation
You can estimate precipitation based on the quantity
of precipitation and the size of the catchment area.
The volume of precipitation used can be estimated by
multiplying the precipitation and the catchment area
factor.
Volume of precipitation
A pluviometer installed onsite or consigned data
published by a government or meteorological institute can
both be used to gauge the volume of precipitation.
Pluviometer - also called a rain gauge, it measures the
depth of water from precipitation at a point. It is the most
reliable method, because it is site specific.
Principle: A pluviometer collects precipitation in a
container open to the sky. The precipitation that falls into
the container is measured, by mass or by volume. The
measure is recorded by sight or by an automatic weather
station.
Precision: Weather conditions affect accuracy.
Heavy winds, low precipitation, a mix of liquid and
solid precipitation, and freezes may cause a false
measurement. For snow, specific gauges are available.
To boost precision, install the pluviometer in an open area
without objects such as trees or buildings that would
interfere with collecting rain water.
Consigned data - meteorological data from a recognized
agency, such as a government body or meteorological
institute. These organizations uphold high standards
of measurement that include all precipitation, including
snow. However, since the data are not site-specific, an
on-site pluviometer is preferable, but not mandatory.
Catchment area
The catchment area of the surface that collects
precipitation runoff must be evaluated. Once done, the
data will not change until the site configuration changes.
The amount of precipitation runoff produced in a
catchment area is directly related to the geological and
topographical characteristics of the drainage area.
These catchment area characteristics include:
• Size and shape of the catchment area
• Slope and length of hills and mountains
• Type of vegetation or surface cover
• Type and condition of soils and rock strata
• Presence of streams, ponds, lakes, and other water
bodies

24
7 DATA MANAGEMENT
There are two types of data sources:
• Periodic water monitoring
• Continuous water monitoring systems
Continuous monitoring systems are recommended.
The systems should be selected, installed, maintained
and calibrated according to this Guidance.
The type, reference, and maintenance of meters, and their
calibration over time should be reported in log sheets and
filed.
The process for continuous and periodic monitoring
including data management should be put in writing
and available at site level to those in charge of monitoring
and reporting and include the following:
• Identification of measured flows
• Standards, methodology for periodic monitoring
• A monthly frequency is recommended
• Log sheets
• People-in-charge
Characteristic Continuous water monitoring systems
Periodic water monitoring
Sampling period Monitors all or most of period Snapshots of profile
Speed of generating results Nearly real-time output of results Real-time results with portable instrument analysers, delayed results with laboratory end-method
Stability Sensors prone to fouling at times Sample integrity must be maintained before analysis
Availability For limited number of determinants Comprehensive range of methods
Applicability May not meet performance requirements
Methods meet performance of most regulatory requirements
Reporting results Results continuously averaged, typically over one hour or 24 hours
Results reported as daily average or instantaneously
Capital cost Tends to be higher than equivalent periodic monitoring
Tends to be lower than equivalent continuous monitoring
Equipment certification Available Available, laboratory equipment use covered by ISO 17025 or equivalent
Monitoring accreditation Not applicable Available for sampling and analysis
Table 7 Advantages and disadvantages of continuous and periodic monitoring
25
A process should be issued for each cement plant.
But a single process could cover several aggregate
installations and ready-mix concrete units according
to business, area, or zone. Assign resources and
responsibilities for maintenance follow-up and calibration
of meters, monitoring, and data logging.
Assess how coherent are the data. Then create and
put in place a validation process in which the data are
placed. Explain variations of flows over time. Check the
coherence of water accounting with simplified
water balances between water withdrawals, and check
discharge and consumption by identifying main water
usage. People who monitor, report and validate should
be trained, so they have a basic knowledge of water
accounting, and can assess the coherence of figures.
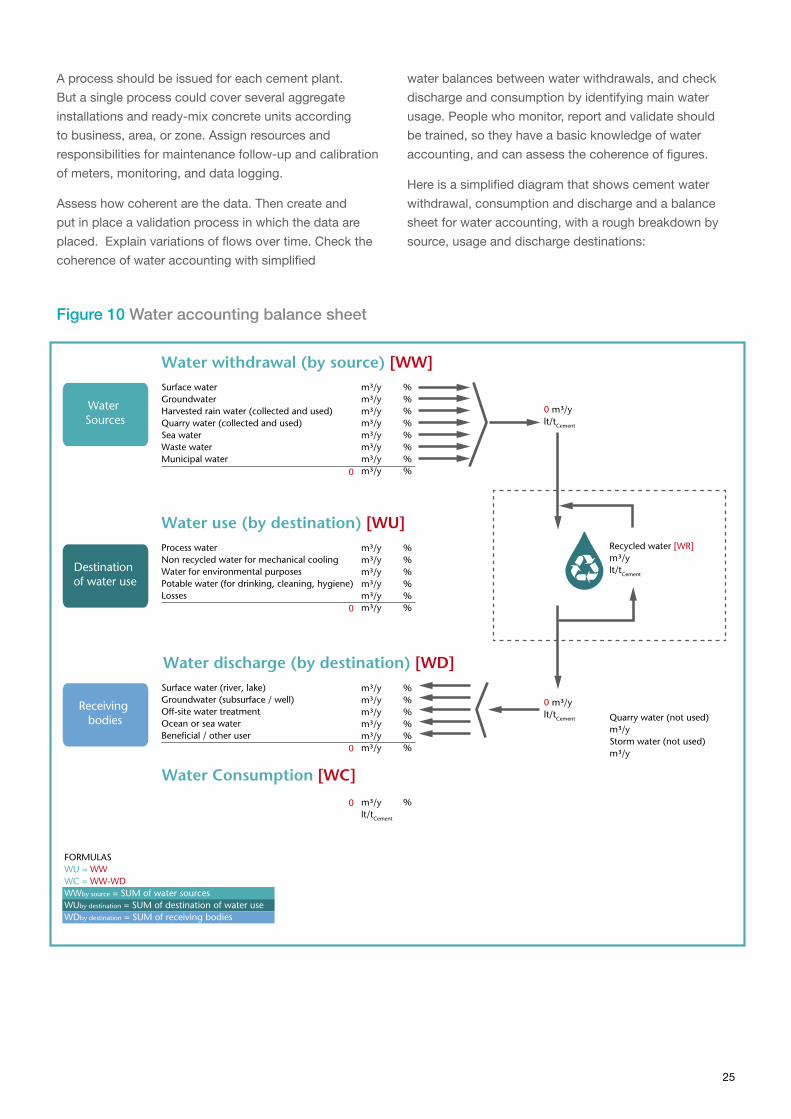
Here is a simplified diagram that shows cement water
withdrawal, consumption and discharge and a balance
sheet for water accounting, with a rough breakdown by
source, usage and discharge destinations:
Figure 10 Water accounting balance sheet
Surface waterGroundwaterHarvested rain water (collected and used)Quarry water (collected and used)Sea waterWaste waterMunicipal water
0 m³/ylt/tCement
Recycled water [WR] m³/ylt/tCement
Quarry water (not used) m³/yStorm water (not used) m³/y
FORMULASWU = WWWC = WW-WDWWby source = SUM of water sources WUby destination = SUM of destination of water useWDby destination = SUM of receiving bodies
0 m³/ylt/tCement
m³/ym³/ym³/ym³/ym³/ym³/ym³/ym³/y0
m³/ym³/ym³/ym³/ym³/ym³/y
m³/ym³/ym³/ym³/ym³/ym³/y
%%%%%%%%
%%%%%%
%%%%%%
m³/ylt/tCement
%
Water withdrawal (by source) [WW]
Process waterNon recycled water for mechanical coolingWater for environmental purposesPotable water (for drinking, cleaning, hygiene)Losses
Water use (by destination) [WU]
Surface water (river, lake)Groundwater (subsurface / well)Off-site water treatmentOcean or sea waterBene�cial / other user
Water discharge (by destination) [WD]
Water Consumption [WC]
Water Sources
Destination of water use
Receiving bodies
0
0
0

26
8 GLOSSARY
• Aggregate operations: Quarrying, handling and
processing non-metallic mineral products for
classification or size reduction. Mineral products
are supplied from quarries or recycled aggregate
products. Processing sand and gravel for a specific
market may involve different combinations of washers,
screens and classifiers to segregate particle sizes;
crushers to reduce oversized materials; and storage
and load facilities.
• Beneficial use: Discharges directly to external
organizations for specific use by industry, agriculture,
for human use or to construct wetlands.
• Cement operations: Quarrying, handling, crushing,
milling, burning and cooling materials to produce
clinker or cement. If a captive power plant is located
on the same premises as a cement plant, water
indicators should be reported separately. On the other
hand, waste heat recovery systems included in the
cement process should be reported together with the
cement plant.
• Freshwater: The constituent content of freshwater
should be defined by local regulations. In the absence
of local regulations, a limit of 1000 mg/L of TDS
recommended by the World Health Organization is the
gauge for categorizing fresh and non-fresh surface
water and groundwater.
• Groundwater: Water in soil beneath the soil surface,
usually when the water pressure is greater than the
atmospheric pressure, and the holes in the soil are
filled up with water.
• Harvested rainwater: Rainwater that is collected and
used on site.
• Operation: Any kind of business activity.
• Municipal supply: Drinking quality water supplied by a
public organization.
• Potable water: Water suitable for drinking.
• Product: A material of commercial value in one
of three forms: cement, aggregate or ready-mix
concrete.
• Quarry water: Water extracted from the cement or
aggregates quarry, also called quarry dewatering.
It may be any combination of groundwater, surface
water, and precipitation.
• Ready-mix concrete (RMC) operations: Concrete
manufactured in a factory or batching plant, according
to a set recipe, and delivered to a work site, by truck
mounted in–transit mixers. Process units include
mixers, pumps and handling.
• Receiving body: Destination of water discharges.
• Recycled water: The amount of used water or
wastewater used in another cycle that goes back into
the same process, or in a higher use in the process
cycle, before discharge for final treatment or to the
environment.
• Recycled or reused water (%): The amount of
recycled and reused water as a percent of total water
withdrawal.

27
• Reporting: Disclosing data and relevant information
to internal and external stakeholders, such as
management, employees, governments, regulators,
shareholders, the general public, local communities or
interest groups.
• Reused water: The amount of used water or
wastewater deployed for another function in a lower
use in the process cycle, before discharge for final
treatment or to the environment. Reuse includes for
irrigation inside the boundary of a facility.
• Source: Origin of water withdrawal.
• Stormwater: Rain and stormwater run-off collected
and discharged not used on the site.
• Subsurface discharge: Injection of effluent water into
any underground medium for disposal.
• Surface water: All waters on the surface of the earth,
including fresh and salt water, ice, and snow, oceans,
lakes, rivers, and wetlands, but not including water
from the sub-surface, such as groundwater.
• Value chain: The chain of activities of a firm operating
in a specific industry.
• Water consumption: water evaporated for cooling
and from water storage facilities, lost via transmission,
or used in an organization’s products and onsite,
calculated as difference between water withdrawals
and water discharges. Total water consumption
includes rainwater harvested on site for any use.
Unlike total freshwater consumption,
it excludes harvested rainwater.
• Water discharge: The sum of water effluents
discharged, over the course of the reporting period,
to the ocean, surface, subsurface or well, off-site
water treatment, beneficial user or other user through
a defined discharge point (point source discharge),
over land in a dispersed or undefined manner (non-
point source discharge), or wastewater removed from
the reporting organization via truck.
• Water withdrawal (or use): The sum of all water drawn
into the boundaries of the reporting organization from
all sources (including surface water, groundwater,
used quarry water, municipal water, external waste
water, and harvested rainwater) for any use during the
reporting period.
• Watershed: any area with a common outlet for surface
runoff. Synonyms include catchment, drainage area,
and river basin.

28 29
Annex 1 Water flow diagrams
Typical water flow diagrams for (a) cement, (b) aggregate and (c) ready-mix are provided below.
• Surface water (river, lake, natural pond)
• Groundwater (wells, boreholes)
• Sea water (sea, ocean)
• Municipal / potable water
• Harvested rainwater
• External waste water
• Quarry water used
Environmental Purposes
Process Water
Mechanical Cooling
Water sources
• Surface water (river, lake, natural pond)
• Subsurface (well)
• Sea / ocean
• Off-site water treatment
• Beneficial / other use
Water discharge receiving bodies
• Irrigation
• Roads watering (dust suppresion)
• Trucks & equipment washing
• Kiln
• Raw Mill
• Cement Mill
• Coal Mill
• Cooler
Non recycled waterfor mechanical cooling(make-up water)
• Offices
• Amenities for workers
• Maintenance workshop
• Compressors
• Boilers
• Conditioning Tower (kiln exhaust gases)
• Clinker Cooler
• Raw Mill
• Cement Mill
• Bypass (where applicable)
• Slurry for wet process (where applicable)
• Granulation for semi-wet or semi-dry process (where applicable)
• SNCR (wells, boreholes)
• Wet SO2 scrubber (where applicable)
• Waste heat recovery (where applicable)
Ancillary operations
Total water withdrawal
Recycling facility
Total water discharge
Waste watertreatmentfacility
Water accounting methodMeter typeQuantitym3/y
Settlement Pond
Water accounting methodMeter typeQuantitym3/y
Water accounting methodMeter typeQuantitym3/y
Water accounting methodMeter typeQuantitym3/y
Water accounting methodMeter typeQuantitym3/y
(a) Water flow diagram for cement plants (source: Titan)

30
12,250 GPD
500 GPD
10,000 GPD15,000 GPD
(optional)
(optional)
Storm water
Evaporation
Municipal /well water
Sanitarysewer
Used in production
Settling pondspits
YardWashing
Truck loading & water tanks
Recycleto plant
Treatment Discharge
Holdingpond
Truckwashing Spillage
(b) Process water flow diagram for a ready mix concrete plant (source: Cementos Argos)
(c) Process water flow diagram for aggregate installations (source: Italcementi)
(optional)
Water make-up
Settling pond Clear water pond
Aggregates(�nished product)
Clari�er Screening /washing
Extraction(raw materials)

31
Annex 2 Secondary elements
A secondary element measures the velocity of flowing
water. Velocity is used to calculate the flow of water
through the speed-area method.
Here are a few secondary elements:
a. Rotating-element mechanical meters
The operating principle of a mechanical meter, or rotating
element current meter, is based on the proportionality
between the velocity of water and the angular velocity
of the meter rotor. By placing a mechanical current
meter at a point in a stream, and counting the number of
revolutions of the rotor during a measured interval, the
velocity of water can be discovered from the meter rating.
b. Electromagnetic meters
An electromagnetic current meter is based on the
principle that a conductor (water) moving through a
magnetic field will produce an electrical current directly
proportional to the speed. By measuring this current
and the distortion in the magnetic field it causes, the
instrument can be calibrated to measure point velocities
of flowing water.
c. Acoustic meters
The acoustics meter uses the Doppler principle to
determine point velocities of flowing water and complete
vertical velocity profiles. An example is the ultrasonic
meter: installed over the water level, it emits a noise pulse
and measures the time response proportional to the flow
rate.
d. Optical meters
The optical current meter uses a device calibrated to
measure surface velocities of flowing water, but cannot be
used to determine sub-surface velocities.
Annex 3 Indicative values for process water consumption (generic ranges)
The following values are only to assess water
consumption for accounting purposes, but may need
to be adapted to the local context.
a. Cement manufacturing
Water for wet kiln feed preparation:
Basis: 1T of clinker requires 1.55T of raw materials
Water content of natural raw materials applied in wet
processes
Minimum: 10%, corresponding to 172 L / T clinker
Maximum: 20%, corresponding to 388 L / T clinker
Water content of slurries
Minimum: 32%, corresponding to 729 L / T clinker
Maximum: 42%, corresponding to 1,122 L / T clinker
Water added for slurry preparation
Low water slurries (10% to 32%) 557 L / T clinker
High water slurries (20% to 42%) 734 L / T clinker
Total water for slurrification: 550 to 750 L / T clinker
Water for semi-wet process:
This technology is between wet and semi dry processes
270 to 550 L / T clinker
Water for semi dry process:
Total water for granulation (12 to 15% moisture)
200 – 270 L / T clinker
Water for cooling kiln exhaust gases to 150°C
4 stages preheater kiln (800 kcal/kg, 340°C):
150 L / T clinker
4 stages precalciner kiln (760 kcal/kg, 370°C):
170 L / T clinker
5 stages precalciner kiln (730 kcal/kg, 320°C):
130 L / T clinker
6 stages precalciner kiln (710 kcal/kg, 300°C):
110 L / T clinker
Conditioning water for kiln exhaust gases
in direct operation mode (20% run time):
110 – 170 L / T clinker
in compound operation mode (80% run time):
Fraction of the above

32
Water consumption of closed circuit equipment cooling
systems
Make-up water approx.: 50 - 60 L / T clinker
Thereof:
To compensate evaporation cooling 20 - 30 L / T clinker
To compensate bleed water 20 - 30 L / T clinker
To compensate drift losses 5 L / T clinker
Water consumption of open circuit equipment cooling
systems
Suggested: 1400 – 1500 L/T clinker
Water injection in bypass cooling towers
Suspension preheater kilns 60 L / T cli, 10% bypass rate
Precalciner kilns: 30 L / T cli, 10% bypass rate
Water injection in clinker coolers
Grate coolers: 2 – 5 L / T clinker
Planetary coolers 30-40 L / T clinker
Rotary coolers 40-60 L / T clinker
Water injection in cement mills
Average 10 – 30 L / T cement
Maximum 40 L / T cement
Water consumption for wet SO2 scrubbers
Rough estimate 100 L / T clinker
b. For RMC and aggregate
In the absence of data for ready-mix and for concrete,
the following link may provide a useful basis. However,
values vary from country to country.
The values stated should first be used first to give an
indicative direction, and to give guidance for calculations
at the site level:
https://www.gov.uk/government/uploads/system/
uploads/attachment_data/file/509928/LIT_9909.pdf
For RMX, review the National Ready Mixed Concrete
Association (NRMCA) manual www.nrmca.org/
sustainability/Certification/SCP Guidelines Version 1.1.pdf.
Note average water consumption on page 21 and average
batch water usage on page 24.

About the World Business Council for Sustainable Development (WBCSD)
The World Business Council for Sustainable Development (WBCSD), a CEO-led
organisation of some 200 forward-thinking global companies, is committed to galvanising
the global business community to create a sustainable future for business, society and
the environment. Together with its members, the council applies its respected thought
leadership and effective advocacy to generate constructive solutions and take shared
action. Leveraging its strong relationships with stakeholders as the leading advocate
for business, the council helps drive debate and policy change in favour of sustainable
development solutions.
The WBCSD provides a forum for its member companies – who represent all business
sectors, all continents and a combined revenue of more than $7 trillion – to share best
practices on sustainable development issues and to develop innovative tools that change
the status quo. The council also benefits from a network of 65+ national and regional
business councils and partners organisations, a majority are based in developing countries.
www.wbcsd.org
About the Cement Sustainability Initiative (CSI)
The CSI is a global effort by 24 leading cement producers, with operations in more than
100 countries. Collectively, these companies account for around 30% of the world’s cement
production and range in size from very large multinationals to smaller local producers. All
CSI members have integrated sustainable development into their business strategies and
operations, as they seek strong financial performance with an equally strong commitment
to social and environmental responsability. The CSI is an initiative of World Business Council
for Sustainable Deveploment (WBCSD).
www.wbcsdcement.org
www.wbcsdcement.org/water
Disclamer
This report is released in the name of the WBCSD. It is the result of a collaborative effort
by members of the Secretariat and executives from member companies participating in
the CSI. Drafts were reviewed among CSI members, so ensuring that the document
broadly represents the majority view of this group. This does not mean, however, that
every member company agrees with every word.
Copyright: © WBCSD, May 2016
Designer: Léonie Cocquio Design
ISBN: 978-2-940521-66-1

W A T E R
World Business Council for Sustainable Development www.wbcsd.orgMaison de la Paix, Chemin Eugène-Rigot 2, CP 246,1211 Geneve 21, Switzerland.Tel: +41 (0)22 839 31 00, E-mail: [email protected]
WBCSD US, 29 East 19th Street, 4th Floor, New York, NY 10003, United States
WBCSD India, 1st Floor, 1 Africa Avenue, New Delhi 110 029, India. Tel: +91 11 3352 1527/8, E-mail: [email protected]


![City of Seattle Department of Planning and Development...] Ç}(^ ©o u v }(Wovv]vPv À o} u v aard Open ose a ic omments 4 T T W T T T T T T T W T T W W W W T T T T T R R W T Y T W](https://static.documents.pub/doc/80x56/6013431783b2823b222b7085/city-of-seattle-department-of-planning-and-o-u-v-wovvvpv-o.jpg)


