Date post: | 29-Jun-2019 |
Category: |
Documents |
Upload: | hoangxuyen |
View: | 212 times |
Download: | 0 times |
W o r k s h o p o n
Accelerated Deployment of Field-Scale Models forMicrobially-Mediated Groundwater Remediation
Sponsored by ERSP
co-chaired byJack Parker, Univ. Tennessee and Tony Palumbo, ORNL
Participants:Todd Anderson, DOE; Dan Bond, Univ. Minn.; Scott Brooks, ORNL;
Bill Burgos, Penn State; Frank Chapelle, USGS; Yilin Fang, PNNL;Tim Ginn, UC Davis; Terry Hazen, LBNL; Jack Istok, Oregon State;
Jian Luo, Ga Tech; Peter Kitanidis, Stanford; Krishna Mahadevan, U. Toronto;Eric Rodin, Univ. Wisconsin; Chris Schadt, ORNL; Tim Schiebe, PNNL;
Pat Sobecky, Ga Tech; Mark Widdowson, Va Tech;Steve Yabusaki, PNNL; Fan Zhang, ORNL
Workshop Motivation
ERSP Goal: Develop improved models for coupled field-scale processes
Much uncertainty regarding modeling of microbial reactions…
Accelerate progress with better communication between modelers andmicrobiologists!
Workshop Objectives and Format
Objectives…
• Narrow communication gap between modelers and microbiologists
• Identify current knowledge/data gaps
• Develop a “roadmap” for collaborative model development
Format…
• Web-based meetings using Live Meeting
• Five weekly two-hour sessions January 7 – February 4, 2008
• Roughly split between presentations and open discussion
• Presentations and auxiliary material on workshop web site
(contact me for URL and access code)
Session 1: State-of-the-Science of Microbial ProcessesAffecting Subsurface Contamination – Terry Hazen, LBNL
Overview
Factors affecting microbialgrowth microbially-mediatedcontaminant attenuation
Session 1: State-of-the-Science of Microbial ProcessesAffecting Subsurface Contamination – Terry Hazen, LBNL
Geochemistry and Transport Processes
dominant influence on microbialgrowth and reactions
e.g., electron acceptor (EA) andelectron donor (ED) fluxes
Session 1: State-of-the-Science of Microbial ProcessesAffecting Subsurface Contamination – Terry Hazen, LBNL
New Technologies
For characterizing andmonitoring communitydynamics
Session 1: Metabolic and Multi-Scale Models– Tim Scheibe, PNNL
Upscaling Issues
Imbedding pore scalemodels within primarycontinuum models
Session 1: Metabolic and Multi-Scale Models– Tim Scheibe, PNNL
Hybrid Multiscale Models
Linking metabolic modelswith continuum transportmodels (SciDAC)
Session 2: Model Identification, Calibration, Validation,Uncertainty, and Scale – Peter Kitanidis, Stanford Univ.
Practical Upscaling Issues
Useful to evaluate form of field-scale constitutive models, but notpracticable for calibration
(too many parameters)
Session 2: Model Identification, Calibration, Validation,Uncertainty, and Scale – Peter Kitanidis, Stanford Univ.
Optimal Model Resolution
Tradeoff between data availabilityand model accuracy
Session 2: Continuum Modeling of Microbially-MediatedSubsurface Reactions – Jian Luo, Ga. Tech
Model Application to Oak Ridge FRC Field Pilot Test
uranyl-carbonate and uranyl-phosphate surface complexes, acid-base chemistry, etc.
microbial electron-acceptors: nitrate, ferrihydrite, sulfate, U(VI)
mass transport limitations >> Monod kinetic limitations
0
50
100
CO
D (
mg
/L)
0
50
100
SO
4−2 (
mg
/L)
6
6.5
7
pH
0
5
HC
O3− (
mM
)
0
0.5
NO
3− (
mM
)
398 399 400 401 402 403 404 405 406 407 408 409 4100
0.5
1
Time (Day)
U(V
I) (
mg
/L)
COD
pH
SO42−
HCO3−
NO3−
U(VI)
Phase I Phase II Phase III
Session 3: Lessons learned regarding bioremediation oforganic chemicals – Tony Palumbo, ORNL
Hydrocarbon and Chlorinated Solvent Plume Bioremediation
- Organic bioremediation and models used routinely
- Lessons that can be extrapolated to metals and rads?
Session 3: Lessons learned regarding bioremediation oforganic chemicals – Tony Palumbo, ORNL
Chlorinated Solvent Biodecay
•Usually insensitive to initial communitystructure (except for anaerobic dechlorinators)
•Usually transport-limited rates
• ED/EA limiting at low populations,nutrients may be limiting at highpopulations
Session 3: Practical Use of Models for Bioremediation ofOrganics – Mark Widdowson (Va Tech) and Frank Chapelle (USGS)
Reactive Transport Model with Microbial Reactions
Sequential TEAs based on energy yield (e.g., O2>NO3>Fe(II)>SO4>H2)
++=
=
1
1 ,
,max,,,sin
le
li lilile
lile
VCelc
VCEAVC
yEAbioVCk ECK
CMR
Electron Donor
& Acceptor Flux
Contaminant
Mass Flux
Natural Attenuation
Capacity
Sediment ED & EA Pool
Monod kinetics model
EA and ED mass balance
Session 3: Practical Use of Models for Bioremediation ofOrganics – Mark Widdowson (Va Tech) and Frank Chapelle (USGS)
Used in Numerous Field Applications
- Reaction rates depend on EA and ED fluxes
- Not sensitive to Monod rate coefficients
- MNA sustainability controlled by carbon flux
$T#Y#Y
#Y
#Y#Y#Y#Y
#Y
%U%U%U%U%U%U%U%U
%U%U #Y#Y
#Y#Y#Y#Y#Y#Y#Y#Y#Y#Y#Y#Y#Y#Y
#Y#Y %%%%
AA Pilot StudyVegetable Oil Study
0 500 1000 Feet
Session 4: A Thermodynamically-Based Model for U and TcBioreduction – Jack Istok, Oregon State
Approach
•Define microbial groups based on EA and ED
•Derive growth equations and energy yield for each group
•Assume ‘fast’ reaction kinetics (i.e., transport-limited)
Acceptor Donor YDx Acceptor Donor YDx
Group Half-Reaction Half-Reaction Group Half-Reaction Half-Reaction
1 O2/CO2 Ethanol/CO2 0.56 22 MnO42-/Mn
2+Acetate/CO2 0.12
2 Acetate/CO2 0.41 23 Ethanol/Acetate 0.29
3 Lactate/CO2 0.56 24 Lactate/Acetate 0.06
4 Ethanol/Acetate 0.14 25 H2/H+
0.15
5 Lactate/Acetate 0.14 26 CO2/CH4 Acetate/CO2 0.02
6 H2/H+
0.13 27 H2/H+
0.02
7 CH4/CO2 0.55 28 H+/H2 Acetate/CO2 0.11
8 NO3-/N2 Ethanol/CO2 0.27 29 Ethanol/Acetate 0.01
9 Acetate/CO2 0.41 30 Lactate/Acetate 0.06
10 Lactate/CO2 0.27 31 UO2++/U
4+Acetate/CO2 0.22
11 Ethanol/Acetate 0.29 32 Ethanol/Acetate 0.19
12 Lactate/Acetate 0.06 33 H2/H+
0.12
13 H2/H+
0.17 34 CrO42-/Cr
+++Acetate/CO2 0.32
14 Fe3+/Fe
2+
Acetate/CO2 0.12 35 Lactate/Acetate 0.06
15 Ethanol/Acetate 0.13 36 H2/H+
0.12
16 Lactate/Acetate 0.13 37 TCO4-/TcO
2+Acetate/CO2 0.07
17 H2/H+
0.07 38 Ethanol/Acetate 0.06
18 SO42-/HS
-Acetate/CO2 0.10 39 H2/H
+0.04
19 Ethanol/Acetate 0.04
20 Lactate/Acetate 0.04
21 H2/H+
0.07
(O2-H2O)(H2-H)
(MnO4-Mn2)(acet-CO2)
(NO3-N2)(ethn-CO2)
(H-H2)(ethn-acet)
(O2-H2O)(CH4-CO2)
(MnO4-Mn2)(H2-H)
(Fe3-Fe2)(H2-H)
(UO2-Uran)(acet-CO2)
(SO4-HS)(ethn-acet)
(Fe3-Fe2)(acet-CO2)
(CO2-CH4)(H2-H)
(CO2-CH4)(acet-CO2)
Session 4: A Thermodynamically-Based Model for U and TcBioreduction – Jack Istok, Oregon State
• Successful applications to FRC Area 1, OldRifle, and Hanford 100 H
• Only 4 adjustable parameters regardless ofnumber of groups
• Allows more detailed description ofmicrobial communities
0%
20%
40%
60%
80%
100%
0 2 4 6 8 10 12 14
Acetate Reacted (mmol/kg)
Co
mp
os
itio
n U Groups
Mn Groups
Nitrate groups
Aerobe Groups
Fe Groups
Sulfate Groups
CO2-CH4
H-H2
Acetate Reacted (mmol/kg)
UO2++
Can simple models describe complex biogeochemical systems? – Yes…
Session 4: In Situ U Biostimulation: Challenges for Field-Scale Modeling – Steve Yabusaki and Yilin Fang, PNNL
Comprehensive 3-D reactive transport model
• Redox, sorption, aqueous and surfacecomplexation reactions
• Thermodynamically-constrained Monodmicrobial kinetics
Microbial Reactions
Iron TEAP
0.125CH3COO- + 0.6FeOOH(s) + 1.155H+ + 0.02NH4+ = 0.02BM_iron + 0.6Fe++ + 0.96H2O + 0.15HCO3
-
Sulfate TEAP
0.125CH3COO- + 0.0057H+ + 0.0038NH4+ + 0.1155SO4
-- = 0.0038BM_sulfate + 0.0114H2O + 0.231HCO3- +
0.1155HS-
Uranium TEAP
0.1250CH3COO- + 0.3538H2O + 0.0113NH4+ + 0.3875UO2
++ = 0.0113BM_iron + 0.855H+ + 0.1938HCO3- +
0.3875UO2(s)
0 2 4 6 8 10 12 14–.8
–.4
0
.4
.8
1.2
pH
Eh
(vo
lts) O2 (gas)
H 2O
H2O
H2 (gas)
Uranini te (UO 2)
U4+
UO22+
UO2(OH)20(aq)
Ca2UO2(CO3)30(aq)
CO2
Fe(III)Fe(II)
Session 4: In Situ U Biostimulation: Challenges for Field-Scale Modeling – Steve Yabusaki and Yilin Fang, PNNL
Application to Rifle, Colorado Mill Tailings Site
• calibrate to 2002 acetate biostimulation experiment
• verify with 2003 experiment (3x higher acetate injection)
Observed and predicted dissolved Uranium
2002
2003
• How much model complexity is needed?
• Optimum complexity depends on
• Decrease in “intrinsic error” with morecomplexity versus…
• Increase in parameter propagation errorwith too many parameters relative todata for calibration
• Prediction uncertainty tolerance formodel-based decision?
Complex =============== Simple
0
20
40
60
80
100
120
Pre
dic
tio
n U
ncert
ain
ty
Intrinsic error
Parameter error - low data
Parameter error - high data
Total error - low data
Total error - high data
Optimum
low data
Optimum
high data
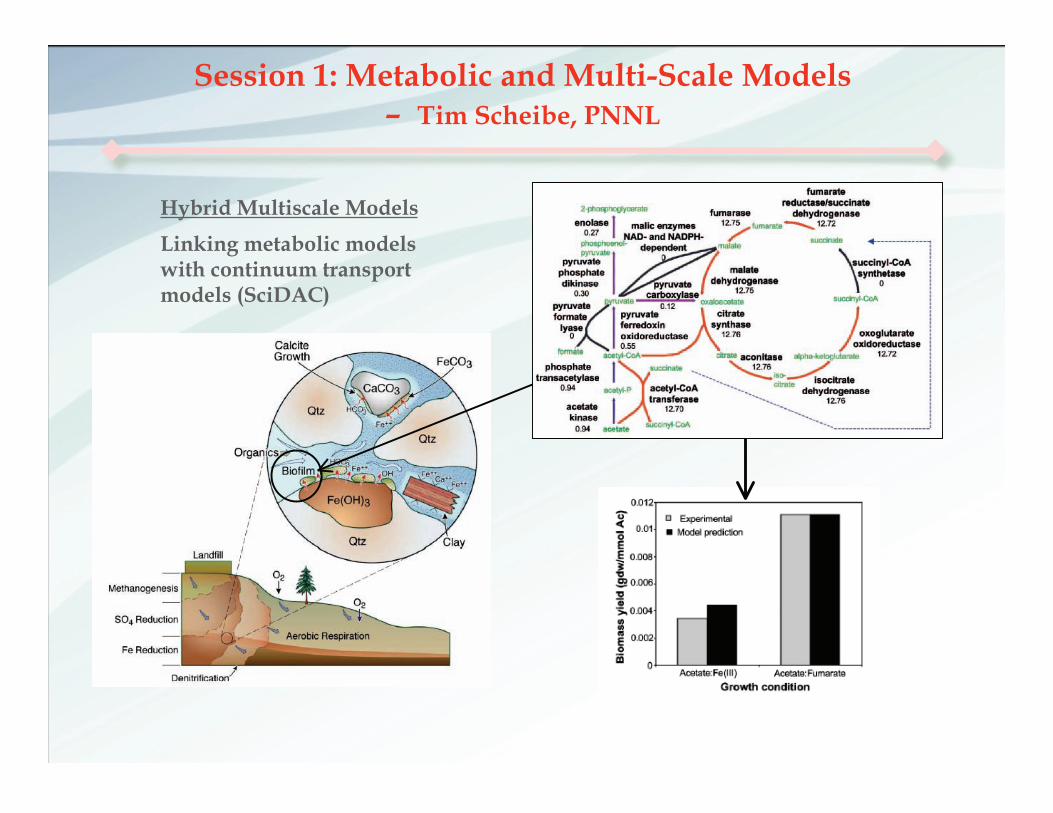
• Models can be used to prioritize data needs and research efforts
Session 5: Discussion of Challengesand Approach to Accelerate Progress
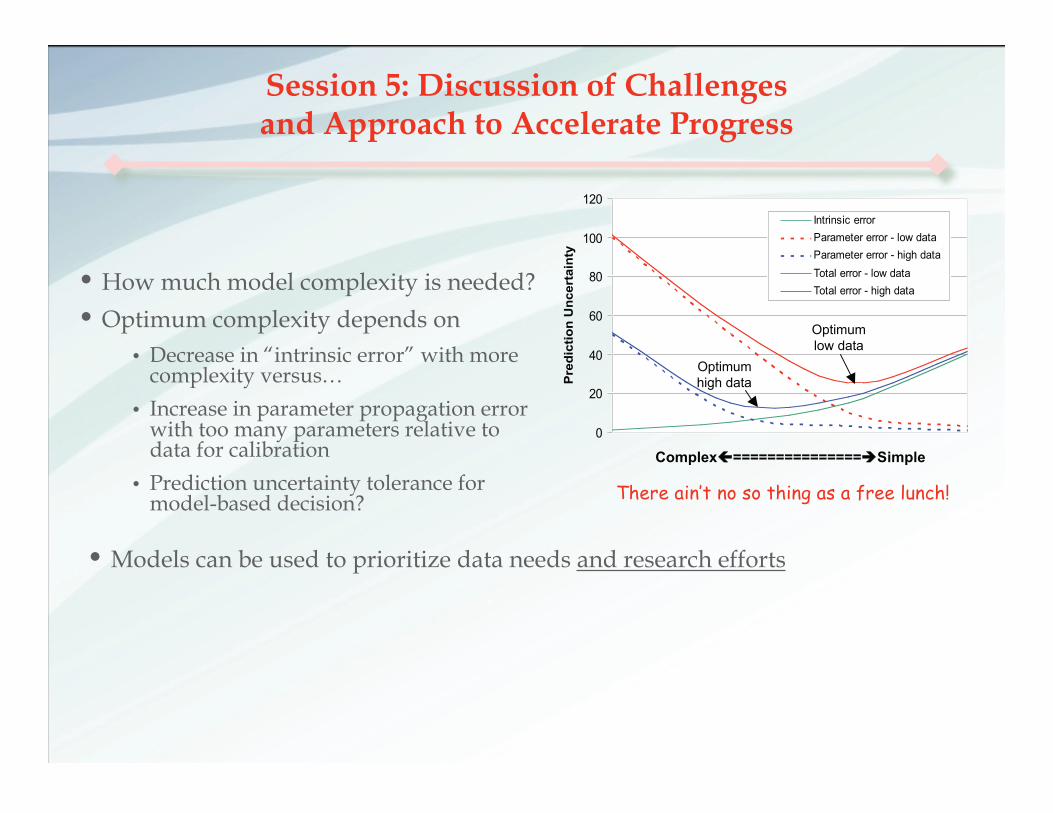
There ain’t no so thing as a free lunch!
A road forward…
• Priority research issues
• Identify rate limiting processes (EA, ED, nutrients, inhibitors, metabolicstate, mass transport, etc.) and formulate growth equations
• Identify microbial groups that capture metabolism based on genomics
• Correlate functional groups with genomics data
• Evaluate effect of model formulation, resolution and calibration data onprediction uncertainty?
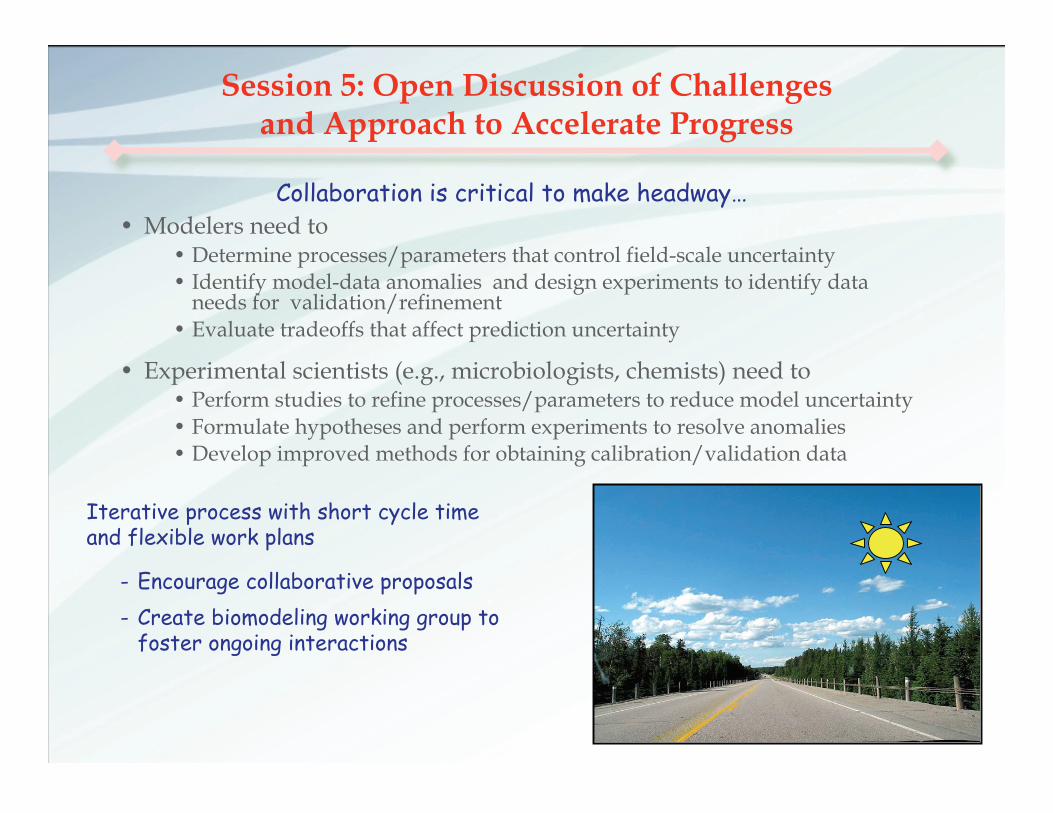
without a map, its easy to get lost inthe rush of traffic…
Session 5: Open Discussion of Challengesand Approach to Accelerate Progress
• Modelers need to• Determine processes/parameters that control field-scale uncertainty• Identify model-data anomalies and design experiments to identify data
needs for validation/refinement
• Evaluate tradeoffs that affect prediction uncertainty
• Experimental scientists (e.g., microbiologists, chemists) need to• Perform studies to refine processes/parameters to reduce model uncertainty
• Formulate hypotheses and perform experiments to resolve anomalies• Develop improved methods for obtaining calibration/validation data
Iterative process with short cycle timeand flexible work plans
- Encourage collaborative proposals
- Create biomodeling working group tofoster ongoing interactions
Session 5: Open Discussion of Challengesand Approach to Accelerate Progress
Collaboration is critical to make headway…