FISCAL YEAR 2011 Tourism Development Annual R eport PUBLISHED BY THE MARYLAND TOURISM DEVELOPMENT BOARD AND THE MARYLAND OFFICE OF TOURISM Dear T ourism Industry Partners: I am pleased to present the FY 2011 Tourism Development Annual Report, a key function that the Maryland Tourism Development Board is mandated to perform. Each year, we report the impact that the travel and tourism industry contributes to Maryland’s economy. As someone who has been involved in the Maryland tourism industry for more than 20 years, I know firsthand the economic impact visitors have on my bottom line. This year’s annual report highlights the economic impact of Maryland’s tourism industry from the recently released Economic Impact of Tourism in Maryland — 2010 Tourism Satellite Account report from Tourism Economics, a leading tourism industry research firm. Economic Impact is generally reported by calendar year; all other metrics in the Annual Report are Fiscal Year 2011 (July 2010–June 2011). Another measurement highlighted in the Annual Report is the direct result of the passage of the Tourism Promotion Act of 2008 and its performance-based formula. Eight key tourism tax codes are tracked, reported and considered in calculating future tourism budgets. Comparisons, by county, of Fiscal 2010 and Fiscal 2011 codes are included in this report. While the results of a Tourism Satellite Account are only available on an annual basis, many performance metrics — including the tourism tax codes — are available on a more frequent basis. Recognizing the importance of more timely information, the Office of Tourism distributes an electronic Tourism Monitor, which reports tourism trends and key performance metrics on a monthly basis. Included in the Annual Report is a year-end recap of the Tourism Monitor, including the metrics tracked in the Department of Budget & Management’s Managing for Results (MFR) program and the StateStat performance reporting system. As a small business owner, I scrutinize every aspect of business with an eye toward return on investment. In Fiscal Year 2011, the State invested $8.28 million in general funds for the Office of Tourism Development and Maryland Tourism Development Board combined budgets. The Comptroller reported that the formula utilized in the Tourism Promotion Act generated $359 million in State sales tax revenues for that year. I am proud to report that the efforts of the Maryland Office of Tourism in Fiscal 2011 delivered a powerful return on investment of $43 in State sales tax for every dollar invested in tourism funding. The Tourism Satellite Account reported more than $13.1 billion in visitor spending and close to $1.9 billion in State and local taxes. I am proud of the work of the Maryland Tourism Development Board and the Maryland Office of Tourism, and the positive impact that the tourism industry has on our State and its citizens. Sincerely, Greg Shockley, Chair Maryland Tourism Development Board Owner, Shenanigan’s Irish Pub, Ocean City TOUR ISM Office of Tourism
Transcript
FISCAL YEAR 2011Tourism Development Annual ReportPUBLISHED BY THE MARYLAND TOURISM DEVELOPMENT BOARDAND THE MARYLAND OFFICE OF TOURISM
Dear Tourism Industry Partners:
I am pleased to present the FY 2011 Tourism Development Annual Report, a key function that the Maryland Tourism Development Board is mandated to perform.
Each year, we report the impact that the travel and tourism industry contributes to Maryland’s economy. As someone who has been involved in the Maryland tourism industry for more than 20 years, I know fi rsthand the economic impact visitors have on my bottom line.
This year’s annual report highlights the economic impact of Maryland’s tourism industry from the recently released Economic Impact of Tourism in Maryland — 2010 Tourism Satellite Account report from Tourism Economics, a leading tourism industry research fi rm.
Economic Impact is generally reported by calendar year; all other metrics in the Annual Report are Fiscal Year 2011 (July 2010–June 2011).
Another measurement highlighted in the Annual Report is the direct result of the passage of the Tourism Promotion Act of 2008 and its performance-based formula. Eight key tourism tax codes are tracked, reported and considered in calculating future tourism budgets. Comparisons, by county, of Fiscal 2010 and Fiscal 2011 codes are included in this report.
While the results of a Tourism Satellite Account are only available on an annual basis, many performance metrics — including the tourism tax codes — are available on a more frequent basis. Recognizing the importance of more timely information, the Offi ce of Tourism distributes an electronic
Tourism Monitor, which reports tourism trends and key performance metrics on a monthly basis. Included in the Annual Report is a year-end recap of the Tourism Monitor, including the metrics tracked in the Department of Budget & Management’s Managing for Results (MFR) program and the StateStat performance reporting system.
As a small business owner, I scrutinize every aspect of business with an eye toward return on investment. In Fiscal Year 2011, the State invested $8.28 million in general funds for the Offi ce of Tourism Development and Maryland Tourism Development Board combined budgets. The Comptroller reported that the formula utilized in the Tourism Promotion Act generated $359 million in State sales tax revenues for that year. I am proud to report that the efforts of the Maryland Offi ce of Tourism in Fiscal 2011 delivered a powerful return on investment of $43 in State sales tax for every dollar invested in tourism funding.
The Tourism Satellite Account reported more than $13.1 billion in visitor spending and close to $1.9 billion in State and local taxes. I am proud of the work of the Maryland Tourism Development Board and the Maryland Offi ce of Tourism, and the positive impact that the tourism industry has on our State and its citizens.
Sincerely,
Greg Shockley, Chair Maryland Tourism Development Board Owner, Shenanigan’s Irish Pub, Ocean City
AS
M
RISE
IVITY
OWTHPROGRESSJOBS
TOUR ISM
REVENUE
POTENTIAL
INDUSTRY
OPPORTUNITY
INVE
NTI
ONO
RIZ
ON
S
VE
LOP
ME
NT
Office of Tourism
Measuring the tourism industry is complicated, as the industry is not measured in standard economic accounting systems. Most industries are accounted via the supply-side: businesses are categorized into North American Industry Classifi cation System (NAICS) codes and surveyed about jobs, revenues and costs.
But tourism is a demand-side activity: the focus is on what the traveler buys before and during a trip. As a result, tourism touches many industries.
This year’s Annual Report refl ects the data collected via a Tourism Satellite Account (TSA)—the emerging industry standard now being used by other progressive and competitive States as well as the U.S. Travel Association.
A TSA provides measurements of tourism that are designed to be consistent with the System of National Accounts, which facilitates inter-industry comparisons. It also includes a wider view of tourism demand, such as second-home activity, capital investment and government spending — not just visitor spending. This broader measurement is referred to as the tourism economy. The TSA reported that Maryland’s total tourism economy generated $14 billion in 2010.
While this broader defi nition is important to track from a comparability standpoint, the key industry statistics will focus on visitor spending — the spending in Maryland by visitors on travel purchases — and will not include capital investment or government spending.
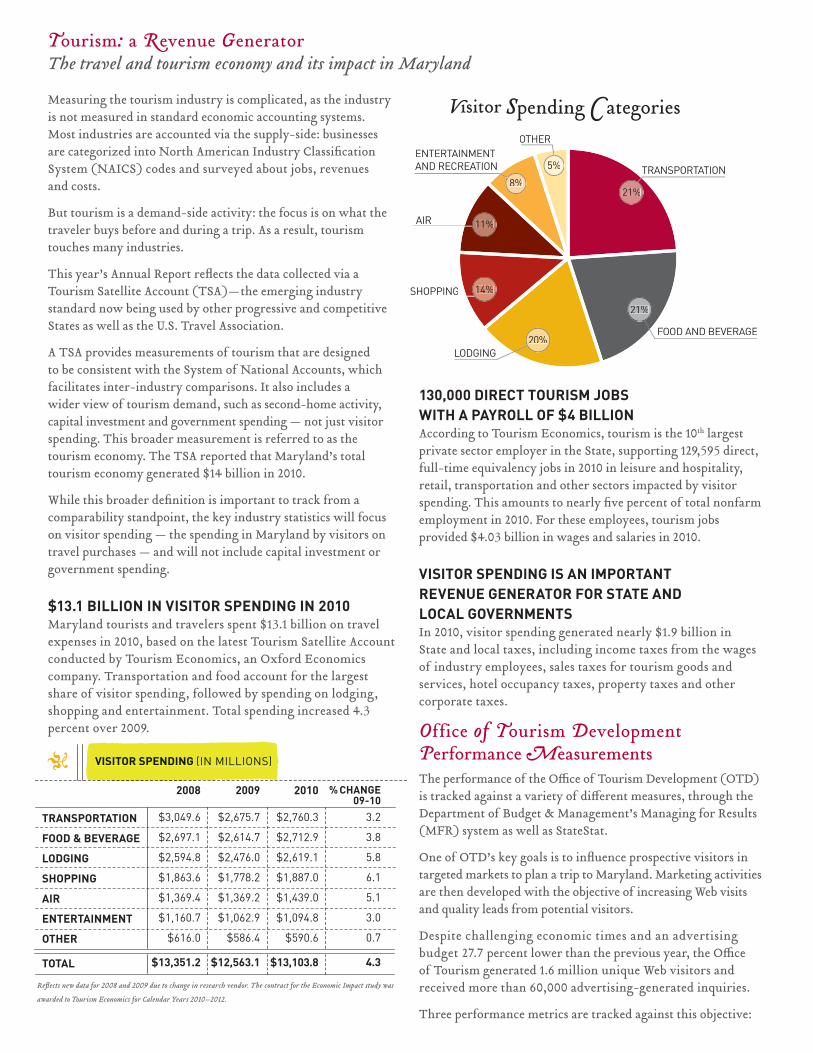
$13.1 BILLION IN VISITOR SPENDING IN 2010Maryland tourists and travelers spent $13.1 billion on travel expenses in 2010, based on the latest Tourism Satellite Account conducted by Tourism Economics, an Oxford Economics company. Transportation and food account for the largest share of visitor spending, followed by spending on lodging, shopping and entertainment. Total spending increased 4.3 percent over 2009.
130,000 DIRECT TOURISM JOBS WITH A PAYROLL OF $4 BILLIONAccording to Tourism Economics, tourism is the 10th largest private sector employer in the State, supporting 129,595 direct, full-time equivalency jobs in 2010 in leisure and hospitality, retail, transportation and other sectors impacted by visitor spending. This amounts to nearly fi ve percent of total nonfarm employment in 2010. For these employees, tourism jobs provided $4.03 billion in wages and salaries in 2010.
VISITOR SPENDING IS AN IMPORTANT REVENUE GENERATOR FOR STATE AND LOCAL GOVERNMENTSIn 2010, visitor spending generated nearly $1.9 billion in State and local taxes, including income taxes from the wages of industry employees, sales taxes for tourism goods and services, hotel occupancy taxes, property taxes and other corporate taxes.
Office of Tourism Development Performance MeasurementsThe performance of the Offi ce of Tourism Development (OTD)is tracked against a variety of diff erent measures, through the Department of Budget & Management’s Managing for Results (MFR) system as well as StateStat.
One of OTD’s key goals is to infl uence prospective visitors in targeted markets to plan a trip to Maryland. Marketing activities are then developed with the objective of increasing Web visits and quality leads from potential visitors.
Despite challenging economic times and an advertising budget 27.7 percent lower than the previous year, the Offi ce of Tourism generated 1.6 million unique Web visitors and received more than 60,000 advertising-generated inquiries.
Three performance metrics are tracked against this objective:
Tourism: a Revenue GeneratorThe travel and tourism economy and its impact in Maryland
TRANSPORTATION
FOOD & BEVERAGE
LODGING
SHOPPING
AIR
ENTERTAINMENT
OTHER
TOTAL
2009
$2,675.7
$2,614.7
$2,476.0
$1,778.2
$1,369.2
$1,062.9
$586.4
$12,563.1
2008
$3,049.6
$2,697.1
$2,594.8
$1,863.6
$1,369.4
$1,160.7
$616.0
$13,351.2
2010
$2,760.3
$2,712.9
$2,619.1
$1,887.0
$1,439.0
$1,094.8
$590.6
$13,103.8
% CHANGE 09-10
3.2
3.8
5.8
6.1
5.1
3.0
0.7
4.3
VISITOR SPENDING (IN MILLIONS)
Refl ects new data for 2008 and 2009 due to change in research vendor. The contract for the Economic Impact study was
awarded to Tourism Economics for Calendar Years 2010–2012.
TRANSPORTATION TRANSPORTATION
FOOD AND BEVERAGE
LODGING
SHOPPING
AIR
ENTERTAINMENTAND RECREATION
OTHER
5%
21%
21%
20%
14%
11%
8%
VISITOR SPENDING (IN MILLIONS)
NUMBER OF UNIQUE WEB VISITORS1.6 million unique Web visitors experienced visitmaryland.org in FY 2011. This is 8.4 percent lower than the number of visitors in FY 2010 with an overall advertising budget that was 27.7 percent lower than in FY 2010, including an online advertising budget that was 4.9 percent lower than the previous year.
ADVERTISING-GENERATED INQUIRIESOTD receives request for travel kits in response to print, radio, outdoor, electronic and TV advertising. In FY 2011, responses to print advertising were down 38 percent, while the print advertising budget had been reduced by 48 percent. The broadcast advertising budget was reduced by 30 percent, while inquiries related to this medium increased 19 percent. Funding for the non-online advertising eff orts (magazines, newspapers, radio, outdoor and TV) declined by 39.5 percent.
The declines in travel requests refl ect an overall travel industry trend, as more and more travelers use the Web to gather travel information, instead of requesting printed travel information in advance.
PUBLIC RELATIONS EFFORTSPublic relations activities — press outreach, familiarization tours, and visiting journalists — generated more than $9.1 million in advertising value for Maryland tourism products and services, an increase of more than 9.2 percent over the prior year.
TRAVEL MEDIA EXPOSURE
FY 2010
$8,352,937
FY 2009
$6,569,346
FY 2011
$9,120,249
% CHANGE10-11
9.2
VISITMARYLAND.ORG
1812 WEB SITE
ONLINE ADVERTISINGBUDGET
FY 2010
1,774,423
-
$480,728
FY 2009
1,493,041
-
$487,571
FY 2011
1,625,949
61,708
$457,140
% CHANGE10-11
(8.4)
-
(4.9)
ADVERTISING-GENERATEDINQUIRIES
TRAVEL KITS ORDERED VIA WEBSITE
PRINT, RADIO, TV, OUTDOOR AD BUDGET
TOTAL ADVERTISING BUDGET
FY 2009
57,750
36,191
$1,158,634
$1,646,205
FY 2010
60,895
33,062
$921,793
$1,402,521
FY 2011
39,018
21,550
$557,405
$1,014,545
% CHANGE10-11
(35.9)
(34.8)
(39.5)
(27.7)
With the passage of the Tourism Promotion Act in 2008, the Offi ce of Tourism has a new funding source based on the tourism sector’s growth year over year. This funding formula provides another quantitative, policy-backed way to report the impact that tourism has on sales revenue in Maryland. Eight tax codes are tracked and multiplied by a tourism factor — the amount deemed attributable to tourism — by the
Comptroller of Maryland. As the FY 2011 to FY 2010 comparison details below, the tourism industry saw healthy growth in most key categories. Tourism sales tax revenues achieved fi ve percent growth, 40 percent ahead of the pace of overall sales tax collections (3.6 percent), qualifying for additional funding for the fi rst time.
TOTAL (IN MILLIONS) $801.9 $837.9 $342.0 $359.5 5.1
SALES TAX — ALL CATEGORIES $3,761.9 $3,896.2 3.6
CODE
FY 2010FY 2009 FY 2011 % CHANGE10-11
FY 2009 FY 2010 FY 2011 % CHANGE10-11
FY 2010FY 2009 FY 2011 % CHANGE10-11
FY 2010ACTUAL
FY 2011ACTUAL
TOURISM FACTOR
FY 2010ADJUSTED
FY 2011ADJUSTED
% GROWTH
Martin O’Malley, Governor • Anthony G. Brown, Lt. Governor
Christian Johansson, Secretary of the Department of Business & Economic Development Hannah Lee Byron, Assistant Secretary of the Division of Tourism, Film and the Arts • Margot A. Amelia, Executive Director of the Offi ce of Tourism
The FY 2011 Tourism Development Annual Report, published by the Maryland Department of Business & Economic Development’s Offi ce of Tourism, is available free upon request as well as online in the Maryland Offi ce of Tourism section of visitmaryland.org.
We track these eight tourism tax codes on a monthly basis and report them in the Tourism Monitor. We report the tax codes by county on a quarterly basis as well. The chart below details the county tourism code collections adjusted for the Comptroller’s tourism factor. All but three counties grew their tourism revenues during FY 2011.
Source: Comptroller of Maryland*Includes Ocean City
DEPARTMENT OF BUSINESS & ECONOMIC DEVELOPMENTWorld Trade Center • 401 East Pratt Street • Baltimore, Maryland 21202 • 410-767-3400 • 1-877-209-5883 • www.visitmaryland.org
Martin O’Malley, Governor • Anthony G. Brown, Lt. Governor
Christian Johansson, Secretary of the Department of Business & Economic Development Hannah Lee Byron, Assistant Secretary of the Division of Tourism, Film and the Arts • Margot A. Amelia, Executive Director of the Offi ce of Tourism
The FY 2011 Tourism Development Annual Report, published by the Maryland Department of Business & Economic Development’s Offi ce of Tourism, Maryland Offi ce of Tourism
TOURISM SALES & USE TAX CODES BY COUNTY — ADJUSTED FOR TOURISM FACTOR


![Rh ys W illiam s Coe d Coc h Farm s Ltd€¦ · Ob jectives o f th e Presentation d}]v ] YYX Collaboration Innovation Grass Utilisation Positivity . C o ed C o ch Jo int Venture Mo](https://static.documents.pub/doc/80x56/5f5d0e1fb128d37298642c24/rh-ys-w-illiam-s-coe-d-coc-h-farm-s-ltd-ob-jectives-o-f-th-e-presentation-dv-.jpg)


![ASWN 2016 05 Newsletter Final2 - WordPress.com€¦ · v o Ç } v } Z v ] } v o v P ] } v o o À o X d Z ] Ç u Á ] o o Z À } v P µ ] o r ] v µ ] Ç ( µ v ] } v } o o } Á u](https://static.documents.pub/doc/80x56/5f5f572bfee5c75d1e560ed0/aswn-2016-05-newsletter-final2-v-o-v-z-v-v-o-v-p-v-o-o-o-x-d.jpg)

![d^ys W Dd, - Mammoth Resources · 2020-05-27 · ñ Yh/ < & d^ rs o µ ] } v ld ] v P / v Z í î u } v Z P } o Z ] ï ó 9 U í ð 9 ] v Z } ( Z Ç Z P } o ] v o Ç v P Z v](https://static.documents.pub/doc/80x56/5f4aa1247365df7b802ed839/dys-w-dd-mammoth-2020-05-27-yh-d-rs-o-v-ld-v-p-.jpg)

![v o Ç ] } ( Z o } } µ ] v v / D } o ] Z Ç o Z o } } µ ] v Ç > …...v o Ç ] } ( Z o } } µ ] v v / D } o ] Z Ç o Z o } } µ ] v Ç > rD^ lD^ µ ] v P < ] v Æ } r^](https://static.documents.pub/doc/80x56/5f09ae7f7e708231d42801b6/v-o-z-o-v-v-d-o-z-o-z-o-v-v-o-.jpg)
![W o v v d } o / u o u v ] v P À o } ^ } W } i / ] ] } v Æ ...](https://static.documents.pub/doc/80x56/61bd19da61276e740b0f5c07/w-o-v-v-d-o-u-o-u-v-v-p-o-w-i-v-.jpg)
![} µ o > ] v , ] } ] l , ~ í v v...} µ o > ] v , ] } ] l , ~ í v v ... ] o](https://static.documents.pub/doc/80x56/5fd02cfdd4c05260c1627940/-o-v-l-v-v-o-v-l-v-v-.jpg)

![] v µ P Z Z ] o v [ , } ] o Z ] Ç d µ [ Z } v } µ v z ... · Z ] o v v Ç } µ v P } o [ o ] À o ] v µ Ç ] o o v X](https://static.documents.pub/doc/80x56/5b9811be09d3f2e3488ce669/-v-p-z-z-o-v-o-z-c-d-z-v-v-z-z-o-v-v-c-.jpg)


![v } o ] } ] o ] Æ } ] v ] } P } W ] v s } P o } } v o Z } ] ] o ] v …...E Ñ µ o W } ( X EKD D ^ sKdK ~ À } } v ] o v } o ] } ] o ] Æ } ] v ] } P } W ] v s } P o } } v o Z }](https://static.documents.pub/doc/80x56/5f65005098d8c4430038c9e7/v-o-o-v-p-w-v-s-p-o-v-o-z-o-v-e-.jpg)
![& o Z } } ( ] v P ( ' } P } o o } µ P ] D } v · 2019-02-04 · Z u u v µ ] v P ] v ( o o À v X d Z } v v ] } v o À o } ( v ] o Z v Z } ( } µ v ] v } o u ] v o Á X 12[ SROOXWLRQ](https://static.documents.pub/doc/80x56/5f483f266fe8343e605bd7b1/-o-z-v-p-p-o-o-p-d-v-2019-02-04-z-u-u-v-v-p.jpg)

![Binntal-Cervandone-Veglia Mineral Liste je Gesteinstyp ... · D ] v o ] v r> ] ( º ] v v o µ v ] l v P v Ì v & µ v o o v µ ( o À } µ v o s P o ] ~](https://static.documents.pub/doc/80x56/6118f51f2973e40037631901/binntal-cervandone-veglia-mineral-liste-je-gesteinstyp-d-v-o-v-r-.jpg)