Test & Measurement 2012 C O N F E R E N C E & W O R K S H O P 2 - 5 SEPTEMBER 2012 Dr Joseph Anochie-Boateng Council for Scientific & Industrial Research (CSIR) Pretoria, South Africa Improved measurement of aggregate properties for asphalt mix design 05 September 2012
Transcript
Test & Measurement 2012C O N F E R E N C E & W O R K S H O P2 - 5 SEPTEMBER 2012
Dr Joseph Anochie-BoatengCouncil for Scientific & Industrial Research (CSIR)Pretoria, South Africa
Improved measurement of aggregate
properties for asphalt mix design
05 September 2012
HMA
Unbound base
Cemented subbase
Upper selected subgrade
Lower selected subgrade
In situ subgrade
Wheel loading
HMA
Unbound base
Cemented subbase
Upper selected subgrade
Lower selected subgrade
In situ subgrade
Wheel loading
� Aggregates constitute ~ 80 - 95% by mass of layer materials� Function as load transfer and drainage medium� Play an important role in the performance of pavement/track structures
Aggregates in pavements & railway track structures
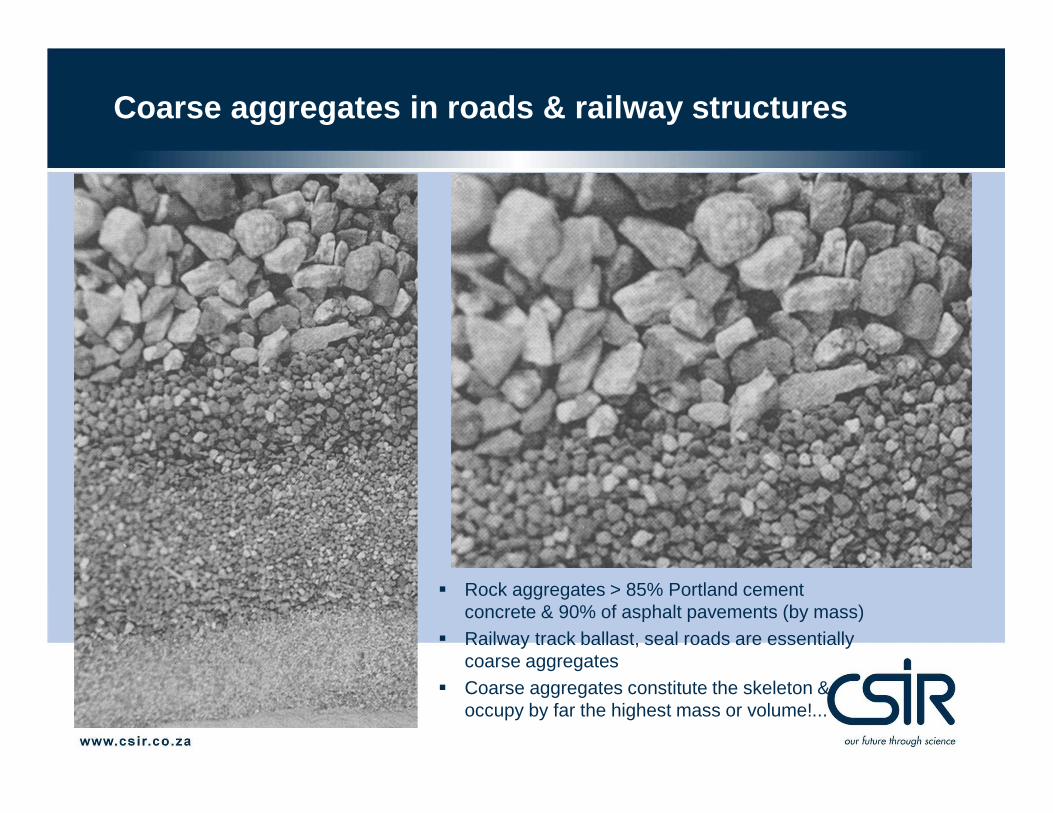
Coarse aggregates in roads & railway structures
� Rock aggregates > 85% Portland cement concrete & 90% of asphalt pavements (by mass)
� Railway track ballast, seal roads are essentially coarse aggregates
� Coarse aggregates constitute the skeleton & occupy by far the highest mass or volume!...
Shape/surface properties
� Equi-dimensional preferred over flaky (flat) and elongated
� Crushed/angular preferred over rounded� Rougher surface textured preferred over smooth� Larger specific surface area preferred
� better bonding of aggregates with Portland cement� better binding of aggregates with bituminous binder
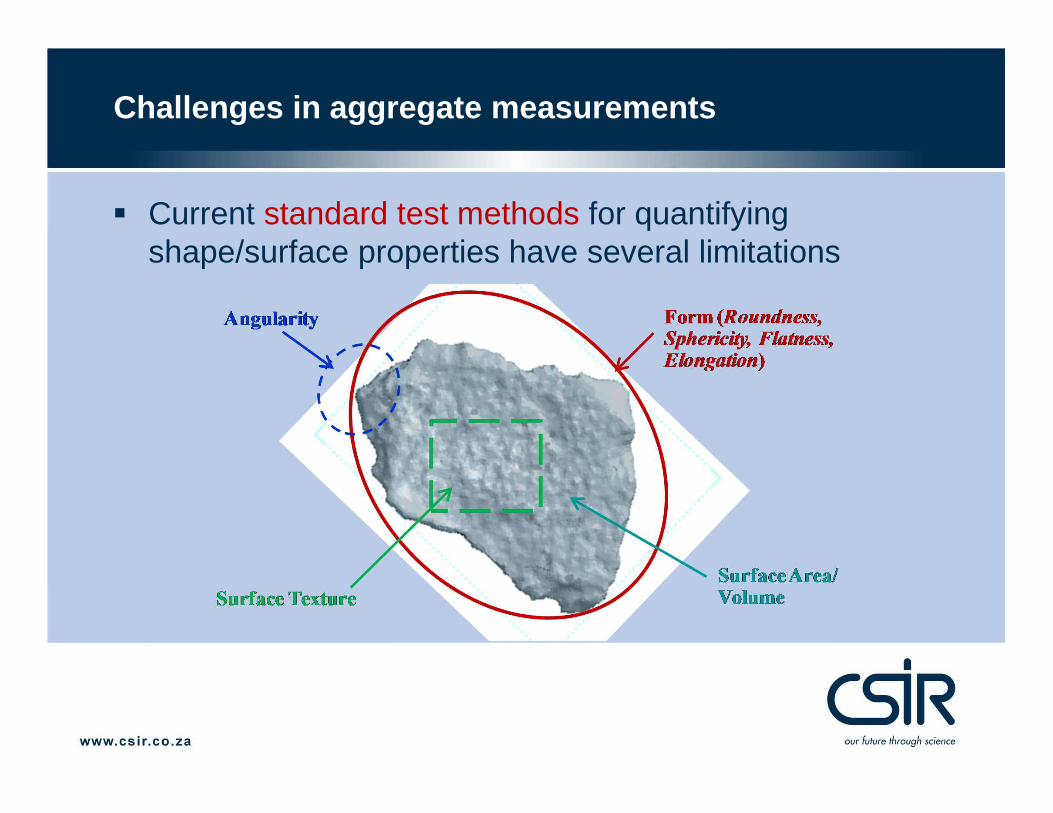
Challenges in aggregate measurements
� Current standard test methods for quantifying shape/surface properties have several limitations
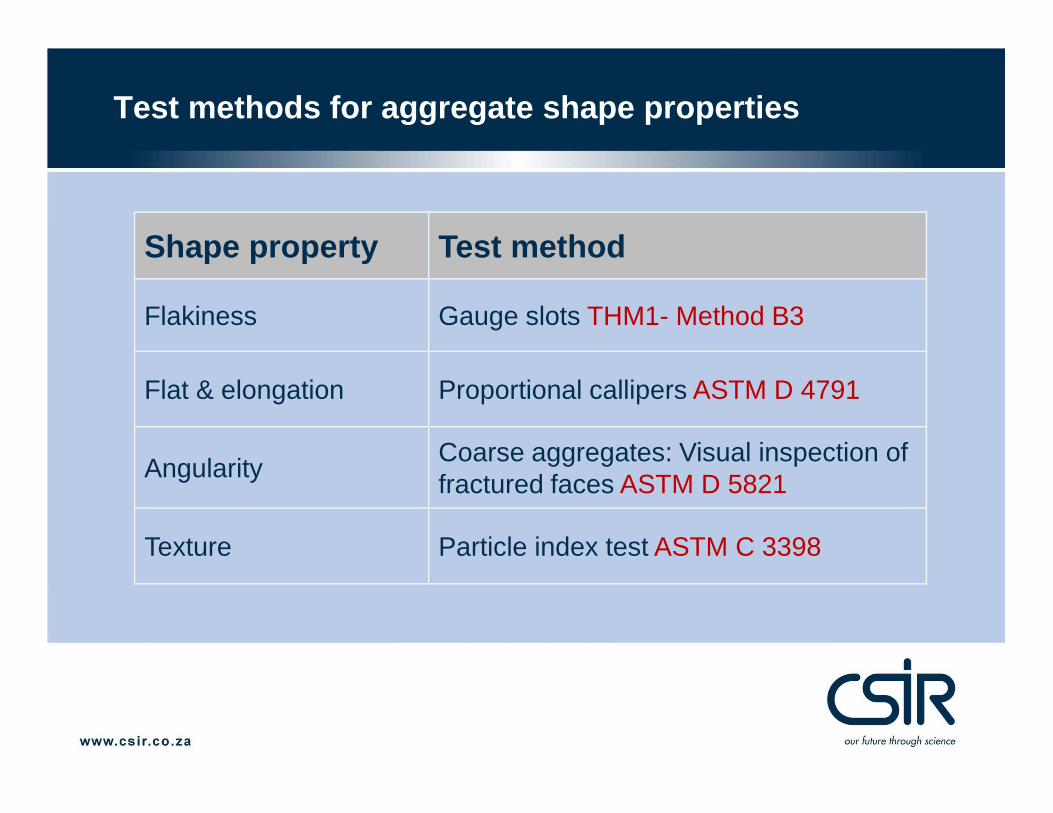
Test methods for aggregate shape properties
Shape property Test method
Flakiness Gauge slots THM1- Method B3
Flat & elongation Proportional callipers ASTM D 4791
AngularityCoarse aggregates: Visual inspection of fractured faces ASTM D 5821
Texture Particle index test ASTM C 3398
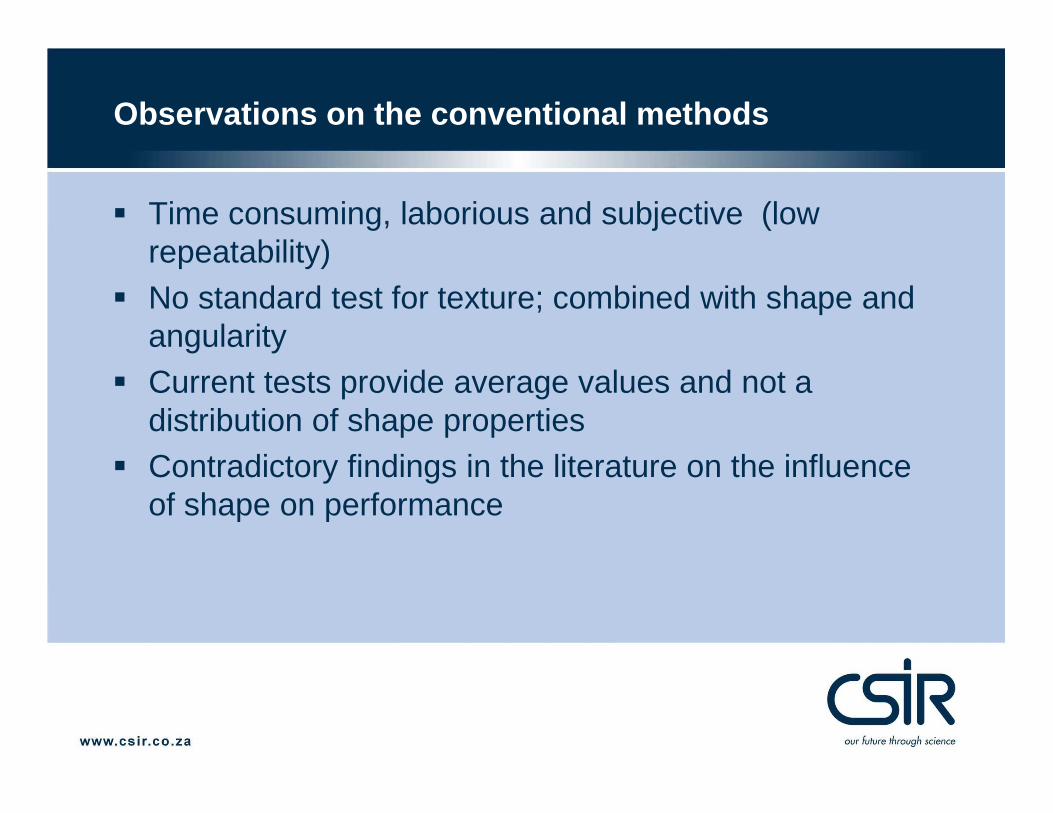
Observations on the conventional methods
� Time consuming, laborious and subjective (low repeatability)
� No standard test for texture; combined with shape and angularity
� Current tests provide average values and not a distribution of shape properties
� Contradictory findings in the literature on the influence of shape on performance
Current state-of-the-practice
� All aggregates presented here are retained on 19 mm sieve by current standard grading methods (TMH 1-Method B4, ASTM C 136, AASHTO T27)
Current state-of-the-art
Image-based techniques
� Generally fast, efficient and automated
� Eliminates subjectivity associated with the conventional methods
� Mostly 2D & quasi-3D
3D Laser-based techniques
� Directly measures 3D properties of aggregates with higher accuracy
� Realistic quantification of shape/ surface properties
Conventional methods� Shape properties not
differentiated� Time, labour intensive� Subjective, low
repeatability� Lack of numerical
quantification
CSIR 3D Laser device
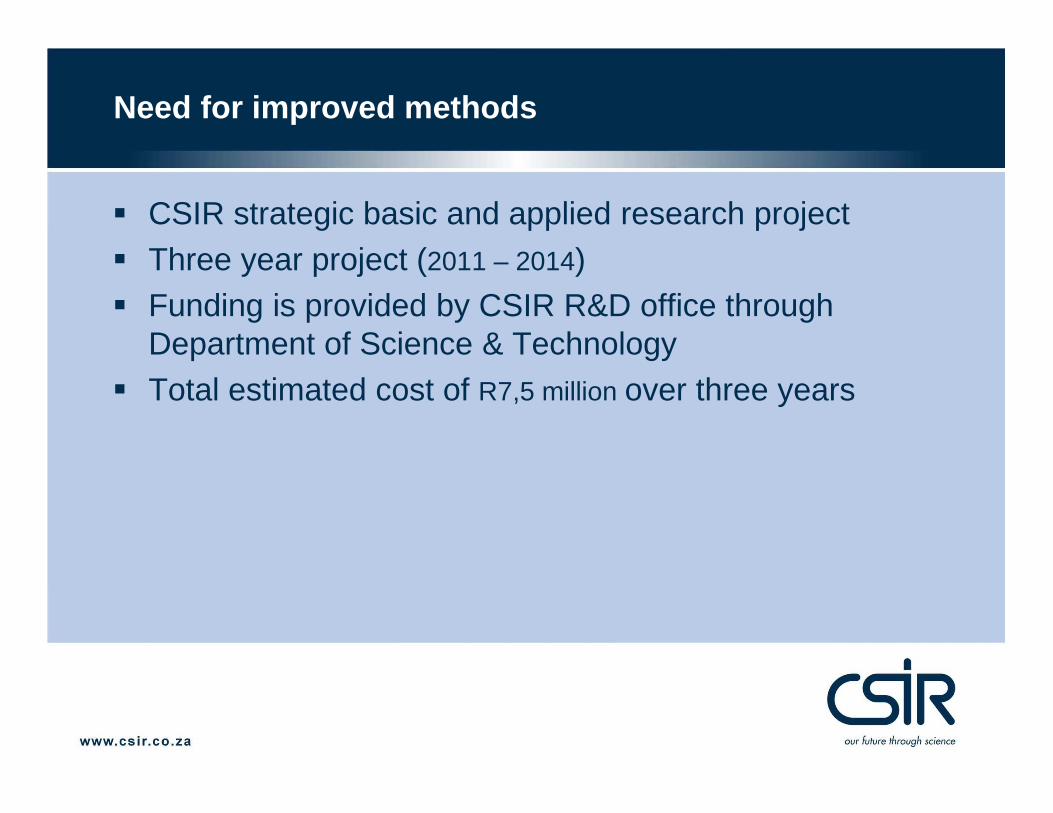
Need for improved methods
� CSIR strategic basic and applied research project� Three year project (2011 – 2014)� Funding is provided by CSIR R&D office through
Department of Science & Technology� Total estimated cost of R7,5 million over three years
Element built in Discrete Element Method (DEM) with desired shape properties
Aggregate processed through 3D Laser scanning
Particle interactionLab testing
F1
F1
F2
F2
F3
F3
F4
F4F5
F5
F6 F6
Aggregate sourcing
3D Polyhedrons
Project overview
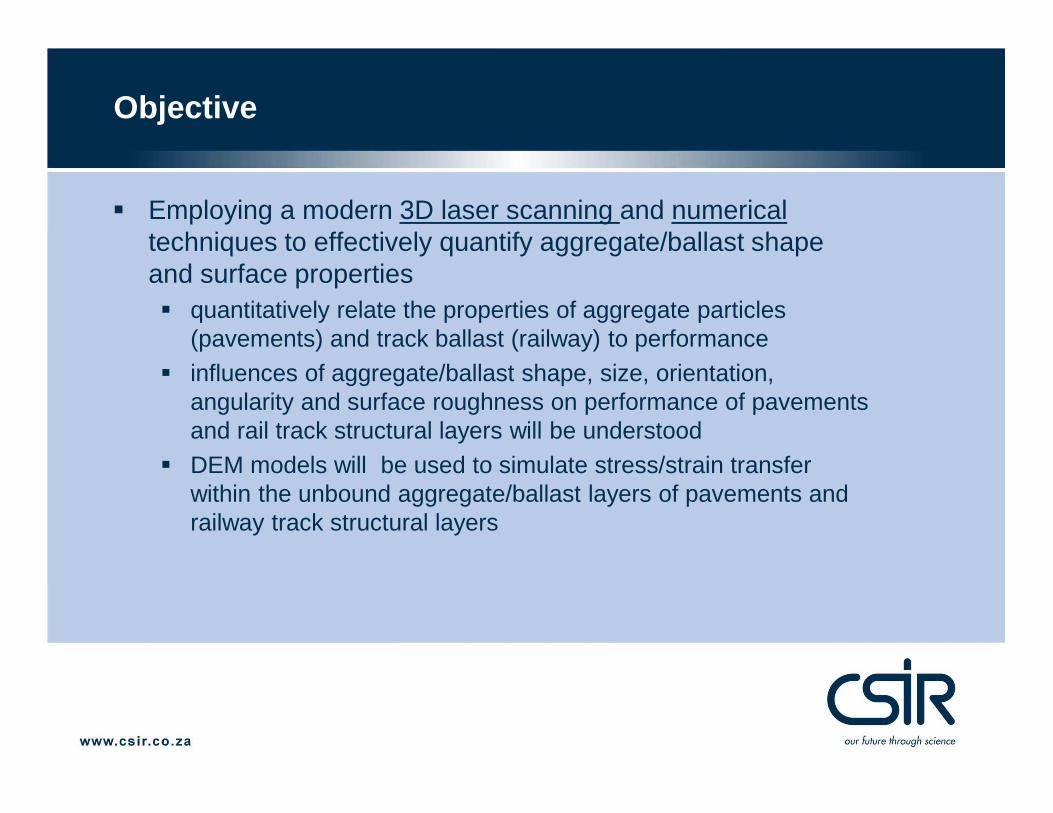
Objective
� Employing a modern 3D laser scanning and numericaltechniques to effectively quantify aggregate/ballast shape and surface properties� quantitatively relate the properties of aggregate particles
(pavements) and track ballast (railway) to performance � influences of aggregate/ballast shape, size, orientation,
angularity and surface roughness on performance of pavements and rail track structural layers will be understood
� DEM models will be used to simulate stress/strain transfer within the unbound aggregate/ballast layers of pavements and railway track structural layers
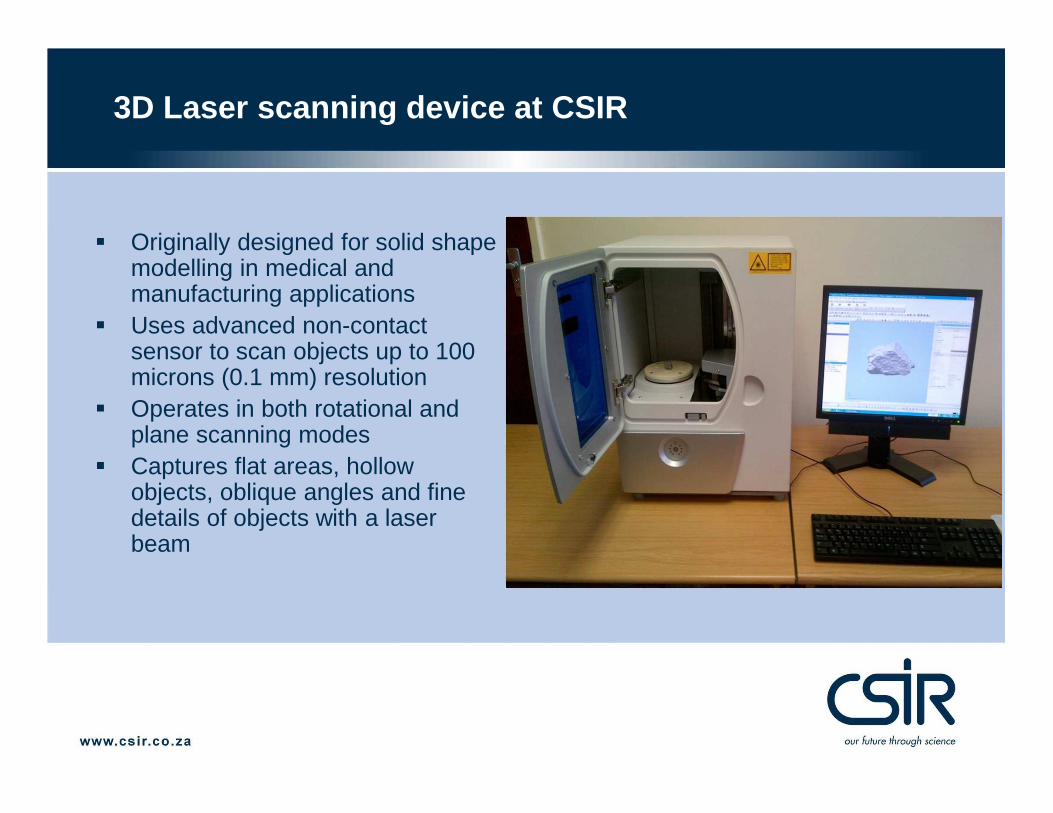
� Originally designed for solid shape modelling in medical and manufacturing applications
� Uses advanced non-contact sensor to scan objects up to 100 microns (0.1 mm) resolution
� Operates in both rotational and plane scanning modes
� Captures flat areas, hollow objects, oblique angles and fine details of objects with a laser beam
3D Laser scanning device at CSIR
Rapidform software
3D Laser scanning at the CSIR
Page 10 from 17
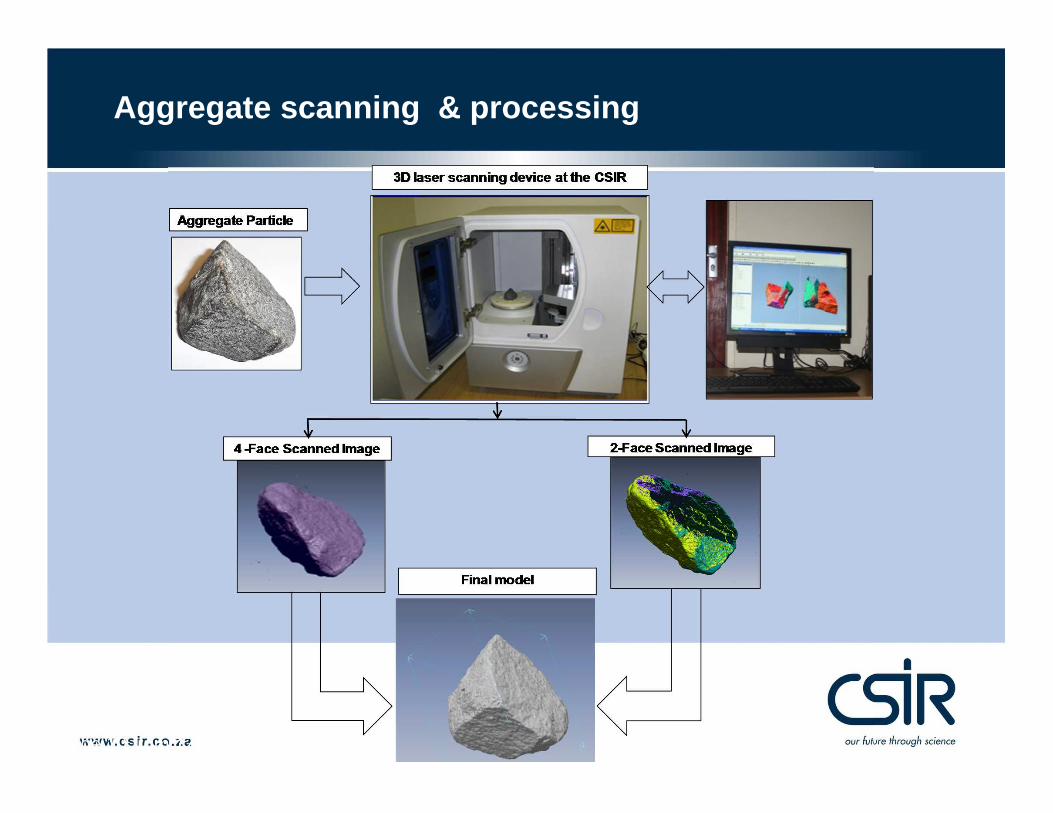
Aggregate scanning & processing
Modelled aggregate particles
Actual Scanned
Actual Scanned
17
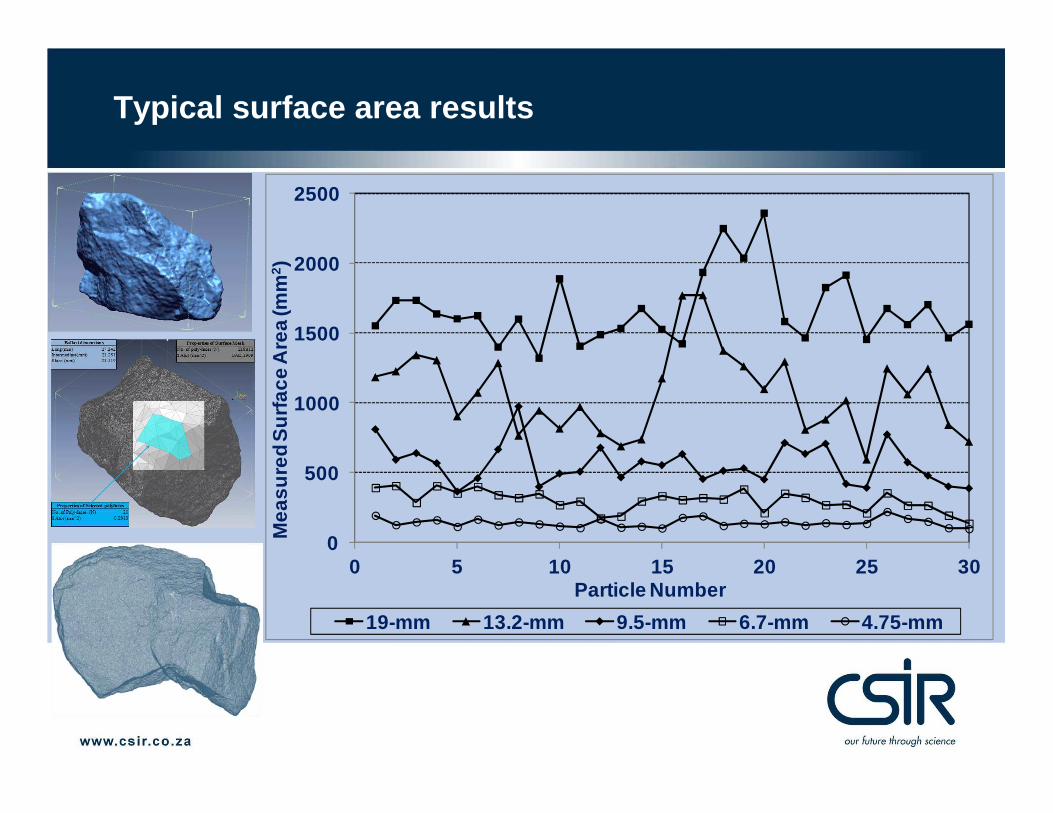
0
500
1000
1500
2000
2500
0 5 10 15 20 25 30 35
Mea
sure
d su
rfac
e are
a (m
m2 )
Particle number
19-mm 13.2-mm9.5-mm 6.7-mm4.75-mm
Mix 1
0
500
1000
1500
2000
2500
3000
0 5 10 15 20 25 30 35
Mea
sure
d su
rfac
e ar
ea (m
m2 )
Particle number
19-mm 13.2-mm9.5-mm 6.7-mm4.75-mm
Mix 2
Mix 1
Mix 2
Surface areas of coarse aggregates in 5 asphalt mixes
18
0
500
1000
0 5 10 15 20 25 30 35
Mea
sure
d su
rfac
e are
a (m
m2 )
Particle number
9.5-mm 6.7-mm4.75-mm Mix 3
0
500
1000
0 5 10 15 20 25 30 35
Mea
sure
d su
rfac
e are
a (m
m2 )
Particle number
9.5-mm 6.7-mm4.75-mm Mix 4
Mix 3
Mix 4
Surface areas of coarse aggregates in 5 asphalt mixes
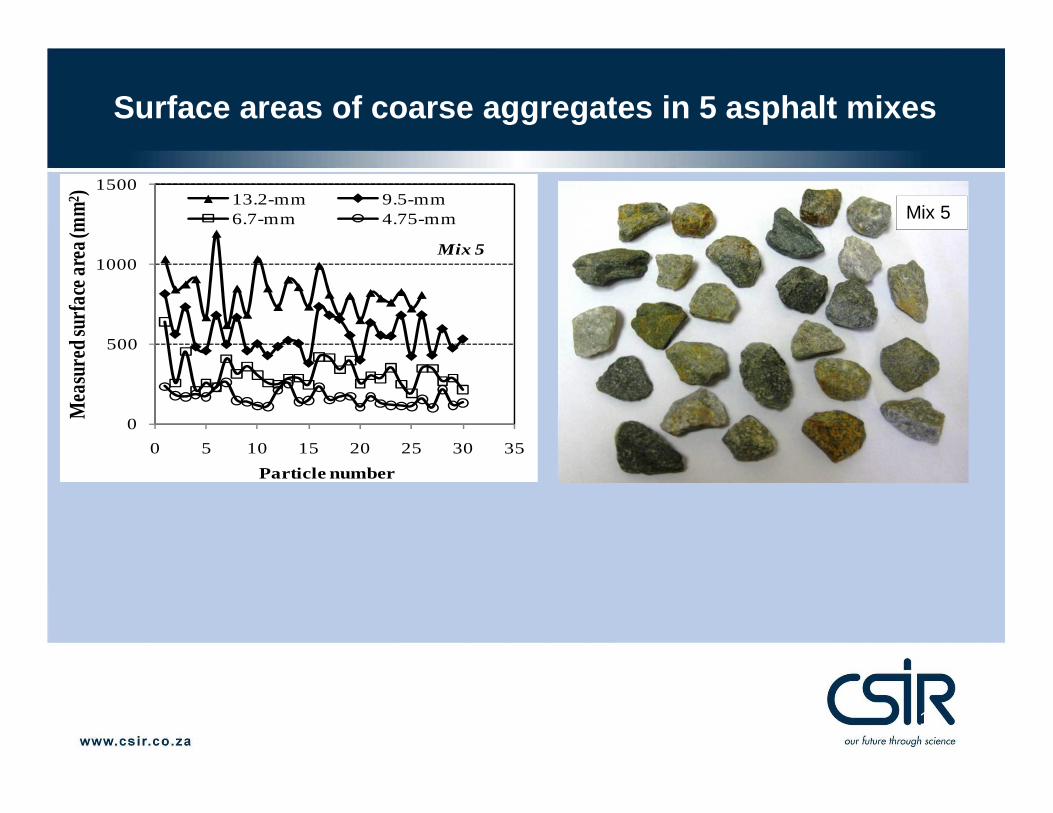
19
Mix 5
0
500
1000
1500
0 5 10 15 20 25 30 35
Mea
sure
d su
rfac
e are
a (m
m2 )
Particle number
13.2-mm 9.5-mm6.7-mm 4.75-mm
Mix 5
Surface areas of coarse aggregates in 5 asphalt mixes
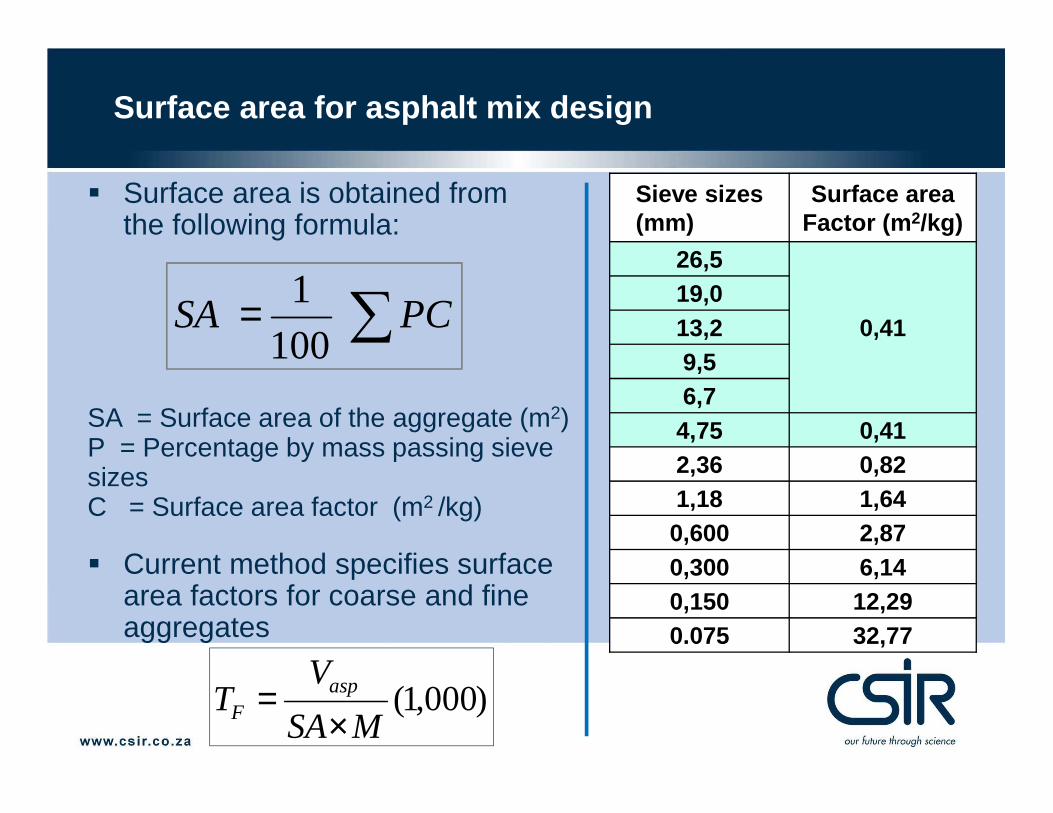
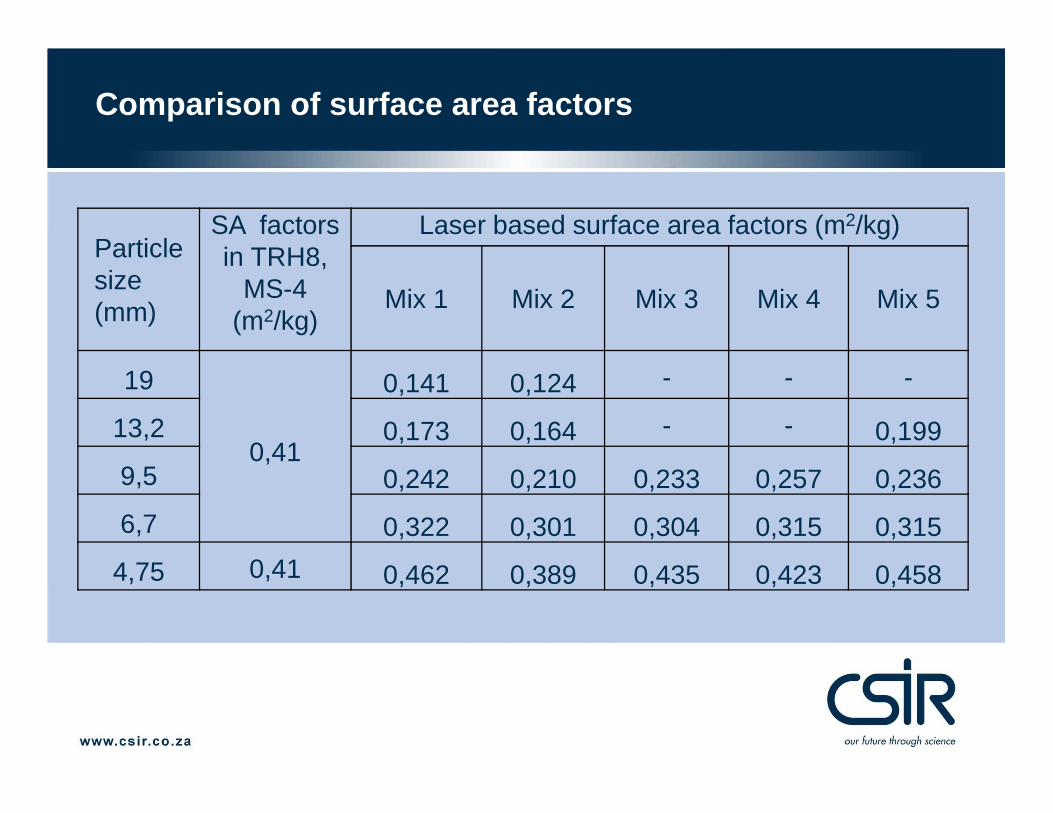
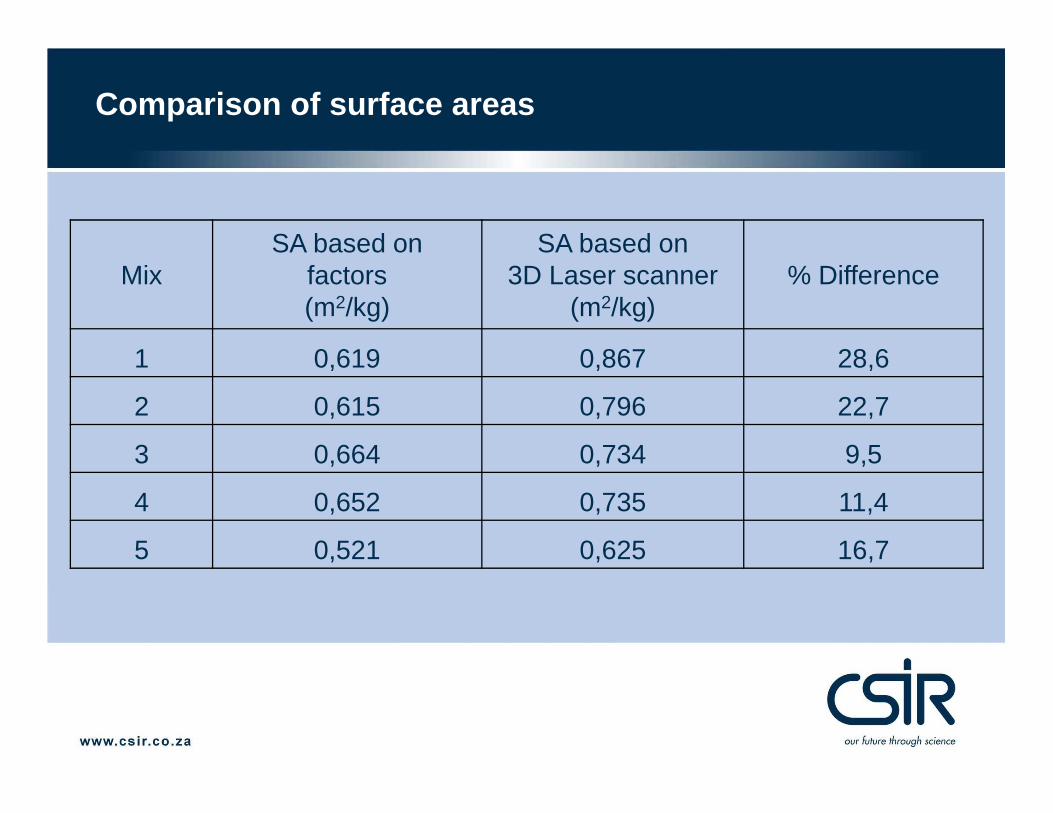
∑= PC SA 100
1
SA = Surface area of the aggregate (m2)P = Percentage by mass passing sieve sizesC = Surface area factor (m2 /kg)


![Parameterized Mode Truncation Technique in MEMS · PDF fileParameterized Mode Truncation Technique in MEMS Design ... q4 ASIC @ master node THM1 S + displ ... [K-LM]X = 0 Static analysis](https://static.documents.pub/doc/80x56/5abc3b227f8b9af27d8db84e/parameterized-mode-truncation-technique-in-mems-mode-truncation-technique-in.jpg)


