16
W1188 Progress Report Tyson E. Ochsner USDA-ARS St. Paul, MN Jan. 3, 2005
| Date post: | 16-Dec-2015 |
| Category: |
Documents |
| Upload: | george-porter |
| View: | 214 times |
| Download: | 0 times |
W1188 Progress Report
Tyson E. Ochsner USDA-ARS St. Paul, MN
Jan. 3, 2005

The surface energy balance
LEHGRn 0
SGG r 0
Gr = heat flux at the reference depth zr
S = rate of change of heat storage in the soil above the reference depth
G0 = heat flux at the soil surface

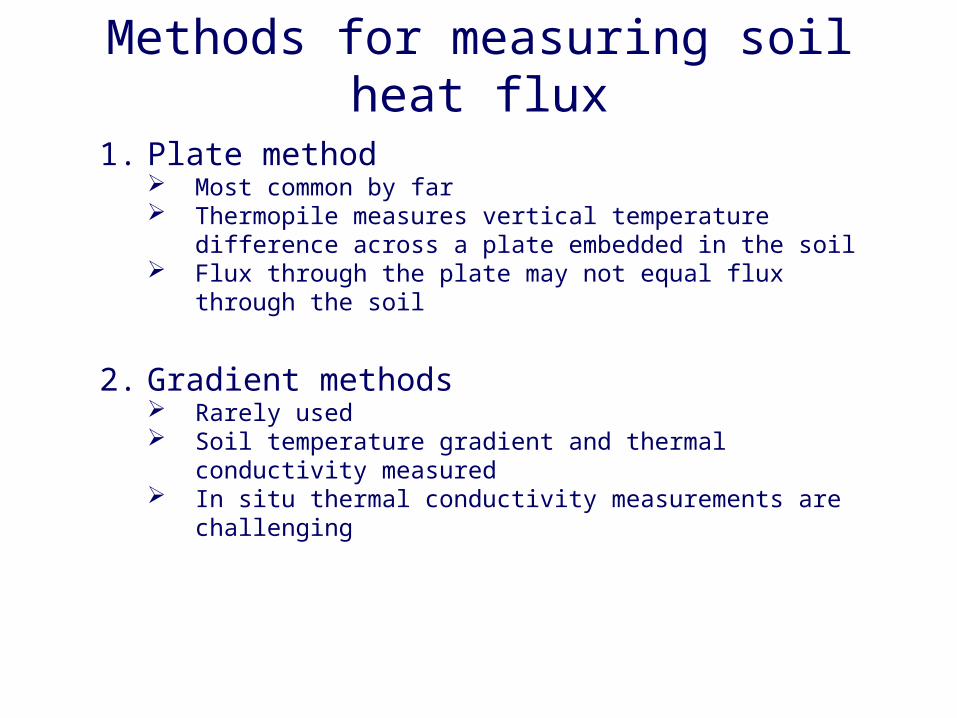
Methods for measuring soil heat flux
1. Plate method Most common by far Thermopile measures vertical temperature difference
across a plate embedded in the soil Flux through the plate may not equal flux through the
soil

Methods for measuring soil heat flux
1. Plate method Most common by far Thermopile measures vertical temperature difference
across a plate embedded in the soil Flux through the plate may not equal flux through the
soil
2. Gradient methods Rarely used Soil temperature gradient and thermal conductivity
measured In situ thermal conductivity measurements are
challenging

Leads
Epoxy
Thermocouple
Resistanceheater SS tubing
6 mm
6 mm
1.3
40 mm
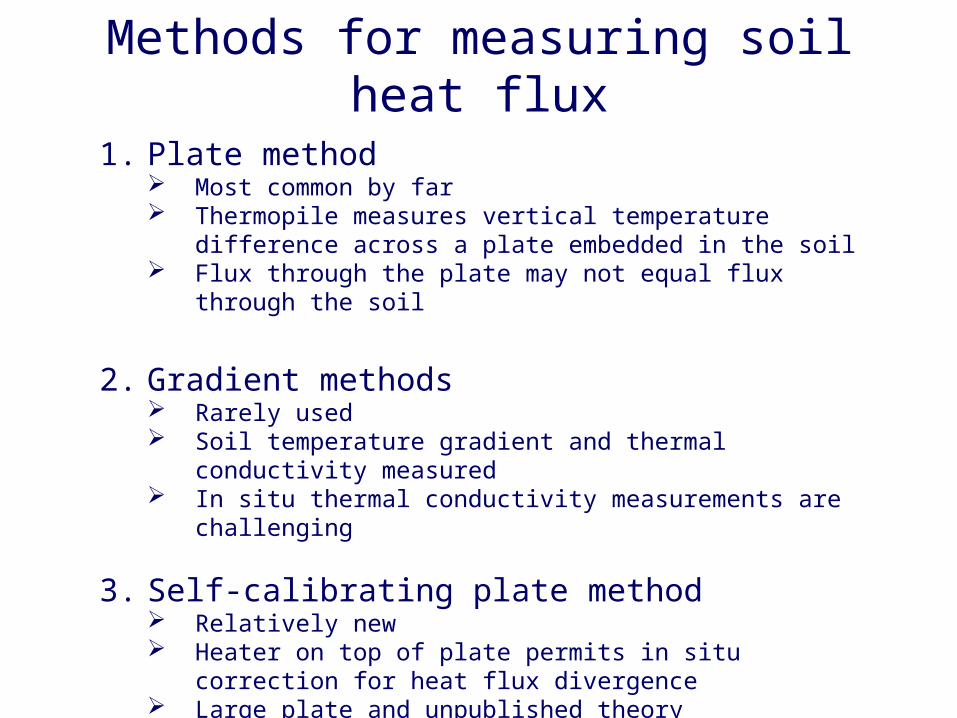
Methods for measuring soil heat flux
1. Plate method Most common by far Thermopile measures vertical temperature difference
across a plate embedded in the soil Flux through the plate may not equal flux through the
soil
2. Gradient methods Rarely used Soil temperature gradient and thermal conductivity
measured In situ thermal conductivity measurements are
challenging
3. Self-calibrating plate method Relatively new Heater on top of plate permits in situ correction for
heat flux divergence Large plate and unpublished theory

3 needle gradient Gr (W m-2)
-150 -75 0 75 150 225
1 ne
edle
gra
dien
t Gr (
W m
-2)
-150
-75
0
75
150
225
HF
T1.
1 pl
ate
Gr (
W m
-2)
-75
0
75
150
225Bare soil site
a
b
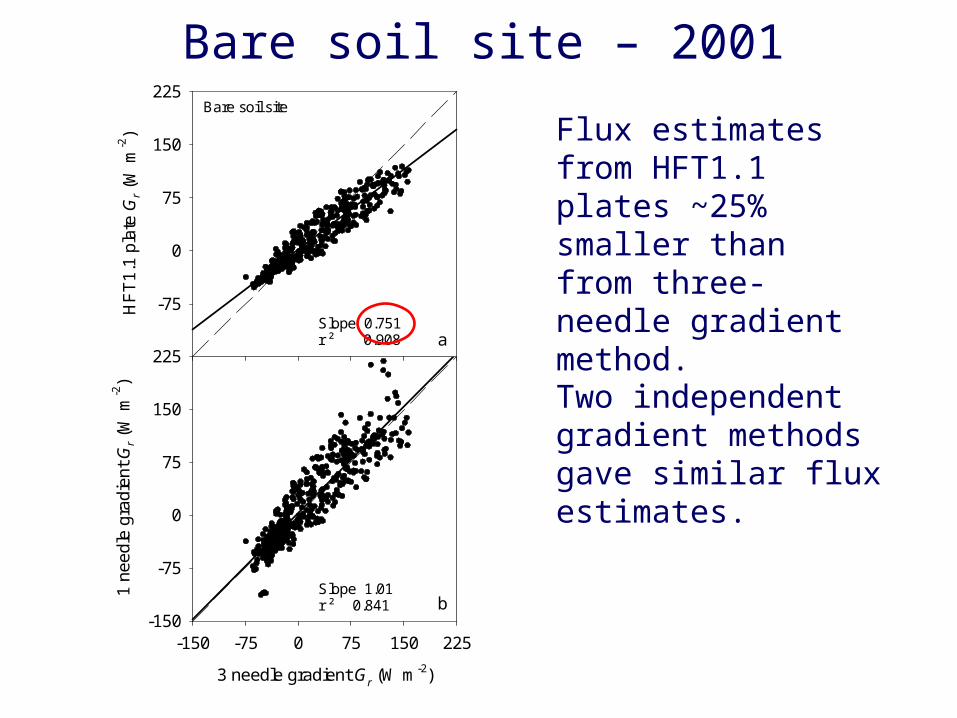
Slope 0.751r ² 0.908
Slope 1.01r ² 0.841
Flux estimates from HFT1.1 plates ~25% smaller than from three-needle gradient method.
Bare soil site – 2001
Two independent gradient methods gave similar flux estimates.

3 needle gradient Gr (W m-2)
-60 -40 -20 0 20 40 60 80
1 ne
edl
e g
radi
ent
Gr (
W m
-2)
-60
-40
-20
0
20
40
60
80
HF
T1
.1 p
late
Gr (
W m
-2)
-40
-20
0
20
40
60
80Corn site
a
b
Slope 0.755r ² 0.982
Slope 0.976r ² 0.988
Corn site – 2002
Flux estimates from HFT1.1 plates ~25% smaller than from three-needle gradient method.
Two independent gradient methods gave similar flux estimates.

3 needle gradient Gr (W m-2)
-40 -20 0 20 40 60
HF
P01
SC
pla
tes
Gr (
W m
-2)
-40
-20
0
20
40
HF
T1.
1 pl
ates
Gr (
W m
-2)
-40
-20
0
20
40
60Soybean site
a
b
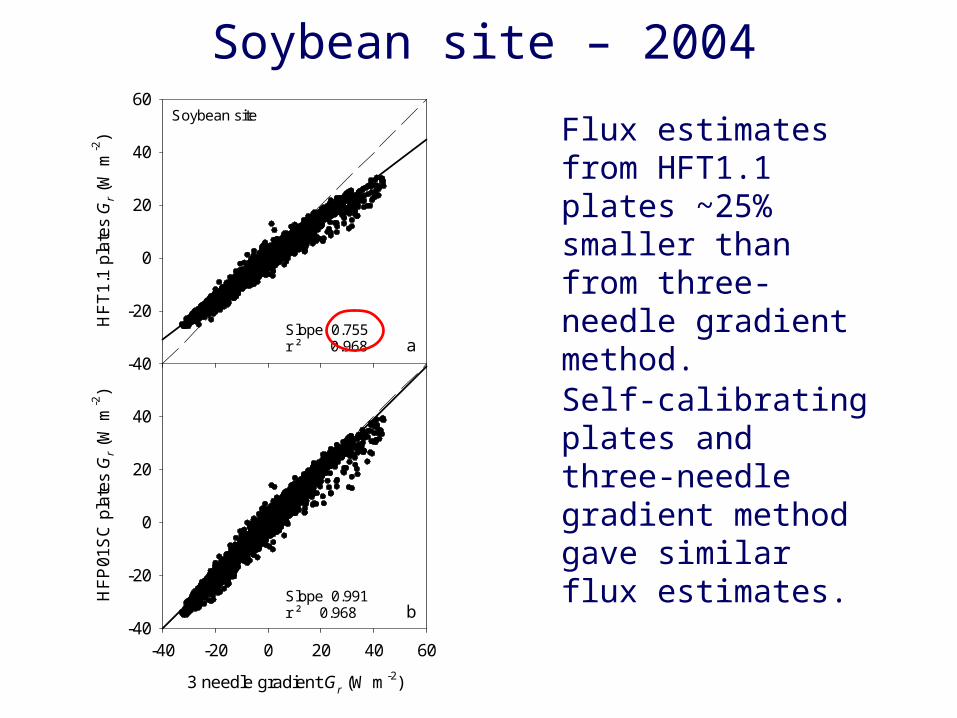
Slope 0.755r ² 0.968
Slope 0.991r ² 0.968
Soybean site – 2004
Flux estimates from HFT1.1 plates ~25% smaller than from three-needle gradient method.
Self-calibrating plates and three-needle gradient method gave similar flux estimates.

Bare soil site – 2001
Flux estimates by the HFT1.1 plates were better than those from the other three types we tested.
Regression statistics for plate versus three needle gradient heat flux estimates.
Plate Slope Intercept r2 Mean absolute
difference
W m-2 W m-2
HFT1.1 0.751 2.28 0.908 14.2
CN3 0.640 1.82 0.913 17.4
GHT-1C 0.522 3.49 0.852 22.8
610 0.328 1.19 0.912 29.4

Conclusions
• Heat flux plates typically underestimate the magnitude of soil heat flux.
• The best of the four types of plates we tested underestimated the flux by about 25%.
• The three-needle gradient method and the self-calibrating plate method are promising alternatives.
• Further development of these methods are needed for frozen soil conditions.

Collaborators
• Thomas J. Sauer, USDA-ARS, National Soil Tilth Laboratory, Ames, IA
•Robert Horton, Dep. of Agronomy, Iowa State University, Ames, IA


