4
DEVELOPMENT POTENTIAL NORTH OF HYDE PARK HOTEL TO RESIDENTIAL CONVERSION OPPORTUNITIES QUEENSWAY OUTPERFORMS PRIME CENTRAL LONDON W2 2014 LONDON MARKET FOCUS RESIDENTIAL RESEARCH

DEVELOPMENT POTENTIAL NORTH OF HYDE PARK
HOTEL TO RESIDENTIAL CONVERSION OPPORTUNITIES
QUEENSWAY OUTPERFORMS PRIME CENTRAL LONDON
W2 2014LONDON MARKET FOCUS
RESIDENTIAL RESEARCH
2
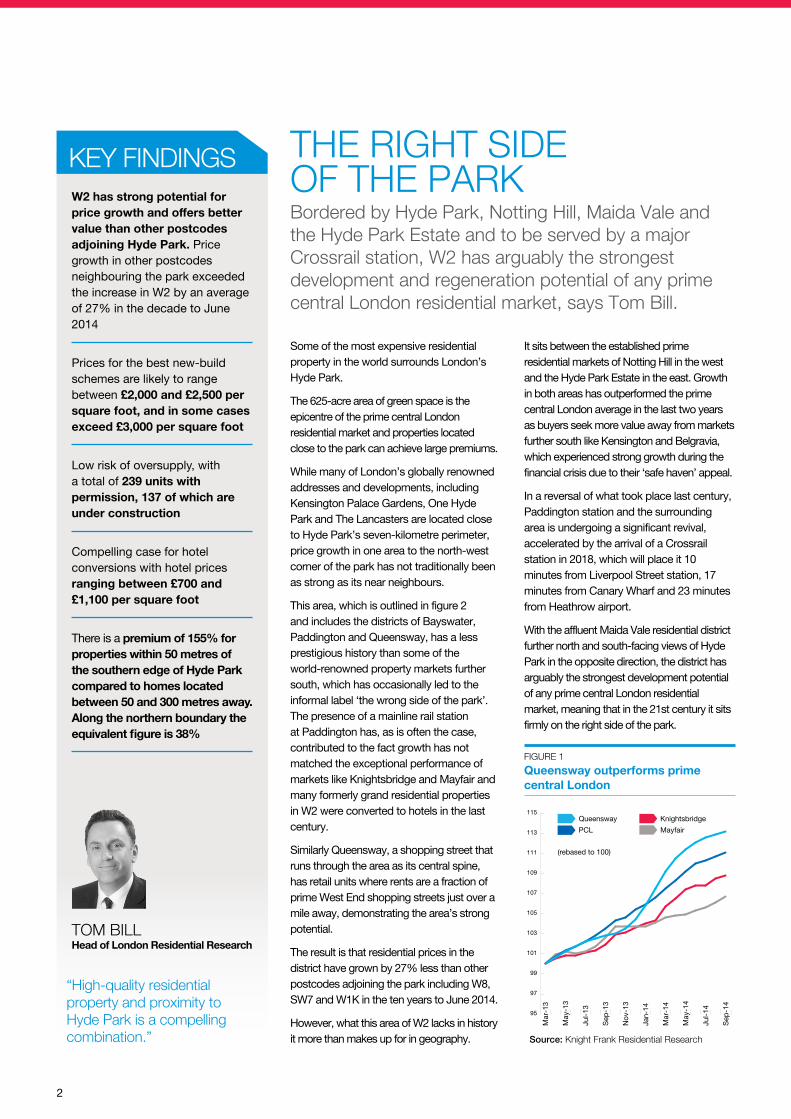
FIGURE 1 Queensway outperforms prime central London
Some of the most expensive residential property in the world surrounds London’s Hyde Park.
The 625-acre area of green space is the epicentre of the prime central London residential market and properties located close to the park can achieve large premiums.
While many of London’s globally renowned addresses and developments, including Kensington Palace Gardens, One Hyde Park and The Lancasters are located close to Hyde Park’s seven-kilometre perimeter, price growth in one area to the north-west corner of the park has not traditionally been as strong as its near neighbours.
This area, which is outlined in figure 2 and includes the districts of Bayswater, Paddington and Queensway, has a less prestigious history than some of the world-renowned property markets further south, which has occasionally led to the informal label ‘the wrong side of the park’. The presence of a mainline rail station at Paddington has, as is often the case, contributed to the fact growth has not matched the exceptional performance of markets like Knightsbridge and Mayfair and many formerly grand residential properties in W2 were converted to hotels in the last century.
Similarly Queensway, a shopping street that runs through the area as its central spine, has retail units where rents are a fraction of prime West End shopping streets just over a mile away, demonstrating the area’s strong potential.
The result is that residential prices in the district have grown by 27% less than other postcodes adjoining the park including W8, SW7 and W1K in the ten years to June 2014.
However, what this area of W2 lacks in history it more than makes up for in geography.
It sits between the established prime residential markets of Notting Hill in the west and the Hyde Park Estate in the east. Growth in both areas has outperformed the prime central London average in the last two years as buyers seek more value away from markets further south like Kensington and Belgravia, which experienced strong growth during the financial crisis due to their ‘safe haven’ appeal.
In a reversal of what took place last century, Paddington station and the surrounding area is undergoing a significant revival, accelerated by the arrival of a Crossrail station in 2018, which will place it 10 minutes from Liverpool Street station, 17 minutes from Canary Wharf and 23 minutes from Heathrow airport.
With the affluent Maida Vale residential district further north and south-facing views of Hyde Park in the opposite direction, the district has arguably the strongest development potential of any prime central London residential market, meaning that in the 21st century it sits firmly on the right side of the park.
THE RIGHT SIDE OF THE PARK Bordered by Hyde Park, Notting Hill, Maida Vale and the Hyde Park Estate and to be served by a major Crossrail station, W2 has arguably the strongest development and regeneration potential of any prime central London residential market, says Tom Bill.
W2 has strong potential for price growth and offers better value than other postcodes adjoining Hyde Park. Price growth in other postcodes neighbouring the park exceeded the increase in W2 by an average of 27% in the decade to June 2014
Prices for the best new-build schemes are likely to range between £2,000 and £2,500 per square foot, and in some cases exceed £3,000 per square foot
Low risk of oversupply, with a total of 239 units with permission, 137 of which are under construction
Compelling case for hotel conversions with hotel prices ranging between £700 and £1,100 per square foot
There is a premium of 155% for properties within 50 metres of the southern edge of Hyde Park compared to homes located between 50 and 300 metres away. Along the northern boundary the equivalent figure is 38%
KEY FINDINGS
“High-quality residential property and proximity to Hyde Park is a compelling combination.”
TOM BILL Head of London Residential Research
95
97
99
101
103
105
107
109
111
113
115
Mar
-13
May
-13
Jul-
13
Sep
-13
Nov
-13
Jan-
14
Mar
-14
May
-14
Jul-
14
Sep
-14
Source: Knight Frank Residential Research
Queensway PCL
Knightsbridge Mayfair
(rebased to 100)

3
H
Hyde Park
Westbourne Grove
Westbourne Terrace
Moscow RdQ
ueensway
Inverness Terrace
Porchester Terrace
Bayswater Rd Queensway
Bayswater
London Paddington
PaddingtonUnderground
Paddington
Lancaster Gate
Notting Hill Gate
1
6
2
9
4 11 3
713
8 10
RESIDENTIAL RESEARCHW2 2014
FIGURE 2 Key residential schemes in W2
FIGURE 3 W2 development pipeline
We believe the above area of W2 will benefit from a shift that has taken place in prime central London in recent years. Demand is increasingly focussing on a property’s characteristics and services and less narrowly on its postcode.
This trend can be seen in figure 1, which shows that Knight Frank’s Queensway residential index has outperformed the prime central London average and established prime markets like Mayfair and Knightsbridge over the last 18 months.
There is no doubt that with domestic and overseas demand for prime London property rising significantly after the financial crash, buyers have become prepared to look outside the traditional golden postcodes to secure value.
The completion of The Lancasters development in 2011, a 77-unit scheme near Lancaster Gate with views over Hyde Park, exemplifies this trend and set a new benchmark for quality in the area.
A high-specification finish and facilities including underground parking, a 24-hour
concierge, a gym and a pool attracted buyers to the area and the best apartments now sell for in excess of £3,000 per square foot in the re-sale market.
Where the Lancasters led, others are following and figure 2 illustrates the key developments in the area. While activity is rising, the small number of new schemes means there is a low risk of oversupply, with a total of 239 units with permission in the district, 137 of which are under construction.
Prices for the best new-build schemes are likely to range between £2,000 and £2,500 per square foot, and in some cases exceed £3,000, which compares to £4,000, £5,000 or even £6,000 for some schemes close to the other three sides of Hyde Park.
Knight Frank research, which compared sold prices within 50 metres of the park and those located between 50 and 300 metres away, shows there is a premium of 155% for properties within 50 metres of the south of Hyde Park compared to 38% along the northern edge, underlining the area’s potential. The premium is a result of stronger demand as well as property size and type.
THE REGENERATION GAP
Source: Knight Frank Residential Research / Molior / EGi
1 Queens Status CompletedPrivate Units 16Developer Derwent London
3 Inverness Terrace Status Under ConstructionPrivate Units 20Developer DCD Properties
7 119-122 Bayswater Road Status Full permission - not startedPrivate Units 22Developer Fenton Whelan
2 Westbourne House Status Under ConstructionPrivate Units 20Developer Alchemi Group
9 52-57 Princes Square Status Full permission - not startedPrivate Units 8Developer TBC
4 7-12 Leinster Square Status Under ConstructionPrivate Units 11Developer Alchemi Group
10 The Lancasters Status Completed and soldPrivate Units 77Developer Northacre / Minerva
11 13-19 Leinster Square Status Awaiting Planning ApprovalPrivate Units 15Developer Alchemi Group
12 Leinster House Status Full permission - not startedPrivate Units 9Developer TBC
13 Westland Hotel Status Awaiting Planning ApprovalPrivate Units 15Developer TBC
6 One Westbourne Gardens Status Complete Q4 2014Private Units 9Developer Fruition Properties
5 The Hempel Collection Status Under ConstructionPrivate Units 33Developer Amazon Property and British Land
21+ Units 11-20 Units
6-10 Units 1-5 Units
25
20
15
10
5
0
Schemes with permission
Schemes underconstruction
Total number of units… 239
Num
ber
of s
chem
es
…of which the total under construction is 137
8 2 and 4 Inverness Terrace Status Full permission - not startedPrivate Units 12Developer TBC
12
5
Knight Frank Research Reports are available at KnightFrank.com/Research
© Knight Frank LLP 2014This report is published for general information only and not to be relied upon in any way. Although high standards have been used in the preparation of the information, analysis, views and projections presented in this report, no responsibility or liability whatsoever can be accepted by Knight Frank LLP for any loss or damage resultant from any use of, reliance on or reference to the contents of this document. As a general report, this material does not necessarily represent the view of Knight Frank LLP in relation to particular properties or projects. Reproduction of this report in whole or in part is not allowed without prior written approval of Knight Frank LLP to the form and content within which it appears. Knight Frank LLP is a limited liability partnership registered in England with registered number OC305934. Our registered office is 55 Baker Street, London, W1U 8AN, where you may look at a list of members’ names.
Knight Frank Residential Research provides strategic advice, consultancy services and forecasting to a wide range of clients worldwide including developers, investors, funding organisations, corporate institutions and the public sector. All our clients recognise the need for expert independent advice customised to their specific needs.
RESIDENTIAL RESEARCHTom Bill Head of London Residential Research +44 20 7861 1492 [email protected]
LONDON RESIDENTIALRupert Dawes Head of New Homes +44 20 7861 5445 [email protected]
Priya Pannu Partner, Residential Development +44 20 7861 5489 [email protected]
Fenella Freeland Head of Hyde Park Office +44 20 7871 5068 [email protected]
Caroline Foord Head of Notting Hill Office +44 20 7313 9111 [email protected]
Less expensive
More expensive
Lesss expex nsis ve
More expensiveve
Notting Hill
Hyde Park Estate
Knightsbridge
Chelsea
Belgravia
Mayfair
Kensington
Hyde Park
Bayswater
Queensway
Notting Hill Gate
High Street KensingtonKnightsbridge
Hyde Park Corner
Bond StreetMarble Arch
Lancaster Gate
The regeneration potential of the area was further underlined by reports last year that a wealthy Far Eastern investor had bought the Whiteleys shopping centre at the north end of Queensway as part of a wider redevelopment plan that may include other parts of the shopping street, which leads onto Hyde Park at its southern end.
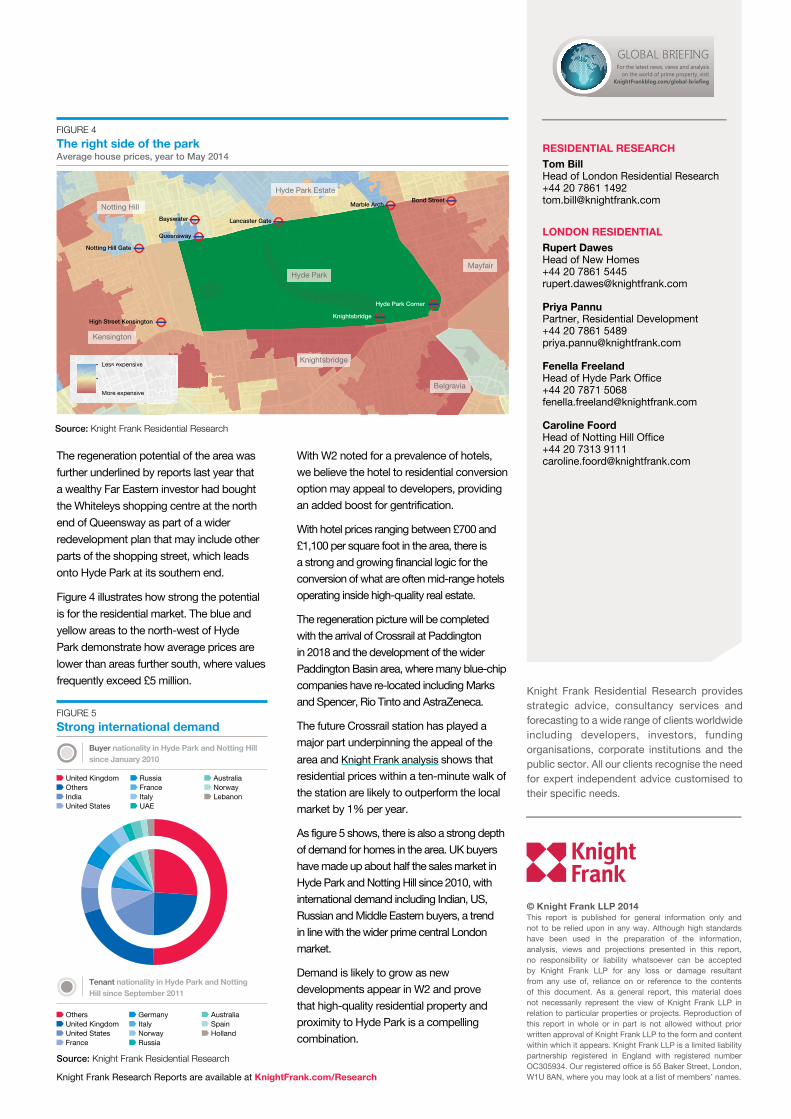
Figure 4 illustrates how strong the potential is for the residential market. The blue and yellow areas to the north-west of Hyde Park demonstrate how average prices are lower than areas further south, where values frequently exceed £5 million.
With W2 noted for a prevalence of hotels, we believe the hotel to residential conversion option may appeal to developers, providing an added boost for gentrification.
With hotel prices ranging between £700 and £1,100 per square foot in the area, there is a strong and growing financial logic for the conversion of what are often mid-range hotels operating inside high-quality real estate.
The regeneration picture will be completed with the arrival of Crossrail at Paddington in 2018 and the development of the wider Paddington Basin area, where many blue-chip companies have re-located including Marks and Spencer, Rio Tinto and AstraZeneca.
The future Crossrail station has played a major part underpinning the appeal of the area and Knight Frank analysis shows that residential prices within a ten-minute walk of the station are likely to outperform the local market by 1% per year.
As figure 5 shows, there is also a strong depth of demand for homes in the area. UK buyers have made up about half the sales market in Hyde Park and Notting Hill since 2010, with international demand including Indian, US, Russian and Middle Eastern buyers, a trend in line with the wider prime central London market.
Demand is likely to grow as new developments appear in W2 and prove that high-quality residential property and proximity to Hyde Park is a compelling combination.
FIGURE 5 Strong international demand
FIGURE 4 The right side of the park Average house prices, year to May 2014
United Kingdom Others India United States
Russia France Italy UAE
Australia Norway Lebanon
Others United Kingdom United States France
Germany Italy Norway Russia
Australia Spain Holland
Buyer nationality in Hyde Park and Notting Hill since January 2010
Tenant nationality in Hyde Park and Notting Hill since September 2011
Source: Knight Frank Residential Research
Source: Knight Frank Residential Research


