42
1 Questionnaire Design
| Date post: | 02-Jun-2018 |
| Category: |
Documents |
| Upload: | edwasalampamujo |
| View: | 243 times |
| Download: | 0 times |

8/11/2019 W5 Questionnaire Design
http://slidepdf.com/reader/full/w5-questionnaire-design 1/42
1
Questionnaire Design

8/11/2019 W5 Questionnaire Design
http://slidepdf.com/reader/full/w5-questionnaire-design 2/42
2
Guiding Principle
Respondents should be able and willing toprovide the information requested
respondents may not be able to recall the
information “How much did you spend on films in the last 3
years?”
questions may be unclear or ambiguous
“Do you agree with the government‟s philosophy?”
questions may invade respondent‟s privacy
“How much did you earn last year?”
the “good subject” effect

8/11/2019 W5 Questionnaire Design
http://slidepdf.com/reader/full/w5-questionnaire-design 3/42
3
Multiple Items
Many theoretical constructs are multi-faceted; multiple questions are needed toassess them
average of multiple items = score on construct
multiple measures of a single constructincreases reliability (freedom from noise)
the multiple measures of one constructshould be “sprinkled” across thequestionnaire
responses to related questions “clump up"

8/11/2019 W5 Questionnaire Design
http://slidepdf.com/reader/full/w5-questionnaire-design 4/42
4
Inter-relationship among items
Measures of the same construct should showstrong association (“hang together”)
let items 1, 7, and 11 measure Construct A anditems 4, 6, and 9 Construct B
Construct A Construct B
1 7 11 4 6 9
1 perfect strong strong weak weak weak
7 strong perfect strong weak weak weak11 strong strong perfect weak weak weak
4 weak weak weak perfect strong strong
6 weak weak weak strong perfect strong
9 weak weak weak strong strong perfect

8/11/2019 W5 Questionnaire Design
http://slidepdf.com/reader/full/w5-questionnaire-design 5/42
5
Open or closed-ended?
Open-ended questions allow respondentsmore freedom to express their thoughts time-consuming to respond to
difficult to analyze if open-ended responses are to be “coded” into a
set of categories establish inter-rater reliability (Cohen‟s Kappa)
aren‟t we better off with closed-ended questions?
Closed-ended questions must anticipatethe common responses
“other” category should be used infrequently

8/11/2019 W5 Questionnaire Design
http://slidepdf.com/reader/full/w5-questionnaire-design 6/42
6
Scaling of responses
To measure the strength of attitudestowards an issue, responses are located on acontinuum anchored by opposites, e.g.
“The NTU MBA program is …”
easy to establish ordinal nature of data
are these interval data?
|-----------------------|-----------------------|-----------------------|-----------------------|
awful not good so-so pretty good awesome

8/11/2019 W5 Questionnaire Design
http://slidepdf.com/reader/full/w5-questionnaire-design 7/42
7
Response Biases
Not enough variation among responses
use scale with more points (7-point, 9-point, …)
Too many “middle” responses
use scale with even number of points
Leniency bias (responses on “generous”side)
use asymmetrical anchors e.g.
“The candidate‟s potential for graduate studies is” |-----------------------|-----------------------|-----------------------|-----------------------|
quite good very extremely best
good good good I ’ ve seen
8/11/2019 W5 Questionnaire Design
http://slidepdf.com/reader/full/w5-questionnaire-design 8/42
8
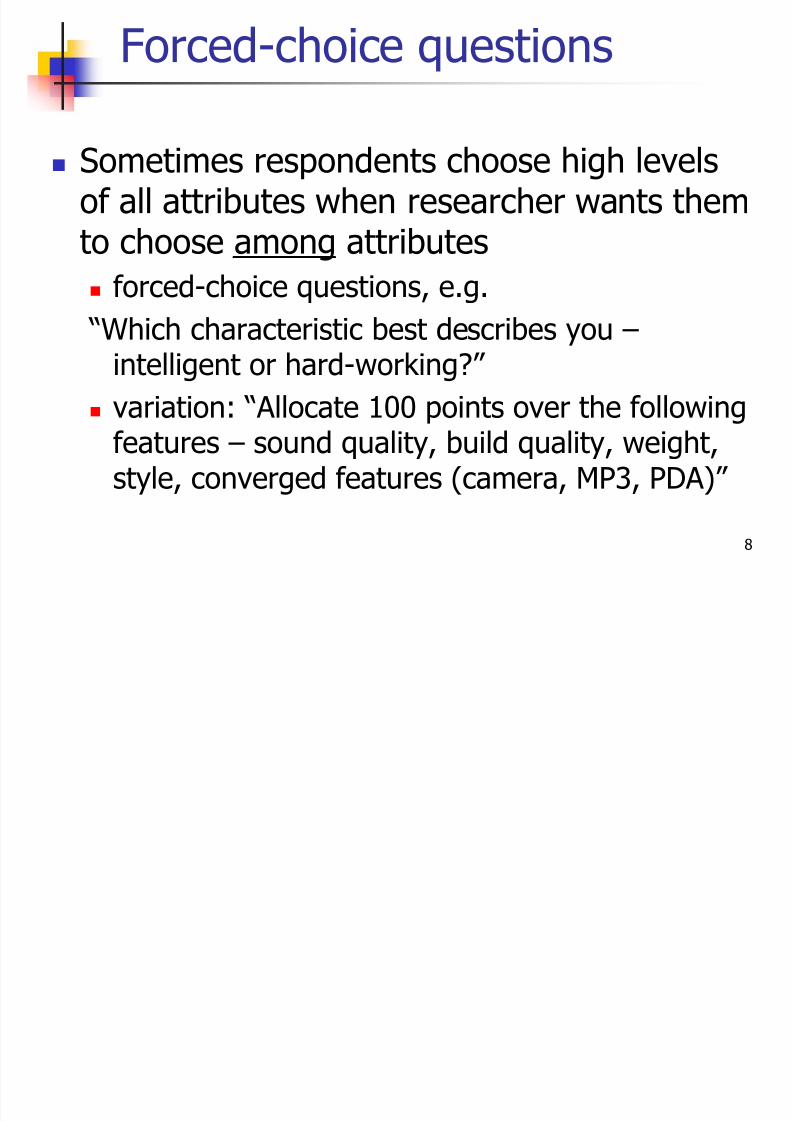
Forced-choice questions
Sometimes respondents choose high levelsof all attributes when researcher wants themto choose among attributes
forced-choice questions, e.g.
“Which characteristic best describes you – intelligent or hard-working?”
variation: “Allocate 100 points over the followingfeatures – sound quality, build quality, weight,style, converged features (camera, MP3, PDA)”
8/11/2019 W5 Questionnaire Design
http://slidepdf.com/reader/full/w5-questionnaire-design 9/42
9
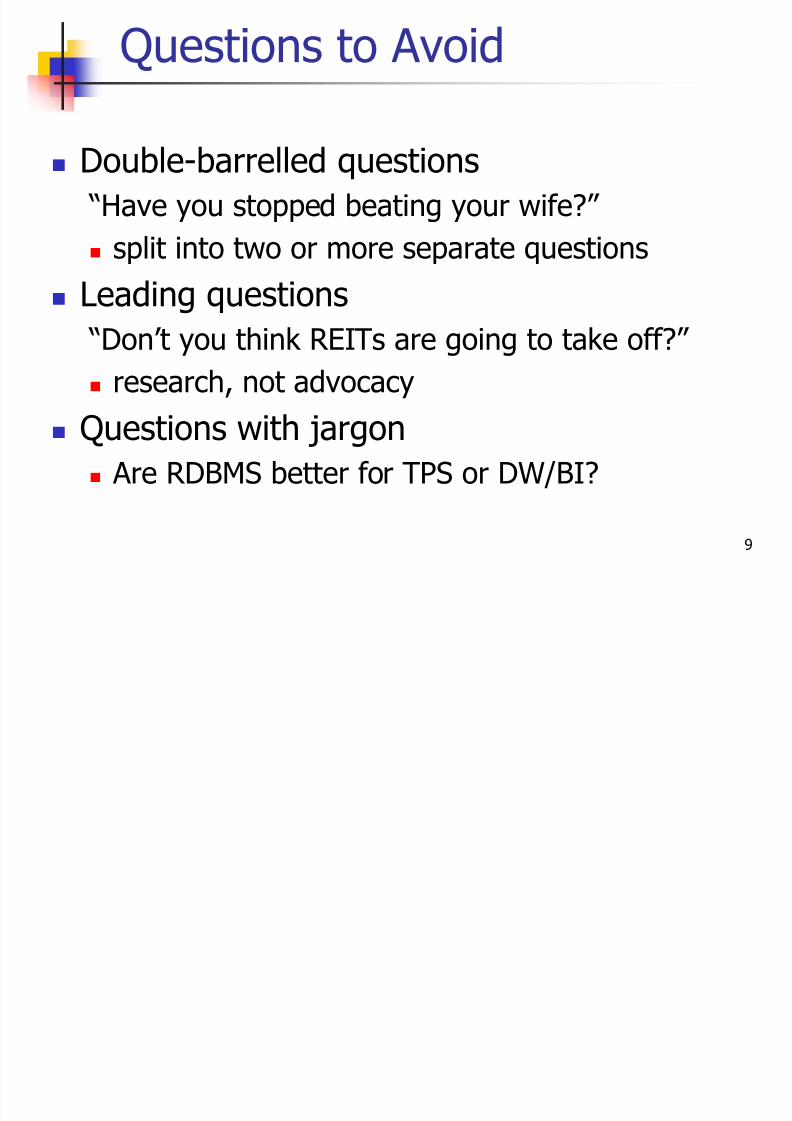
Questions to Avoid
Double-barrelled questions
“Have you stopped beating your wife?”
split into two or more separate questions
Leading questions
“Don‟t you think REITs are going to take off?”
research, not advocacy
Questions with jargon
Are RDBMS better for TPS or DW/BI?

8/11/2019 W5 Questionnaire Design
http://slidepdf.com/reader/full/w5-questionnaire-design 10/42
10
Pilot Testing
The best-laid plans can go haywire !
Objective of pilot testing is to see if
respondents consistently interpret questionsin the same way as intended
pilot test respondents might be invited tocomment on instrument and procedure
presence of researcher during surveyadministration helps spot problems quicker
pilot testing “uses up” respondents

8/11/2019 W5 Questionnaire Design
http://slidepdf.com/reader/full/w5-questionnaire-design 11/42
11
Using Existing Instruments
Many researchers place their questionnairesin the public domain
such questionnaires (or parts thereof) can beused (with proper credits) if our study examinesthe same or similar constructs
re-use of existing instruments ensures
validity and reliability of measures comparability of results across studies
Try to find existing measures
8/11/2019 W5 Questionnaire Design
http://slidepdf.com/reader/full/w5-questionnaire-design 12/42
12
Interviews
Interviews provide
better rapport
clarification of complex items greater flexibility in wording and sequence
However, interviews
are costly in terms of time and effort do not offer the anonymity of mail surveys
If you do interviews,
develop a script and stick to it

8/11/2019 W5 Questionnaire Design
http://slidepdf.com/reader/full/w5-questionnaire-design 13/42
13
Methods of scaling
Response scales
rating scales: estimates magnitude of a
characteristic
ranking scale: rank order preference
sorting scales: arrange or classify concepts
choice scales: selection of preferred
alternative

8/11/2019 W5 Questionnaire Design
http://slidepdf.com/reader/full/w5-questionnaire-design 14/42
14
Rating scale
Rating tasks ask therespondent to estimatethe magnitude of acharacteristic, or quality,that an object possesses.The respondent‟s positionon a scale(s) is where he
or she would rate anobject.

8/11/2019 W5 Questionnaire Design
http://slidepdf.com/reader/full/w5-questionnaire-design 15/42
15
Ranking scale
Ranking tasksrequire that the
respondent rankorder a smallnumber of objects inoverall performance
on the basis ofsome characteristicor stimulus.

8/11/2019 W5 Questionnaire Design
http://slidepdf.com/reader/full/w5-questionnaire-design 16/42
16
Other scales
Sorting might present the respondent withseveral concepts typed on cards and require that
the respondent arrange the cards into a numberof piles or otherwise classify the concepts.
Choice between two or more alternatives isanother type of measurement - it is assumed thatthe chosen object is preferred over the other.

8/11/2019 W5 Questionnaire Design
http://slidepdf.com/reader/full/w5-questionnaire-design 17/42
17
Rating scales
category scale
Likert scale
semantic differential numerical scale
staple scale
itemised rating scale constant sum rating scale
graphic rating scale

8/11/2019 W5 Questionnaire Design
http://slidepdf.com/reader/full/w5-questionnaire-design 18/42
18
Category Scale
a category scale is a more sensitive measurethan a scale having only two response categories
- it provides more information. Nominal or ordinal (example is ordinal)
if interval between each category is regarded as equal – interval
dichotomous scale - 2 response categories (yesor no; agree or disagree) nominal

8/11/2019 W5 Questionnaire Design
http://slidepdf.com/reader/full/w5-questionnaire-design 19/42
19
EXAMPLE OF CATEGORY SCALE
How important were the following in your decision to visitSydney (tick one response for each item)
VERY SOMEWHAT NOT TOO
IMPORTANT IMPORTANT IMPORTANT
CLIMATE ___________ ___________ ___________
COST OF TRAVEL ___________ ___________ ___________
FAMILY ORIENTED ___________ ___________ ___________EDUCATIONAL
/HISTORICAL ASPECTS _________ ___________ ___________
FAMILIARITY WITH
AREA ___________ ___________ ___________

8/11/2019 W5 Questionnaire Design
http://slidepdf.com/reader/full/w5-questionnaire-design 20/42
20
LIKERT SCALE FOR MEASURING ATTITUDESTOWARD TENNIS
It is more fun to play a tough, competitivetennis match than to play an easy one.
___Strongly Agree
___Agree
___Neither agree nor disagree
___Disagree
___Strongly Disagree

8/11/2019 W5 Questionnaire Design
http://slidepdf.com/reader/full/w5-questionnaire-design 21/42
21
Semantic Differential
Bipolar adjectives to anchor each end of scale(seven point scale) eg good :__:__:__:__:__:__:__: bad
sweet :__:__:__:__:__:__:__: sour hot :__:__:__:__:__:__:__: cold
Rotation required to avoid halo effect ???
Image profile - graphic representation for competingbrands, services to highlight comparison (based on
mean or median)

8/11/2019 W5 Questionnaire Design
http://slidepdf.com/reader/full/w5-questionnaire-design 22/42
22
Numerical Scale
Numerical scales have numbers as response options,rather than “semantic space‟ or verbal descriptions, toidentify categories (response positions).
Similar to semantic differential – bipolar adjectives on a 5- point or 7 - point scale
How satisfied are you with your new computer?
Extremely satisfied 7 6 5 4 3 2 1 Extremely dissatisfied

8/11/2019 W5 Questionnaire Design
http://slidepdf.com/reader/full/w5-questionnaire-design 23/42
23
Stapel Scales
measures both direction & intensity of an attitudetowards an object
up to a 10 point scale +5 to -5
presented vertically
considered interval

8/11/2019 W5 Questionnaire Design
http://slidepdf.com/reader/full/w5-questionnaire-design 24/42
24
A Stapel Scale for Measuring a Store‟s Image
Department
Store Name
+3+2
+1
Wide Selection
-1-2
-3
Select a positive or negative number that you think
describe the store accurately for each descriptive word.

8/11/2019 W5 Questionnaire Design
http://slidepdf.com/reader/full/w5-questionnaire-design 25/42
25
Itemised rating scale
Similar to category scale
5 or more point scale
Each point is numbered and labelled 1 = Very unlikely; 2 = Unlikely; 3 = neither unlikely nor
likely; 4 = Likely; 5 = Very likely
A number of statements are rated usingscale
Interval scale

8/11/2019 W5 Questionnaire Design
http://slidepdf.com/reader/full/w5-questionnaire-design 26/42
26
Constant sum rating scale
Respondent is asked to distribute a givennumber of points across various items
(attributes) of a product to indicate theimportance to each attribute.
Example : distribute 100 point among the
following attributes to indicate theimportance of each for the product - soap.
fragrance; size; shape; texture; colour
8/11/2019 W5 Questionnaire Design
http://slidepdf.com/reader/full/w5-questionnaire-design 27/42
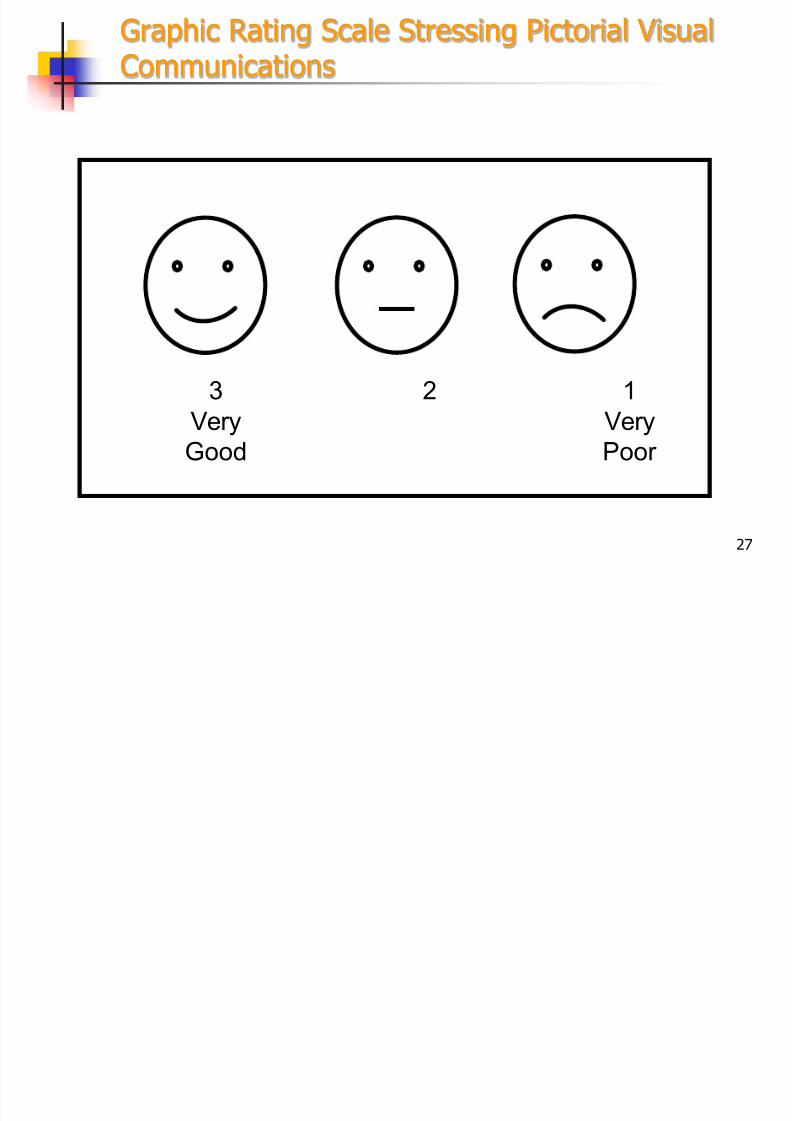
27
Graphic Rating Scale Stressing Pictorial VisualCommunications
3 2 1Very Very
Good Poor

8/11/2019 W5 Questionnaire Design
http://slidepdf.com/reader/full/w5-questionnaire-design 28/42
28
Ranking Scales
Paired comparison – helps to identifypreferences
Forced choice – rank a set of objects (eg.destinations) from preferred to leastpreferred
Comparative scale - use a benchmark tocompare another product with.
Ranking scales provide ordinal data
8/11/2019 W5 Questionnaire Design
http://slidepdf.com/reader/full/w5-questionnaire-design 29/42
29
Other response sets
Scenarios – then provide a set of possibleresponses to select from
Open-ended questions

8/11/2019 W5 Questionnaire Design
http://slidepdf.com/reader/full/w5-questionnaire-design 30/42
30
Scale decisions
type of response scale
number of scale categories
balanced versus unbalanced even/odd number of categories
forced versus non-forced scales
nature & degree of verbal description physical form of the scale

8/11/2019 W5 Questionnaire Design
http://slidepdf.com/reader/full/w5-questionnaire-design 31/42
31
Type of response scale
depends on research problem and objectives
depends on the statistical analysistechniques that may be used for bothdescriptive and inferential statistics

8/11/2019 W5 Questionnaire Design
http://slidepdf.com/reader/full/w5-questionnaire-design 32/42
32
Number of categories
greater the option, greater the sensitivity
most respondent can only handle 5 to 9
options increase as object knowledge increases.
nature of object
mode of data collection
analysis of the data - correlation coefficient
decreases with the reduction of categories

8/11/2019 W5 Questionnaire Design
http://slidepdf.com/reader/full/w5-questionnaire-design 33/42
33
Balanced versus unbalanced
balanced – equal no. of favourable & unfavourablecategories
to obtain objective data need balanced scale
if you know the response will be skewed use anunbalance scale in-line with the skewness
unbalanced scale has data analysis implications

8/11/2019 W5 Questionnaire Design
http://slidepdf.com/reader/full/w5-questionnaire-design 34/42

8/11/2019 W5 Questionnaire Design
http://slidepdf.com/reader/full/w5-questionnaire-design 35/42
35
Forced versus non-forced scales
forced scale - the respondent is forced to give ananswer
forced scale omits „no opinion‟ or „no knowledge‟
option forced scale can distort the response & thus the
measures of central tendency & variance
offering a „no opinion‟ can allow respondents to belazy and not respond

8/11/2019 W5 Questionnaire Design
http://slidepdf.com/reader/full/w5-questionnaire-design 36/42
36
Nature & degree of verbal description
degree of verbal description associated with thescale can influence the response
categorising helps the respondent understand the
scale recommend that all or most scale points need
categorising/ description
strength of adjectives to anchor scale: generallyagree vs strongly agree

8/11/2019 W5 Questionnaire Design
http://slidepdf.com/reader/full/w5-questionnaire-design 37/42
37
Physical form of the scale
presentation of scale can be in many formats
in selecting a scale format - consider theaudience and the format likely to receive thehighest response rate
8/11/2019 W5 Questionnaire Design
http://slidepdf.com/reader/full/w5-questionnaire-design 38/42
38
Selecting an appropriate scale
no one is best - decision is situational
want maximum information
nature of item being measured ease of use of technique by respondent
analysis required
method of communication

8/11/2019 W5 Questionnaire Design
http://slidepdf.com/reader/full/w5-questionnaire-design 39/42
39
Criteria for goodness of measure
3 major criteria for evaluating good measurementare
reliability
validity sensitivity
Other factors to consider are
relevant
versatile
ease of response

8/11/2019 W5 Questionnaire Design
http://slidepdf.com/reader/full/w5-questionnaire-design 40/42
40
Reliability
refers to the extent to which a scale (number ofitems) produces consistent results if repeatedmeasurements are made
degree to which the scale is free from randomerror and yields consistent results
Is the scale a stable measure of the concept?and how well do the items in a scale hold
together? main methods – test-retest; inter-item
consistency reliability reliability is a necessary but insufficient condition
of the test of goodness of a measure
l d

8/11/2019 W5 Questionnaire Design
http://slidepdf.com/reader/full/w5-questionnaire-design 41/42
41
Validity
ability of a scale to measure the intendedconcept and not some other concept
content validity – measure includes anadequate & representative set of items that tapthe concept
literature
qualitative research
judgement of a panel of experts
Note: other forms of validity

8/11/2019 W5 Questionnaire Design
http://slidepdf.com/reader/full/w5-questionnaire-design 42/42
Reliability and validity on target
Old Rifle New Rifle New Rifle Sunglare
Neither reliability nor High reliability Reliable but not validvalid (Target A) & validity(Target B) (Target C)


