59
UNIVERSITY OF RAJSHAHI Rajshahi-6205, Bangladesh CURRICULUM for M. Sc. in Statistics Session: 2019 - 2020 Examination Year: M. Sc. Final, 2020 Department of Statistics www.ru.ac.bd/stat/

W=8.5 inW=8.5 in
H=
11
in
Put : 3.5 mm (58 Page)
UNIVERSITY OF RAJSHAHIRajshahi-6205, Bangladesh
CURRICULUMfor
M. Sc. in StatisticsSession: 2019 - 2020
Examination Year:M. Sc. Final, 2020
Department of Statisticswww.ru.ac.bd/stat/

Dept. of Statistics, RU M. Sc. Curriculum, 2019-2020
UNIVERSITY OF RAJSHAHI Faculty of Science
Department of Statistics
1. Department of Statistics: At a glance The Department of Statistics is one of the oldest Departments in the University of Rajshahi, which is the second largest public university of Bangladesh. Since its inception in 1961, the department has evolved steadily. The department offers good teaching and research facilities. At present there are 26 full-time teachers and 21 office staffs. The present enrolments of the students are about 100 and 400 at the graduate and undergraduate programs respectively. The department has its own seminar library with a large number of Textbooks, Journals, and Scientific Literature. A Computer Unit was established in the department in 1990. It is equipped with more than 180 modern personal computers of various models. Both the teachers and students of this department have been using these computers. Occasionally teachers of other departments of the University of Rajshahi are also allowed computer facilities for their research works. Presently the department is offering four courses on computer at the undergraduate and graduate levels. It also offers a certificate course on computer for researchers, professionals and students. Apart from offering B.Sc. Honours and M.Sc. degrees in Statistics, the department also conducts research for higher studies leading to M. Phil. and Ph. D. degrees. The research works have been concentrated mainly in the areas of Anthropometric Statistics, Bayesian Inference, Biostatistics, Bioinformatics, Biochemical Engineering and Statistical Signal Processing, Bootstrap Techniques, Computer Programming & Simulation, Demography, Earthquake Prediction Modeling, Econometrics, Environmental Statistics, Geo-Statistics, Human Growth, Human Morphology, Industrial Statistics, Linear programming, Order Statistics, Probability, Regression Diagnostics, Reliability Theory, Robust Statistics, Sample re-use Techniques, Social & Educational Statistics, Statistical Data Mining, Statistical Inference, Stochastic Modeling etc. The department organizes Seminar/Conferences regularly. In the last two decades five international conferences were organized. Occasionally distinguished foreign scholars visit the department and give seminar talks. The department publishes an annual journal named International Journal of Statistical Sciences (IJSS). This is a referred journal and abstracted in the Statistical Theory and Method abstract published by the International Statistical Institute, Netherlands and BANSDOC, Dhaka. For over last 20 years this department has a collaboration program with Indian Statistical Institute, Kolkata. In recent years, the department has launched link programs with Kyoto Gakuen University, Japan and The University of Electro-Communications, Tokyo, Japan. The department has an association of its own, named “Parishankan Samity”. The aims of this “Samity” are to uphold the academic interests of the department, to organize indoor games, reception party for the new students, farewell party for the outgoing students and bring out a magazine annually. Recently, the alumni of this department have formed Rajshahi University Statistics Alumni (RUSA) in Dhaka to incorporate all ex-statistics students of Rajshahi University from home and abroad to promote academic, research and all other activities of Department of Statistics.
Page | 1

Dept. of Statistics, RU M. Sc. Curriculum, 2019-2020
2. Name and Research Interest of the Academic Staff
SL Name Specialization/Field of Interest
Professor
1. Dr. S. K. Bhattacharjee (PRL) Bayesian Inference
2. Dr. Md. Asaduzzaman Shah Stochastic Modeling, Probability
3. Dr. Md. Nurul Islam Demography, Survey Sampling, Applied Statistics, Anthropometric Study, Health Statistics
4. Dr. M. Sayedur Rahman Environmental Studies, Statistical Data Mining, Bootstrap, Simulation Modeling
5. Dr. Anjuman Ara Begum Demography, Statistical Inference, Order Statistics, Computer Programming
6. Dr. Md. Ripter Hossain Demography, Sample Survey, Econometrics, Industrial Management and Health Statistics
7. Dr. Md. Ayub Ali Time Series Analysis and Forecasting, Multivariate Analysis, Anthropometric Study, Physical Health and Human Growth, Statistical Modeling, Econometrics, Environmental Statistics, Descriptive Statistics and Applied Statistics
8. Dr. Md. Golam Hossain Health Statistics and Physical Anthropology
9. Dr. Md. Rezaul Karim Warranty claim analysis, Product reliability analysis, Lifetime data analysis, Biostatistics, Statistical inference, Business statistics, Engineering statistics, Simulation and modeling, Statistical computing, Big data analytics
10. Dr. Md. Monsur Rahman Reliability, Bio-Statistics, Statistical Inference
11. Dr. Dulal Chandra Roy Sample Survey, Estimation, Operation Research, Quality Control, Applied Statistics
12. Dr. Md. Nurul Haque Mollah Robust Statistical Inference, Multivariate Statistics, Optimization, Data Mining, Statistical Signal Processing, Biostatistics, Statistical Genomics and Bioinformatics
13. Dr. Saroje Kumar Sarkar Multivariate Analysis, Reliability
14. Dr. Md. Aminul Hoque Demography, Bio-informatics, Forecasting, Biochemical Engineering
15. Dr. Md. Mahmudul Alam Distribution Fitting, Geo-Statistics, Environmental Statistics, Earthquake Prediction Modeling, Computer Programming & Simulation, Data Mining
16. Dr. Provash Kumar Karmokar Econometrics, Time Series Analysis and Forecasting, Statistical Modeling of Climatic Variables, Computational Statistics, Simulation and Modeling, Agriculture Statistics
17. Dr. Md. Jahanur Rahman Econometrics, Applied Macroeconomics, Financial Statistics and Climate Change
18. Dr. Papia Sultana Semiparametric and Nonparametric Modelling, Medical Diagnostics, Epidemiology
19. Dr. Md. Mesbahul Alam Reliability Data Analysis, Warranty, Bio-statistics, Optimization, Mathematical Statistics, Robust Statistics, Regression Diagnostics, Computer Programming and Data Mining
Page | 2
Dept. of Statistics, RU M. Sc. Curriculum, 2019-2020
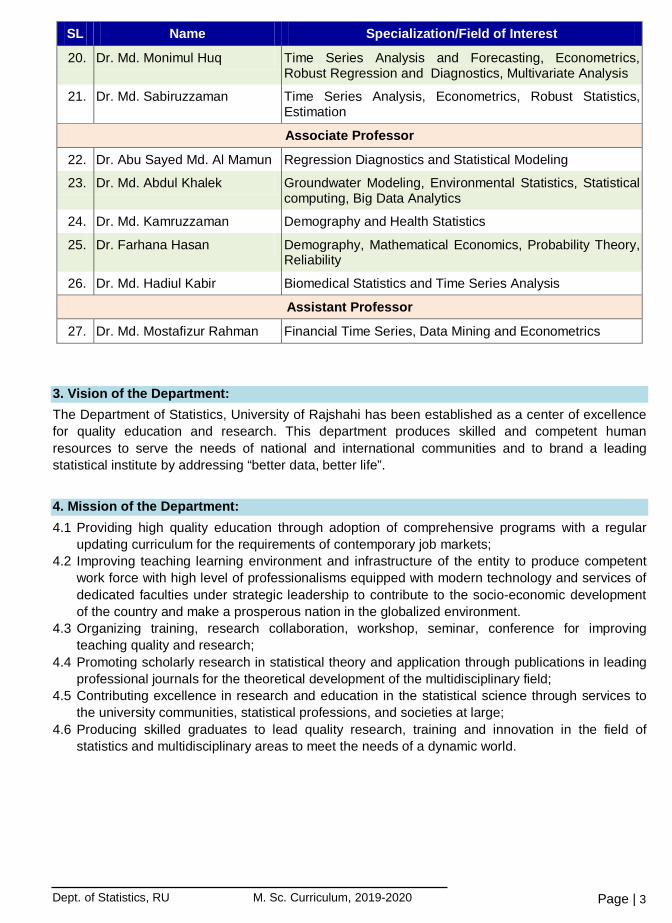
SL Name Specialization/Field of Interest
20. Dr. Md. Monimul Huq Time Series Analysis and Forecasting, Econometrics, Robust Regression and Diagnostics, Multivariate Analysis
21. Dr. Md. Sabiruzzaman Time Series Analysis, Econometrics, Robust Statistics, Estimation
Associate Professor
22. Dr. Abu Sayed Md. Al Mamun Regression Diagnostics and Statistical Modeling
23. Dr. Md. Abdul Khalek Groundwater Modeling, Environmental Statistics, Statistical computing, Big Data Analytics
24. Dr. Md. Kamruzzaman Demography and Health Statistics
25. Dr. Farhana Hasan Demography, Mathematical Economics, Probability Theory, Reliability
26. Dr. Md. Hadiul Kabir Biomedical Statistics and Time Series Analysis
Assistant Professor
27. Dr. Md. Mostafizur Rahman Financial Time Series, Data Mining and Econometrics
3. Vision of the Department: The Department of Statistics, University of Rajshahi has been established as a center of excellence for quality education and research. This department produces skilled and competent human resources to serve the needs of national and international communities and to brand a leading statistical institute by addressing “better data, better life”. 4. Mission of the Department: 4.1 Providing high quality education through adoption of comprehensive programs with a regular
updating curriculum for the requirements of contemporary job markets; 4.2 Improving teaching learning environment and infrastructure of the entity to produce competent
work force with high level of professionalisms equipped with modern technology and services of dedicated faculties under strategic leadership to contribute to the socio-economic development of the country and make a prosperous nation in the globalized environment.
4.3 Organizing training, research collaboration, workshop, seminar, conference for improving teaching quality and research;
4.4 Promoting scholarly research in statistical theory and application through publications in leading professional journals for the theoretical development of the multidisciplinary field;
4.5 Contributing excellence in research and education in the statistical science through services to the university communities, statistical professions, and societies at large;
4.6 Producing skilled graduates to lead quality research, training and innovation in the field of statistics and multidisciplinary areas to meet the needs of a dynamic world.
Page | 3
Dept. of Statistics, RU M. Sc. Curriculum, 2019-2020
5. Objectives of this Department: 5.1 Provide professional graduates in the field of statistics and the multidisciplinary areas according
to the requirements of contemporary job markets. 5.2 Publish in leading professional journals to contribute the theoretical development and application
of statistics addressing substantive problems through scholarly research; 5.3 Disseminate statistical knowledge to ensure effective applications of statistics in real life
practices. 5.4 Deliver adequate, relevant and timely statistics to facilitate research, planning and decision
making process for the government and the community for achieving Sustainable Development Goals (SDGs) of Bangladesh.
Page | 4

Dept. of Statistics, RU M. Sc. Curriculum, 2019-2020
Detailed Curriculum
M.Sc. in Statistics Session: 2019-2020 Examination: 2020
Ordinance The M.Sc. (Master of Science) Final Course in Statistics shall spread over One Academic year. The Course is divided into Two Groups - The General Group and the Thesis Group. The Examinees shall take Examination either in the General Group or in the Thesis Group. The Thesis shall be offered subject to the approval of the Departmental Academic Committee. The examination (General or Thesis Group) shall be of 900 Marks (9 Course Units: 36 Credits). M.Sc. Degree: A candidate should be awarded M.Sc. degree in Statistics, if he obtains 32 credit points out of 36. Course Improvement: A candidate obtaining a GPA of less than 3.00 shall be allowed to improve the result by reappearing in the exam up to 12 credits with F grade within consecutive next three years. Also, a promoted student earning of a GPA less than 3.00 individual course(s) shall be allowed to improve the grade(s). General Group: The Examination shall consist of Eight Theory Courses of 600 marks (6 Units: 24 Credits), Eight Practical Sessions of 150 Marks (1.5 units, 6 Credits; Spread over Eight days, 30% of the total Practical marks shall be allotted for continuous laboratory assessment), Viva-voce Examination of 100 marks (1.0 unit, 4 Credits), research project 50 marks (0.5 unit, 2 credit). Each course contains 60 of the theory marks, 15 in-course marks (Tutorial/Terminal 11.25, and Attendance 3.75). Thesis Group: The Examination shall consist of Eight Theory Courses of 600 Marks (6 units: 24 Credits) and Viva Voce Examination of 100 Marks (1.0 unit: 4 Credits), a Thesis/ Dissertation carrying 100 marks (1.0 units: 4 Credits) and Thesis Defense (Seminar and Viva voce on Thesis) of 50 marks (0.5 unit: 2 Credits) and in-plant training of 50 marks (0.5 unit: 2 Credits). The breakdown of marks, units and credits are as follows:
General Group
Category Theory Viva Practical Total
Course / Session 8 Courses - 8 Sessions -
Total Marks 600 100 200 900
Units 6.0 1.0 2.0 9
Credits 24 4 8 36
Thesis Group
Theory Viva Thesis Thesis Defense
In plant Training
Total
Courses / Sessions 8 Courses - - - - -
Total Marks 600 100 100 50 50 900
Units 6.0 1.0 1.0 0.5 0.5 9
Credits 24 4 4 2 2 36
Page | 5
Dept. of Statistics, RU M. Sc. Curriculum, 2019-2020
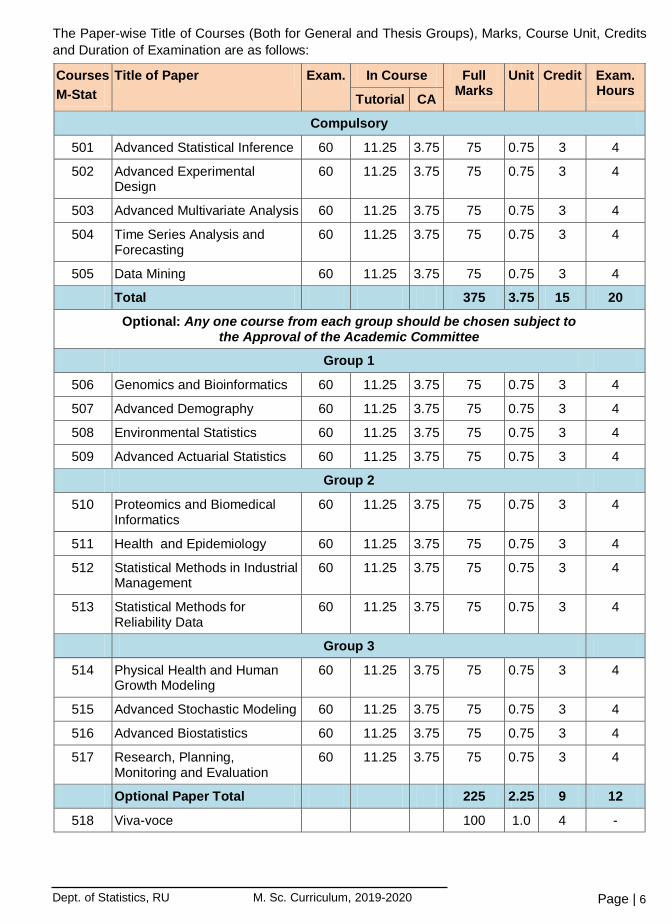
The Paper-wise Title of Courses (Both for General and Thesis Groups), Marks, Course Unit, Credits and Duration of Examination are as follows:
Courses M-Stat
Title of Paper Exam. In Course Full Marks
Unit Credit Exam. Hours Tutorial CA
Compulsory
501 Advanced Statistical Inference 60 11.25 3.75 75 0.75 3 4
502 Advanced Experimental Design
60 11.25 3.75 75 0.75 3 4
503 Advanced Multivariate Analysis 60 11.25 3.75 75 0.75 3 4
504 Time Series Analysis and Forecasting
60 11.25 3.75 75 0.75 3 4
505 Data Mining 60 11.25 3.75 75 0.75 3 4
Total 375 3.75 15 20
Optional: Any one course from each group should be chosen subject to the Approval of the Academic Committee
Group 1
506 Genomics and Bioinformatics 60 11.25 3.75 75 0.75 3 4
507 Advanced Demography 60 11.25 3.75 75 0.75 3 4
508 Environmental Statistics 60 11.25 3.75 75 0.75 3 4
509 Advanced Actuarial Statistics 60 11.25 3.75 75 0.75 3 4
Group 2
510 Proteomics and Biomedical Informatics
60 11.25 3.75 75 0.75 3 4
511 Health and Epidemiology 60 11.25 3.75 75 0.75 3 4
512 Statistical Methods in Industrial Management
60 11.25 3.75 75 0.75 3 4
513 Statistical Methods for Reliability Data
60 11.25 3.75 75 0.75 3 4
Group 3
514 Physical Health and Human Growth Modeling
60 11.25 3.75 75 0.75 3 4
515 Advanced Stochastic Modeling 60 11.25 3.75 75 0.75 3 4
516 Advanced Biostatistics 60 11.25 3.75 75 0.75 3 4
517 Research, Planning, Monitoring and Evaluation
60 11.25 3.75 75 0.75 3 4
Optional Paper Total 225 2.25 9 12
518 Viva-voce 100 1.0 4 -
Page | 6
Dept. of Statistics, RU M. Sc. Curriculum, 2019-2020
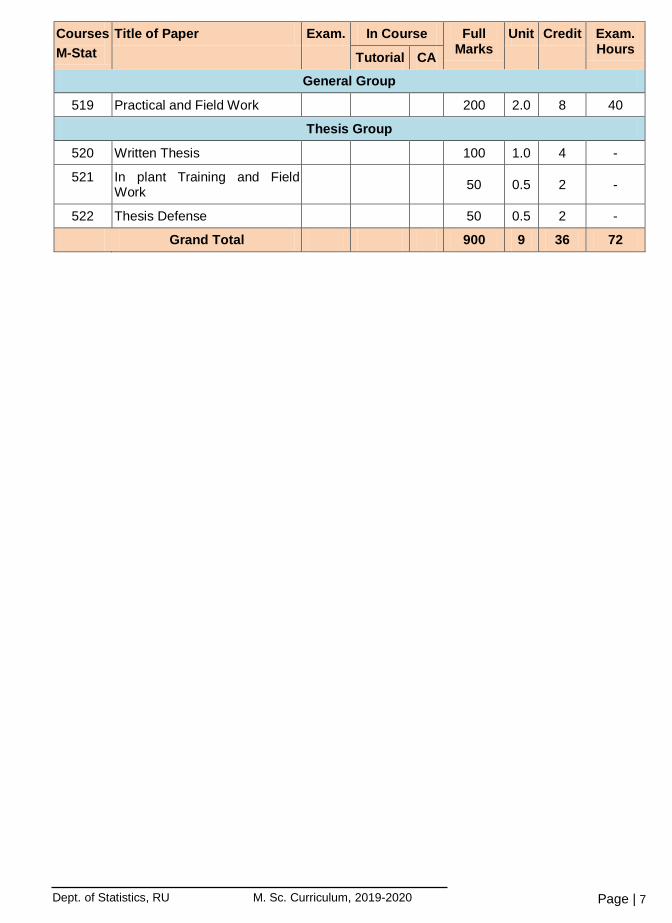
Courses M-Stat
Title of Paper Exam. In Course Full Marks
Unit Credit Exam. Hours Tutorial CA
General Group
519 Practical and Field Work 200 2.0 8 40
Thesis Group
520 Written Thesis 100 1.0 4 -
521 In plant Training and Field Work
50 0.5 2 -
522 Thesis Defense 50 0.5 2 -
Grand Total 900 9 36 72
Page | 7

Dept. of Statistics, RU M. Sc. Curriculum, 2019-2020
M. Stat- 501: Advanced Statistical Inference
Course Code : M.Stat- 501 Course Title : Advanced Statistical Inference Course Type : Compulsory Level/Term and Section : M.Sc. Final Academic Session : 2019-2020 Course Instructor : Pre-requisite (If any) : B.Stat-302, B.Stat-303 Credit Value : 3 Total Marks : 75 (Examination 60, Tutorial/Terminal 11.25, and Attendance 3.75)
COURSE DESCRIPTION: This course provides the students with theoretical foundations in statistics and the theory of statistical inference. It consists of five parts. 1. Statistics, sufficiency and completeness; Unbiased Estimation: Uniform minimum variance unbiased estimators (UMVUE) in advance setup; 2. Estimation in Parametric Models: Bayes estimators, maximum likelihood estimators and the properties of estimators such as invariance, minimaxity, admissibility and asymptotic efficiency, EM algorithm; 3. U-statistic, V-statistic, L-M-R statistic, statistical functional, bootstrap method. Asymptotic properties. 4. statistical decision theory for composite hypothesis; Local powerful test, Similar Region test, SPRT for three hypothesis and composite hypothesis; 5. Non-parametric test procedures.
COURSE OBJECTIVES (CO): 1. This course is designed to aid the interpretation of data that are subject to appreciable
haphazard variability and to give a comprehensive statistical basis for the analysis of such data, excluding considerations specific to particular subject matter.
2. This course will give students a view of the nature of advanced statistical methods and to nurture advanced statistical thinking.
COURSE LEARNING OUTCOMES (CLO): After completing this course students will be able to
1. know how attain the complex inferential targets using general statistical inference, 2. handle any challenging statistical inference.
COURSE PLAN/SCHEDULE:
CLO Course Content Teaching-learning strategy
Assessment strategy
Number of Lectures
1 Sufficiency and unbiasedness: Different types of statistical models, parametric, semi-parametric and non-parametric models, Group and exponential family of distribution, Sufficiency, minimal sufficient, completeness and their relations-applications, Lehman-Scheffe Theorem, UMVU estimates, LMVU estimates, Necessary and sufficient condition of UMVUE.
Class lecture, class test, assignment, Q/A session
Final exam, class test and class attendance
10
Page | 8
Dept. of Statistics, RU M. Sc. Curriculum, 2019-2020
CLO Course Content Teaching-learning strategy
Assessment strategy
Number of Lectures
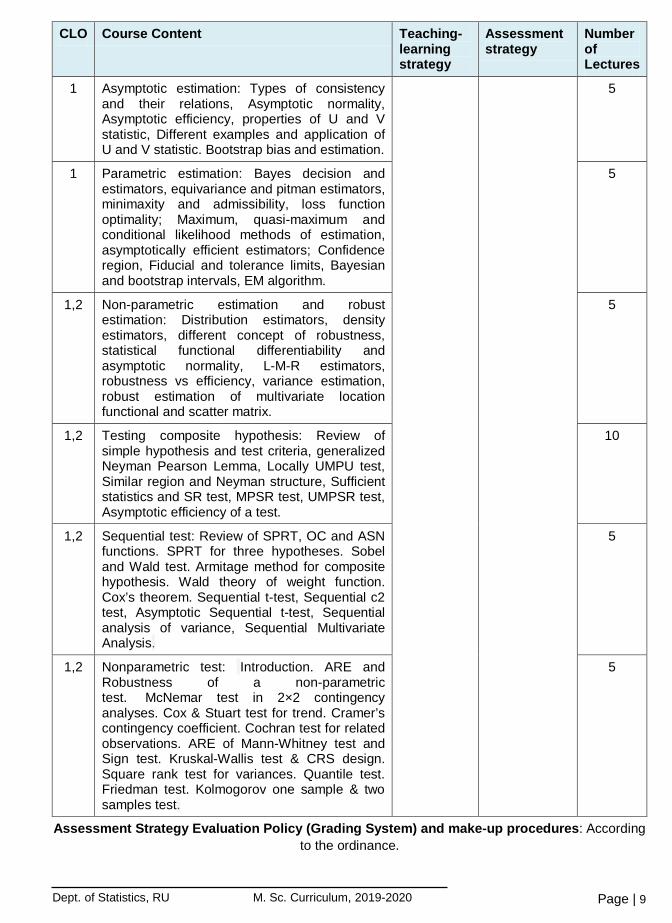
1 Asymptotic estimation: Types of consistency and their relations, Asymptotic normality, Asymptotic efficiency, properties of U and V statistic, Different examples and application of U and V statistic. Bootstrap bias and estimation.
5
1 Parametric estimation: Bayes decision and estimators, equivariance and pitman estimators, minimaxity and admissibility, loss function optimality; Maximum, quasi-maximum and conditional likelihood methods of estimation, asymptotically efficient estimators; Confidence region, Fiducial and tolerance limits, Bayesian and bootstrap intervals, EM algorithm.
5
1,2 Non-parametric estimation and robust estimation: Distribution estimators, density estimators, different concept of robustness, statistical functional differentiability and asymptotic normality, L-M-R estimators, robustness vs efficiency, variance estimation, robust estimation of multivariate location functional and scatter matrix.
5
1,2 Testing composite hypothesis: Review of simple hypothesis and test criteria, generalized Neyman Pearson Lemma, Locally UMPU test, Similar region and Neyman structure, Sufficient statistics and SR test, MPSR test, UMPSR test, Asymptotic efficiency of a test.
10
1,2 Sequential test: Review of SPRT, OC and ASN functions. SPRT for three hypotheses. Sobel and Wald test. Armitage method for composite hypothesis. Wald theory of weight function. Cox’s theorem. Sequential t-test, Sequential c2 test, Asymptotic Sequential t-test, Sequential analysis of variance, Sequential Multivariate Analysis.
5
1,2 Nonparametric test: Introduction. ARE and Robustness of a non-parametric test. McNemar test in 2×2 contingency analyses. Cox & Stuart test for trend. Cramer’s contingency coefficient. Cochran test for related observations. ARE of Mann-Whitney test and Sign test. Kruskal-Wallis test & CRS design. Square rank test for variances. Quantile test. Friedman test. Kolmogorov one sample & two samples test.
5
Assessment Strategy Evaluation Policy (Grading System) and make-up procedures: According to the ordinance.
Page | 9
Dept. of Statistics, RU M. Sc. Curriculum, 2019-2020
Main Books: 1. Bickel PJ and Doksum KA (2001). Mathematical Statistics: Basic Ideas and Selected Topics.
Prentice-Hall, Inc. 2. Cox and Hinkley (1996). Theoretical statistics, Chapman & Hall. 3. Govindarajulu Z (2004). Sequential Analysis, World Scientific Publishing Ltd. 4. Shao J (1999). Mathematical statistics. Springer.
References:
1. Efron, B. & Tibshirani, R.J. (1993): An Introduction to Bootstrap. 2. Ashraf Ali, M. (1974): Theory of Statistics, Nilkhet, Dhaka. 3. Barnet, V. (1982): Comparative Statistical Inference, 2nd Ed., Wiley, N.Y 4. Efron, B. (1984): The Jackknife, the Bootstrap and Other Re-sampling Plans. 5. George Casella and Roger L. Berger (2002): Statistical Inference, 2nd Ed., Thomson
Learning Asia and China Machine Press. 6. Gibbons, J.D., and Chakraborti, S. (1992): Non-Parametric Statistical Inference, Marcell-
Dekkar, N.Y. 7. Kalbfleisch, J.: Probability & Statistical Inference Vol.2, Springer-Verlag, N.Y. 8. Lehman, E.L. (1986): Testing Statistical Hypotheses, 2nd Ed., Wiley, N.Y 9. Lehman, E.L. (1989): Theory of Point Estimation, 2nd Ed., Wiley, N.Y. 10. Noreen, E.W. (1982): Computer Intensive Methods for Testing Hypothesis 11. Rohatgi, V.K. & Ehsanes Saleh, A.K.M. (2001): An Introduction to Probability and Statistics.
John Wiley and Sons, N.Y 12. Silverman, B.W. (1986): Density Estimation for Statistics and Data Analysis, Chapman &
Hall, London. 13. Shao, J. & Tu, D. (2000): Jackknife and Bootstrap, Springer-Verlag, N.Y 14. Zacks, S (1971): Theory of Statistical Inference, Wiley, N.Y
M.Stat-502: Advanced Experimental Design
Course Code : M.Stat-502 Course Title : Advanced Experimental Design Course Type : Compulsory Level/Term and Section : M.Sc. Final Academic Session : 2019 - 2020 Course Instructor : Pre-requisite (If any) : Credit Value : 3 Total Marks : 75 (Examination 60, Tutorial/Terminal 11.25, and Attendance 3.75) COURSE DESCRIPTION: Situations often call for collection of data which are to be analyzed to obtain answer to certain problem of interest. This purpose is accomplished by the research workers through collection and analysis of numerical data and thus meaningful inferences are attained in various fields. Data are mainly collected through sample surveys from existent populations and sometimes through random experiments from non-existent or hypothetical populations. Advanced experimental design is a well-defined act or an investigation conducted to discover the underlying facts about a phenomenon, which are utilized to test some hypotheses of interest, to verify the results of previous investigations
Page | 10

Dept. of Statistics, RU M. Sc. Curriculum, 2019-2020
or to study the effect of new conditions on the system. Very often an experiment is conducted as a change in the routine operation of a system in order to measure the effect of change or intervention. COURSE OBJECTIVES (CO): 1. Students may identify the causes of variation and sort out corresponding components of
variation with associated degrees of freedom 2. Students may able to perform test of significance based on F distribution properly 3. On the basis of advanced experimental design the learners may able to collect maximum
amount of necessary information for the problems under consideration, at a minimum cost in terms of time and resources
4. If learners have sufficient knowledge about advanced experimental design, they can ensure the requisite assumptions for analysis and interpretation of given data.
COURSE LEARNING OUTCOMES (CLO):
Upon successful completion of this course, a student may able to 1. know how to collect information from non-existent population through random experiment 2. separate assignable causes of variation and chance cause of variation from the collected data
and perform statistical test of significance accordingly 3. increase the accuracy of the results of an experiment 4. formulate a mathematical relationship which relates changes in a given response to changes in
one or more factors known as modeling COURSE PLAN / SCHEDULE:
CLO Topics to be covered Teaching-Learning Strategies
Assessment Techniques
No. of lectures
1 Fractional Factorial and main effect Plan: Review of factorial experiment, confounding, fractional replication and related plan. Construction of plan with factors at 2 levels. Orthogonal arrays of strength 3 with factors at 2 levels. Orthogonal main effect plans factors at 3 and other levels. Mixed factorial experiment, orthogonal main effect plans of size 2XSr.Analysis of orthogonal plans.
Lecturers will be delivered with multi-media tools, Interactive brainstorming and Q/A session
Group discussion, Assignments, Sudden class tests, Tutorial, Final examination
10
2 Weighing Design: Complete block design as weighing design. Two pan weighing design from BIB design. Two associate PBIB designs as one pan weighing design. Weighing design from truncated BIB design. Efficiency.
10
3 Lattice Design: Balanced lattices. Partially balance lattices. Rectangular lattices. Cubic lattices. Lattice squares- description, statistical analysis with different replications.
7
Page | 11
Dept. of Statistics, RU M. Sc. Curriculum, 2019-2020
CLO Topics to be covered Teaching-Learning Strategies
Assessment Techniques
No. of lectures
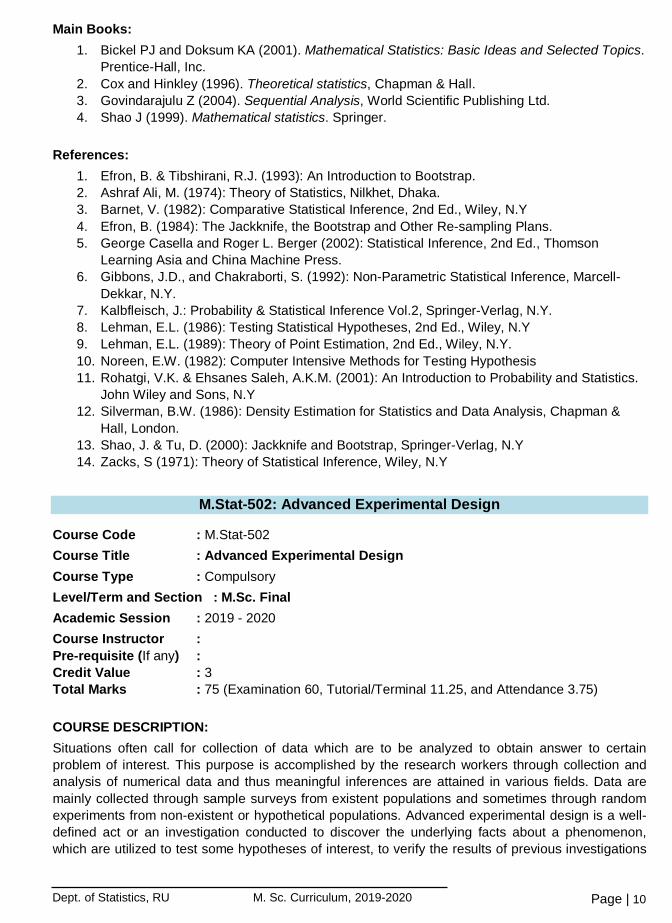
4 Multivariate analysis of Variance (MANOVA): Introduction, Omnibus MANOVA tests. Analysis and interpreting MANOVA. Causal models underlying MANOVA. Complex design.
8
5 Nested Design or Hierarchical Design: Introduction, two stages nested design, three stage nested design.
4
6 Response Surface Design: Introduction, first order design, second order design, method of steepest ascent, difference between response surface design and usual design.
6
Assessment Strategy Evaluation Policy (Grading System) and make-up procedures: As per ordinance of R U.
Main Books:
1. Cohran and Cox (2000): Experimental Design 2nd ed., John Wiley, N. Y. 2. Montegomery, D. C.(2005): Design and Analysis of Experiment, John Wiley, N. Y.
References:
1. Federer, W. T. (1955): Experimental Design, McMillan, New York. 2. Fisher, R. A. (1995): Design of Experiment, 8th ed., Hafner, N. Y. 3. John and Quenouille (1977): Experiments: Design and Analysis, 2nd ed., Charles Griffin,
London. 4. Kutner, M. H., Nachtsheim, C. J.,Neter, J. and Li, W. (2005): Applied Linear Statistical
Models, 5th ed.,McGraw-Hill, Irwin. 5. Steel, R. G. D and J. H. Torrie (1980): Principles and procedures of statistics, 2nd ed.,
McGraw-Hill Book Co. New York.
Page | 12
Dept. of Statistics, RU M. Sc. Curriculum, 2019-2020
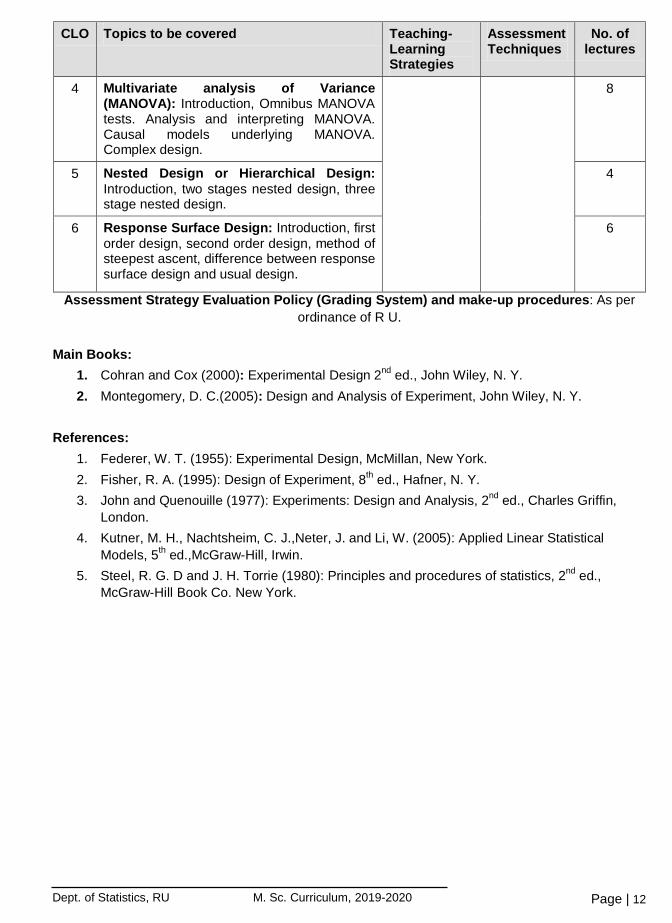
M. Stat-503: Advanced Multivariate Analysis
Course Code : Bstat-503 Course Title : Advanced Multivariate Analysis Course Type : Compulsory Year/Level and Semester
: M.Sc. Final
Academic Session : 2019 – 2020 Course Instructor : Pre-requisite (If any) : Bstat-401 (Multivariate Analysis) Credit Value : 3 Total Marks : 75 (Examination 60, Class test/Assignment 11.25, and Attendance 3.75)
COURSE DESCRIPTION: The aim of this course is to explore the advanced multivariate analysis methods such as multivariate multiple regressions, corresponding analysis, multivariate mixture distribution, clustering, independent component analysis and Bayesian multivariate regression and factor analysis. COURSE OBJECTIVES (CO):
1. Students will understand all the features of multivariate multiple regression analysis. 2. Students will learn all the features of multivariate mixture distributions. 3. Students will improve their ability to perform clustering and data mining approaches. 4. Students will learn how to apply Bayesian methods in regression and factor analyses. 5. Students will understand to separate the mixing signals through independent component
analysis. COURSE LEARNING OUTCOMES (CLO): Upon successful completion of this course, students should be able to
1. Understand the basic concepts and applications of multivariate regression analysis, corresponding analysis, multivariate mixture modelling, clustering and data mining.
2. Know how to apply the Bayesian inference approach in multivariate regression and factor analyses.
3. Apply independent component analysis for source separation.
COURSE PLAN/SCHEDULE:
CLO Topics to be covered Teaching-Learning Strategies
Assessment Techniques
No. of lectures
1 Multivariate Regression Analysis: simple, multiple and multivariate multiple linear regression models. Assumptions. Parameter estimations and multivariate prediction. The distribution of likelihood ratio for the multivariate multiple regression model. Likelihood ratio test (LRT) including other multivariate test procedures. Relationship with canonical correlation analysis (CCA). Interpretation and conclusion.
Lecturing with multimedia tools, Interactive brainstorming and Q/A session
Assignments, Class tests, Final examination
6
Page | 13
Dept. of Statistics, RU M. Sc. Curriculum, 2019-2020
CLO Topics to be covered Teaching-Learning Strategies
Assessment Techniques
No. of lectures
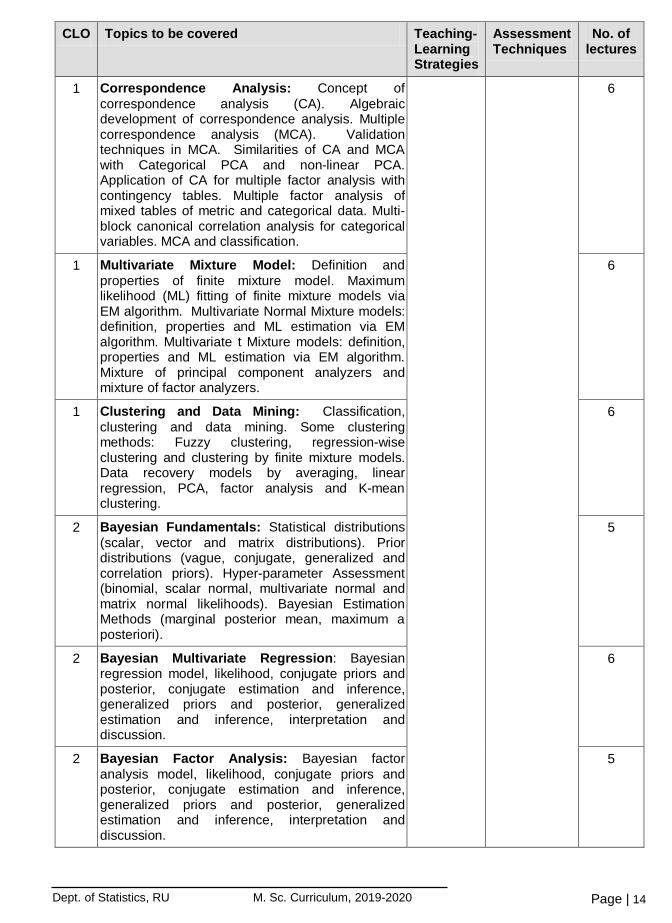
1 Correspondence Analysis: Concept of correspondence analysis (CA). Algebraic development of correspondence analysis. Multiple correspondence analysis (MCA). Validation techniques in MCA. Similarities of CA and MCA with Categorical PCA and non-linear PCA. Application of CA for multiple factor analysis with contingency tables. Multiple factor analysis of mixed tables of metric and categorical data. Multi-block canonical correlation analysis for categorical variables. MCA and classification.
6
1 Multivariate Mixture Model: Definition and properties of finite mixture model. Maximum likelihood (ML) fitting of finite mixture models via EM algorithm. Multivariate Normal Mixture models: definition, properties and ML estimation via EM algorithm. Multivariate t Mixture models: definition, properties and ML estimation via EM algorithm. Mixture of principal component analyzers and mixture of factor analyzers.
6
1 Clustering and Data Mining: Classification, clustering and data mining. Some clustering methods: Fuzzy clustering, regression-wise clustering and clustering by finite mixture models. Data recovery models by averaging, linear regression, PCA, factor analysis and K-mean clustering.
6
2 Bayesian Fundamentals: Statistical distributions (scalar, vector and matrix distributions). Prior distributions (vague, conjugate, generalized and correlation priors). Hyper-parameter Assessment (binomial, scalar normal, multivariate normal and matrix normal likelihoods). Bayesian Estimation Methods (marginal posterior mean, maximum a posteriori).
5
2 Bayesian Multivariate Regression: Bayesian regression model, likelihood, conjugate priors and posterior, conjugate estimation and inference, generalized priors and posterior, generalized estimation and inference, interpretation and discussion.
6
2 Bayesian Factor Analysis: Bayesian factor analysis model, likelihood, conjugate priors and posterior, conjugate estimation and inference, generalized priors and posterior, generalized estimation and inference, interpretation and discussion.
5
Page | 14
Dept. of Statistics, RU M. Sc. Curriculum, 2019-2020
CLO Topics to be covered Teaching-Learning Strategies
Assessment Techniques
No. of lectures
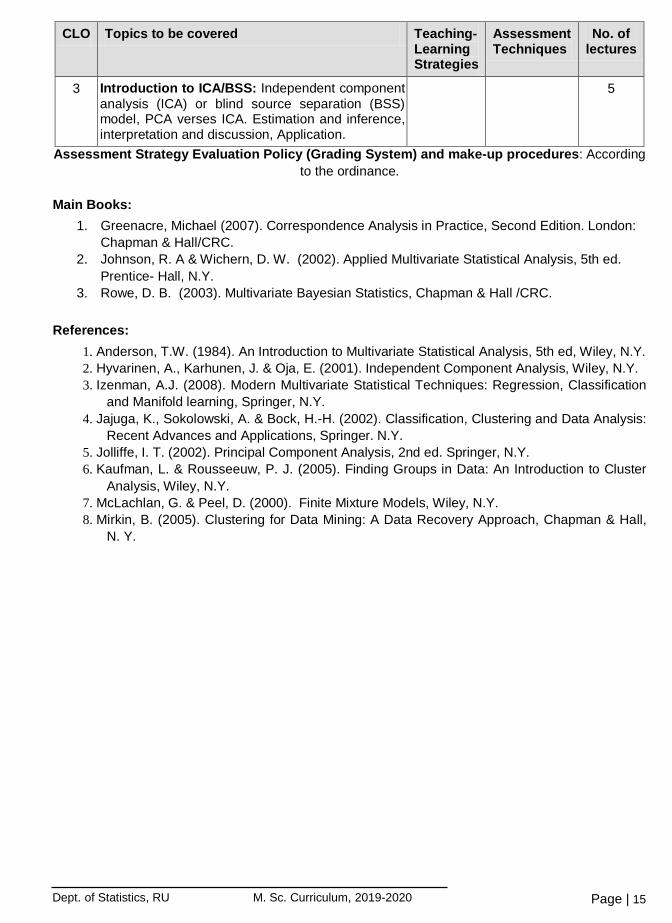
3 Introduction to ICA/BSS: Independent component analysis (ICA) or blind source separation (BSS) model, PCA verses ICA. Estimation and inference, interpretation and discussion, Application.
5
Assessment Strategy Evaluation Policy (Grading System) and make-up procedures: According to the ordinance.
Main Books:
1. Greenacre, Michael (2007). Correspondence Analysis in Practice, Second Edition. London: Chapman & Hall/CRC.
2. Johnson, R. A & Wichern, D. W. (2002). Applied Multivariate Statistical Analysis, 5th ed. Prentice- Hall, N.Y.
3. Rowe, D. B. (2003). Multivariate Bayesian Statistics, Chapman & Hall /CRC. References:
1. Anderson, T.W. (1984). An Introduction to Multivariate Statistical Analysis, 5th ed, Wiley, N.Y. 2. Hyvarinen, A., Karhunen, J. & Oja, E. (2001). Independent Component Analysis, Wiley, N.Y. 3. Izenman, A.J. (2008). Modern Multivariate Statistical Techniques: Regression, Classification
and Manifold learning, Springer, N.Y. 4. Jajuga, K., Sokolowski, A. & Bock, H.-H. (2002). Classification, Clustering and Data Analysis:
Recent Advances and Applications, Springer. N.Y. 5. Jolliffe, I. T. (2002). Principal Component Analysis, 2nd ed. Springer, N.Y. 6. Kaufman, L. & Rousseeuw, P. J. (2005). Finding Groups in Data: An Introduction to Cluster
Analysis, Wiley, N.Y. 7. McLachlan, G. & Peel, D. (2000). Finite Mixture Models, Wiley, N.Y. 8. Mirkin, B. (2005). Clustering for Data Mining: A Data Recovery Approach, Chapman & Hall,
N. Y.
Page | 15

Dept. of Statistics, RU M. Sc. Curriculum, 2019-2020
M.Stat-504: Time Series Analysis and Forecasting
Course Code : M.Stat-504 Course Title : Time Series Analysis and Forecasting Course Type : Compulsory Level/Term and Section : M. Sc. Final Academic Session : 2019 - 2020 Course Instructor : Pre-requisite (If any) : Credit Value : 3 Total Marks : 75 (Examination 60, Tutorial/Terminal 11.25, and Attendance 3.75) COURSE DESCRIPTION: The aim of this course is to get acquainted with important concepts of time series analysis and its applications on economic, financial, environmental, demographic, geological, astrophysical and policy variables. This course is heavily oriented towards the formulation of mathematical models for signal processing, forecasting and risk analysis and assessing interdependence of real-world data. COURSE OBJECTIVES (CO):
1. To provide students with a formal treatment time series data and analysis 2. Equipping students with essential tools for forecasting economic, financial, environmental
and policy variables, and benchmarking 3. To build ability of conducting risk analysis of financial market 4. Fostering understanding of geological and astrophysical signal processing
COURSE LEARNING OUTCOMES (CLO): Upon successful completion of this course, a student will be able to
1. Solve difference equations of a system with times operator 2. Model and forecast time series data properly 3. Analyze data and signals in frequency domain and compute spectral density 4. Analyze environmental and climate variables and suggest for controlling measures 5. Model volatility of financial time series and predict risk of financial market Perform
multivariate time series analysis and find out interdependence.
COURSE PLAN / SCHEDULE:
CLO Topics to be covered Teaching-Learning Strategies
Assessment Techniques
No. of lectures
1 Introduction: Components of time series, Stationarity, Ergodicity, White noise, Autocorrelation function, Partial autocorrelation function, Difference equations and their solution, Basic ARMA models and their extension. Box-Jenkins modeling philosophy and forecasting
Lecturing with multi-media tools, Interactive brainstorming and Q/A session
Assignments, Class tests, Final examination
10
Page | 16

Dept. of Statistics, RU M. Sc. Curriculum, 2019-2020
CLO Topics to be covered Teaching-Learning Strategies
Assessment Techniques
No. of lectures
2 Spectral Analysis: Introduction, Fourier transformation. Periodogram, Spectral representation, Spectral density, Spectral densities for ARMA processes.
8
3 Non-stationary time series: Trend stationary and difference stationary time series, Integrated process, Unit roots, Unit root tests, Structural changes and their consequences, Filtering, ARIMA modeling, SARIMA modeling.
9
4 Multivariate time series: Structural, recursive and reduced form vector autoregressive (VAR) models, Granger causality, Impulse response functions, Forecast error variance decomposition. Spurious regression and cointegration, Tests for cointegration: Engle-Granger methodology and Johansen’s methodology, Error correction models.
10
5 Time Series Model of heteroskedasticity: Stylized facts of financial time series. Volatility clustering, Detection of autoregressive conditional heteroskedasticity (ARCH) effects, Modeling volatility, ARCH model, Extension of ARCH model: GARCH, TARCH, GJR-GARCH, FIGARCH, EGARCH, IGARCH, PARCH, NARCH models.
8
Assessment Strategy Evaluation Policy (Grading System) and make-up procedures: According to the ordinance.
Main Books: 1. Andersen, T. G. and A. R. Davis (2009): Handbook of Financial Time Series, Jens-Peter
Kreifs and Thomas Mikosch edition, Springer-Verlag. 2. Hamilton, J.D. (1994): Time Series Analysis, Princeton University Press, N.J. 3. Tsay, R. S. (2010): Analysis of Financial Time Series, Wily & Sons, N.J.
References:
1. Anderson, T.W. (1971): The Statistical Analysis of Time Series, Wiley, N.Y 2. Box, G.E.P. and Jenkins, G.M. (1976): Time Series Analysis: Forecasting and Control,
Holden-Day, Sun Francisco. 3. Cryer, J. D. and K. Chan (2008): Time Series Analysis: with applications in R, 2nd Ed.,
Spinger, N.Y. 4. Findley, D.F. (1981): Applied Time Series Vol. I & II, Academic press, N.Y. 5. Fuller, W.A (1976): Introduction to Statistical Time Series, Willey N.Y 6. Lűtkepohl, H. (2005): New Introduction to multiple Time Series Analysis, Springer, N.Y. 7. Reinsel, G. C. (2003): Elements of Multivariate Time Series Analysis, Springer, N.Y. 8. Shumway, R. H. and D. S. Stoffer (2006): Time Series analysis and its Applications with R
Examples.
Page | 17

Dept. of Statistics, RU M. Sc. Curriculum, 2019-2020
M.Stat-505: Data Mining
Course Code : M.Stat-505 Course Title : Data Mining Course Type : Compulsory Level/Term and Section : M.Sc. Final Academic Session : 2019 - 2020 Course Instructor : Pre-requisite (If any) : Credit Value : 3 Total Marks : 75 (Examination 60, Tutorial/Terminal 11.25, and Attendance 3.75) COURSE DESCRIPTION: Data that has relevance for managerial decisions is accumulating at an incredible rate due to a host of technological advances. From this flood of digital data we have to extract meaningful information and knowledge for the development of business, government and scientific community. Data mining is a class of analytical techniques that examine a large amount of data to discover new and valuable information. This course is design is to introduce the core concepts of data mining. COURSE OBJECTIVES (CO):
1. Student will understand the basic concept about data mining; 2. Student will be able to explore categorical and numerical data and also apply proper
technique for preprocessing the data; 3. Student will enlighten fundamental concepts and algorithms for supervised learning,
unsupervised learning and semi-supervised learning, to provide the students with the necessary background for the application of data mining to real problems.
4. Student will develop and apply critical thinking, problem-solving, and decision-making skills COURSE LEARNING OUTCOMES (CLO): Upon successful completion of this course, a student will be able to
1. know what is data mining and how it is used; 2. know the different technique for pre-processing the data; 3. know different supervised, semi-supervised and unsupervised learning method for
classification, prediction and clustering the data; 4. know about association rules and model evaluation technique; 5. know how to use data mining technique for real data analysis and its interpretation
Page | 18
Dept. of Statistics, RU M. Sc. Curriculum, 2019-2020
COURSE PLAN / SCHEDULE:
CLO Topics to be covered Teaching-Learning Strategies
Assessment Techniques
No. of lectures
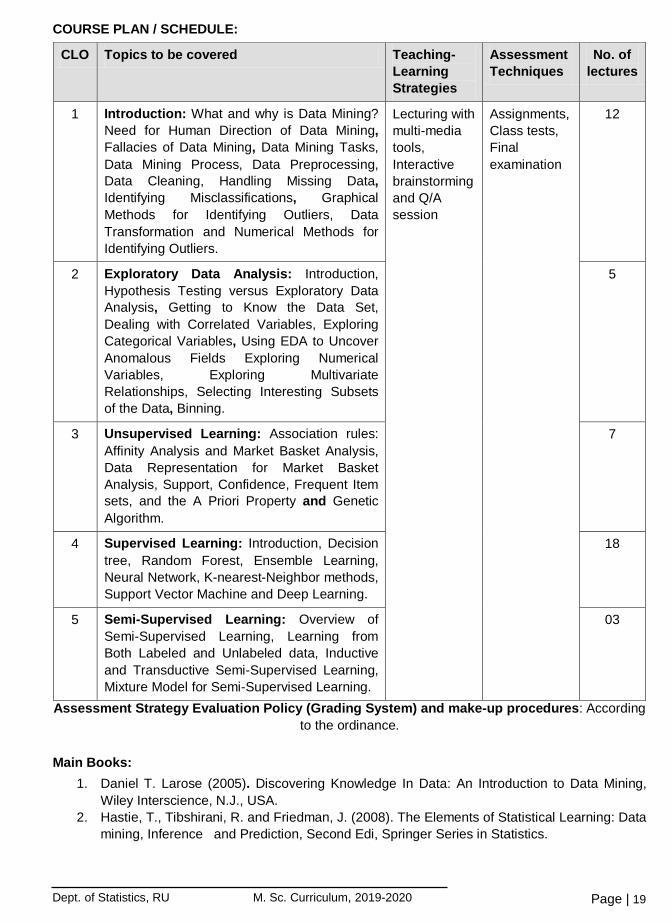
1 Introduction: What and why is Data Mining? Need for Human Direction of Data Mining, Fallacies of Data Mining, Data Mining Tasks, Data Mining Process, Data Preprocessing, Data Cleaning, Handling Missing Data, Identifying Misclassifications, Graphical Methods for Identifying Outliers, Data Transformation and Numerical Methods for Identifying Outliers.
Lecturing with multi-media tools, Interactive brainstorming and Q/A session
Assignments, Class tests, Final examination
12
2 Exploratory Data Analysis: Introduction, Hypothesis Testing versus Exploratory Data Analysis, Getting to Know the Data Set, Dealing with Correlated Variables, Exploring Categorical Variables, Using EDA to Uncover Anomalous Fields Exploring Numerical Variables, Exploring Multivariate Relationships, Selecting Interesting Subsets of the Data, Binning.
5
3 Unsupervised Learning: Association rules: Affinity Analysis and Market Basket Analysis, Data Representation for Market Basket Analysis, Support, Confidence, Frequent Item sets, and the A Priori Property and Genetic Algorithm.
7
4 Supervised Learning: Introduction, Decision tree, Random Forest, Ensemble Learning, Neural Network, K-nearest-Neighbor methods, Support Vector Machine and Deep Learning.
18
5 Semi-Supervised Learning: Overview of Semi-Supervised Learning, Learning from Both Labeled and Unlabeled data, Inductive and Transductive Semi-Supervised Learning, Mixture Model for Semi-Supervised Learning.
03
Assessment Strategy Evaluation Policy (Grading System) and make-up procedures: According to the ordinance.
Main Books:
1. Daniel T. Larose (2005). Discovering Knowledge In Data: An Introduction to Data Mining, Wiley Interscience, N.J., USA.
2. Hastie, T., Tibshirani, R. and Friedman, J. (2008). The Elements of Statistical Learning: Data mining, Inference and Prediction, Second Edi, Springer Series in Statistics.
Page | 19
Dept. of Statistics, RU M. Sc. Curriculum, 2019-2020
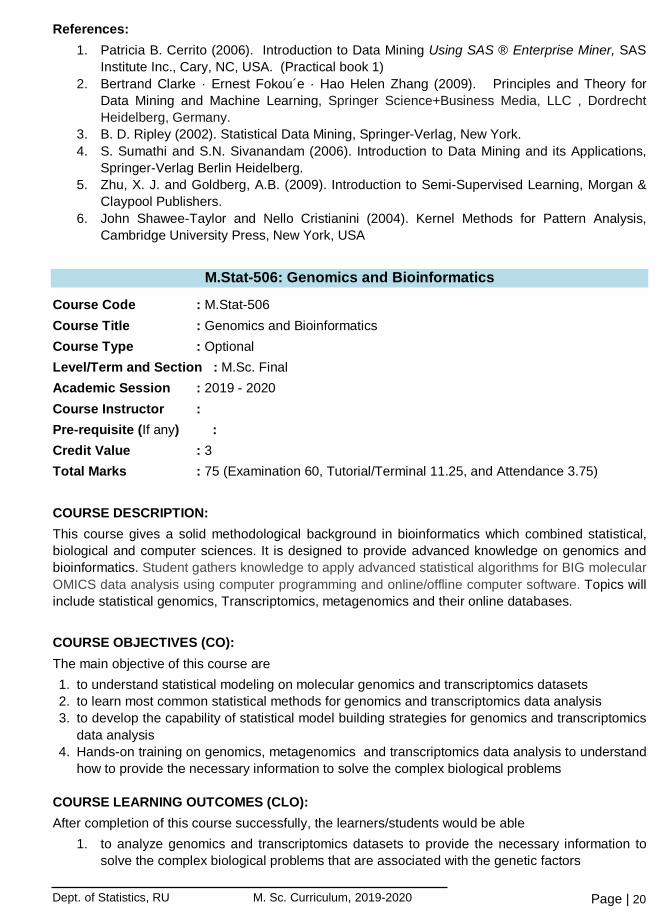
References: 1. Patricia B. Cerrito (2006). Introduction to Data Mining Using SAS ® Enterprise Miner, SAS
Institute Inc., Cary, NC, USA. (Practical book 1) 2. Bertrand Clarke · Ernest Fokou´e · Hao Helen Zhang (2009). Principles and Theory for
Data Mining and Machine Learning, Springer Science+Business Media, LLC , Dordrecht Heidelberg, Germany.
3. B. D. Ripley (2002). Statistical Data Mining, Springer-Verlag, New York. 4. S. Sumathi and S.N. Sivanandam (2006). Introduction to Data Mining and its Applications,
Springer-Verlag Berlin Heidelberg. 5. Zhu, X. J. and Goldberg, A.B. (2009). Introduction to Semi-Supervised Learning, Morgan &
Claypool Publishers. 6. John Shawee-Taylor and Nello Cristianini (2004). Kernel Methods for Pattern Analysis,
Cambridge University Press, New York, USA
M.Stat-506: Genomics and Bioinformatics
Course Code : M.Stat-506 Course Title : Genomics and Bioinformatics Course Type : Optional Level/Term and Section : M.Sc. Final Academic Session : 2019 - 2020 Course Instructor : Pre-requisite (If any) : Credit Value : 3 Total Marks : 75 (Examination 60, Tutorial/Terminal 11.25, and Attendance 3.75) COURSE DESCRIPTION: This course gives a solid methodological background in bioinformatics which combined statistical, biological and computer sciences. It is designed to provide advanced knowledge on genomics and bioinformatics. Student gathers knowledge to apply advanced statistical algorithms for BIG molecular OMICS data analysis using computer programming and online/offline computer software. Topics will include statistical genomics, Transcriptomics, metagenomics and their online databases. COURSE OBJECTIVES (CO): The main objective of this course are 1. to understand statistical modeling on molecular genomics and transcriptomics datasets 2. to learn most common statistical methods for genomics and transcriptomics data analysis 3. to develop the capability of statistical model building strategies for genomics and transcriptomics
data analysis 4. Hands-on training on genomics, metagenomics and transcriptomics data analysis to understand
how to provide the necessary information to solve the complex biological problems
COURSE LEARNING OUTCOMES (CLO): After completion of this course successfully, the learners/students would be able
1. to analyze genomics and transcriptomics datasets to provide the necessary information to solve the complex biological problems that are associated with the genetic factors
Page | 20

Dept. of Statistics, RU M. Sc. Curriculum, 2019-2020
2. to select appropriate statistical algorithms for analyzing genomics, metagenomics and transcriptomics datasets
3. to contribute to the development of high yielding varieties and to achieve the satisfactory score of SDG index from the agricultural sector.
4. to contribute to the discovery of new drugs/vaccines for the complex diseases and to achieve the satisfactory score of SDG index from the health sector.
COURSE PLAN / SCHEDULE:
CO Topics to be covered Teaching-Learning Strategies
Assessment Techniques
No. of lectures
1 DNA Sequence Analysis: Review of pairwise sequence alignment. Multiple sequence alignment: Dynamic programming, Progressive methods, Iterative methods, Motif finding, Techniques inspired by computer science, Structural alignment. Phylogenetic analysis: Assessment of significance, Assessment of credibility, Scoring functions. Some bioinformatics databases including Gene Bank, NCBI, PDB, BLAST and FASTA.
Lecturing with multi-media tools, Interactive brainstorming and Q/A session
Assignments, Class tests, Final examination
9
2 QTL Analysis: .Introduction. Marker Analysis of Phenotypes. Whole-Genome Marker Analysis. The Structure of QTL Mapping (Population and Quantitative Genetic Structure of the Mixture Model). Interval Mapping Approaches for QTL Analysis (Linear regression and maximum likelihood approaches for QTL analysis with backcross and F2 populations). Composite and multiple interval mapping approaches for QTL analysis.
9
3 Gene-Expression Data Analysis: Introduction to different types of microarray gene expression data. Preprocessing (Transformation, Normalization, Image analysis and filtering). Identification of differential expressed (DE) genes in two or more groups using statistical test. Clustering and Classification for Gene-Expression Data Analysis. Inferring genetic regulatory networks from microarray experiment with Bayesian networks. Modeling genetic regulatory networks using gene expression profile. Gene-set enrichment analysis.
9
Page | 21

Dept. of Statistics, RU M. Sc. Curriculum, 2019-2020
CO Topics to be covered Teaching-Learning Strategies
Assessment Techniques
No. of lectures
4 Genome-wide Association Studies (GWAS): Introduction. QTL and SNP analysis with Gene-Expression data. SNP analysis using contingency table. GWAS using linear mixed and fixed effect models and GeneABLE. Haplotype Estimation. Regional multilocus association models. Linkage disequilibrium and tagging. Practical guide to linkage disequilibrium analysis and tagging using Haploview.
9
5 Metagenomic Analysis: Introduction to microbiome, Microbial sequence assembling, shotgun and amplicon sequencing, high-through sequencing, sequence filtering, diversity analysis, met transcriptomics.
9
Assessment Strategy Evaluation Policy (Grading System) and make-up procedures: According to the ordinance.
Main Books:
1. Ben Hui Liu and Leming M Shi. (2013). Statistical Genomics and Bioinformatics, Chapman and Hall/CRC press, 2nd edition, New York.
2. David W. Mount. (2004). Bioinformatics: Sequence and Genome Analysis, Second Edition, Cold Spring Harbor Laboratory Press.
Recommended Books:
1. Xu, S. (2013). Principles of statistical genomics. Springer. 2. Liu, B. H. (1997). Statistical genomics: linkage, mapping, and QTL analysis. CRC press. 3. Ferreira, M. A. R., Medland, S. E., & Posthuma, D. (2008). Statistical genetics: gene
mapping through linkage and association. New York: Taylor & Francis. 4. Gondro, C., Van der Werf, J., & Hayes, B. J. (Eds.). (2013). Genome-wide Association
Studies and Genomic Prediction. Humana Press.
Page | 22
Dept. of Statistics, RU M. Sc. Curriculum, 2019-2020
M-Stat 507: Advanced Demography
Course Code : M-STAT 507 Course Title : Advanced Demography Course Type : Optional
Level/Term and Section : M. Sc. Final
Academic Session : 2019 - 2020 Course Instructor : Pre-requisite (If any) : Credit Point (CP) : 3 Total Marks : 75 (Examination 60, Tutorial/Terminal 11.25, and Attendance 3.75)
COURSE DESCRIPTION: Firstly, observed the values of the demographic parameters using indirect techniques and secondly, take necessary future plan of action on the basis of the findings for the nation of country. COURSE OBJECTIVES (CO): This course will develop the students’ ability to:
1. understand the concepts of single, double and multiple decrement life tables. 2. observed eliminating effect of specific disease on expectation of life. 3. estimate different parameters of vital events using indirect techniques in absence of direct
information. 4. understand the concept of population growth models and their graduation. 5. understand the application of projection matrix for fertility and mortality. 6. understand the concept of fecundability, its distribution and effect the use of contraceptives
COURSE LEARNING OUTCOMES (CLO): After successful completion of this course, a student will be able to:
1. apply include public health, 2. apply reproductive health, 3. apply population policy, such as fertility, mortality, migration etc.
Page | 23

Dept. of Statistics, RU M. Sc. Curriculum, 2019-2020
COURSE PLAN / SCHEDULE:
CLO Topics to be covered Teaching-Learning Strategies
Assessment Techniques
No. of lectures
1 Life table analysis: General idea, ordinary life table. Properties and interrelationships. Probability distributions of life table functions. Methods of construction of double and multiple decrement tables and increment decrement life tables. Joint life functions, Multi life functions. Last survivor status. General Multi life status.
Lecturing with multimedia projector, Interactive board and Q/A session
Assignment, class tests, presentation, final exam.
8
2 Demographic estimation: Concept and applicability of the indirect techniques involve in the estimation of infant, child, adult and maternal mortality. Estimates of fertility. Estimation of migration. Dual record system. Chandra-Sekar and Deming Method. Coal’s indices, Coale’s nuptiality model. Davis-Blake framework of intermediate variables. Proximate determinants of fertility.
10
3 Stable population theory and models: Concept of stationary, stable and quasi-stable population. Natural growth rate and intrinsic growth rate, Lotka's Intregal Equation, Net maternity function. Graduation of NMF by Normal, Wicksell and Hadwiger curve. Effects of change of birth and death rates on stable population. Study of some growth models - Exponential, Malthusian, Logistic and Quasi-stable models.
12
4 Population projection: Development of Leslie projection matrix. Properties of Leslie matrix. Forward and backward operation of population projection. Stable vector, dominant root. Frejka's component method for population projection. Projection of fertility and mortality.
10
5 Micro demography: Reproductivity, fecundity, fecundability and sterility. Effective fecundability. Residual fecundability. Estimation of fecundability. Pearl index. Effectiveness and efficiency of FP methods.
5
Assessment Strategy Evaluation Policy (Grading System) and make-up procedures: According to the ordinance.
Main Books:
1. Pollard, J.H. (1980): Mathematical models for the growth of human populations. 2. Johnson RCE & Johnson (1980): Survival Models and Data Analysis, Wiley NL & Sons, NY. 3. Keyfitz, N. (1977): Applied Mathematical Demography, Wiley & Sons.
Page | 24

Dept. of Statistics, RU M. Sc. Curriculum, 2019-2020
References: 4. Biswas, S. (1988): Stochastic Processes in Demography and Applications. Wiley Eastern
Ltd., India 5. Islam, N. (1996): Levels and Correlates of Marriage and Fertility in Bangladesh. Unpublished
Ph.D desperation, R.U. 6. Shryock, H. J. S. Siegel and Associates (1976): The Methods and Materials of Demography;
Cond., ed., New York, Academic Press. 7. UNFPA (1993): Population Research Methodology Vols. 1-8. Chicago, Illinois, and other
UNFPA publications. 8. UNO (1983): Indirect Technique Demographic Estimation, Population Studies No. 81.
M-Stat. – 508: Environmental Statistics
Course Code : M-Stat. - 508 Course Title : Environmental Statistics Course Type : Optional
Level/Term and Section : M. Sc. Final
Academic Session : 2019 - 2020 Course Instructor : Pre-requisite (If any) : Credit Point (CP) : 3 Total Marks : 75 (Examination 60, Tutorial/Terminal 11.25, and Attendance 3.75)
COURSE DESCRIPTION: The aim of this course is a broad discipline stretching from how and what to sample, through to modeling impacts on human and ecosystem health and ultimately to providing predictions of what changes might occur in the future. It acts as a bridge between the fundamental methods of the subject and important applications in a wide variety of environmental issues. COURSE OBJECTIVES (CO): This course will develop the students’ ability to:
1. Improve knowledge of the environment; 2. Provide quantitative information about the environment’s state and its most important
changes over time across territories; 3. Achieve by setting up, strengthening and sustaining environmental issues which already
operating in economic and social statistics. COURSE LEARNING OUTCOMES (CLO): After successful completion of this course, a student will be able to:
1. Apply mathematical concepts, including statistical methods, to field and laboratory data to study scientific phenomena; Develop an understanding of current environmental monitoring systems;
2. Apply knowledge acquired to the process of environmental impact modeling and prediction as a design tool with application to a number of case studies;
3. Design and execute a scientific project; Adapt skills in GIS to environmental management systems;
4. Develop skill for achieving sustainable development goals.
Page | 25

Dept. of Statistics, RU M. Sc. Curriculum, 2019-2020
COURSE PLAN / SCHEDULE:
CLO Topics to be covered Teaching-Learning Strategies
Assessment Techniques
No. of lectures
1 Introduction: Environmental Variables – Discrete and continuous; Data collection – primary and secondary; Presentation of data – spatial and non-spatial data. Design and Analysis of Environmental Data: Conceptual Foundations Methods, Environmental data, Data Exploration, screening and adjustment, Confidence Intervals and More, Deterministic functions, Bestiary of probability distributions, Continuous probability distributions, Discrete probability distributions, Statistical Models – putting it all together, Frameworks for statistical Inference, Bayesian Inference, Hypothesis testing concepts, Nonparametric Inference: Ordinary least squares and more, Maximum Likelihood inference.
Lecturing with multimedia projector, Interactive board and Q/A session
Assignment, class tests, presentation, final exam.
14
2 Hazard in the environment: Concept of risk, vulnerability, hazard, and disaster; Types of Natural Hazards and their Global and National perspectives, Role of Global climatic changes and Global warming. Causes and consequences of Global Warming, Sea level rise in climate. Study of Agro-meteorological Features: Fundamentals Concept of Meteorology and Climatology. Desertification, Drought and Flood management and Modeling Analysis: Flood hazard and its management: Definition, Causes, nature, frequency of flooding and its impacts. Desertification and Drought – Causes of desertification; Evaluation of desertification hazard – potential and zoning: Drought – causes, types, distribution and management.
14
3 Food Security and Environmental Impact on Health and Agriculture: Pollution and Soil degradation, Deforestation, Land use pattern and regional pattern of productivity. Case Study of Environmental Data Analysis: 1.Applications of probability distributions and Markov chain model, 2.Drought Identification and Characterization at Local, National and Global level, 3.Drought indices by Standardized Precipitation Index (SPI), 4.Drought Prediction Using Markov chains modeling, 5. Applications of non-linear and non-stochastic Time series analysis, Wavelets analysis, Spectral analysis
12
Page | 26

Dept. of Statistics, RU M. Sc. Curriculum, 2019-2020
CLO Topics to be covered Teaching-Learning Strategies
Assessment Techniques
No. of lectures
4 Geographical Information System (GIS): Basic principles, Raster and vector data, Map Projection, Overlay analysis, Data structure and Digital cartography. Global Positioning System (GPS): Basic principles, Applications to environmental studies.
5
Assessment Strategy Evaluation Policy (Grading System) and make-up procedures: According to the ordinance.
Main Books:
1. G.P. Patil & C.R. Rao (1999): Environmental statistics: analyzing data for environmental policy, John Wiley and Sons.
2. H. R. Byers (1974): General Meteorology, McGraw-Hill 3. Tanvir Islam • Prashant K. Srivastava Manika Gupta • Xuan Zhu Saumitra Mukherjee
Editors: Computational Intelligence Techniques in Earth and Environmental Sciences, Springer , http://www.cs.virginia.edu/~mr4xb/paper/book_springer.pdf
4. Isaacson D.L., Madsen R., John (1976): Markov Chains: Theory and Applications. Wiley, New York.
5. Vic Barnett (2004): Environmental Statistics: Methods and Applications (Wiley Series in Probability and Statistics), John Wiley & Sons.
6. S. D. Shamsuuddin, Rafique Ahmed, Raunaq Jahan: Climate Variability: Issues and perspectives for Bangladesh.
References
1. Box, G.E.P. and G.M. Jenkins, (1976): Time Series Analysis Forecasting and Control. San Francisco: Holden-Day.
2. Bryan F.J. Manly, Statistics for Environmental Science and Management, Second Edition (Chapman & Hall/CRC Applied Environmental Statistics).
3. G. T. Trewartha (1968): An Introduction to Climate; McGraw-Hill 4. Linda Courtenay Botterill and Geoff Cockfield (2013): Drought, Risk Management, and
Policy: Decision-Making Under Uncertainty. Australia 5. P. Reining (1978): Handbook of Desertification Indicators (Washington D.C.: American
Association for the Advancement of Science. 6. Velma I. (2012): Impact of Climate Change on Water and Health, Grover, Publisher: CRC
Press, John Wiley and Sons. 7. Wayne R. Ott (1979): Environmental Indices: Theory and Practice, Publisher: CRC Press,
John Wiley and Sons.
Page | 27
Dept. of Statistics, RU M. Sc. Curriculum, 2019-2020
M.Stat-509: Advanced Actuarial Statistics Course Code : M.Stat-509 Course Title : Advanced Actuarial Statistics Course Type : Optional Level/Term and Section: M.Sc. Final Academic Session : 2019 - 2020 Course Instructor : Pre-requisite (If any) : Credit Value : 3 Total Marks : 75 (Examination 60, Tutorial/Terminal 11.25, and Attendance 3.75) COURSE DESCRIPTION: A general term for the data used by actuaries in evaluating the risks of morbidity and mortality in particular groups, and projecting future financial liabilities of insurance policies and pensions. The strength of Actuarial Statistics is the emphasis on understanding statistical concepts and methods, and their practical application to actuarial problems. In designing such new course will enhance Actuarial Science for the students through development of transferable skills and enhanced employability. The aim of Actuarial Statistics is to provide grounding in mathematical and statistical methods that are of relevance for actuarial work. It equips the student with knowledge of statistical distributions, methods to summaries data, the principles of statistical inference, regression models (including generalized linear models) and the fundamental concepts of Bayesian statistics. This course includes both theory and application of the ideas about stochastic process, death process, survival models etc. using different software. COURSE OBJECTIVES (CO):
1. The core aim of Actuarial Statistics is to provide grounding in mathematical and statistical methods that are of relevance for actuarial work
2. The learners in such course may efficiently apply mathematical and statistical methods to assess risk in insurance, finance and other industries and professions
3. Actuaries apply rigorous mathematics to model matters of uncertainty. 4. Actuarial Statistics is the profession concerned with the application of mathematical,
statistical, probabilistic, and financial theories to solve real business problems. These problems involve analyzing future financial events, especially where future payments involved have certain or uncertain timing.
COURSE LEARNING OUTCOMES (CLO): Upon successful completion of this course, a student will be able to
1. describe and use statistical distribution for modeling; 2. describe and apply the main concepts underlying the analysis of time series models; 3. understand and apply Markov chains and processes; 4. know and apply techniques of survival analysis; 5. assess the suitability of actuarial, financial and economic models in solving actuarial
problems.
Page | 28

Dept. of Statistics, RU M. Sc. Curriculum, 2019-2020
COURSE PLAN / SCHEDULE: CLO Topics to be covered Teaching-
Learning Strategies
Assessment Techniques
No. of lectures
1 Insurance: Nature and functions of insurance; Benefits and costs of insurance system to the society; Economic theories of insurance; The mathematical basis for insurance; Insurable interest; Principle of indemnity; Doctrine of subrogation; Warranties; Proximate causes; assignment of transfer of interest; Return to premium.
Lectures will be delivered with multi-media accessories, Interactive brainstorming and Q/A session
Assignments, Class tests, Tutorial, Final examination
6
2 Life Insurance: Essential features of life insurance contract; Risk selection for life insurance; Sources of risk information; Classification on annuities.
5
3 Health Insurance: Types of health insurance coverage; Exclusion in health insurance policies; Payment of claim; Fire insurance, Marine insurance and other insurance: Concepts, features, policies and coverage; Payment of claim.
5
4 Risk Management: Loss, peril, hazard and risk; Types of risk; Development and implementation of risk management programs; Methods of dealing with risk; Personal risk management; The economics of insurance, utility theory; Application of probability to problems of life and death, the determination of single premiums for insurances and annuities in both the discrete and continuous case; Theory and practice of pension funding, assumptions; Basic actuarial functions and population theory applied to private pensions. Survival distributions and life tables; Life insurance, life annuities; Net premium, premium series, multiple life functions, multiple decrement models; Valuation theory for pension plans, the expense function and dividends.
14
5 Measurement of Risk and Mortality Table: Mortality tables and its classifications; Construction of mortality tables; Premium calculation of various life policies.
5
6 Exposure formulas: assumed and using implications, techniques of calculating exposures from individual records including consideration involving selection of studies, various observation periods and various methods of tabulating deaths; Techniques of calculating exposures from various schedules including the general concepts of fiscal year; The use of interim schedules and variations in observation period or method of grouping deaths and practical aspects of construction of actuarial tables.
10
Page | 29
Dept. of Statistics, RU M. Sc. Curriculum, 2019-2020
Main Books: 1. Dorfman, Mark. S (1991). Introduction to Risk Management and Insurance, Prentice Hall. 2. Mishra, M. N. (1989). Principles and practice, S. Chand and Company.
References:
1. Hafeman, M. (2009). The Role of the Actuary in Insurance, primer series on insurance issue 4, may 2009, The World Bank.
2. Glen, N. (2016). Actuarial Science- An Elementary Manual, SCRIBD, Glasgow.
M.Stat-510: Proteomics and Biomedical Informatics Course Code : M.Stat-510 Course Title : Proteomics and Biomedical Informatics Course Type : Optional Level/Term and Section : M.Sc. Final Academic Session : 2019 - 2020 Course Instructor : Pre-requisite (If any) : B.Stat- 410 Credit Value : 3 Total Marks : 75 (Examination 60, Tutorial/Terminal 11.25, and Attendance 3.75) COURSE DESCRIPTION: Bioinformatics is one of the modern subjects of research and study. Proteomics is key issue of branch of Bioinformatics as well as systems biology. Presently health hazard becoming the challenging topic in the health sector throughout the world. The practice of modern medicine and biomedical research requires sophisticated information technologies with which to manage patient information, plan diagnostic procedures, interpret laboratory results, and carry out investigations. Medical Informatics provides both a conceptual framework and a practical inspiration for this swiftly emerging scientific discipline at the intersection of computer science, decision science, information science, cognitive science, biomedicine and systems biology. COURSE OBJECTIVES (CO):
1. Students will learn the basic bioinformatics with the function of molecular central dogma. 2. Students will understand statistical modeling on molecular proteomics and biological
database. 3. Students will learn most common statistical methods for proteomics data analysis and to
develop the capability of statistical model building strategies for proteomics data analysis 4. Students will get hands-on training on proteomics data analysis to understand how to
provide the necessary information to solve the complex biological problems. 5. Students will understand the fundamentals of drug discovery protocol and medical
informatics
Page | 30

Dept. of Statistics, RU M. Sc. Curriculum, 2019-2020
COURSE LEARNING OUTCOMES (CLO): Upon successful completion of this course, a student will be able to
1. Analyze proteomics datasets to provide the necessary information to solve the complex biological problems that are associated with the genetic factors
2. Select appropriate statistical algorithms for analyzing proteomics datasets and protein structure prediction.
3. Interpret the metabolic pathway analysis for metabolite biomarker prediction and explain the derivation of protein data from databases.
4. Interpret the discovery of new drugs/vaccines for the complex diseases and to achieve the satisfactory score of SDG index from the health sector.
5. Understand the concept of medical informatics to explain the better Pervasive medical healthcare.
6. Interpret the network analysis using BN and SVM technologies and explain the diseases risk classification
COURSE PLAN / SCHEDULE: CLO Topics to be covered Teaching-
Learning Strategies
Assessment Techniques
No. of lectures
1 Introduction to bioinformatics, Cell Structure and Function, Cell components. Chromosome, Chromosome structure and organization. DNA, RNA, Gene and Central dogma and bioinformatics. Introduction to Bioinformatics. Importance/scope/Applications of Bioinformatics. DNA sequencing, Shotgun sequencing, Long repeats, r-scane.
Lecturing with multi-media tools, Interactive brainstorming and Q/A session
Assignments, Class tests, Presentation, and Final examination
8
2 Protein Sequencing and Amino Acids, Amino acids and Amino Acids structure and functions. Codons. Metabolic and Biochemical pathway analysis e.g. E.coli. pathways. Sequence alignment, Overview of methods of sequence alignment. Dynamic programming algorithm for sequence alignment, Multiple Sequence alignments, statistical methods for aiding alignment.
8
3 Overview of the use and maintenance of different databases in common use in biology. Databases: GenBank, DDBJ, EMBL NCBI, EBI, UniGene, UniProt, Swiss-Prot, PDB and KEGG. BLAST and FASTA analysis. Protein Classification, Structure and Prediction, Protein Structure Prediction, Methods for predicting the secondary and tertiary structure of proteins. Techniques: neural networks, SVMs, genetic algorithms and stochastic global optimization.
8
4 Drug Discovery Informatics, Metabolome and Metabolomics. Systems biology, Approaches to drug and vaccine design using bioinformatics tools, Molecular docking using Autodock and/or other computer aided programs.
8
Page | 31
Dept. of Statistics, RU M. Sc. Curriculum, 2019-2020
CLO Topics to be covered Teaching-Learning Strategies
Assessment Techniques
No. of lectures
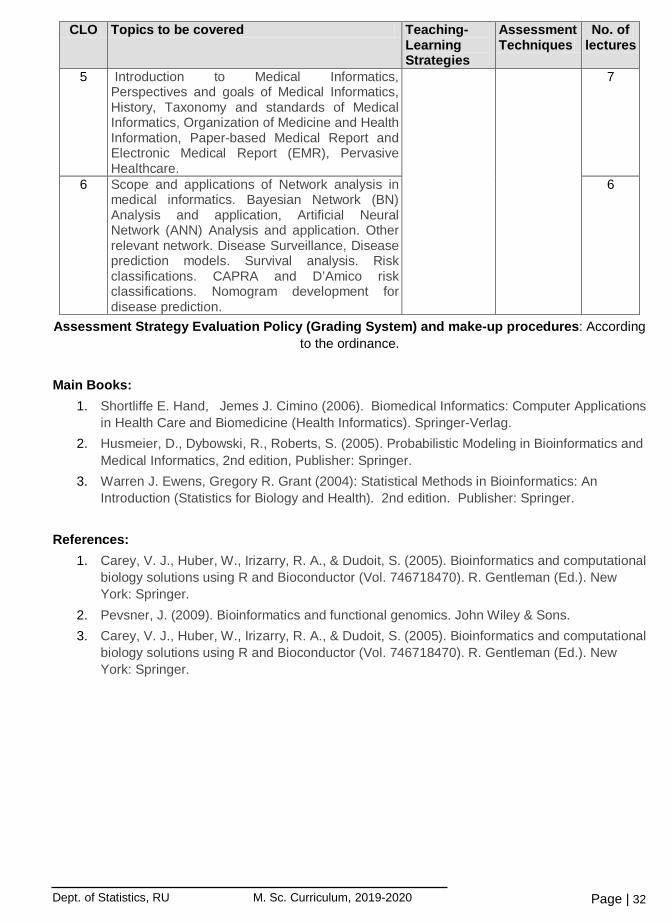
5 Introduction to Medical Informatics, Perspectives and goals of Medical Informatics, History, Taxonomy and standards of Medical Informatics, Organization of Medicine and Health Information, Paper-based Medical Report and Electronic Medical Report (EMR), Pervasive Healthcare.
7
6 Scope and applications of Network analysis in medical informatics. Bayesian Network (BN) Analysis and application, Artificial Neural Network (ANN) Analysis and application. Other relevant network. Disease Surveillance, Disease prediction models. Survival analysis. Risk classifications. CAPRA and D’Amico risk classifications. Nomogram development for disease prediction.
6
Assessment Strategy Evaluation Policy (Grading System) and make-up procedures: According to the ordinance.
Main Books:
1. Shortliffe E. Hand, Jemes J. Cimino (2006). Biomedical Informatics: Computer Applications in Health Care and Biomedicine (Health Informatics). Springer-Verlag.
2. Husmeier, D., Dybowski, R., Roberts, S. (2005). Probabilistic Modeling in Bioinformatics and Medical Informatics, 2nd edition, Publisher: Springer.
3. Warren J. Ewens, Gregory R. Grant (2004): Statistical Methods in Bioinformatics: An Introduction (Statistics for Biology and Health). 2nd edition. Publisher: Springer.
References:
1. Carey, V. J., Huber, W., Irizarry, R. A., & Dudoit, S. (2005). Bioinformatics and computational biology solutions using R and Bioconductor (Vol. 746718470). R. Gentleman (Ed.). New York: Springer.
2. Pevsner, J. (2009). Bioinformatics and functional genomics. John Wiley & Sons. 3. Carey, V. J., Huber, W., Irizarry, R. A., & Dudoit, S. (2005). Bioinformatics and computational
biology solutions using R and Bioconductor (Vol. 746718470). R. Gentleman (Ed.). New York: Springer.
Page | 32

Dept. of Statistics, RU M. Sc. Curriculum, 2019-2020
M.Stat-511: Health and Epidemiology Course Code : M.Stat-511 Course Title : Health and Epidemiology Course Type : Optional Level/Term and Section : M.Sc. Final Academic Session : 2019 - 2020 Course Instructor : Pre-requisite (If any) : B.Stat-401, B.Stat-402, B.Stat-403 and B.Stat-407 Credit Value : 3 Total Marks : 75 (Examination 60, Tutorial/Terminal 11.25, and Attendance 3.75) COURSE DESCRIPTION: The course describes the necessary knowledge and skills to critique, design and conduct human population based research, including observational studies and randomized controlled trials. More specifically, this course provides advanced knowledge of statistical analysis for epidemiological data, study design and protocol development. COURSE OBJECTIVES (CO):
1. Students will understand the epidemiology and public health. 2. Students will be able to list the functions of public health. 3. Students will outline the process of population-based health management. 4. Students will demonstrate different public health programs. 5. Students will develop the study design, sample size determination, sampling procedure, and
data analysis for health science and epidemiology.
COURSE LEARNING OUTCOMES (CLO): Upon successful completion of this course, a student will be able to
1. evaluate the design, analysis and interpretation of health science and epidemiological studies
2. describe and discuss the role and contribution of epidemiology to health 3. select, devise and develop appropriate study designs for health science and epidemiological
research 4. Conduct appropriate statistical analyses for health and epidemiological data
Page | 33

Dept. of Statistics, RU M. Sc. Curriculum, 2019-2020
COURSE PLAN / SCHEDULE:
CLO Topics to be covered Teaching-Learning Strategies
Assessment Techniques
No. of lectures
1 Introduction: Some examples of health study; Selection of health problem for research; Framing different type of study design: prospective study, retrospective study, longitudinal study, experimental study, observational study, intervention study, single blind study, double blind study; Selection of study population and cases for the study; causal variables, confounder variables; Ethical issue related to health study.
Lecturing with multi-media tools, Interactive brainstorming and Q/A session
Assignments, Class tests, Final examination
10
2 Measuring Health and Disease: Sources of health statistics. Meaning and Concept. Biological variations. Health indicators classification. Morbidity concepts and measures. Illness, diseases and their classifications. Multiple causation of diseases The conquest and resurgence of infectious diseases. The biomedical basis of chronic diseases. Measuring diseases frequency and errors in measurement. Mortality. Nutrition in Bangladesh; special emphasis on infant and child nutrition.
09
3 Statistics in Epidemiology: Categorical response data in epidemiology and diagnosis-prognosis; OR, RR, NNT, PPR, NPR, sensitivity, specificity, true positive rate, true negative rate; ROC analysis; power, precision, sample size calculation.
06
4 Statistical Models in Epidemiology: Data Analysis and interpretation using statistical models. Linear regression model; log linear models, building and applying log linear models, log linear and logit models for ordinal variables; multinomial response models. Models for mixed health hazards; multilevel sources of variation. Analysis of repeated epidemiological outcomes. Parametric and semiparametric models for complete and incomplete data in epidemiology, Cox proportional hazards model.
10
Page | 34
Dept. of Statistics, RU M. Sc. Curriculum, 2019-2020
CLO Topics to be covered Teaching-Learning Strategies
Assessment Techniques
No. of lectures
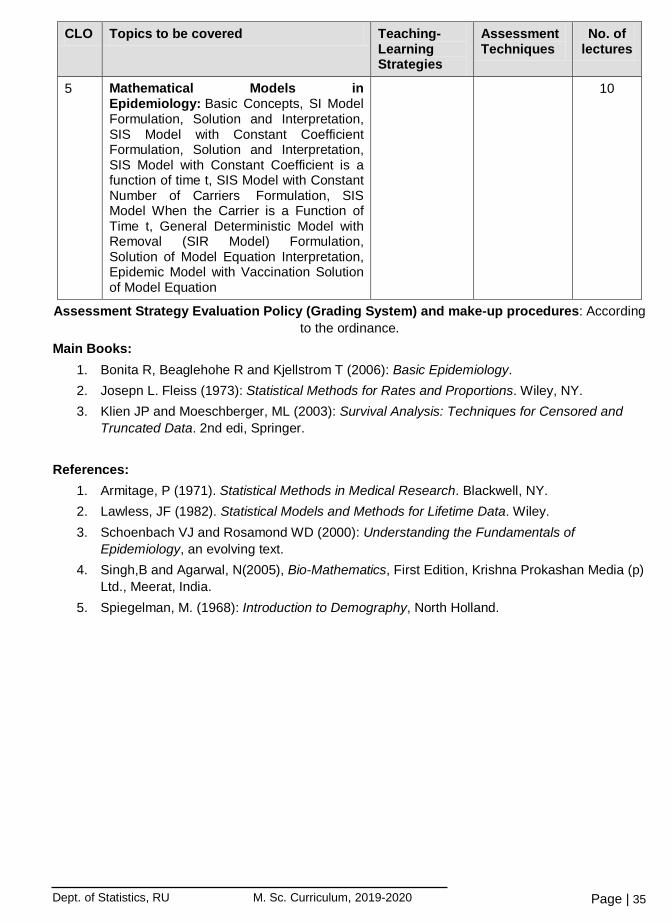
5 Mathematical Models in Epidemiology: Basic Concepts, SI Model Formulation, Solution and Interpretation, SIS Model with Constant Coefficient Formulation, Solution and Interpretation, SIS Model with Constant Coefficient is a function of time t, SIS Model with Constant Number of Carriers Formulation, SIS Model When the Carrier is a Function of Time t, General Deterministic Model with Removal (SIR Model) Formulation, Solution of Model Equation Interpretation, Epidemic Model with Vaccination Solution of Model Equation
10
Assessment Strategy Evaluation Policy (Grading System) and make-up procedures: According to the ordinance.
Main Books: 1. Bonita R, Beaglehohe R and Kjellstrom T (2006): Basic Epidemiology. 2. Josepn L. Fleiss (1973): Statistical Methods for Rates and Proportions. Wiley, NY. 3. Klien JP and Moeschberger, ML (2003): Survival Analysis: Techniques for Censored and
Truncated Data. 2nd edi, Springer. References:
1. Armitage, P (1971). Statistical Methods in Medical Research. Blackwell, NY. 2. Lawless, JF (1982). Statistical Models and Methods for Lifetime Data. Wiley. 3. Schoenbach VJ and Rosamond WD (2000): Understanding the Fundamentals of
Epidemiology, an evolving text. 4. Singh,B and Agarwal, N(2005), Bio-Mathematics, First Edition, Krishna Prokashan Media (p)
Ltd., Meerat, India. 5. Spiegelman, M. (1968): Introduction to Demography, North Holland.
Page | 35

Dept. of Statistics, RU M. Sc. Curriculum, 2019-2020
M.Stat-512: Statistical Methods in Industrial Management
COURSE OUTLINE Course Code : M.Stat-512 Course Title : Statistical Methods in Industrial Management Course Type : Optional Level/Term and Section : M.Sc. Final Academic Session : 2019 - 2020 Course Instructor : Pre-requisite (If any) : Credit Value : 3 Total Marks : 75 (Examination 60, Tutorial/Terminal 11.25, and Attendance 3.75) COURSE DESCRIPTION: This course prepares students to take on management responsibility in the middle management in private industry, the service sector or public administration. It provides a background in the principles, objectives, decision making, methods of reducing accidents, industrial psychology, quality control, inspection, supply chain management and network analysis. COURSE OBJECTIVES (CO): 1. To know the develop a strong training business management experts, engineering, and
providing theoretical instruction with an extensively . 2. To understands the management, quality, job analysis, job evaluation and factors effecting
productivity. 3. To develop concept the quality certification, Deming philosophy, project management and
project life cycle. COURSE LEARNING OUTCOMES (CLO): On successful completion of this course, a student will be able to
1. perform the management functions, drive the industrial organization chart and factors of production.
2. draw the preventive maintenance and repairable system. 3. perform the reliability centered maintenance and inventory. 4. derive the network techniques, planning, scheduling with Gantt charts
Page | 36

Dept. of Statistics, RU M. Sc. Curriculum, 2019-2020
COURSE PLAN / SCHEDULE: CLO Topics to be covered Teaching-
Learning Strategies
Assessment Techniques
No. of lectures
1 Industrial management: Meaning, Principles, Characteristics and importance. Management by objectives. Advantages and disadvantages of management by objectives. Industrial organization chart. Decision making techniques. Industrial accidents and safety. Causes of accidents. Methods of reducing accidents. Job analysis and evaluation. Methods of job analysis and evaluation. Production and productivity. Factors of production. Tools of productivity. Factors affecting productivity.
Lecturing with multi-media tools, Interactive brainstorming and Q/A session
Assignments, Class tests, Final examination
12
2 Industrial Psychology: Quality, Scope and Aims of industrial psychology, Problem of industrial psychology, Pattern of human behavior, Human needs, Difficulties and suggestion for improvement of human and social relationships.
5
3 Quality control and inspection: Objectives of quality control. Quality conformance. Quality principles. Advantages of quality control. Quality certification, Objectives of inspection. Various kinds of inspection. Advantages and disadvantages of inspection. Quality philosophies. Deming philosophy. Tools and techniques. Total quality management (TQM). Implementation of TQM, Philosophies of TQM. Pareto analysis, Cause-and-effect-diagrams. Failure modes and effect analysis (FMEA).
10
4 Corrective maintenance (CM) and preventive maintenance (PM): Preventive maintenance models for complex systems. Maintenance of repairable systems. Models for complex repairable systems. Parameter estimation. Model selection. Preventive maintenance scheduling. Reliability centered maintenance (RCM). Steps of the RCM process. Inventory. Managing and controlling inventory. Forecasting for inventory management of service parts. Supply-chain management. Case studies in industrial management and maintenance.
10
5 Network Analysis: Network Techniques. Project Management, Key decisions in project management, Project life cycles, planning and scheduling with Gantt Charts, PERT and CPM strategies, Steps in PERT and CPM project Plan. Deterministic time estimate, Probabilistic time estimate.
8
Page | 37
Dept. of Statistics, RU M. Sc. Curriculum, 2019-2020
Main Books: 1. Mukhi, H. R. (2001): Industrial Management, Satya Prakashan, New Delhi. 2. William J. Stevenson (2005): Operation Management, 8th edition, McGraw Hill Company,
N.Y. Books Recommended:
1. Davis Aquilano and Chase (2004): Fundamentals of operation Management, 4th ed., McGraw Hill Company, N.Y.
2. Hill, T. (2000): Operations Management: Strategic, Context and Managerial Analysis, University of Oxford.
3. Hiller and Hiller (2005): Introduction to Management Science, 2nd ed., McGraw Hill Company, N.Y.
4. Kelly A. and Harris, M.J. (1978): Management of Industrial Maintenance, Butterworth Heinemann Ltd.
5. Kobbacy, K.A.H and Murthy, D.N.P. (2008): Complex System Maintenance Handbook, Springer-Verlag.
6. Zipkin (2005): Fundamental of inventory Management, 1st ed., McGraw Hill Company, N.Y.
M.Stat. – 513: Statistical Methods for Reliability Data Course Code : M.Stat. - 513 Course Title : Statistical Methods for Reliability Data Course Type : Optional Level/Term and Section : M. Sc. Final Academic Session : 2019 - 2020 Course Instructor : Pre-requisite (If any) : Credit Point (CP) : 3 Total Marks : 75 (Examination 60, Tutorial 11.25, and Attendance 3.75)
COURSE DESCRIPTION: The aim of this course is to provide an analytical introduction to the core concepts of reliability and maintenance with emphasis on more advanced topics in statistical methods for reliability data and analysis of field reliability data, accelerated failure time data, degradation data, prediction reliability and software reliability modeling. COURSE OBJECTIVES (CO):
On successful completion of this course, students will be able to 1. understand a general and advanced strategies that can be used for data analysis,
modeling, and inference from reliability data. 2. critically analyze field-failure data, repairable system and recurrence data. 3. develop the capacity of modelling accelerating life tests data, degradation data. 4. comprehend maintenance and software reliability 5. analyze field reliability data
Page | 38

Dept. of Statistics, RU M. Sc. Curriculum, 2019-2020
COURSE LEARNING OUTCOMES (CLO): After successful completion of this course, a student will be able to 1. understand basic ideas behind product reliability, reasons for collecting reliability data and
distinguishing features of reliability data; 2. explain system reliability modeling, the distribution of system failure time as a function of
individual component failure-time distributions; 3. describe typical data from repairable systems and analyze recurrence data using
parametric and nonparametric graphical methods jointly. 4. present data by nonparametric and graphical methods and analyze accelerated life test
data. 5. compare degradation models and failure-time models; 6. identify failure time regression models;
COURSE PLAN / SCHEDULE:
CLO Topics to be covered Teaching-Learning Strategies
Assessment Techniques
No. of lectures
1 Reliability concepts: Basic concept of reliability. Examples and features of reliability data. Strategy for collection, modeling, and analysis of reliability data. Models for continuous failure-time processes. Models for discrete data from a continuous process.
Lecturing with multimedia projector, Interactive board and Q/A session, Group discussion, Homework, Lab work
Assignment, class tests, presentation, final exam.
3
2 Component and system reliability concepts and methods: Location-scale-based distributions - concept and applications in reliability. Probability plots. Reliability block diagram, component reliability, system reliability, reliability of series and parallel systems. Failure mode. Competing risk model. Mixture model.
4
3 Analysis of repairable system and recurrence data: Intensity function, mean cumulative function, tests for recurrence rate trend. Models for perfect repair, minimal repair and imperfect repair – derivation and estimation.
4
4 Accelerated failure time models: Accelerating variables, life-stress relationships and acceleration models. Guideline for the use of accelerating models. Non-parametric and graphical methods for presenting and analyzing accelerated life test (ALT) data. Likelihood methods for analyzing censored data from an ALT. Suggestions for drawing conclusions from ALT data. Potential pitfalls of accelerated life testing.
4
Page | 39

Dept. of Statistics, RU M. Sc. Curriculum, 2019-2020
CLO Topics to be covered Teaching-Learning Strategies
Assessment Techniques
No. of lectures
5 Degradation data, models, and data analysis: Degradation data. Models for degradation data. Estimation of model parameters. Comparison with traditional failure-time analysis. Approximate degradation analysis.
5
6 Failure time regression models: Models fitting and applications in reliability.
5
6 Software reliability modeling: Concept of software reliability. Software reliability modeling and estimation. Software testing procedures. Prediction and management of software reliability.
6
6 Prediction of reliability: Motivation and prediction problems. Naive method for computing a prediction interval. Prediction of future failures from a single group of units and from multiple groups of units with staggered entry into the field.
6
6 Maintenance: Maintenance, preventive and corrective maintenance, optimum preventive maintenance – concept and applications.
4
6 Case studies: Analysis of field reliability data.
4
Assessment Strategy Evaluation Policy (Grading System) and make-up procedures: According to the ordinance.
Main Books: 1. Meeker, W. Q. and Escobar, L. A. (1998): Statistical Methods for Reliability Data, Wiley, N.Y. 2. Nelson, W. (1990): Accelerated Testing: Statistical Models, Test Plans, and Data Analyses,
Wiley, New York. References:
1. Balakrishnan, N. and Rao, C. R. (Eds.) (2001): Handbook of Statistics, Vol. 20, Advances in Reliability, Elsevier, The Netherlands.
2. Blischke, W.R., Karim, M.R., and Murthy, D.N.P. (2011). Warranty Data Collection and Analysis, Springer-Verlag London Limited.
3. Blischke, W. R. and Murthy, D. N. P. (2000) Reliability. Wiley, New York. 4. Hamada, M. S., Alyson G. Wilson, C. Shane Reese and Harry F. Martz (2008): Bayesian
Reliability, Springer-Verlag. 5. Kobbacy, K.A.H and Murthy, D.N.P. (2008). Complex System Maintenance Handbook,
Springer-Verlag. 6. Lawless, J. F. (2003): Statistical Models and Methods for Lifetime Data, 2nd ed., Wiley, N.Y. 7. Sinha, S. K. (1986). Reliability and Life Testing, Wiley Eastern Ltd., India. 8. Tobias, P. A. and Trindade, D. C. (1995). Applied Reliability, 2nd ed., Van Nostrand
Reinhold, New York.
Page | 40

Dept. of Statistics, RU M. Sc. Curriculum, 2019-2020
M. Stat-514: Physical Health and Human Growth Modeling
Course Code : M.Stat. - 514 Course Title : Physical Health and Human Growth Modeling Course Type : Optional Level/Term and Section : M. Sc. Final Academic Session : 2019 - 2020 Course Instructor : Pre-requisite (If any) : B.Stat. – 103, 202 & 303 Credit Point (CP) : 3 Total Marks : 75 (Examination 60, Tutorial/Terminal 11.25, and Attendance 3.75)
COURSE DESCRIPTION: This course is designed to cover out the in depth knowledge on human growth process, body composition, body shape and size, different types of growth maturations, analysis of growth events, lung capacity, lung related other variables, pre-caution of growth failure, heart failure and its causes, finding risk factor of heart failure, different parametric and non-parametric growth model and higher dimensional growth model to understand and predict biological variables and adult stature.
COURSE OBJECTIVES (CO): Students would be able to
1. understand all the features of human growth, and morphometric; 2. apply longitudinal data to fit human growth model in two or higher dimensions; and 3. understand the diseases and disorder of growth process.
COURSE LEARNING OUTCOMES (CLO): After successful completion of this course, a student will be able to
1. understand the physical growth; 2. know how to develop growth chart; 3. know how to assess growth status; 4. diagnostic growth failure, heart failure and lung problems; and 5. know how to use statistics in Medical Science; 6. predict final stature of a child, and so on.
COURSE PLAN / SCHEDULE: CLO Topics to be covered Teaching-
Learning Strategies
Assessment Techniques
No. of lectures
1 & 2
Morphometry: Basic concepts, stature, weight, BMI, vital capacity, strength, sitting-height, chest circumference, Bouchard’s index. Livi’s weight-height index. Body Mass Index (BMI), Rohrer’s body build index, index of morphological equilibrium. Grid method and auxogram. Manouverier’s indexes of body build. Cormic index. Pirguet’s index of body build, Demeny’s vital index, Speh’s index, Bruugsch’s chest-stature index, Pignet’s coefficient of robusticity, Craniometry and Osteometry: Planes of orientation, cranial landmarks, craniometric indices and cranial capacity. Osteometry, index of the body, foramen and Baudoin’s sexual index vertebral index and Cunningham’s index. Measurement of sacrum and long bones. Elliptical Fourier Analysis.
Lecturing with multimedia projector, Interactive board and Q/A session
Assignment, class tests, presentation, final exam.
12
Page | 41
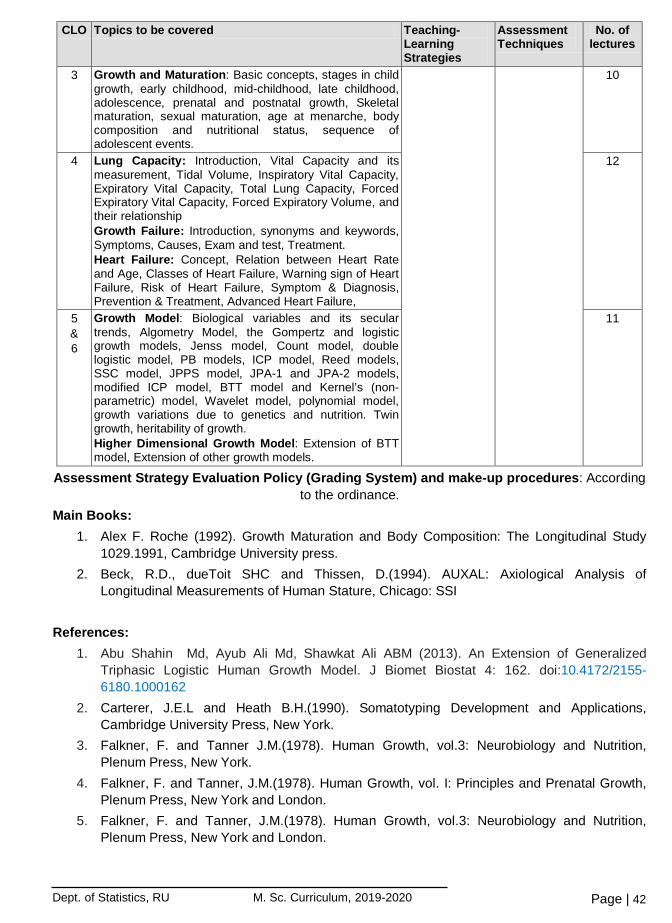
Dept. of Statistics, RU M. Sc. Curriculum, 2019-2020
CLO Topics to be covered Teaching-Learning Strategies
Assessment Techniques
No. of lectures
3 Growth and Maturation: Basic concepts, stages in child growth, early childhood, mid-childhood, late childhood, adolescence, prenatal and postnatal growth, Skeletal maturation, sexual maturation, age at menarche, body composition and nutritional status, sequence of adolescent events.
10
4
Lung Capacity: Introduction, Vital Capacity and its measurement, Tidal Volume, Inspiratory Vital Capacity, Expiratory Vital Capacity, Total Lung Capacity, Forced Expiratory Vital Capacity, Forced Expiratory Volume, and their relationship Growth Failure: Introduction, synonyms and keywords, Symptoms, Causes, Exam and test, Treatment. Heart Failure: Concept, Relation between Heart Rate and Age, Classes of Heart Failure, Warning sign of Heart Failure, Risk of Heart Failure, Symptom & Diagnosis, Prevention & Treatment, Advanced Heart Failure,
12
5 & 6
Growth Model: Biological variables and its secular trends, Algometry Model, the Gompertz and logistic growth models, Jenss model, Count model, double logistic model, PB models, ICP model, Reed models, SSC model, JPPS model, JPA-1 and JPA-2 models, modified ICP model, BTT model and Kernel’s (non-parametric) model, Wavelet model, polynomial model, growth variations due to genetics and nutrition. Twin growth, heritability of growth. Higher Dimensional Growth Model: Extension of BTT model, Extension of other growth models.
11
Assessment Strategy Evaluation Policy (Grading System) and make-up procedures: According to the ordinance.
Main Books: 1. Alex F. Roche (1992). Growth Maturation and Body Composition: The Longitudinal Study
1029.1991, Cambridge University press. 2. Beck, R.D., dueToit SHC and Thissen, D.(1994). AUXAL: Axiological Analysis of
Longitudinal Measurements of Human Stature, Chicago: SSI References:
1. Abu Shahin Md, Ayub Ali Md, Shawkat Ali ABM (2013). An Extension of Generalized Triphasic Logistic Human Growth Model. J Biomet Biostat 4: 162. doi:10.4172/2155-6180.1000162
2. Carterer, J.E.L and Heath B.H.(1990). Somatotyping Development and Applications, Cambridge University Press, New York.
3. Falkner, F. and Tanner J.M.(1978). Human Growth, vol.3: Neurobiology and Nutrition, Plenum Press, New York.
4. Falkner, F. and Tanner, J.M.(1978). Human Growth, vol. I: Principles and Prenatal Growth, Plenum Press, New York and London.
5. Falkner, F. and Tanner, J.M.(1978). Human Growth, vol.3: Neurobiology and Nutrition, Plenum Press, New York and London.
Page | 42

Dept. of Statistics, RU M. Sc. Curriculum, 2019-2020
6. Fleiss, J.L.(1981). Statistical Methods for Rates and Proportions, Second Edition, John Wiley and Sons. N.Y.
7. Hastic, T.,Tibshirani ,T., and Friedman,J.(2000). The Element of Statistical Learning: Data Mining Inference and Prediction, Springer, New York
8. Johnston, F.E, Roche, A.F. and Susanne, C. (1980). Human Physical Growth and Maturation Methodologies and Factors, Plenum Press, New York.
M.Stat-515: Advanced Stochastic Modeling
Course Code : M.Stat-515 Course Title : Advanced Stochastic Modeling Course Type : Optional Level/Term and Section : M.Sc. Final Academic Session : 2019 - 2020 Course Instructor : Pre-requisite (If any) : B.Stat-305 Credit Value : 3 Total Marks : 75 (Examination 60, Tutorial/Terminal 11.25, and Attendance 3.75) COURSE DESCRIPTION: The course is designed on advanced probability to cater to the needs of students and to the non-specialists. It would be suitable for research level courses in statistics. Uncertainties arises in several ways in different aspects of growth processes and also due to the involvement of unpredictable human behavior, a brief description of stochastic processes and stochastic differential equation in terms of which different models have been incorporated. COURSE OBJECTIVES (CO):
1. Students will understand the self-contained modules of concepts and notations. 2. Students will able to differentiate the deterministic and non-deterministic models. 3. Students will understand all features of stochastic epidemic processes and queue
processes. 4. Students will develop maturity on stationary processes and time series.
COURSE LEARNING OUTCOMES (CLO): Upon successful completion of this course, a student will be able to
1. Know when it is appropriate to use the properties of generating functions in different processes.
2. Know how the renewal theory and arguments have often been advanced in a variety of situations, such as demography, manpower studies, reliability, replacement and maintenance.
3. Create interest in the application of probability theory, concerned with objects or individuals that can generate objects of similar kinds, such as human beings, animals, genes, bacteria, and also neutrons which yield new neutrons under a nuclear chain.
Page | 43

Dept. of Statistics, RU M. Sc. Curriculum, 2019-2020
COURSE PLAN / SCHEDULE: CLO Topics to be covered Teaching-
Learning Strategies
Assessment Techniques
No. of lectures
1 Review of Stochastic Process and Markov Models: Definition, state space and parameters of stochastic process. Markov process, Markov Chain, Poisson Process, Birth and death process, Illness-Death Process, Branching process, Renewal Process and Queuing Process, Application of Markov Model and MCMC. Stochastic Epidemic Process: The random variable technique and its application. Simple epidemic model, General epidemic model, Carrier borne epidemic model. Kermack and McKendrick’s model, Daley and Kendall’s Model. Stochastic Process of Clinical Drug Trials. Two armed bandit model, the Winner sampling model, the Optimum allocation model.
Lecturing with multi-media tools, Interactive brainstorming and Q/A session
Assignments, Class tests, Final examination
18
2 Models for Social and Occupational Mobility: Introduction, Models for social mobility, Models for occupational mobility. Markov Models for Educational and Manpower Systems: A model for system with given Input. A model for an expanding system with given size.
5
3 Continuous Time Models for Stratified Social Systems: Some basic theory of Markov Processes. A manpower system with given Input. A Manpower system with given growth rate. Systems with given Input and loss rate depending on length of service. Hierarchical systems with given input and promotion rates depending on seniority. Fix and Neyman Model. Stochastic Models of Reproductive Process: Dandekar’s Modified binomial and Poisson model, Brass model, Singh’s modified model, Model of waiting times of conception Sheps and Perrin model of reproductive process.
10
4 Stochastic Process in Genetics: Introduction, Physical basis of heredity. Genotypes under random mating, Herdy Weinberg law, Mating under various types of selection. Autosomal inheritance, Sex-linked inheritance, Change of gene frequencies, Homozygosity under random mating.
6
5 Stochastic Process in Queueing and Reliability: General concept, steady state and transient behavior of M/M/I models, Birth and death process, Multichannel models, Network of Markovian queueing system, GI/M/I and M/G (a,b)/I Models.
6
Assessment Strategy Evaluation Policy (Grading System) and make-up procedures: According to the ordinance.
Page | 44

Dept. of Statistics, RU M. Sc. Curriculum, 2019-2020
Main Books: 1. Bartholomew, D.J.(1973): Stochastic Models for Social Processes, 2nd ed. John Wiley and
Sons. 2. Biswas, S.(2004): Applied Stochastic Process, New Central Book Agency (P) Ltd., Kolkata,
India. 3. Medhi, J. (1994): Stochastic Process, Wiley Eastern Ltd., New Delhi, India.
References: 1. Anderson, T.W. (1971): The Statistical Analysis of Time Series, Wiley, N.Y. 2. Cryer, J. D. and K. Chan (2008): Time Series Analysis: with applications in R, 2nd Ed.,
Spinger, N.Y. 3. Elandt Johnson, R.C.(1971): Probability Models and Statistical Methods in Genetics, John
Wiley, N.Y. 4. Lűtkepohl, H. (2005): New Introduction to multiple Time Series Analysis, Springer, N.Y. 5. Tan Wai-Yuan(1991: Stochastic Process of Carcionogenesis, Marcel Dekker,
M.Stat-516: Advanced Biostatistics
Course Code : M.Stat-516
Course Title : Advanced Biostatistics
Course Type : Optional
Level/Term and Section
: M.Sc. Final
Academic Session : 2019-2020
Course Instructor :
Pre-requisite(If any) : B.Stat-404
Credit Value : 3
Total Marks : 75 (Examination 60, In-Course/Tutorial/Terminal 11.25 and Attendance 3.75)
COURSE DESCRIPTION: This course deals with survival analysis, clinical trials and accelerated life testing (ALT) model. Estimations, tests and confidence intervals for survival probability, median survival time and hazard ratio are included in the survival analysis. Clinical trial includes the topics related to the invention of a new drugs/treatment. ALT model deals with ALT data to estimate the lifetime distribution under used stress (Temperature, Voltage, Cycle, Load etc.) level.
COURSE OBJECTIVES (CO): 1. Students will be able to estimate survival times for a group of patients. 2. Students will be in a position to compare survival time of patients between two or more
groups. 3. Students will be able to assess the relationship of covariates to survival time. 4. Students will understand to determine whether new drugs or treatments are both safe and
effective by analyzing data obtained from clinical trials. 5. Students will be able to know the quality of high reliable products based on the analysis of
accelerated life testing industrial data.
Page | 45

Dept. of Statistics, RU M. Sc. Curriculum, 2019-2020
COURSE OUTCOME(CO): After completing the course the students
1. will be in a position to estimate the survival probability of a patient for a particular time and also to compare survival times of the patients between two or more groups.
2. will be able to assess the relationship between the covariates and survival times 3. will gain knowledge to analyze clinical trial data for the invention of a new drugs which is
safe and effective 4. will be able to involve themselves in an industry and suggest them for the improvement of
the quality of their products by analyzing their data. 5. will be able to estimate the multivariate life distribution for the real situation.
COURSE PLAN/SCHEDULE:
CLO Topics to be covered Teaching-Learning Strategies
Assessment Techniques
No. of lectures
1 Basic Concept: Survival data. Different distribution of survival data and their characteristics. Survival function, hazard function and their interrelationships. Parametric and nonparametric estimation of survival function.
Lecturing with multi-media tools, Interactive brainstorming and Q/A session
Assignments, Class tests, Final examination
7
2 Parametric Regression Models: Introduction. Inclusion of strata. Specifying a Distributions. Residuals. Residual analysis and other model checks. Predicted values. Fitting the Model. Exponential, Weibull, Normal, Lognormal and Gamma regression models. Interval estimation of the parameters and quantiles. Applications of parametric regression models.
8
1, 2 Proportional Hazards Models: Introduction. Hypothesis test. Stratified and Penalized Cox models. Residual analysis. Partial likelihood. Applications of proportional hazards model. Estimation of hazard ratio. Comparison of two or more survival functions.
6
1, 2 Extension of the Cox PH Model: Definition and examples of time-dependent variables, extended Cox model for time-dependent variables, hazard ratio for extended cox model, assessing time-dependent variables that do not satisfy PH assumption, extended cox likelihood. Application of the extended Cox model.
6
3 Clinical Trials: Basic concepts of clinical trials. Controlled and uncontrolled clinical trials, historical controls, protocol, placebo, randomization, blind and double blind trials, ethical issues, protocol deviations, volunteer bias. Simple comparative trials, Cross-over trials, size of trials, meta analysis, interim analysis, multi-centre trials, combining trials.
6
Page | 46

Dept. of Statistics, RU M. Sc. Curriculum, 2019-2020
CLO Topics to be covered Teaching-Learning Strategies
Assessment Techniques
No. of lectures
4 Accelerated life testing models: Accelerating variables, different types of life-stress relationships. Constant-stress and step-stress accelerated test models. Different methods for representing and analyzing accelerated life test (ALT) data based on different sampling schemes. Application of accelerated life testing models.
6
5 Multivariate lifetime models: Multivariate lifetime distributions and their characteristics, parametric and nonparametric estimation of multivariate lifetime distribution, models with multiple failure modes.
6
Assessment Strategy, Evaluation Policy (Grading System) and make-up procedures: According to the ordinance.
Main Books: 1. Kleinbum, D.G and Klein, M(2012 ): Survival Analysis; A self-learning Text, Third edition,
Springer . 2. Lawless, J.F.(2003): Statistical Models and Methods for Lifetime Data, John Wiley and Sons,
N.Y. 3. Fleiss, J.L, Levin, B and Paik, M.C.(2003): Statistical Methods for Rates and Proportions,
Third edition, John Wiley & Sons.
References: 1. Bain, L.J. and Engelhardt, M. (1991): Statistical Analysis of Reliability and Life Testing
Models, Theory and Methods, 2nd ed., Marcel Dekker, New York. 2. Bland, J.M.(1995): An Introduction to Medical Statistics, Second Edition, Oxford University
Press. 3. Balakrishnan, N.(Ed.)(1995): Recent Advances in Life – Testing and Reliability, CRC Press,
Boca Raton, FL. 4. Nelson, W.(1990): Accelerated Testing: Statistical Models, Test Plans and Data Analyses,
John Wiley and Sons, N.Y. 5. Johnson RCE & Johnson (1980): Survival Models and Data Analysis, Wiley NL & Sons, NY.
M-Stat. – 517: Research Planning, Monitoring and Evaluation
Course Code : M-Stat. - 517 Course Title : Research Planning, Monitoring and Evaluation Course Type : Optional Level/Term and Section : M. Sc. Final Academic Session : 2019 - 2020 Course Instructor : Pre-requisite (If any) : Credit Point (CP) : 3 Total Marks : 75 (Examination 60, Tutorial/Terminal 11.25, and Attendance 3.75)
Page | 47

Dept. of Statistics, RU M. Sc. Curriculum, 2019-2020
COURSE DESCRIPTION: This course gives the fundamental concepts of research methods, research proposal, research report and related materials. Student will gather concepts of research performance monitoring and evaluation system. Student will also earn necessary expertise to conduct a project planning, monitoring, evaluation and reporting. There is a particular focus on the contribution of statistical methods in both the design and analysis of such studies. COURSE OBJECTIVES (CO): Students would be able to:
1. develop research plan and capable to conduct a scientific research; 2. elaborate a methodology to monitor the development of the research; 3. clearly state what are the milestones of the research and what are the final outputs.
COURSE LEARNING OUTCOMES (CLO): After successful completion of this course, a student will be able to:
1. define research terminology and identify the elements and steps of an M&E plan 2. identify M&E roles and responsibilities 3. create an analysis plan and reporting templates
COURSE PLAN/SCHEDULE: CLO Topics to be covered Teaching-
Learning Strategies
Assessment Techniques
No. of lectures
1 Introduction: Designs for program evaluation and principle. Research, data analysis techniques and reporting, Developing a M & E system, Developing a terms of reference and responding to proposals. Data sources and research methods, Performance monitoring, Theoretical framework, Statistical methods used in the analysis of data devised from such designs, in particular for the estimation and test of hypothesis.
Lecturing with multimedia projector, Interactive board and Q/A session
Assignment, class tests, presentation, final exam.
12
2 Monitoring and Evaluation: Basic concept, Opportunities and Barriers, Purpose and benefits of planning, monitoring and evaluation. Introduction to the Logical Framework Approach (LFA), Steps of the LFA: Stakeholder analysis, Problem analysis, Objectives analysis, Alternatives analysis, Identification of indicators and means of verification, Identification of assumptions and risks, Setting baselines and targets, Theory of Change, How to produce a plan of action. Key concepts and approaches in evaluations (including effectiveness, efficiency, impact, relevance and sustainability). Development practitioners, project leaders and decision makers responsible for designing, implementing, monitoring or evaluating development projects. Collecting, Analyzing, and Using Monitoring Data, Key Elements of M & E Work Plan, Comprehensive Monitoring and Evaluation Framework.
18
Page | 48
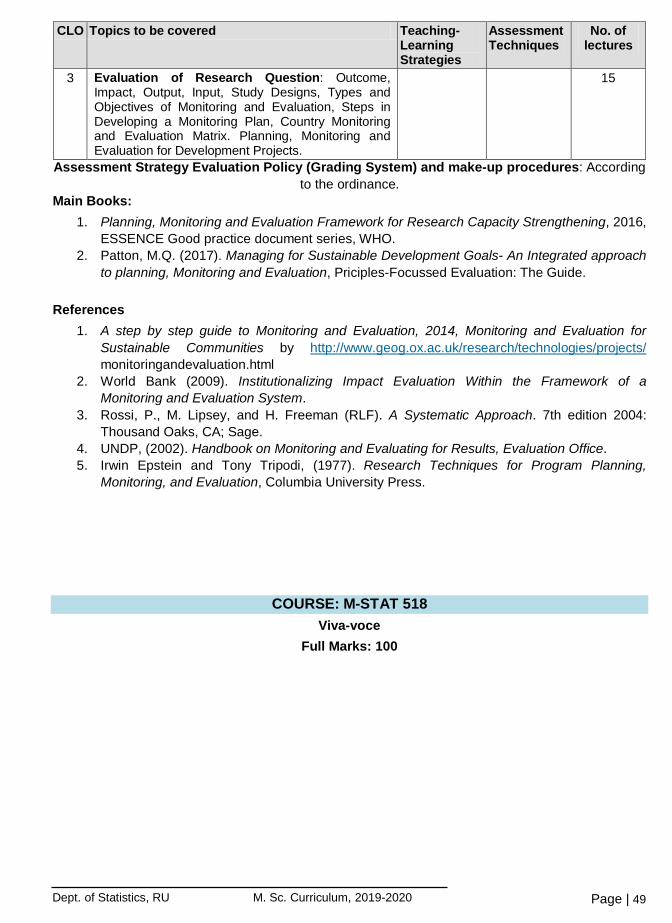
Dept. of Statistics, RU M. Sc. Curriculum, 2019-2020
CLO Topics to be covered Teaching-Learning Strategies
Assessment Techniques
No. of lectures
3 Evaluation of Research Question: Outcome, Impact, Output, Input, Study Designs, Types and Objectives of Monitoring and Evaluation, Steps in Developing a Monitoring Plan, Country Monitoring and Evaluation Matrix. Planning, Monitoring and Evaluation for Development Projects.
15
Assessment Strategy Evaluation Policy (Grading System) and make-up procedures: According to the ordinance.
Main Books: 1. Planning, Monitoring and Evaluation Framework for Research Capacity Strengthening, 2016,
ESSENCE Good practice document series, WHO. 2. Patton, M.Q. (2017). Managing for Sustainable Development Goals- An Integrated approach
to planning, Monitoring and Evaluation, Priciples-Focussed Evaluation: The Guide. References
1. A step by step guide to Monitoring and Evaluation, 2014, Monitoring and Evaluation for Sustainable Communities by http://www.geog.ox.ac.uk/research/technologies/projects/ monitoringandevaluation.html
2. World Bank (2009). Institutionalizing Impact Evaluation Within the Framework of a Monitoring and Evaluation System.
3. Rossi, P., M. Lipsey, and H. Freeman (RLF). A Systematic Approach. 7th edition 2004: Thousand Oaks, CA; Sage.
4. UNDP, (2002). Handbook on Monitoring and Evaluating for Results, Evaluation Office. 5. Irwin Epstein and Tony Tripodi, (1977). Research Techniques for Program Planning,
Monitoring, and Evaluation, Columbia University Press.
COURSE: M-STAT 518 Viva-voce
Full Marks: 100
Page | 49

Dept. of Statistics, RU M. Sc. Curriculum, 2019-2020
COURSE M-STAT 519 Practical: 8 Sessions (For General Group)
Full Marks: 200 (Practical examination140 marks and continuous assessment 60 marks)
Session-I : Advanced Statistical Inference 1. Box plots and its various in interpretations and outlier detection. 2. cdf estimation and quantile estimation. 3. Density estimation. 4. Robust estimation of univariate location and scale parameter. 5. Huber's M-estimation of location and Scale parameter 6. Variance estimation by Jackknife, bootstrap and influence function. 7. Robust estimation of multivariate location and scatter matrix. 8. Data manipulation and various graphs
9. Estimation of SE of r and b1 by non-parametric and parametric bootstrap and jackknifing 10. Different bootstrap CI of r and b1 11. MPT 12. UMPT 13. SRT 14. MPSRT 15. UMPSRT 16. Asymptotic efficiency of the above tests 17. Sequential test 18. OC and ASN function 19. Construction of decoction regions 20. Tests of 2x2 contingency table. 21. ARE of Mann- Whitney test and sign test. 22. Kruskal-Wallis test 23. Square rank test for variances. 24. Friedman test 25. Permutation test and bootstrap test of equality of two means 26. Fitting regression models by bootstrapping 27. Different density estimators of univariate data
Session-II: Advanced Experimental Design 1. Analysis of data using two way and three way classification with equal and unequal number of
observations per cell. 2. Analysis of data using non-orthogonal model. 3. Arrange the data in BIBD, PBIBD and Youden design. Also analyze the data using such designs. 4. Estimate and test the data using intra-block and inter-block BIBD model.
Page | 50
Dept. of Statistics, RU M. Sc. Curriculum, 2019-2020
5. Analyze the data using Split plot and Split-split plot design.
6. Analyze factorial experiment of levels 2, 3 and 5 with different factors. Construct plans of 21𝑛, 3
1𝑛
and 51𝑛 replicate of such experiments and analyze the data using RBD and LSD model. Also
study confounding, defining contrast and aliases. 7. Covariance analysis of one way and two way classified data with two concomitant variables. 8. Analyze lattice design/Balanced lattice design/Partially balanced lattice design with different
replications. 9. Construct the methods of estimation and analyzing procedure of one pan and two pan weighing
design. 10. Develop the method of estimating variance using one/two pan weighing design from BIBD.
Check the properties. 11. Develop the estimating and analyzing procedure using MANOVA. Develop test procedure
Omnibus MANOVA tests and other important methods. Interpretation the results of MANOVA.
Session-III: Advanced Multivariate Analysis 1. Fit the multivariate straight-line regression model and test the goodness of fit. 2. Apply CA and MCA for categorical data analysis. 3. Apply CA and MCA for mixed tables of metric and categorical data analysis. 4. Fit the multivariate normal and t mixture models by estimating the parameters using EM
algorithm. 5. Find the clusters from a given datasets. 6. Compute Bayesian prediction using multivariate regression model. 7. Perform factor analysis of multivariate data using Bayesian approach. Recover source signals
(original signals) from the mixed signals using Bayesian approach. Mixture of artificial signals, natural image and audio signals with Gaussian noise can be considered as the mixture dataset
Session – IV Time Series Analysis and Forecasting 1. Single time series: Checking Time series properties, Tests for order of integration. Spectral
representation, Fitting an appropriate ARIMA model. Diagnostic and Stability, Checking and Forecasting.
2. Multivariate time series: Tests for cointegration and spurious correlation. Fitting different VAR and VEC models. Tests for Granger causality, Estimation of impulse responses functions. Decompositionof forecast error variance.
3. Stylized facts of time series: Test for ARCH effect, Modeling and forecasting volatility. Detection of structural breaks.
Session – V: Data Mining 1. Exploring Categorical and Numerical Variables. 2. k-nearest neighbor algorithm for estimation and prediction. 3. Classifying Credit risk using decision trees. 4. Neural network model for classification. 5. Clustering by Kohonen Networks.
Page | 51

Dept. of Statistics, RU M. Sc. Curriculum, 2019-2020
Session – VI: Genomics and Bioinformatics
1. DNA sequence data Analysis using BLAST / PYTHON. 2. Phylogenetic Analysis of DNA sequence data using R/BLAST /PYTHON 3. QTL data analysis using R 4. Gene-expression data analysis using R. 5. GWAS/SNPs data analysis using R. 6. Microbial sequence analysis using online/offline software.
Advanced Demography
1. Construction of multiple decrement life tables 2. Estimation of fertility and mortality by indirect techniques 3. Estimation of completeness of registration and survey data by Chandra-Sekar and Deming
method 4. Estimation of nuptiality parameters of nuptiality model 5. Estimation of Cole's indices 6. Gradution of net maternity function by Normal, Wicksell and Hadwiger curve 7. Problems related to population projection 8. Problems related to fecundability 9. Estimation of proximate determinants of fertility and inhibiting effects of marriage and divorce
Environmental Statistics
Experiments based on Statistical methods and computer applications
1. Use of computer program R, Mathlab for analysis of environmental data. 2. Regression analysis, trend analysis, error analysis and application of statistical tests in
environmental problems. 3. Fitting of polynomials to environmental data. 4. Use of Chi-square, F-test and t- test. 5. Principle component analysis of environmental variable. 6. Determine drought index and SPI by using Markov chain model using R. 7. Study of non-linear and non-stochastic time series analysis of environment data by using
Matlab. 8. Study of Wavelets analysis and Spectral analysis of environment data by using Matlab. 9. Study of geo-statistical modeling analysis, spatio-temporal modeling, Extreme value modeling
by using GIS. Advanced Actuarial Statistics
1. Survival distributions and life tables. 2. Life annuities, Net premium, Premium series. 3. Multiple life functions.
Page | 52
Dept. of Statistics, RU M. Sc. Curriculum, 2019-2020
4. Multiple decrement models. 5. Pension plans, the expense function and dividends. 6. Measurement of risk and Mortality Table: Construction of mortality tables. 7. Premium calculation of various life policies. 8. Techniques of calculating exposures form individual records including consideration involving
selection of studies, various observation periods and various methods of tabulating deaths. 9. Techniques of calculating exposures from variation schedules including the general concepts
of fiscal year. 10. The use of interim schedules and variations in observation period or method of grouping
deaths and construction of actuarial tables.
Session – VII Proteomics and Biomedical Informatics
1. Protein sequencing analysis using BLAST / PYTHON / PERL. 2. Protein classification using supervised and unsupervised statistical algorithms. 3. Phylogenetic Analysis of Protein Sequencing using R. 4. Metabolomics data analysis using R/MATLAB. 5. Bayesian network (BN) analysis, Nomogram construction and disease prediction.
Health and Epidemiology
1. To fiend the growth over time by using algometric growth and other suitable models. 2. To detect the factors which directly and indirectly influence on health by using statistical tools. 3. Estimation of relative risk and odds ratio. 4. To solve the care management problem using by linear programming methods (graphical and
simplex) 5. Statistical models to control extraneous factors : Linear regression, Log-linear regression,
Logistic regression, Poisson regression and Negative Binomial regression 6. Epidemiological and health hazards models. 7. Using output of any appropriate statistical analysis (Using any statistical package/software)
interpretation of causal variables and confounder variables, and cases of the study. 8. Calculation of OR, RR, NNT, PPR, NPR, sensitivity, specificity, true positive rate, true
negative rate, ROC with 95% CI using raw data and their interpretation 9. Calculation of sample size with respect to various problem (regarding power and precision)
10. Fitting and interpretation of linear model, logistic model, multinomial model. 11. Analysis of repeated measure. 12. Analyzing parametric models and cox proportional hazards model.
Statistical Methods in Industrial Management
1. Economic order quantity 2. Order Cycle and order size 3. Optimal quantity 4. Optimal order quantity 5. Total annual cost
Page | 53
Dept. of Statistics, RU M. Sc. Curriculum, 2019-2020
6. Quantity discounts 7. Constructing Networks 8. Draw a precedence diagram using AOA 9. Critical path 10. Determine an optimum crashing plan 11. Deterministic time estimates 12. Probabilistic time estimates 13. Compute slak times 14. Gantt chart
Statistical Methods for Reliability Data
1. Distribution ID plot and overview plot. 2. Parametric and nonparametric distribution analysis. Life data event plot, probability plots and
parametric ML fit. 3. Selection of a suitable model from a set of competitive models for reliability data. 4. Multiple failure mode data analysis: individual and combined modes. 5. Accelerated life test models analysis. 6. Parametric regression model fit with censored product reliability data. 7. Recurrence (point process) data analysis. 8. Warranty claims data and warranty cost modeling. 9. Degradation data modeling and analysis. 10. Case studies with real product reliability data.
Session – VIII
Physical Health and Human Growth Modeling 1. Morphological indices 2. Differential indices of body building 3. Craniometric indices, detection of Cranial landmarks. 4. Extraction of growth parameters 5. Fitting of growth models: Models described in M-Stat 508
Advanced Stochastic Modeling
1. Study of simple epidemic models. 2. Analysis of Kermack and McKendrick’s epidemic model. 3. Study of Daley and Kendall’s epidemic model. 4. Study of Optimum allocation model in clinical drug trials. 5. Study of Robbins model 6. Study of Hardy Weinberg law of heredity 7. Analysis of M/M/1 Queuing models 8. Analysis of multi cannel Queuing models 9. Study of Network models. 10. Study of models of waiting times of conceptions-Sheps and Perrion model of reproductive
process.
Page | 54
Dept. of Statistics, RU M. Sc. Curriculum, 2019-2020
Advanced Biostatistics 1. Non-parametric estimation of survival and hazard functions with standard errors and confidence
intervals. 2. Fitting of parametric survival distributions under different types of censored data. 3. Comparison of two and/or more than two survival curves. 4. Check of proportional hazard assumptions. Cox proportional hazard model analysis. 5. Fitting of parametric regression models and tests of fit.
Research, Planning, Monitoring and Evaluation Assigned by course tutor
COURSE: M-STAT 520 (Thesis Group) Written Thesis Full Marks: 100
COURSE: M-STAT 521 (Thesis Group) In-plant Training Full Marks: 50
To complete in-plant training, students must have to submit a report on a specific topic designed by
the examination committee.
COURSE: M-STAT 522 (Thesis Group) Thesis Defense Full Marks: 50
Page | 55
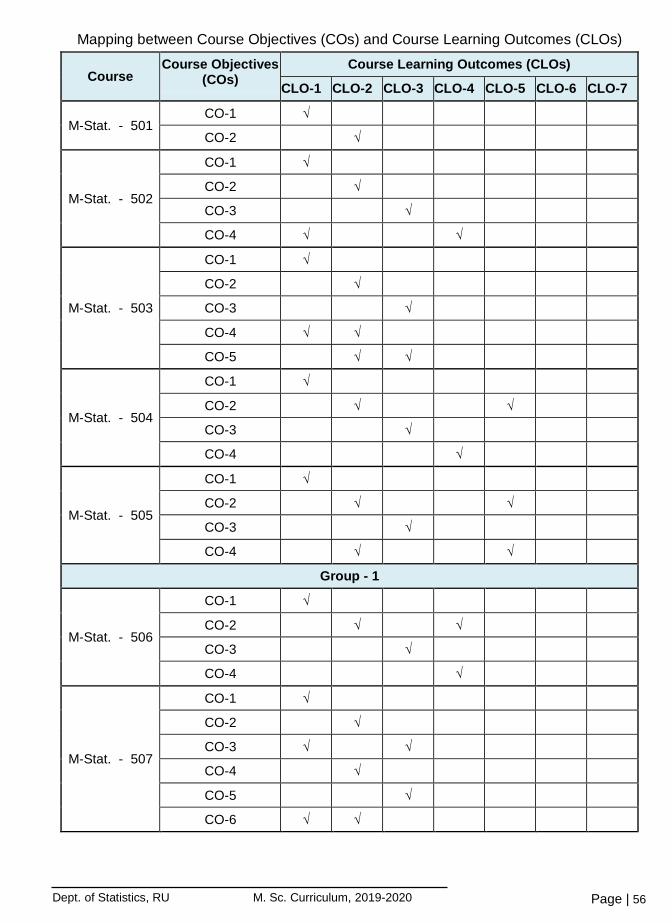
Dept. of Statistics, RU M. Sc. Curriculum, 2019-2020
Mapping between Course Objectives (COs) and Course Learning Outcomes (CLOs)
Course Course Objectives
(COs) Course Learning Outcomes (CLOs)
CLO-1 CLO-2 CLO-3 CLO-4 CLO-5 CLO-6 CLO-7
M-Stat. - 501 CO-1 √
CO-2 √
M-Stat. - 502
CO-1 √
CO-2 √
CO-3 √
CO-4 √ √
M-Stat. - 503
CO-1 √
CO-2 √
CO-3 √
CO-4 √ √
CO-5 √ √
M-Stat. - 504
CO-1 √
CO-2 √ √
CO-3 √
CO-4 √
M-Stat. - 505
CO-1 √
CO-2 √ √
CO-3 √
CO-4 √ √
Group - 1
M-Stat. - 506
CO-1 √
CO-2 √ √
CO-3 √
CO-4 √
M-Stat. - 507
CO-1 √
CO-2 √
CO-3 √ √
CO-4 √
CO-5 √
CO-6 √ √
Page | 56

Dept. of Statistics, RU M. Sc. Curriculum, 2019-2020
Course Course Objectives
(COs) Course Learning Outcomes (CLOs)
CLO-1 CLO-2 CLO-3 CLO-4 CLO-5 CLO-6 CLO-7
M-Stat. - 508
CO-1 √
CO-2 √ √
CO-3 √
M-Stat. - 509
CO-1 √
CO-2 √ √
CO-3 √
CO-4 √ √
Group - 2
M-Stat. - 510
CO-1 √
CO-2 √ √
CO-3 √
CO-4 √ √
CO-5 √ √
M-Stat. - 511
CO-1 √
CO-2 √
CO-3 √ √
CO-4 √
CO-5 √ √
M-Stat. - 512
CO-1 √
CO-2 √ √
CO-3 √
M-Stat. - 513
CO-1 √ √
CO-2 √
CO-3 √ √
CO-4 √
CO-5 √ √
Group - 3
M-Stat. - 514
CO-1 √ √
CO-2 √
CO-3 √
Page | 57

Dept. of Statistics, RU M. Sc. Curriculum, 2019-2020
Course Course Objectives
(COs) Course Learning Outcomes (CLOs)
CLO-1 CLO-2 CLO-3 CLO-4 CLO-5 CLO-6 CLO-7
M-Stat. - 515
CO-1 √
CO-2 √
CO-3 √ √
CO-4 √
M-Stat. - 516
CO-1 √
CO-2 √ √
CO-3 √
CO-4 √
CO-5 √ √
M-Stat. - 517
CO-1 √
CO-2 √
CO-3 √
Page | 58


