8 ISER Working Paper Series Wage Mobility In Times Of Higher Earnings Disparities: Is It Easier To Climb The Ladder? Iga Magda Warsaw School of Economics and Ministry of Labour and Social Policy, Poland No. 2008-10 March 2008 www.iser.essex.ac.uk
Transcript
8
ISER W
orking Paper S
eries
Wage Mobility In Times Of Higher Earnings Disparities: Is It Easier To Climb The Ladder?
Iga Magda
Warsaw School of Economics and Ministry of Labour and Social Policy, Poland
No. 2008-10 March 2008
ww
w.iser.essex.ac.uk
Non-technical summary
A worker may see his earnings rise, though that can result in di¤erent
outcomes in terms of his or her relative position among other employees which
may improve, worsen or remain unchanged. The main aim of this paper is
to analyze what chances individuals have of changing their status within the
wage hierarchy, how do these chances vary over time, across countries and
among di¤erent workers.
I study the evolution of Polish workers�individual earnings over time in
the 1995 -2006 period. I �nd that they are less likely to change their relative
position (compared to the other workers�wages) than they were in the mid
nineties, though these chances have been increasing back in the last few years.
Men in Poland are more likely to improve their rank in the wage hierarchy
than women, though a decade ago women were better o¤ in this respect.
For comparison I analyze the UK case, �nding that although workers in
the two countries have similar chances of changing their relative earnings
position, di¤erences in such mobility patterns stand out. British employees
are much less likely to move down in the wage rankings whereas Polish work-
ers have higher probability of large changes in their position in the earning
ladder.
The analysis shows also that the low wage workers have rather high
chances of improving their relative position among other employees. They
are however (particularly in Poland) more likely to exit employment, and the
majority of those entering the labour market take up low paid jobs.
Finally, the study demonstrates that in Poland the changes in the proba-
bility of moving up or down in the earnings ranking do not seem to be linked
to the evolution in the overall wage dispersion.
Wage mobility in times of higher earnings disparities:
is it easier to climb the ladder? �
Iga Magda y
March 12, 2008
Abstract
In this paper I study the earnings mobility in Poland and in the UK. Using both
transition matrices and a wage mobility index I �rst document changes in the overall
wage mobility in Poland across time, then compare mobility patterns among Polish
and British employees. I focus in particular on low wage workers and analyze their
transitions within the earnings distribution and between di¤erent labour market
states. Finally, I demonstrate that changes in the earnings mobility in Poland do
not seem to be linked to changes in the overall wage dispersion.
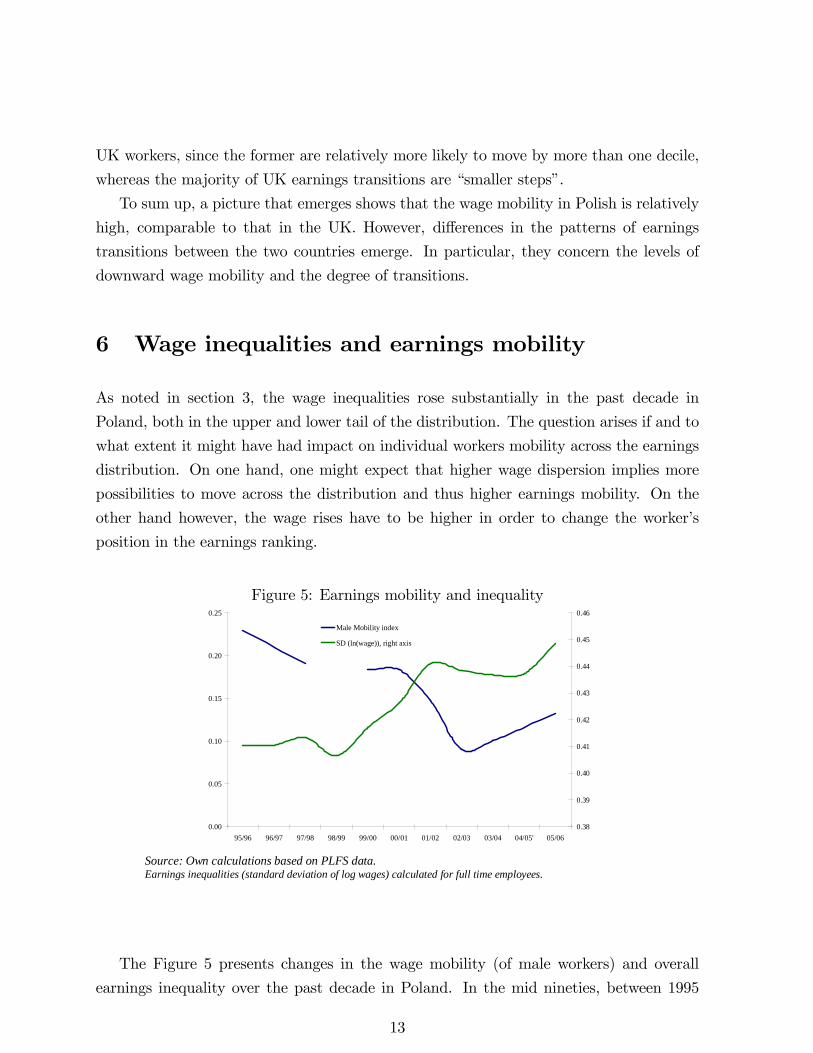
The last years saw a considerable rise in cross sectional wage inequalities in Poland, yet
it is not known if and how has it changed the individuals earnings mobility. Changes
in the cross sectional earnings disparities may �but do not have to � imply changing
mobility patterns. Burkhauser et. al (1997) notice that the observed changes in the cross-
sectional distribution may be the consequence of changes in the relative labour earnings of
workers, or in the pattern of earnings mobility for workers, or some combination of both.
If the rise in Polish wage inequality, presented in section 3, has come from increased
transitory �uctuations in earnings whereas the individuals face higher wage mobility,
the consequences and implications for social and labour market policy are of a lesser
importance. If however the wage mobility remained the same or decreased consequences
are more serious since lifetme earnings become more unevenly distributed as well.
The question of how much mobility there is in the wage distribution in Poland has
not been researched so far. One of the reasons for that is the scarcity of data availability,
especially panel survey of individuals, which would include labour income data.
In this paper I study wage mobility of Polish workers. Constructing transition matrices
and a wage mobility index I analyze what is the degree of movements across the wage
distribution and how has it changed over the last ten years. I study also the level and
changes in earnings mobility among the UK employees, which allows for a better judgment
whether the degree of earnings transitions in Poland is in fact high or low. I analyze which
groups of workers �from the bottom, middle or upper part of the distribution are the most
mobile. I also try to determine whether changes in the wage inequalities over the past
ten years had an impact on wage mobility. This paper compares also the measurement of
wage mobility in Poland using two available data sources on labour income: the Household
Budget Survey and the Labour Force Survey.
Section 2 describes the data used for the analysis. Section 3 presents changes in the
earnings inequalities in Poland since mid nineties. In section 4, wage mobility of Polish
employees is analyzed whereas section 5 compares these results to the UK case. Section
6 presents the changes in earnings mobility in the light of increasing wage disparities.
Section 7 concludes, summarizing the research results.
1
2 Data description
The availability of data which allow the analysis of earnings mobility in Poland is rather
scarce. The data used in this paper come from two sources: Polish Household Budget
Survey (PHBS) and Polish Labour Force Survey (PLFS). Each of them has its advan-
tages and drawbacks, therefore I use the two to provide comparisons and complementary
information.
The PHBS is conducted yearly on a sample of approximately 33 thousand households,
whereas the PLFS surveys approximately 45 thousand individuals quarterly. In both
surveys the individuals can be observed only for two consecutive years1. PHBS seems to
be a more accurate source of information on wage data than LFS. In particular, the wage
reporting rates for employees in the PHBS are much higher (in 2005: 98 per cent vs. 66
per cent in PLFS). The respondents in PLFS also tend to round up data (as a result,
there are high peaks of responses at round numbers, such as 1000 PLN). Furthermore, in
the PLFS the higher earnings are underreported: the reporting rate for employees with
higher education is lower than for these with lower levels of education by a few percentage
points, which leads to lower levels of average wage. As a result the average PLFS wage
amounts to 75 per cent of average wage in the economy (net terms), whereas the PHBS �
for 86 per cent. Also the earnings distribution is a¤ected, as the PLFS is biased towards
lower earnings, its median to average ratio is 0.86, whereas it�s 0.82 in PHBS and 0.81 in
the Structure of Earnings Survey2. To conclude, the PHBS data is likely to better re�ect
the degree of wage mobility in Poland. However, since I have longer data series only for
the PLFS, this data will be used to analyse changes in the earnings mobility across time
whereas the PHBS will provide a comparison for the potential level of wage mobility in a
point in time.
One has to keep in mind that there are statistical factors which might impact the
analysis of changes in wage mobility across time using PLFS. One of them is the panel
attrition rate. The percentage of individuals dropping out of the panel has increased over
time, from less than 7 per cent in 1995/96 to around 19 per cent in 2005. It is hard to
determine to what extent the rising drop out rates might change the earnings transitions.
However, one can not notice any tendency for lower or higher wage workers to drop out
1Due to changes in methodology in the PLFS in 1999 and a lack of two waves of the survey, it is
impossible to construct the 1998/99 panel and the 1999/2000 is limited in size.2The Structure of Earnings Survey is a survey of full time employees conducted every two years (in
particular: 1996, 1998, 1999, 2001, 2002, 2004, 2006) by the Polish Central Statistical O¢ ce. It is
representative for ca. 6 �7 million of employees.
2
more often. The average wages for full time employees who remain in the sample are the
same as of those dropping out in 1995/96, slightly higher in 2000/01 and lower in 2004/05.
Therefore one might expect the changes in the attrition rates do not change the mobility
results in a consistent way. The other factor which might impact the analysis of earnings
transitions with PLFS data are the response rates, i.e. percentages of employees reporting
their wages. These have fallen considerably across the time, from over 95 per cent in 1995
to 65 per cent in 2006. This drop in response rate has been much higher among the better
educated earners3 , hence one expects that high wage earners underreport wages more
often, which may lead to underestimating the degree of earnings mobility over the years.
I use the 2004-2005 PHBS and 1995-2007 PLFS datasets. The wage variables are the
monthly earnings net of deductions (social contributions and tax). As in the PHBS data
there is no information on hours worked (and the information available in PLFS may pose
di¢ culties to derive reliable hourly earnings), I use monthly wages of full time workers
only. I restrict my sample further, by focusing on employees (as labour income data for
employers, self employed and helping family members is available in PHBS only). The
restricted PHBS sample provides a better picture of reality, as the reporting rates for
workers other than employees are very low (below 10 per cent for self employed and for
employers compared to more than 95 per cent for employees). For the �nal analysis of the
earnings mobility I exclude all people aged less than 25 (since I want to focus on these
who have left full time education) and more than 59. In the �rst part of the analysis,
transitions out and to employment are taken into account, hence the sample includes also
the unemployed and the inactive, as well as �ows to �missing wage (i.e. being a full time
employee who does not report its wage) and �other employment status�(i.e. part time
employee, self employed, employer, helping family member).
Finally, section 4 focuses on comparing the earnings mobility of Polish workers with
the case of UK . I use the British Household Panel Survey (BHPS) dataset (waves 2-
14, i.e. data for years 1991 -2004). The BHPS is a longitudinal panel data set including
information on approximately 5500 (wave 1) to more than 10 000 households (from 2001),
i.e. 10 �17 thousand individuals. Its missing wage data is imputed and it seems to re�ect
the overall economy wages rather well4 . For a more detailed description of the BHPS,
see for example Lynn et al. (2006).
3Between 1995 and 2005, the percentage of wage reporters among full time employees with tertiary
education fell from 92 per cent by 35 p.p., whereas among the employees with at the most basic vocational
education from 97 per cent by 25 p.p.4For example, the average gross wage for FT employee in BHPS m wave was more than 96% of average
wage in 2003 according to ASHE data.
3
All the analyses are carried out separately for men and women, so as to take into
account di¤erences in their employment patterns.
3 Earnings inequalities in Poland - trends and pat-
terns
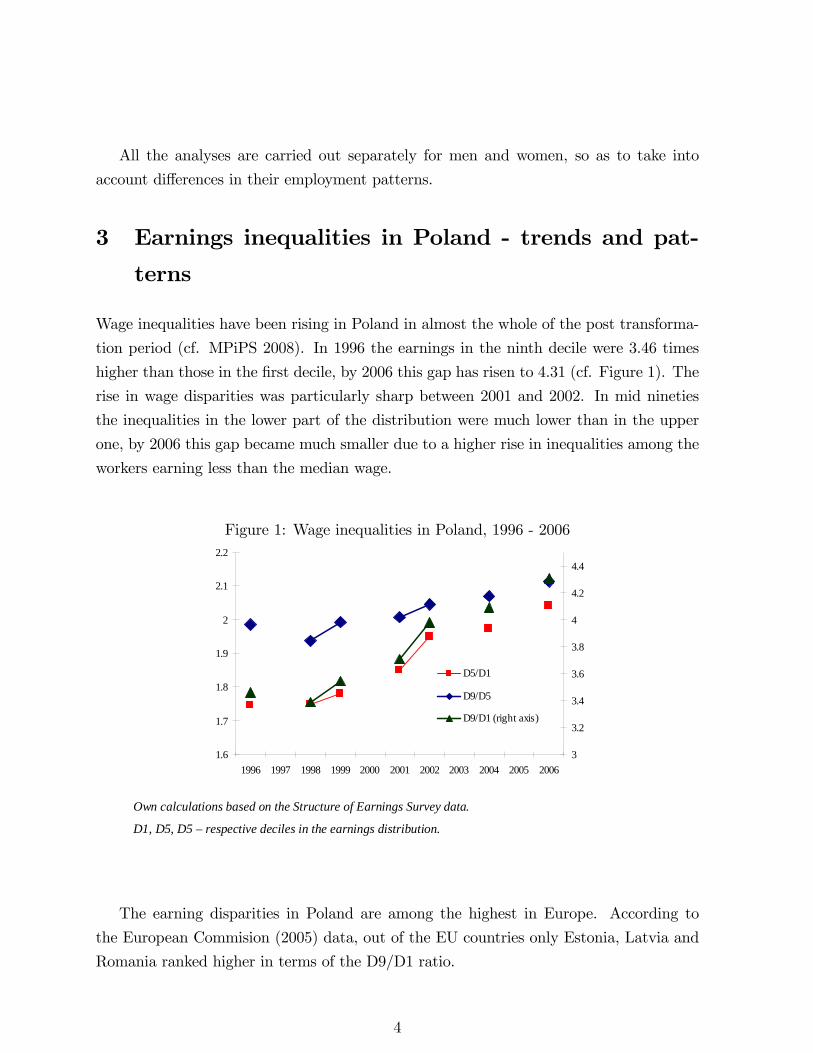
Wage inequalities have been rising in Poland in almost the whole of the post transforma-
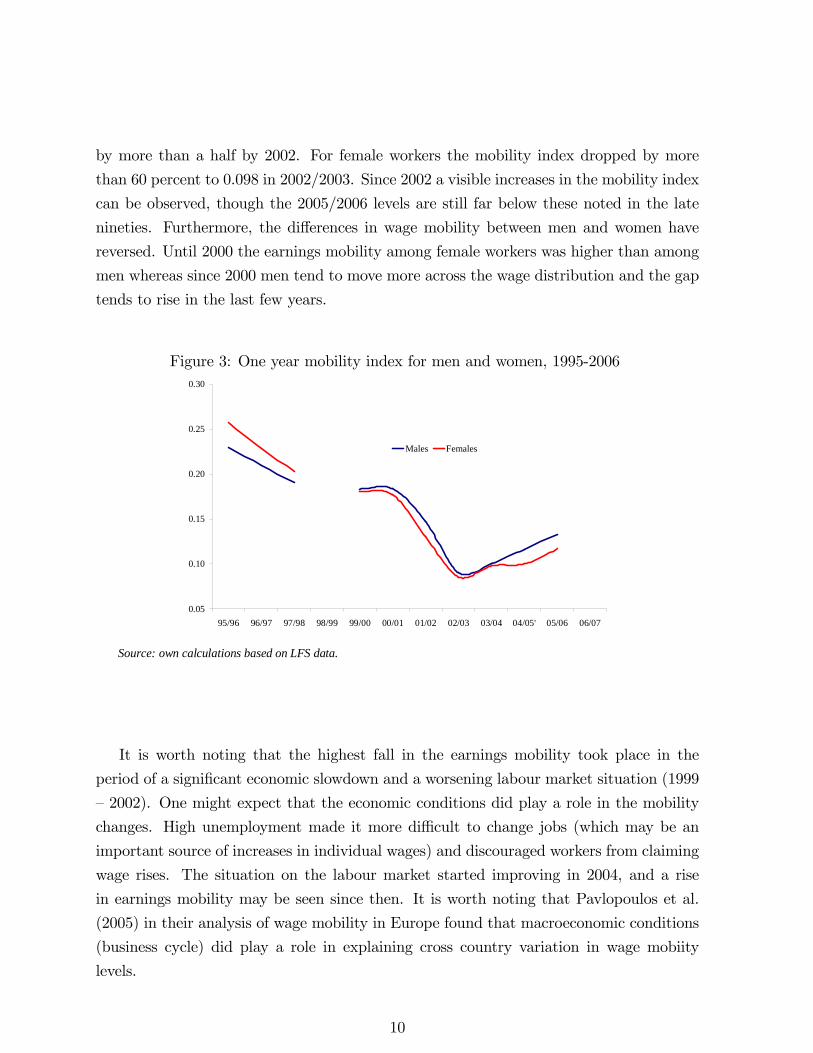
tion period (cf. MPiPS 2008). In 1996 the earnings in the ninth decile were 3.46 times
higher than those in the �rst decile, by 2006 this gap has risen to 4.31 (cf. Figure 1). The
rise in wage disparities was particularly sharp between 2001 and 2002. In mid nineties
the inequalities in the lower part of the distribution were much lower than in the upper
one, by 2006 this gap became much smaller due to a higher rise in inequalities among the
workers earning less than the median wage.
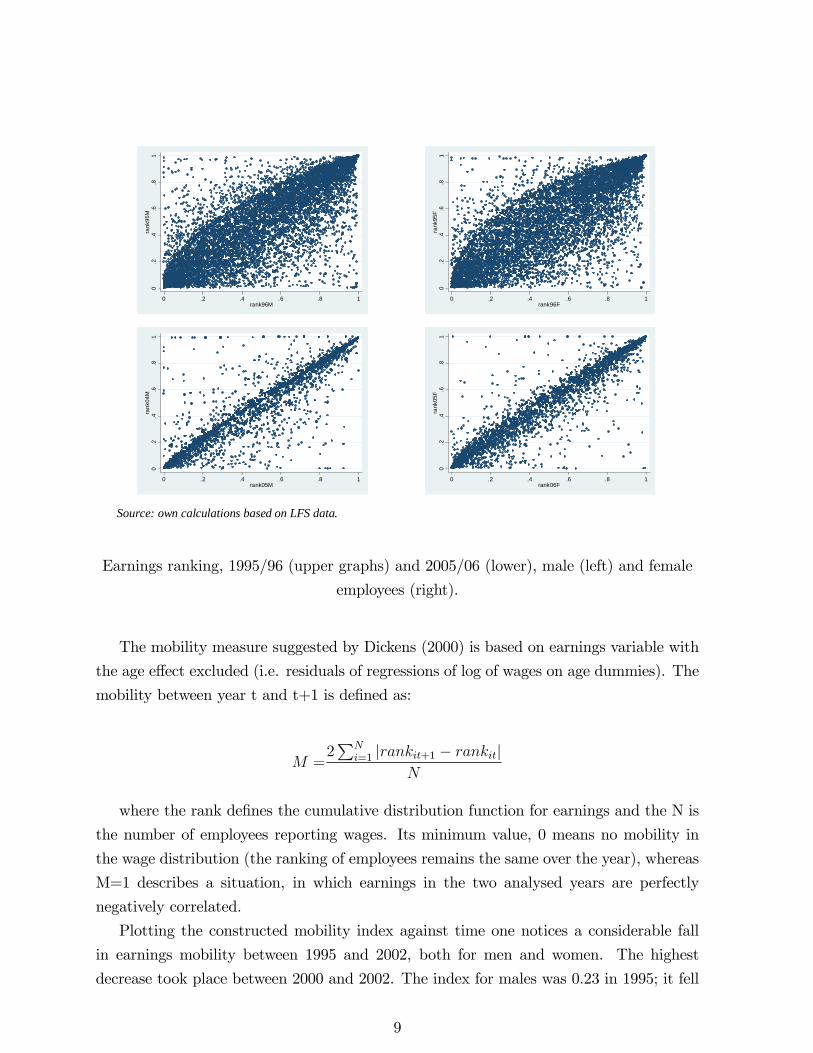
Figure 1: Wage inequalities in Poland, 1996 - 2006
Pt&O means part time employees, self employed, employers and working family members.
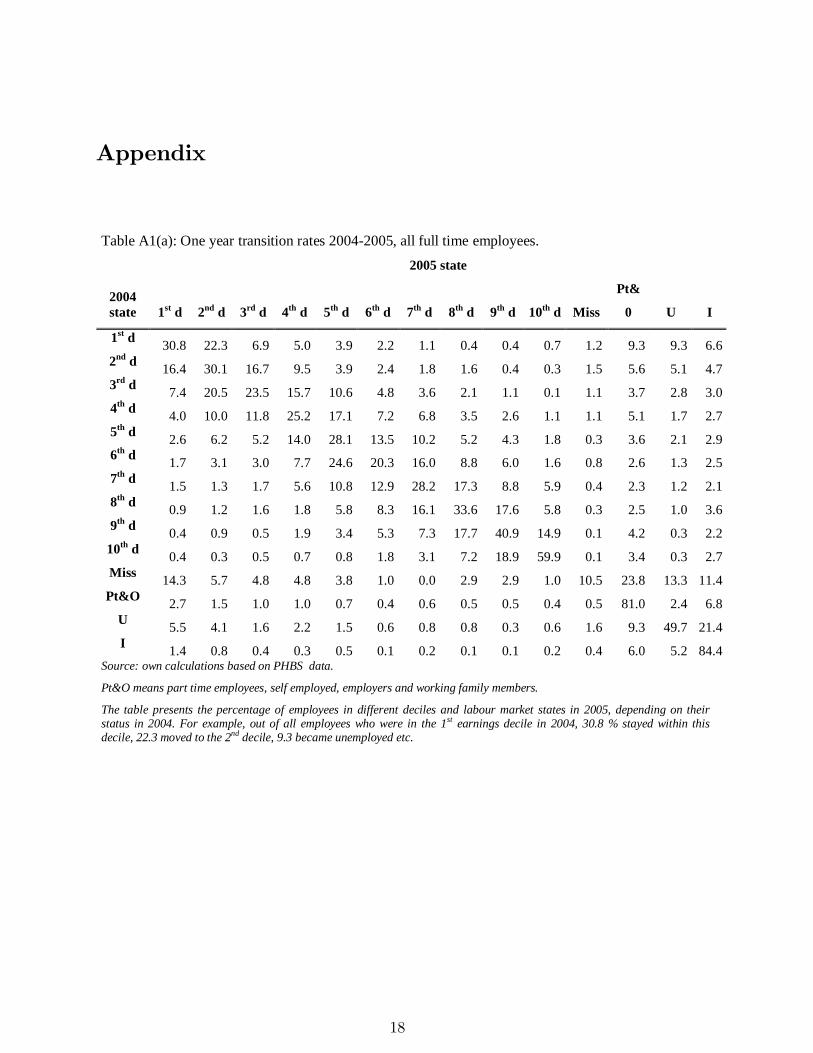
The table presents the percentage of employees in different deciles and labour market states in 2005, depending on theirstatus in 2004. For example, out of all employees who were in the 1st earnings decile in 2004, 30.8 % stayed within thisdecile, 22.3 moved to the 2nd decile, 9.3 became unemployed etc.
18
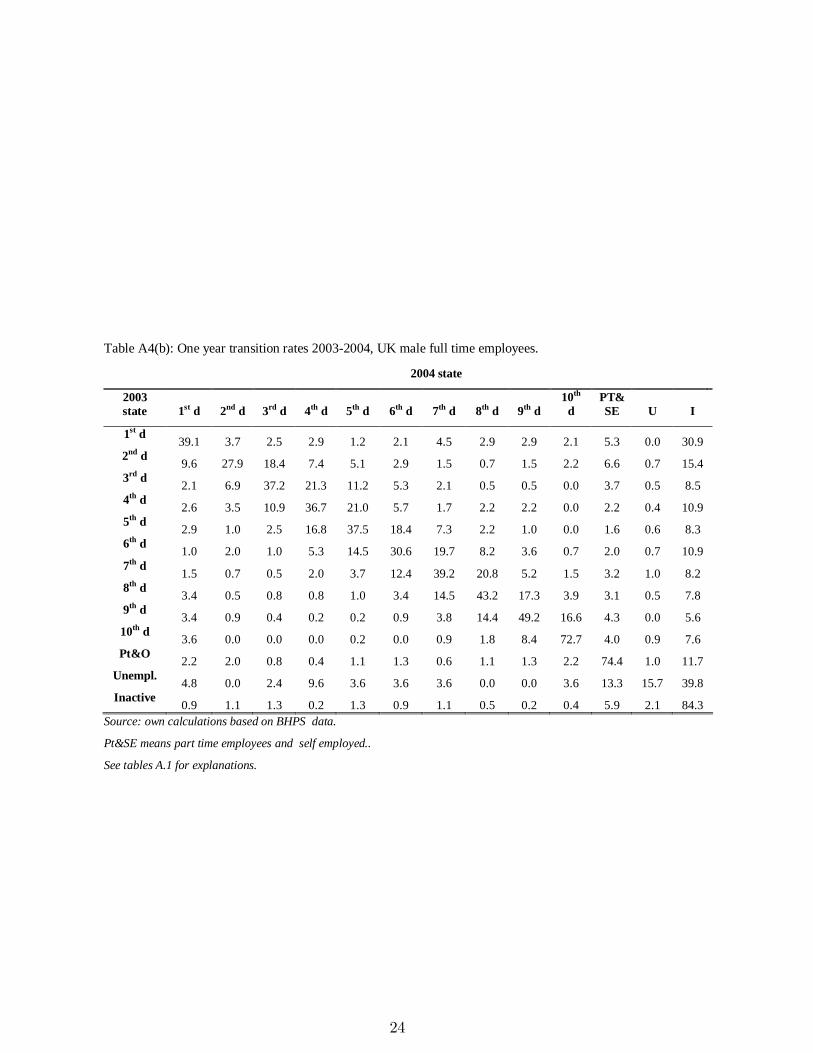
Table A1(b): One year transition rates 20042005, male employees.
2005 state
2004state 1st d 2nd d 3rd d 4th d 5th d 6th d 7th d 8th d 9th d 10th d Miss
Pt&O means part time employees, self employed, employers and working family members.
The table presents the percentage of employees in different deciles and labour market states in 2005, depending on theirstatus in 2004. For example, out of all employees who were in the 1st earnings decile in 2004, 28.8 % stayed within thisdecile,17.6 moved to the 2nd decile, 11.5 became unemployed etc.
19
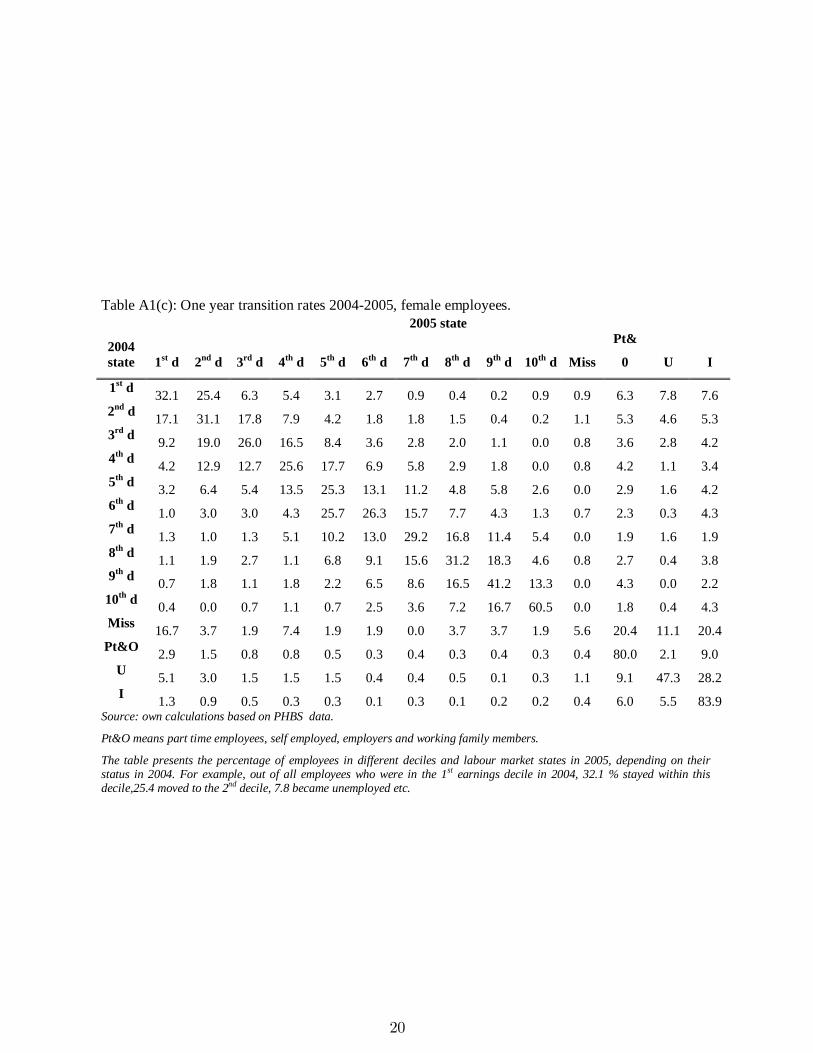
Table A1(c): One year transition rates 20042005, female employees.2005 state
2004state 1st d 2nd d 3rd d 4th d 5th d 6th d 7th d 8th d 9th d 10th d Miss
Pt&O means part time employees, self employed, employers and working family members.
The table presents the percentage of employees in different deciles and labour market states in 2005, depending on theirstatus in 2004. For example, out of all employees who were in the 1st earnings decile in 2004, 32.1 % stayed within thisdecile,25.4 moved to the 2nd decile, 7.8 became unemployed etc.
20
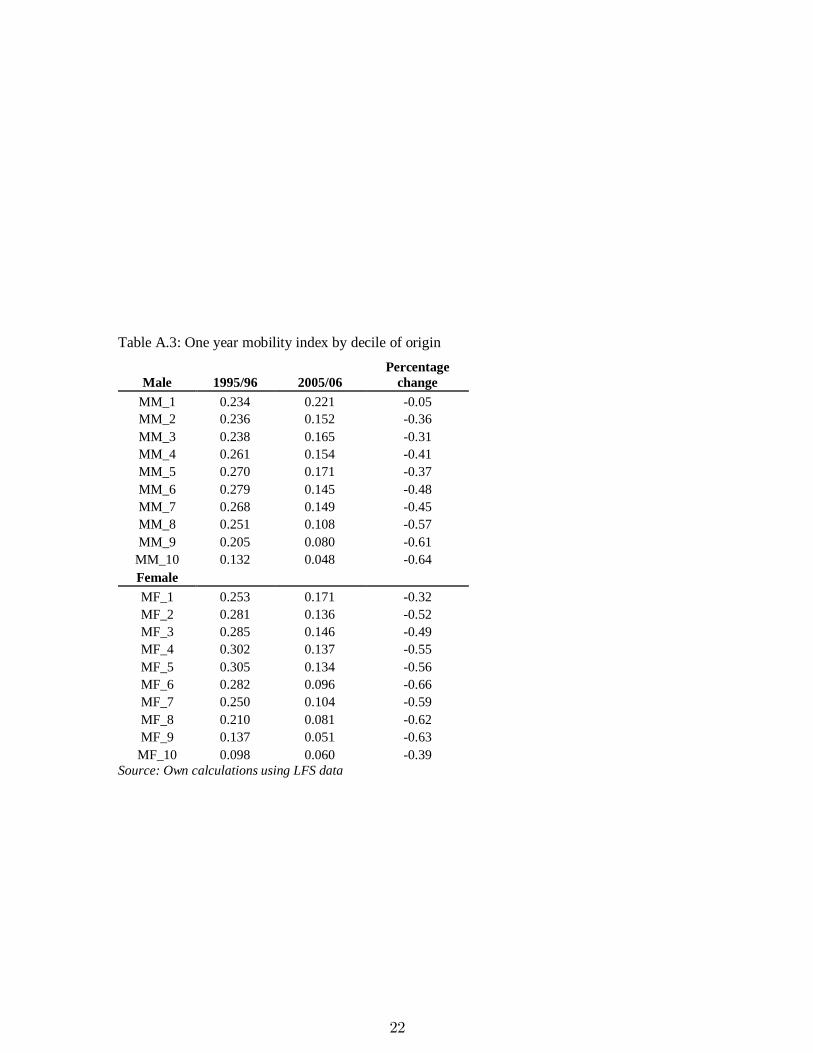
Table A2(a). Transition rates across time. Men full time employees.