Wage setting in Colombian manufacturing industry: the impact of institutional and trade reforms ∗ Sonia A. Agudelo † Universitat Autònoma de Barcelona 18 June 2014 Abstract We show that wage setting in the Colombian manufacturing industry is not fundamentally driven by labour productivity as predicted by standard theoretical models. Although efficiency gains have exerted a significant and stable influence on wages in last decades, internal institutional arrangements (either the minimum wage or the price wedge between manufacturing and consumption prices) and ex- ternal factors (connected to the increasing globalization of the Colombian economy) appear the crucial drivers. Moreover, the process of structural reform materialized 1992 onwards has rendered wages more sensitive to payroll taxation and external factors, but less to the price wedge. These findings lead us to question the political strategy followed to attain cost competitiveness in a context of growing exposure to international trade. Implementation of a true wage bargaining system is suggested as a critical policy target to prevent the disruptive economic and social consequences of the current wage setting mechanism. JEL Classification: J30, O11, F16, F62. Keywords: Wage setting, Labor productivity, Globalization, Payroll taxes, Price wedge. ∗ Acknowledgments: Sonia A. Agudelo is grateful to COLCIENCIAS for financial support. † Departament d’Economia Aplicada, Universitat Autònoma de Barcelona, Edifici B, 08193 Bellaterra, Spain; tel: +34-93.581.16.80; email: [email protected]. 1
Transcript
Wage setting in Colombian manufacturing industry:
the impact of institutional and trade reforms∗
Sonia A. Agudelo†
Universitat Autònoma de Barcelona
18 June 2014
Abstract
We show that wage setting in the Colombian manufacturing industry is not
fundamentally driven by labour productivity as predicted by standard theoretical
models. Although efficiency gains have exerted a significant and stable influence
on wages in last decades, internal institutional arrangements (either the minimum
wage or the price wedge between manufacturing and consumption prices) and ex-
ternal factors (connected to the increasing globalization of the Colombian economy)
appear the crucial drivers. Moreover, the process of structural reform materialized
1992 onwards has rendered wages more sensitive to payroll taxation and external
factors, but less to the price wedge. These findings lead us to question the political
strategy followed to attain cost competitiveness in a context of growing exposure to
international trade. Implementation of a true wage bargaining system is suggested
as a critical policy target to prevent the disruptive economic and social consequences
∗Acknowledgments: Sonia A. Agudelo is grateful to COLCIENCIAS for financial support.†Departament d’Economia Aplicada, Universitat Autònoma de Barcelona, Edifici B, 08193 Bellaterra,
In other words, the progress of wages should be closely related to the progress of some
measure of economic efficiency. Focusing, specifically, on the labour market, standard
wage setting models predict a one-to-one long-run relationship between wages and labour
productivity (see Judzik and Sala, 2013, for the simplest analytical case).
The reason why this theoretical relationship is far from holding in the Colombian
manufacturing industry is twofold. First, the adjustments of nominal wages are highly
tied to the cost of living. Second, payroll taxes and other non-wage costs make up a
significant part of the total compensation (53% of net wage). In this context, the relevant
relationship, for firms, is between the gross real wages and labor productivity. This is
the fundamental reason behind the low sensitivity of net real wages to changes in labor
productivity.
On the contrary, wages’ key drivers are related to internal institutional settings —either
connected to minimum wages or to the price wedge between manufacturing and consumer
prices— and external factors.
Hence, the second main finding is the high sensitivity of net real wages to changes
in the price wedge. This result provides empirical evidence, as suggested before, that
the adjustments of nominal wages are highly tied to the cost of living which is critically
driving the growth of net real wages in the manufacturing industry. The long-run impact
of the price wedge reveals a structural change which is mainly associated to the trade
liberalization process. The intuitive idea is that the increased exposure of the Colom-
bian economy to the international markets has caused dramatic downward pressures on
consumer and producer prices. Being the industrial sector the most exposed to foregin
competition, though, this pressure was asymmetric and relative prices fell down causing,
thereby, lower pressure on net real wages.
The third main finding is the negative and significant impact of payroll taxation on net
wages since 1992. Given that most of the increases in payroll tax rates (paid by firms) were
carried out after 1992, this result should be interpretted as the direct consequence that
the general institutional changes had on the wage setting process in the manufacturing
industry. It provides evidence of significant payroll tax shifting, meaning that employers
partially shifted the payroll tax burden to workers in the form of lower net real wages.
Whether the increase in payroll taxes caused significant job cuts, or not, is something
we cannot answer properly in this study. It is generally expected that the larger the extent
of payroll tax shifting, the lower the negative consequences on employment. However,
there is not yet a consensus in the literature on the fact that cutting payroll taxes increases
employment (and vice-versa). On one side, there is empirical evidence suggesting that
3
payroll taxation has asymmetric effects on wages and employment. On this account,
therefore, there would be space for employment gains. On the other side, though, there
are even more studies showing that payroll tax rate cuts do not generate significant effects
on employment, even though they have sizeable negative effects on net real wages —Cruces
et al. (2010), Bennmarker et al. (2009), Bauer and Riphahn (2002), and Gruber (1997).
The last finding is the significant positive impact of globalization on wages in 1992-
2009. This effect needs to be interpreted in connection with the hypothesis of skill-biased
technological change. As Arbache et al. (2004) pointed out, one of the consequences
of the increasing economic openness is a rapid inflow of foreign technology as a result
both of foreign direct investment and increased imports. The in-flowing technology is
assumed to be skill-biased because it is mainly designed in industrialized economies which
are relatively skill intensive. Thus, the acquisition of new technologies from developing
countries is normally accompanied by a greater demand of skilled labor. On the positive
side, this causes an upward pressure on relative wages (this is the effect we are capturing),
although there is a negative consequence, also, in terms of increased wage (and income)
inequality.1 Given that we work with average net real wages, we interpret the positive
effect of globalization on wages as reflecting the increase in skilled-labor wages.
The rest of this paper is structured as follows. Section 2 reviews the features of
the Colombian economy regarding the institutional setting and the trade libreralization
process. Section 3 discusses the theoretical background on wage setting models and their
empirical implementation in this paper. Section 4 presents the data and the econometric
methodology. Section 5 shows the results. Section 6 concludes.
2 Labor market institutions and trade liberalization
2.1 Labor market reforms
The Colombian labor market is segmented. There is a massive informal sector accounting
for around 50% of employment2, and a formal sector accounting for the remaining 50%
of employment. Within this context, the manufacturing industry is an economic activity
with a relatively low incidence of informality close to 20%.3
Since 1990, a structural reform process has been developed in view, on one side, to
enhance labor market flexibility and boost (formal) employment and, on the other side,
1Growing empirical evidence on the effects of globalization gives support to a positive relationship
between trade liberalization and wage inequality in developing countries.2Data for thirteen metropolitan areas in year 2013 computed from data from Gran Encuesta Continua
de Hogares (GEIH).3It was 18.7% in 2007 based on data for thirteen metropolitan areas from data from GEIH, in contrast
to close to 75% in trade and services.
4
expand the coverage of health and pension services.
To achieve the first target, Law 50 was passed in 1990 to lower firing, training and
recruitment costs. This was followed by Law 789 in 2002, which lowered the regulated costs
of non-standard employment (for example, on weekend, night, and holiday working hours).
The expectation was that such measures would contribute to render formal employment
more attractive and boost job creation.
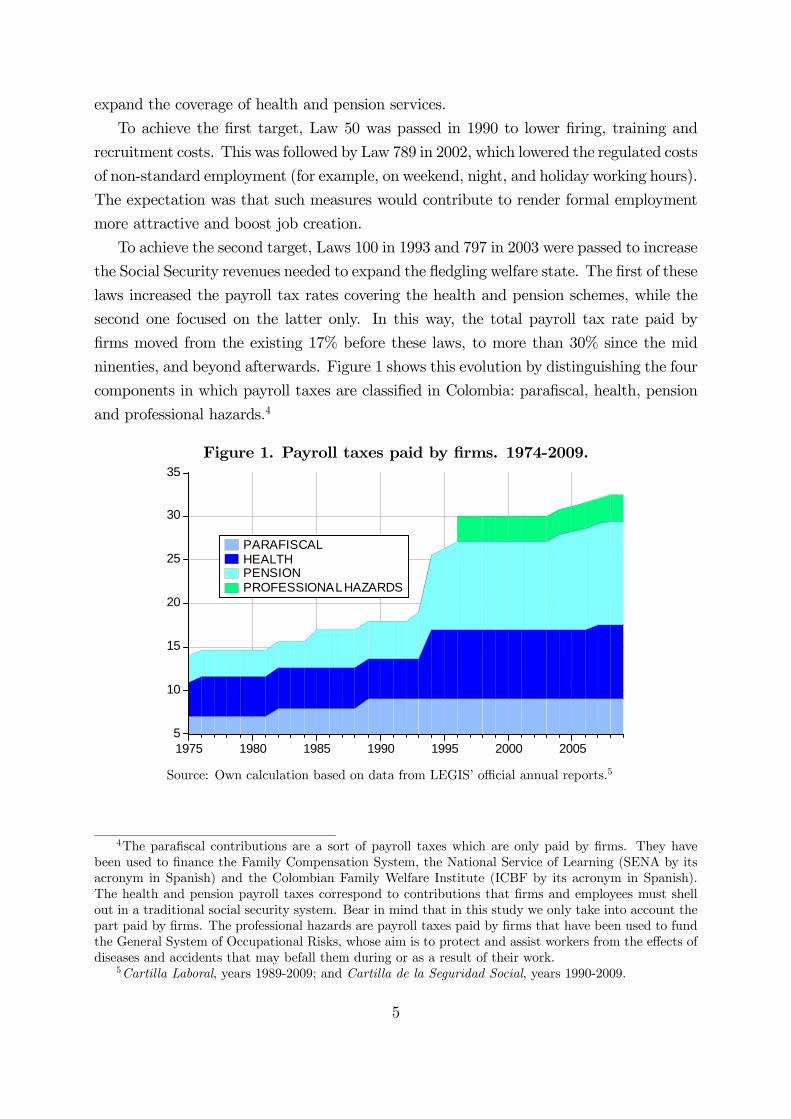
To achieve the second target, Laws 100 in 1993 and 797 in 2003 were passed to increase
the Social Security revenues needed to expand the fledgling welfare state. The first of these
laws increased the payroll tax rates covering the health and pension schemes, while the
second one focused on the latter only. In this way, the total payroll tax rate paid by
firms moved from the existing 17% before these laws, to more than 30% since the mid
ninenties, and beyond afterwards. Figure 1 shows this evolution by distinguishing the four
components in which payroll taxes are classified in Colombia: parafiscal, health, pension
and professional hazards.4
Figure 1. Payroll taxes paid by firms. 1974-2009.
5
10
15
20
25
30
35
1975 1980 1985 1990 1995 2000 2005
PARAFISCALHEALTHPENSIONPROFESSIONAL HAZARDS
Source: Own calculation based on data from LEGIS’ official annual reports.5
4The parafiscal contributions are a sort of payroll taxes which are only paid by firms. They have
been used to finance the Family Compensation System, the National Service of Learning (SENA by its
acronym in Spanish) and the Colombian Family Welfare Institute (ICBF by its acronym in Spanish).
The health and pension payroll taxes correspond to contributions that firms and employees must shell
out in a traditional social security system. Bear in mind that in this study we only take into account the
part paid by firms. The professional hazards are payroll taxes paid by firms that have been used to fund
the General System of Occupational Risks, whose aim is to protect and assist workers from the effects of
diseases and accidents that may befall them during or as a result of their work.5Cartilla Laboral, years 1989-2009; and Cartilla de la Seguridad Social, years 1990-2009.
5
There is ample literature on institutions referring to the supposedly ‘labor-unfriendly’
impact of payroll tax rate increases. This may be one of the reasons why, without hardly
any assessment on the estimated consequences of the previous policy, the government
decided to lower first —by Law 1429 of Formalization and employment generation in 2010—
and then eliminate —by Law 1607 in 2012— the parafiscal and health contributions paid
by firms.
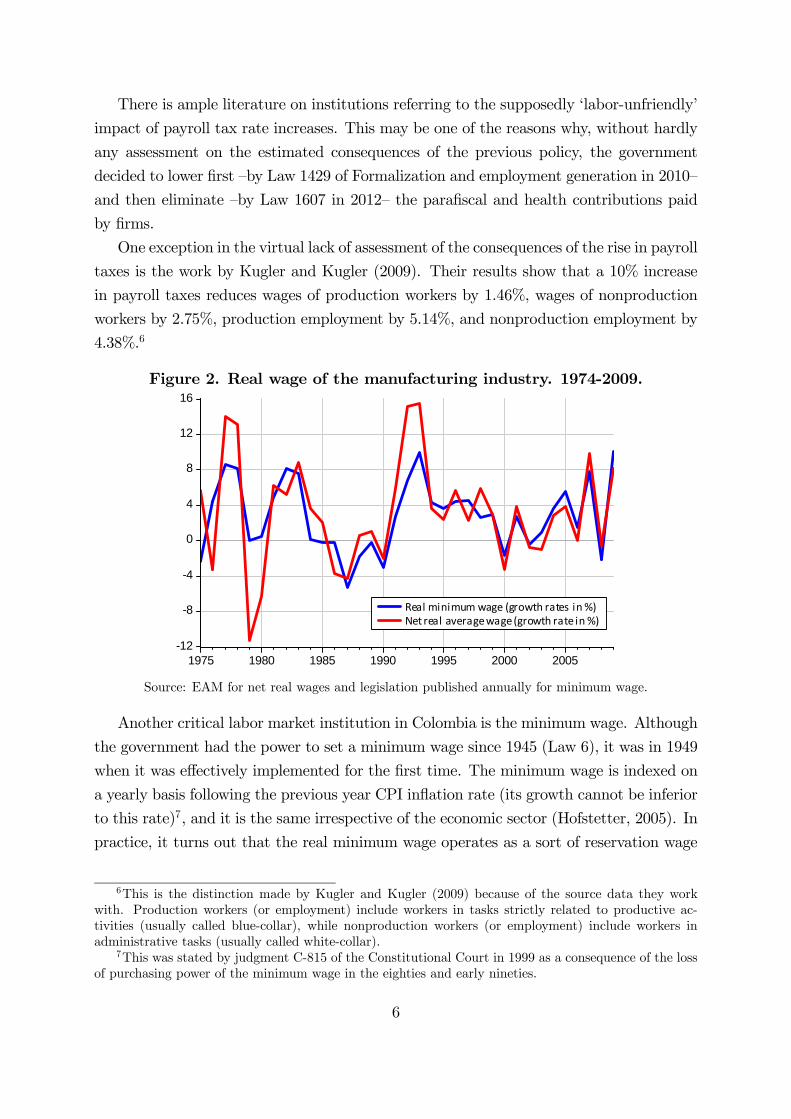
One exception in the virtual lack of assessment of the consequences of the rise in payroll
taxes is the work by Kugler and Kugler (2009). Their results show that a 10% increase
in payroll taxes reduces wages of production workers by 1.46%, wages of nonproduction
workers by 2.75%, production employment by 5.14%, and nonproduction employment by
4.38%.6
Figure 2. Real wage of the manufacturing industry. 1974-2009.
-12
-8
-4
0
4
8
12
16
1975 1980 1985 1990 1995 2000 2005
Real minimum wage (growth rates in %)Net real average wage (growth rate in %)
Source: EAM for net real wages and legislation published annually for minimum wage.
Another critical labor market institution in Colombia is the minimum wage. Although
the government had the power to set a minimum wage since 1945 (Law 6), it was in 1949
when it was effectively implemented for the first time. The minimum wage is indexed on
a yearly basis following the previous year CPI inflation rate (its growth cannot be inferior
to this rate)7, and it is the same irrespective of the economic sector (Hofstetter, 2005). In
practice, it turns out that the real minimum wage operates as a sort of reservation wage
6This is the distinction made by Kugler and Kugler (2009) because of the source data they work
with. Production workers (or employment) include workers in tasks strictly related to productive ac-
tivities (usually called blue-collar), while nonproduction workers (or employment) include workers in
administrative tasks (usually called white-collar).7This was stated by judgment C-815 of the Constitutional Court in 1999 as a consequence of the loss
of purchasing power of the minimum wage in the eighties and early nineties.
6
which not only is a floor wage (in levels), but also a reference for wage increases in formal
activities.8
Finally, although the Colombian labor legislation recognizes unions as a part of the
labor relation system, its role, nowadays, is minimal and essentially restricted to collective
bargaining at firm-level. Union density in Colombia is around 4%, while the coverage of
collective agreements is less than 2% (data from ENS).
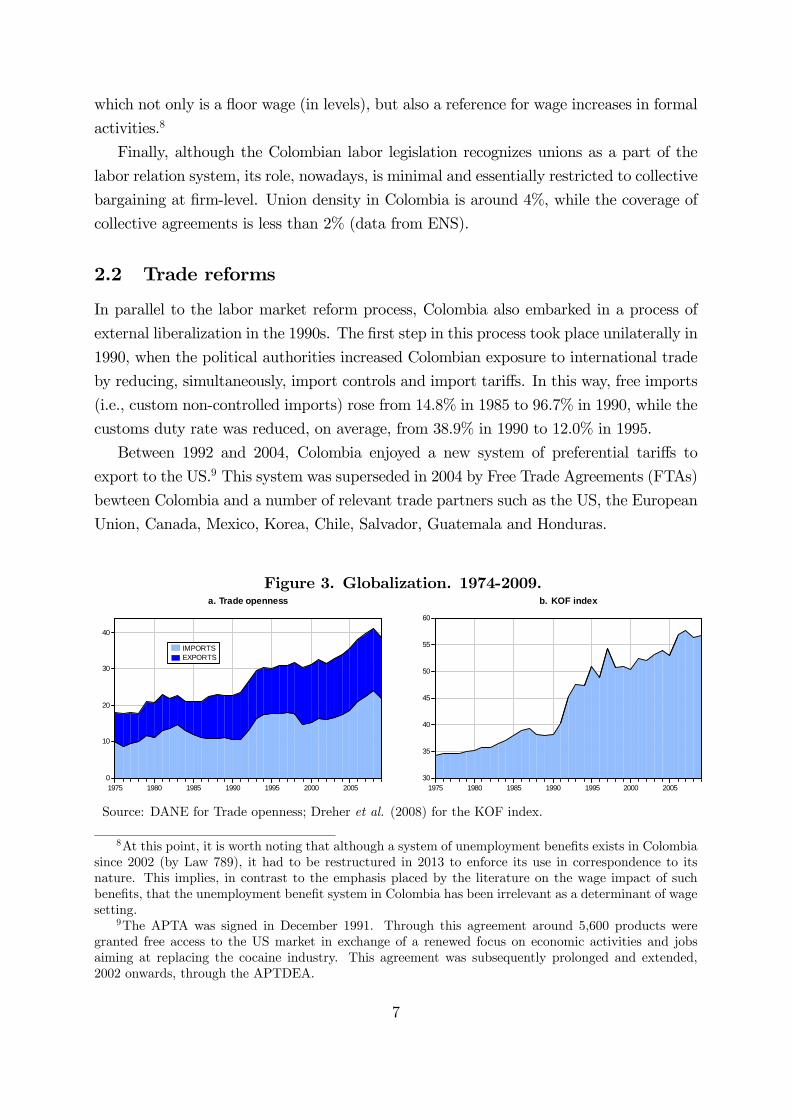
2.2 Trade reforms
In parallel to the labor market reform process, Colombia also embarked in a process of
external liberalization in the 1990s. The first step in this process took place unilaterally in
1990, when the political authorities increased Colombian exposure to international trade
by reducing, simultaneously, import controls and import tariffs. In this way, free imports
(i.e., custom non-controlled imports) rose from 14.8% in 1985 to 96.7% in 1990, while the
customs duty rate was reduced, on average, from 38.9% in 1990 to 12.0% in 1995.
Between 1992 and 2004, Colombia enjoyed a new system of preferential tariffs to
export to the US.9 This system was superseded in 2004 by Free Trade Agreements (FTAs)
bewteen Colombia and a number of relevant trade partners such as the US, the European
Union, Canada, Mexico, Korea, Chile, Salvador, Guatemala and Honduras.
Figure 3. Globalization. 1974-2009.
0
10
20
30
40
1975 1980 1985 1990 1995 2000 2005
IMPORTSEXPORTS
a. Trade openness
30
35
40
45
50
55
60
1975 1980 1985 1990 1995 2000 2005
b. KOF index
Source: DANE for Trade openness; Dreher et al. (2008) for the KOF index.
8At this point, it is worth noting that although a system of unemployment benefits exists in Colombia
since 2002 (by Law 789), it had to be restructured in 2013 to enforce its use in correspondence to its
nature. This implies, in contrast to the emphasis placed by the literature on the wage impact of such
benefits, that the unemployment benefit system in Colombia has been irrelevant as a determinant of wage
setting.9The APTA was signed in December 1991. Through this agreement around 5,600 products were
granted free access to the US market in exchange of a renewed focus on economic activities and jobs
aiming at replacing the cocaine industry. This agreement was subsequently prolonged and extended,
2002 onwards, through the APTDEA.
7
As a consequence, trade openness (i.e., the ratio of exports plus imports over GDP)
increased from below 25% in 1990 to more than 40% today (Figure 3a). Therefore,
although Colombia is still considered a relatively closed economy, in the last two decades
it has experienced a significant change in its overall degree of globalization as measured by
the KOF index (Figure 3b). From a value of 34.3% in 1975, this index only increased by 4
percentage points up to 1990 (34.3%). The steep slope thereafter reflects the liberalization
process of the Colombian economy, which led the KOF index to reach 57% in 2009.
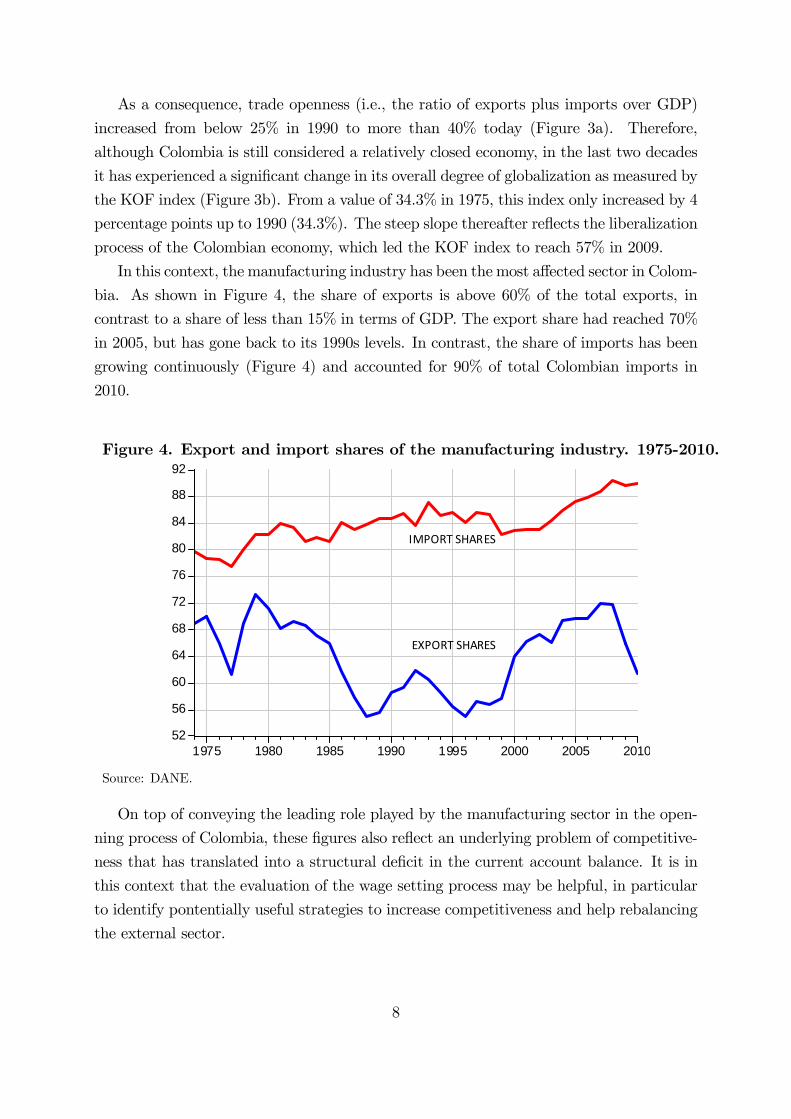
In this context, the manufacturing industry has been the most affected sector in Colom-
bia. As shown in Figure 4, the share of exports is above 60% of the total exports, in
contrast to a share of less than 15% in terms of GDP. The export share had reached 70%
in 2005, but has gone back to its 1990s levels. In contrast, the share of imports has been
growing continuously (Figure 4) and accounted for 90% of total Colombian imports in
2010.
Figure 4. Export and import shares of the manufacturing industry. 1975-2010.
52
56
60
64
68
72
76
80
84
88
92
1975 1980 1985 1990 1995 2000 2005 2010
IMPORT SHARES
EXPORT SHARES
Source: DANE.
On top of conveying the leading role played by the manufacturing sector in the open-
ning process of Colombia, these figures also reflect an underlying problem of competitive-
ness that has translated into a structural deficit in the current account balance. It is in
this context that the evaluation of the wage setting process may be helpful, in particular
to identify pontentially useful strategies to increase competitiveness and help rebalancing
the external sector.
8
3 Wage setting
3.1 Theoretical background
Standard wage setting models have been developed both in perfect and imperfect compe-
tition contexts.
A relevant example of a perfect competition wage setting model can be found in
Kugler and Kugler (2009), where the market-clearing wage and employment levels are set
to equate the demand and supply of labor. Firms choose employment by equating the
gross marginal labor costs —net wage plus payroll taxes— with the marginal revenue of
producing an extra unit of output. In turn, workers set their labor supply as a function of
net wages and their prospective social security benefits received in exchange of the payroll
tax paid by the firm. This gives form to the tax/benefit linkage developed in Summers
(1989). The outcome of this model is that wages are set as a function of the labor demand
and labor supply elasticities with respect to wages, and also with respect to the payroll
tax (paid by firms) and the valuation made by workers over the benefit received.
In a context of imperfect competition, the traditional classification distinguishes ef-
ficiency wage models from colletive bargaining models such as insider-outsider or union
models —Lindbeck and Snower (2001), Booth (2014). Within this vast strand of literature,
the work by Prodecca (2011) provides an encompassing model in which a large number
of identical unions and firms set real wages in a Nash bargaining framework. Empirically,
her model states that the real wage is related to the following six fundamental variables:
labour productivity (), the unemployment rate (), the replacement ratio (),
union bargaining strength (), payroll taxes / non-wage costs ( ), and income taxes ( ).
By solving the theoretical model in a Cobb-Douglas framework and log-linearizing the
resulting expression, Prodecca (2011) obtains her core empirical equation:
log () = 0 + 1 log¡
¢− 2 log () + 3 log () (1)
+4 log () + 5 log ( ) + 6 log
¡ ¢+
To study the Colombian case, this benchmark expression needs to be adapted at least
for a twofold reason. First, because some institutional features that are generally consid-
ered as crucial in developed economies, are less relevant in Colombia and, consequenly,
lack times series information to be included in the analysis. Second, because the bench-
mark model we have considered does not account for the role of the external sector which,
as we have discussed, is likely to have affected wage determination in the manufacturing
industry. On top of these reasons, some data is simply not available.
Next, therefore, we discuss the adjustments and extensions we introduce to benchmark
9
equation (1).
3.2 Empirical implementation
The first adjustment concerns the unemployment rate. As stated, informal employment
in Colombia is massive. This goes together with very limited statistics covering labor
issues in non-urban areas. Consequently, the unemployment rate series available for the
whole sample period is based on urban unemployment. We tested its role in a variety of
specifications and we found it essentially worthless to explain industrial net wages. The
term −2 log () in equation (1) is therefore omitted.The second adjustment relates to the replacement ratio, which is essentially non-
existant in Colombia as a source of income for unemployed. The existant in-kind benefit
was to a large extent improperly used (in any case, not as a true unemployment benefit)
before the 2013 reform. This affects the term 3 log (), which is dropped from the
analysis.
The third adjustment refers to union power in whatever form (measures of trade union
density, number of strikes or days lost due to labor conflicts). Although there is data since
the 1990s, any measure related to union power was unsuccessful (see Section 5 for details).
This questions the relevance of the term 4 log ().
A final adjustment is the exclusion of 6 log () due to the lack of information on
income taxes in consistent time series. On one side, effective tax rates are not available;
on the other side, using the statutory rates would not be accurate given the features of
our panel data. The critical matter is that the income tax scheme sets differentiated rates
by income group, with low incomes subject to tax exemptions. Therefore, as we only have
data on average wages across sectors, the use of statutory tax rates could distort the true
effect of income taxation on wages.
The central institutional extension is the inclusion of the real minimum wage, which
acts as a reference for real wages. This implies considering the new term 2 log (),
where denotes the real minimum wage. A positive sign on ̂2 is expected.
A second extension is related to relative prices and seeks to capture the role exerted
by the price wedge between manufacturing and total prices in wage setting. The vari-
able we consider is the ratio of manufacturing prices () over consumption prices (),
and we expect a negative influence over net real wages. The reason is the following.
Over time, manufacturing prices tend to grow less than consumption prices for a twofold
reason. First, it is a capital-intensive sector subject to quick technological change and
resulting efficiency gains that translate into lower prices (or, in reverse form, equal prices
for increasing quality). Second, it is the most exposed sector to global competition and,
10
as such, bears the most important downward pressure on prices. This forces firms to use
labor compensation as a key adjustment mechanism to ensure competitiveness. In this
context, given that nominal wages in Colombia are indexed to the CPI, the larger is the
wedge between the two, the bigger is the tension in terms of the wage setting mechanism:
while workers grade their net wages having as reference consumption prices, firms appraise
their expected benefits as a function of manufacturig prices. Here is the wedge and the
tension pushing real net wages down when the wedge increases.
The final extension is related to the external sector consisting on the inclusion of a
measure of trade openness () or globalization, alternatively, which we proxy with the
KOF index variable (). We thus add the new term 4 (or 4). The expected
incidence of international trade, or globalization, on net wages is not clear.
On one side, the literature is still far from reaching consensus on the causal relationship
between exports and productivity (and thus wages). Some relevant studies argue that
exports cause efficiency gains (and would thus boost wages), while some other claim that
efficiency progress is what allows exports to increase. In the case of Colombia, we have
two pieces of information that make us look at the imports side. First, as shown by
Figure 3a, exports have not led the openning process. Second, as shown by Figure 4a,
the share of manufacturing exports has remained stable between 1965 and 2010. Hence,
if industrial import of goods are the catalyst variable, then we could expect a positive
influence on net wages to the extent that these imports are mainly reinforcing the capital
stock infrastructure of the Colombian industries. This would not be the case were these
imports based on consumption goods (say toys or clothes), but this was neither the
purpose of the trade liberalization strategy of the Colombian government, nor has been
the general case since 1990.
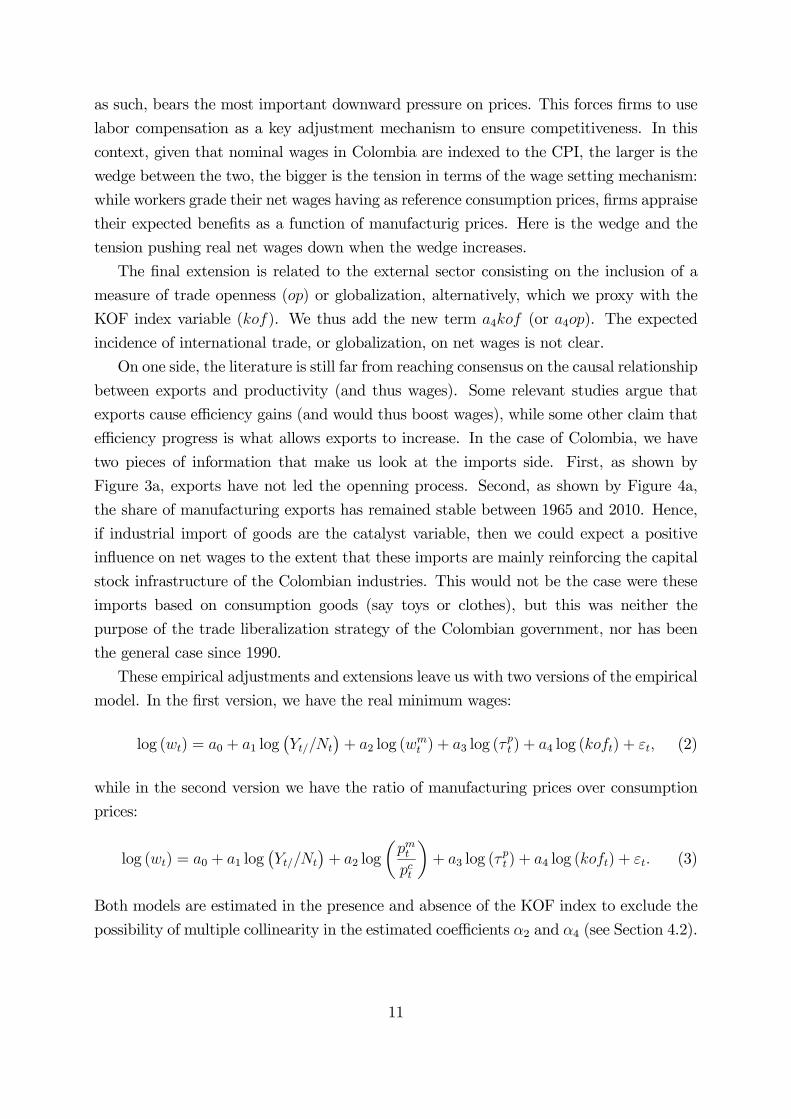
These empirical adjustments and extensions leave us with two versions of the empirical
model. In the first version, we have the real minimum wages:
log () = 0 + 1 log¡
¢+ 2 log (
) + 3 log (
) + 4 log () + (2)
while in the second version we have the ratio of manufacturing prices over consumption
prices:
log () = 0 + 1 log¡
¢+ 2 log
µ
¶+ 3 log (
) + 4 log () + (3)
Both models are estimated in the presence and absence of the KOF index to exclude the
possibility of multiple collinearity in the estimated coefficients 2 and 4 (see Section 4.2).
11
4 Empirical issues
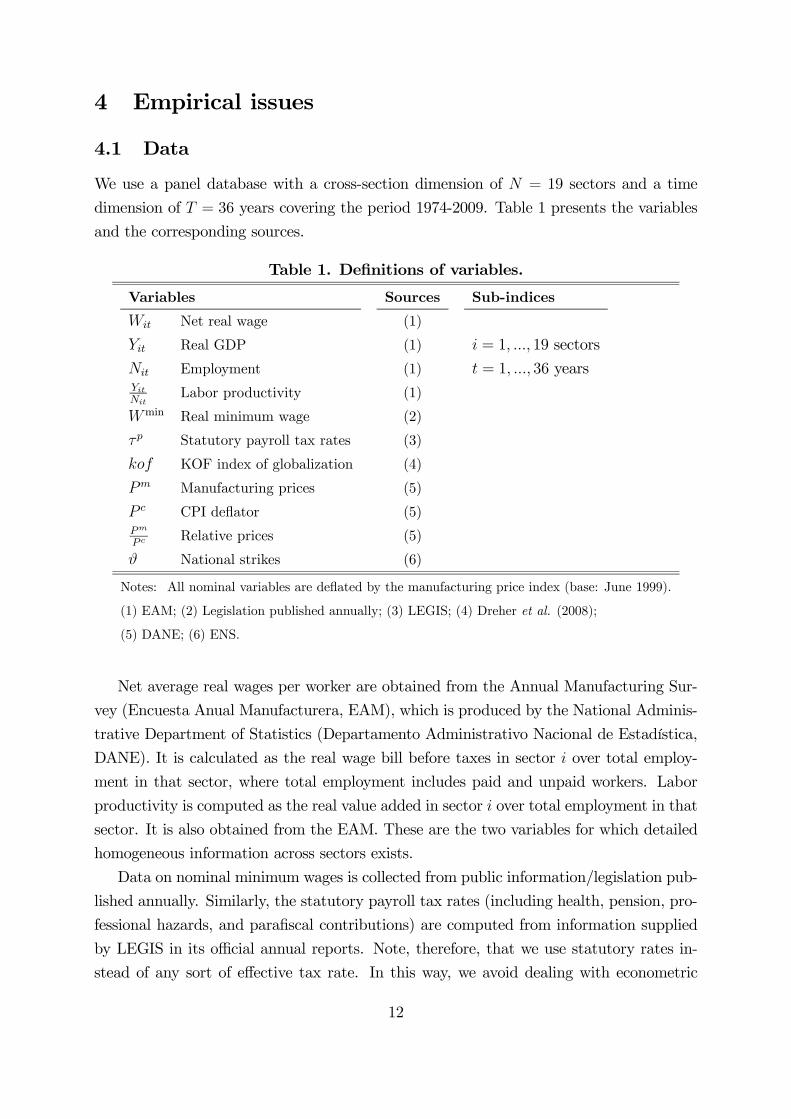
4.1 Data
We use a panel database with a cross-section dimension of = 19 sectors and a time
dimension of = 36 years covering the period 1974-2009. Table 1 presents the variables
and the corresponding sources.
Table 1. Definitions of variables.
Variables Sources Sub-indices
Net real wage (1)
Real GDP (1) = 1 19 sectors
Employment (1) = 1 36 years
Labor productivity (1)
min Real minimum wage (2)
Statutory payroll tax rates (3)
KOF index of globalization (4)
Manufacturing prices (5)
CPI deflator (5)
Relative prices (5)
National strikes (6)
Notes: All nominal variables are deflated by the manufacturing price index (base: June 1999).
(1) EAM; (2) Legislation published annually; (3) LEGIS; (4) Dreher et al. (2008);
(5) DANE; (6) ENS.
Net average real wages per worker are obtained from the Annual Manufacturing Sur-
vey (Encuesta Anual Manufacturera, EAM), which is produced by the National Adminis-
trative Department of Statistics (Departamento Administrativo Nacional de Estadística,
DANE). It is calculated as the real wage bill before taxes in sector over total employ-
ment in that sector, where total employment includes paid and unpaid workers. Labor
productivity is computed as the real value added in sector over total employment in that
sector. It is also obtained from the EAM. These are the two variables for which detailed
homogeneous information across sectors exists.
Data on nominal minimum wages is collected from public information/legislation pub-
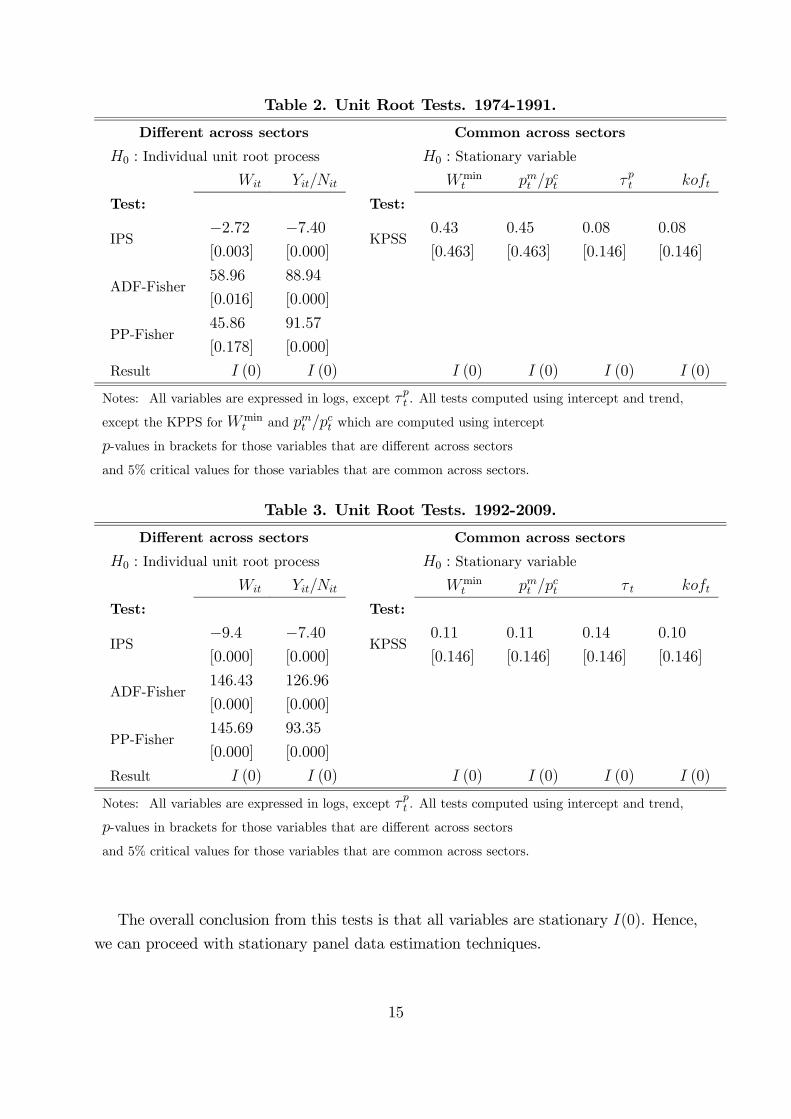
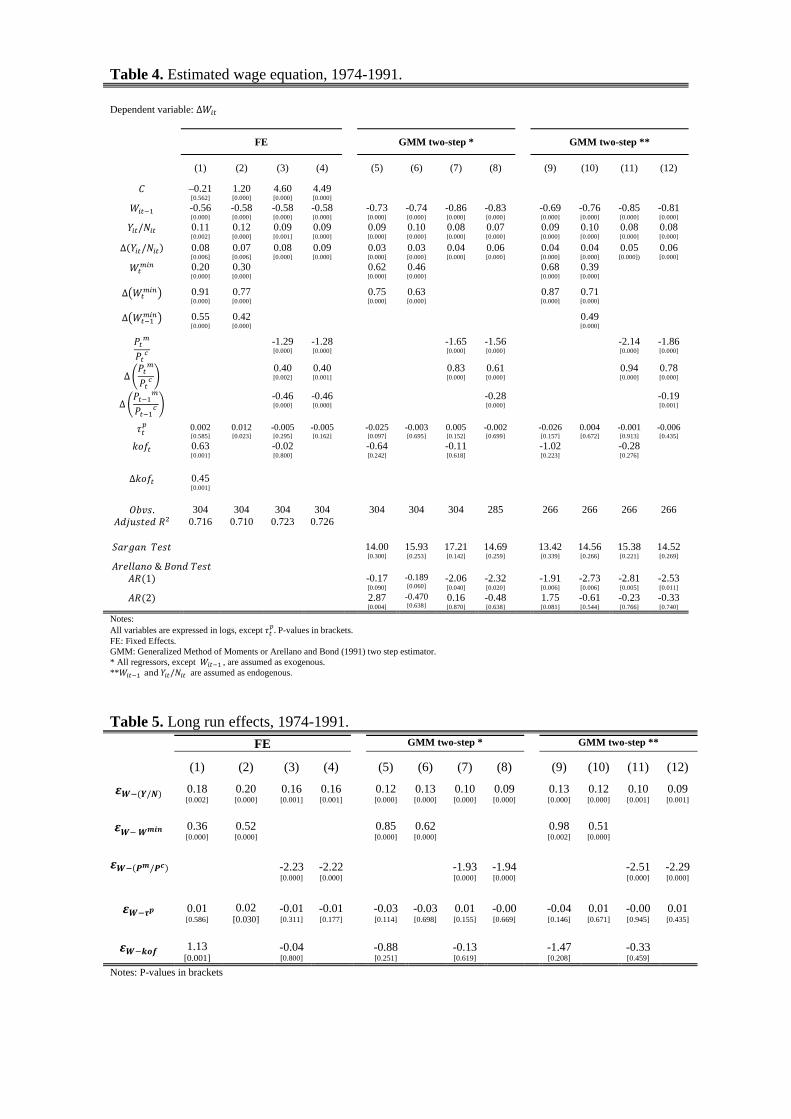
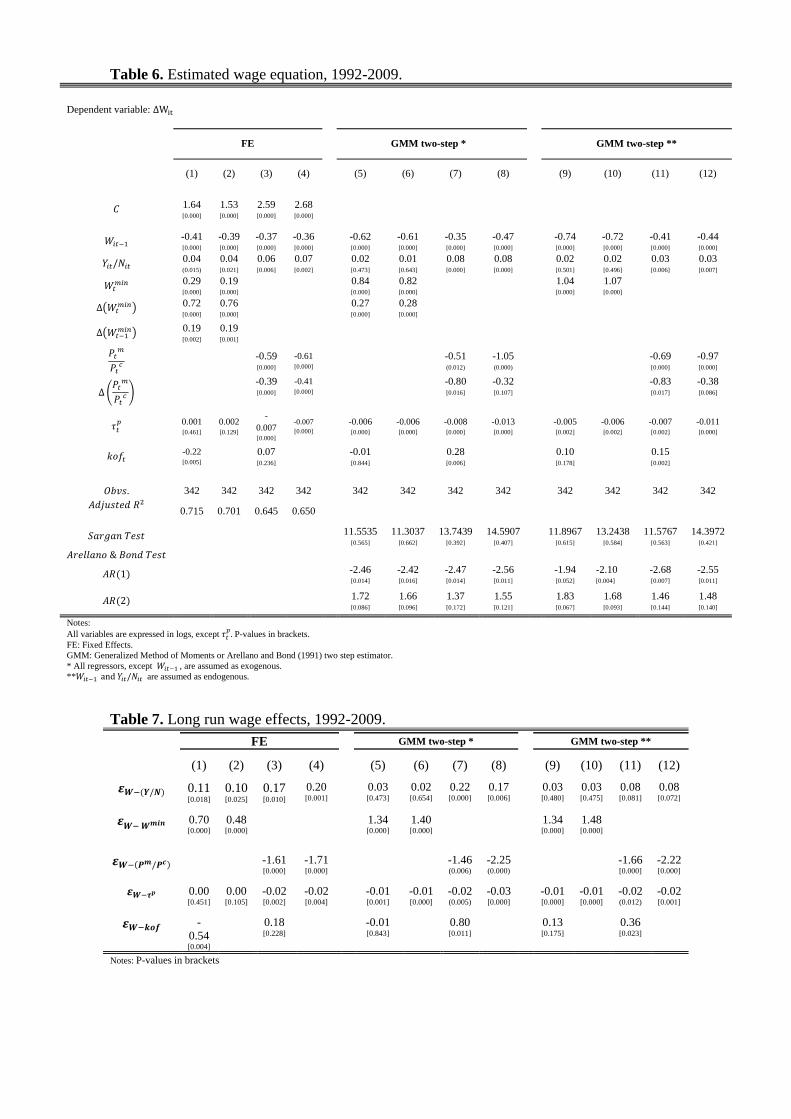
Notes: All variables are expressed in logs, except . P-values in brackets. FE: Fixed Effects. GMM: Generalized Method of Moments or Arellano and Bond (1991) two step estimator. * All regressors, except , are assumed as exogenous. ** and / are assumed as endogenous.
Notes: All variables are expressed in logs, except . P-values in brackets. FE: Fixed Effects. GMM: Generalized Method of Moments or Arellano and Bond (1991) two step estimator. * All regressors, except , are assumed as exogenous. ** and / are assumed as endogenous.