WORKING PAPER SERIES NO 1325 / APRIL 2011 by Philip Du Caju, François Rycx and Ilan Tojerow WAGE STRUCTURE EFFECTS OF INTERNATIONAL TRADE EVIDENCE FROM A SMALL OPEN ECONOMY WAGE DYNAMICS NETWORK
Transcript
WORK ING PAPER SER I E SNO 1325 / APR I L 2011
by Philip Du Caju,François Rycxand Ilan Tojerow
WAGE STRUCTURE EFFECTS OF INTERNATIONAL TRADE
EVIDENCE FROM A SMALL OPEN ECONOMY
WAGE DYNAMICSNETWORK
WAGE DYNAMICS
NETWORK
1 This paper is produced as part of the Wage Dynamics Network (WDN) coordinated by the European Central Bank (ECB). Financial support from
the National Bank of Belgium (NBB) is gratefully acknowledged. We thank Orley Ashenfelter, Massimillinao Bratti, Raffaello Bronzini,
David Card, Gustavo Gonzaga and Yves Zenou for very helpful discussions and comments. We also would like to thank
Statistics Belgium for giving access to the data. Opinions expressed in this article do not necessarily reflect the views
of the institutes the authors are affiliated with. Any remaining errors are those of the authors.
2 National Bank of Belgium, Boulevard de Berlaimont 14, 1000 Brussels, Belgium; e-mail: [email protected].
3 Université Libre de Bruxelles (ULB), Belgium. He is affiliated to the Centre Emile Bernheim (CEB)
and the Department of Applied Economics (DULBEA) of ULB and a research fellow of the
Institute for the Study of Labor (IZA), Germany; e-mail: [email protected].
4 FNRS researcher. He is affiliated to DULBEA (ULB) and IZA. Some of the work
for this paper was conducted while Ilan Tojerow was visiting the Center
This paper can be downloaded without charge from http://www.ecb.europa.eu or from the Social Science Research Network electronic library at http://ssrn.com/abstract_id=1799887.
NOTE: This Working Paper should not be reported as representing the views of the European Central Bank (ECB). The views expressed are those of the authors
and do not necessarily reflect those of the ECB.
WORK ING PAPER SER I E SNO 1325 / APR I L 2011
WAGE STRUCTURE EFFECTS
OF INTERNATIONAL TRADE
EVIDENCE FROM A SMALL
OPEN ECONOMY 1
by Philip Du Caju 2, François Rycx 3 and Ilan Tojerow 4
In 2011 all ECBpublications
feature a motiftaken from
the €100 banknote.
Wage Dynamics Network
This paper contains research conducted within the Wage Dynamics Network (WDN). The WDN is a research network consisting of economists from the European Central Bank (ECB) and the national central banks (NCBs) of the EU countries. The WDN aims at studying in depth the features and sources of wage and labour cost dynamics and their implications for monetary policy. The specific objectives of the network are: i) identifying the sources and features of wage and labour cost dynamics that are most relevant for monetary policy and ii) clarifying the relationship between wages, labour costs and prices both at the firm and macro-economic level.
The refereeing process of this paper has been co-ordinated by a team composed of Gabriel Fagan (ECB,
Bihan (Banque de France) and Thomas Mathä (Banque centrale du Luxembourg).
form, to encourage comments and suggestions prior to final publication. The views expressed in the paper are the author’s own and do not necessarily reflect those of the ESCB.
The paper is released in order to make the results of WDN research generally available, in preliminary
The WDN is chaired by Frank Smets (ECB). Giuseppe Bertola (Università di Torino) and Julián Messina
chairperson), Philip Vermeulen (ECB), Giuseppe Bertola, Julián Messina, Jan Babecký (CNB), Hervé Le
(World Bank and University of Girona) act as external consultants and Ana Lamo (ECB) as Secretary.
AddressKaiserstrasse 2960311 Frankfurt am Main, Germany
Postal addressPostfach 16 03 1960066 Frankfurt am Main, Germany
Telephone+49 69 1344 0
Internethttp://www.ecb.europa.eu
Fax+49 69 1344 6000
All rights reserved.
Any reproduction, publication and reprint in the form of a different publication, whether printed or produced electronically, in whole or in part, is permitted only with the explicit written authorisation of the ECB or the authors.
Information on all of the papers published in the ECB Working Paper Series can be found on the ECB’s website, http://www.ecb.europa.eu/pub/scientific/wps/date/html/index.en.html
ISSN 1725-2806 (online)
3ECB
Working Paper Series No 1325April 2011
Abstract 4
Non-technical summary 5
1 Introduction 7
2 Inter-industry wage differentials: what do we know? 9
2.1 Inter-industry wage differentials and international trade: how does it work? 12
3 Data and methodology 14
3.1 Data 14
3.2 Methodology 17
4 Empirical results 19
4.1 Inter-industry wage differentials 19
4.2 Inter-industry wage differentials and international trade 21
4.3 Inter-industry wage differentials and international trade: does the country of origin matter? 23
5 Conclusion 25
References 26
Tables and fi gures 34
Appendices 39
CONTENTS
4ECBWorking Paper Series No 1325April 2011
Abstract In the last decades, international trade has increased between industrialised countries and between high- and low-wage countries. This important change has raised questions on how international trade affects the labour market. In this spirit, this paper aims to investigate the impact of international trade on wage dispersion in a small open economy. It is one of the few to: i) use detailed matched employer-employee data to compute industry wage premia and disaggregated industry level panel data to examine the impact of changes in exports and imports on changes in wage differentials, ii) examine the impact of imports according to the country of origin. Looking at the export side, we find a positive effect of exports on the industry wage premium. The results also show that import penetration from low–income countries has a significant and negative impact on the inter-industry wage differentials, while imports from high-income countries seem to have a more ambiguous impact on the wage structure. The results suggest that trade with low-income and high-income countries has different effects on the inter-industry wage differentials.
Keywords: Wage Structure; Inter-industry Wage Differentials; International Trade; Matched
Employer-employee Data.
JEL Classification: F16; J31.
5ECB
Working Paper Series No 1325April 2011
Non-technical summary
In the last decades, international trade has increased between industrialised countries and
between high- and low-wage countries. These important changes have raised questions on
how international trade affects the labour market. he impact of globalisation on labour-market
outcomes is tackled through different trade and labour market models (e.g. Heckscher-Ohlin
trade or specific-factor models). Moreover, a wide range of aspects and potential outcomes of
globalisation is considered i.e. impact of changes in trade protection, import penetration or
export shares on employment, wage inequalities or the return to workers’ characteristics.
tudies on the wage consequences of international trade generally examine the latter’s impact
on the return to workers’ characteristics. However, a growing number of papers focus on the
sectoral affiliation of the workers to analyse trade effects on wages. In this case, the wage
differential attributed to the workers’ industry affiliation is examined to understand the effects
of globalisation on earnings.
Trade effects on inter-industry wage differentials can pass through several channels. Strong
import growth or trade liberalisation reforms may involve pro-competitive effects in the
product market; trade changes may have an impact on industry- or firm-level productivity;
growth in the import penetration level may be considered as a shock to labour demand.
Regarding the export side, high-export sectors offer high wages as the result of relatively
favourable foreign demand shocks. From a monetary policy perspective, inter-industry wage
differentials are of interest in the sense that they point to relative wage rigidity, which in turn
can influence wage adjustment to shocks and so the effect of monetary policy measures.
In this paper, we investigate the impact of international trade on wage premia in a small open
economy, i.e. Belgium. More precisely, our objective is to examine the following questions:
Do workers in export-intensive sectors earn higher wages? Do workers in import-intensive
sectors earn lower wages? Does the country of origin of imports matter? Are the size of wage
differentials in import-intensive sectors different when imports are principally coming from
low-income countries or middle- to high-income countries? To address these questions, we
rely on detailed matched employer-employee data (SES-SBS) covering all years from 1999 to
2006. This data contains detailed information on firm characteristics and on individual
workers. SES-SBS is merged with data on international trade (at the NACE three-digit level)
coming from the NBB International Trade dataset.
6ECBWorking Paper Series No 1325April 2011
The paper is one of the few to: i) use detailed matched employer-employee data to compute
industry wage premia and disaggregated industry level panel data to examine the impact of
changes in international trade on changes in wage differentials, ii) examine the impact of
imports according to the country of origin. Results are very stable across specifications and
systematically show that high export exposure is correlated with higher industry wage
differentials, while imports have a negative impact on them. Moreover, results indicate that
import penetration from low–income countries has a significant and negative impact on the
inter-industry wage differentials, while imports from high-income countries seem to have a
more ambiguous impact on the wage structure. Findings thus suggest that trade with low-
income and high-income countries may have different effects on the inter-industry wage
differentials.
7ECB
Working Paper Series No 1325April 2011
1. Introduction
In the last decades, international trade has increased between industrialised countries and
between high- and low-wage countries. As an example, the trade-to-GDP ratio in OECD
countries increased from 13% in 1970 to more than 28% in 2007. In the EU27, the trade
openness ratio was 40% in 2007, while it was above 50% for small countries (OECD, 2009).
Globalisation is also reflected in the increased dispersion of geographical partners of OECD
countries.
These important changes have raised questions on how international trade affects the labour
market. Hence, a vast literature scrutinizes trade mechanisms to better understand both labour
demand and wage structure changes (Slaughter, 1999). The impact of globalisation on labour-
market outcomes is tackled through different trade and labour market models (e.g. Heckscher-
Ohlin trade or specific-factor models). Moreover, a wide range of aspects and potential
outcomes of globalisation is considered i.e. impact of changes in trade protection, import
penetration or export shares on employment, wage inequalities or the return to workers’
characteristics, such as education (e.g. Freeman, 1995; Kugler and Verhoogen, 2009; Melitz,
2003 Verhoogen, 2008; Wood, A., 1994).
In the case of developed countries, an important part of the literature concentrates on the role
of imports from low-wage countries to explain the increasing pressure on unskilled labour
markets (Freeman, 1995). Particular attention is devoted to the effects of trade on low-skilled
employment and on the evolution of the skilled/unskilled wage ratio. Studies on the wage
consequences of international trade generally examine the latter’s impact on the return to
workers’ characteristics (Pavcnik et al., 2004). However, a growing number of papers focus
on the sectoral affiliation of the workers to analyse trade effects on wages (Hoekman and
Winters, 2005). In this case, the wage differential attributed to the workers’ industry
affiliation is examined to understand the effects of globalisation on earnings. Given that the
existence of sectoral effects on workers’ wages is a stylised fact in the economic literature
(Krueger and Summers, 1988; Vainiomäki et al., 1995; Hartog et al., 2000; Du Caju et al.,
2010), some authors argue that studies that do not take into account the industry affiliation
may neglect an important channel through which trade affects wages (Pavcnik et al., 2004).
Trade effects on inter-industry wage differentials can pass through several channels. First,
strong import growth or trade liberalisation reforms may involve pro-competitive effects in
8ECBWorking Paper Series No 1325April 2011
the product market that may influence industry rents and therefore the industry wage structure
(Kramarz, 2008). Secondly, trade changes may have an impact on industry- or firm-level
productivity, thereby changing industry-relative wages (Martins and Opromolla, 2009).
Thirdly, growth in the import penetration level may be considered as a shock to labour
demand that affects the industry wage structure in the presence of imperfect labour mobility
across sectors (Dutta, 2007).
Regarding the export side, Schank et al. (2007) suggest that high-export sectors offer high
wages as the result of relatively favourable foreign demand shocks. They also state that the
wage premium in exporting sectors is compatible with the turnover version of the efficiency
wage theory. For, Lundin and Yun (2009) exporting industries pay higher wages since exports
increase profits and stimulate expansion.
From a monetary policy perspective, inter-industry wage differentials are of interest in the
sense that they point to relative wage rigidity, which in turn can influence wage adjustment to
shocks and so the effect of monetary policy measures. Although the implications of
international trade for wage reactions to shocks are more relevant than those for wage levels
or differentials, the latter can help to understand wage changes in general.
The empirical literature regarding the impact of trade openness on industry wage premia is
still relatively scarce (Gaston and Trefer, 1994; Borjas and Ramey, 1995; Jean and Nicoletti,
2002; Lundin and Yun, 2009). However, the results are quite compelling. For example, Grey
(1993) and Katz et al. (1989) show for Canada and the US, respectively, that workers in
import-intensive industries have lower wage premia, while workers in export-intensive
industries receive higher wage premia. Using US data, Borjas and Ramey (1995) report a
negative impact of import penetration on wages of low-skilled workers in concentrated
industries. For Norway, Salvanes et al. (1998) find a positive relationship between the degree
of openness and wage premia. Lundin and Yun (2009) examined the situation in the Swedish
manufacturing sector. Their results indicate that industries that face intensive import
competition from low wage countries have lower wage premia. In contrast, export intensities
are not found to have a significant impact on workers’ wages.1
1 Another strand of the literature investigates how trade reforms affect inter-industry wage differentials primarily in developing countries (Robertson, 2000; Feliciano, 2001; Hasan and Chen, 2003; Pavcnik et al., 2004; Goldberg and Pavcnik, 2005; Dutta, 2007). For example, Dutta (2007) examines the link between tariff reduction and industry wage premia in India. He finds that high-tariff industries offer higher wage premia. A similar result is found for Colombia by Goldberg and Pavcnik (2005), when industry fixed effects are included in the analysis.
9ECB
Working Paper Series No 1325April 2011
In this paper, we investigate the impact of international trade on wage premia in a small open
economy, i.e. Belgium. More precisely, our objective is to examine the following questions:
1. Do workers in export-intensive sectors earn higher wages?
2. Do workers in import-intensive sectors earn lower wages?
3. Does the country of origin of imports matter? Are the size of wage differentials in import-
intensive sectors different when imports are principally coming from low-income
countries or middle- to high-income countries?
Our paper significantly contributes to the existing literature as it is one of the few to: i) use
detailed matched employer-employee data to compute industry wage premia and
disaggregated industry level panel data to examine the impact of changes in international
trade on changes in wage differentials, ii) simultaneously analyse both imports and exports,
and iii) examine the impact of imports according to the country of origin. Moreover, it is the
first to investigate the impact of trade on industry wage differentials in Belgium.
To address these questions, we rely on detailed matched employer-employee data (SES-SBS)
covering all years from 1999 to 2006. This data contains detailed information on firm
characteristics and on individual workers. SES-SBS is merged with data on international trade
(at the NACE three-digit level) coming from the NBB International Trade dataset.
The remainder of this paper is organised as follows: In the next section a review of the
literature on the magnitude and sources of inter-industry wage differentials is presented.
Section 3 describes the data and the methodology. Section 4 examines the size, dispersion and
stability of inter-industry wage differentials in the Belgian private sector over the period
1999-2006. The contribution of international trade to observed inter-industry wage
differentials is analysed in section 5. The last section concludes.
2. Inter-Industry Wage Differentials: What Do We Know?
Questions on the impact of trade on the industry wage premium fit into a larger empirical
debate reopened in the late eighties about the causes of wage inequalities. Several papers
Jean and Nicoletti (2002) also report a positive impact of tariffs on wages using panel data for 12 OECD countries. In contrast, Pavcnik et al. (2004) obtain no significant effect between changes in trade policy and changes in industry wage premia in Brazil.
10ECBWorking Paper Series No 1325April 2011
emphasised that pay differentials existed in the U.S. between workers with the same
observable individual characteristics and working conditions but employed in different sectors
(Dickens and Katz, 1987; Krueger and Summers, 1988; Katz and Summers, 1989). In recent
years, comparable results have been obtained for a large number of countries (Araï et al.,
1996; Hartog et al., 1997, 2000; Lucifora, 1993; Vainiomäki and Laaksonen, 1995). In
parallel, it has been shown that the structure of inter-industry wage differentials is quite
consistent and strongly correlated between countries, but that its scale varies considerably
between industrialised countries (Barth and Zweimüller, 1992; Edin and Zetterberg, 1992;
Helwege, 1992; Zanchi, 1992; Kahn, 1998; Teulings and Hartog, 1998; Björklund et al.,
2007; Gannon et al., 2007; Du Caju et al., 2010).
Overall, these different results suggest that individual wages are not solely determined by
personal productive characteristics and task descriptions, but also by employer features. They
might nevertheless also derive from the fact that the unobserved qualities of the labour force
are not randomly distributed across industries. Gibbons and Katz (1992) test this hypothesis
and find for the U.S. that the magnitude of the industry wage differentials is almost
undiminished when estimating wage equations in first differences rather than in levels. Their
findings thus indicate that the workers’ sectoral affiliation does matter. The unobserved
quality explanation has also been tested for Portugal by Martins (2004a) and for eight
European countries by Du Caju et al. (2010). These results also suggest that non-competitive
forces may play an important role in the wage determination process. In contrast, findings of
Goux and Maurin (1999) and Abowd et al. (1999) show that individual fixed effects explain a
large fraction of the estimated inter-industry wage differentials in France. A similar result has
been found for the UK (Benito, 2000; Carruth et al., 2004), the US (Björklund et al., 2007)
and Scandinavian countries (Björklund et al., 2007).
All in all, there is no consensus regarding the exact scale of the industry wage premium.
Moreover, while studies on industry wage premia offer some evidence against the perfectly
competitive model, they hardly allow one to discriminate between alternative models
supporting the existence of an effect of employer characteristics on wages (Krueger and
Prima facie, wage disparities observed between sectors support the efficiency wage theory.
Indeed, this theory shows that if the incentive conditions for effort vary between sectors, then
two workers with identical productive characteristics and working conditions are likely to
11ECB
Working Paper Series No 1325April 2011
earn different wages. For instance, according to the effort version of the efficiency wage
theory, large companies would find it in their interest to offer relatively higher wages to their
employees because they face higher costs to monitor effort.
However, this theory does not explain why the scale of inter-industry wage differentials varies
between countries and appears to be more compressed in corporatist countries. The motives
for companies to pay efficiency wages, i.e. wages above the competitive level, actually appear
to be similar among industrialised countries. Therefore, some authors (e.g. Teulings and
Hartog, 1998) believe that the explanation put forward by Holmlund and Zetterberg (1991),
based upon the rent sharing theory, is more compelling.
Holmlund and Zetterberg (1991) showed that the influence of sectoral conditions (variations
in prices and productivity) on wages is strong in the U.S., moderate in Germany and low in
the Scandinavian countries. The elasticity between the sectoral environment and wages thus
appears to be more pronounced in non-corporatist countries. Put differently, the determination
of wages would depend more on the general macro-economic conditions in corporatist
countries. This may be due to the fact that explicit or implicit coordination of wage bargaining
in corporatist countries restricts workers’ insider power, or, in other words, their ability to
obtain a portion of the sectoral rents. It is also argued that the policy of ‘wage solidarity’
pursued by unions in most corporatist countries reinforces this phenomenon (Vainiomäki and
Laaksonen, 1995). In sum, this strand of the literature suggests that rent sharing is partly
responsible for observed sectoral wage premia and for their apparently higher dispersion in
non-corporatist countries.
Additional evidence on the existence and magnitude of rent sharing is provided by studies that
directly estimate the elasticity between wages and profits (or value-added) with firm-level or
matched worker-firm data (Araï, 2003; Blanchflower et al., 1996; Christophides and Oswald,
1992; Fakhfakh and FitzRoy, 2004; Goos and Konings, 2001; Hildreth and Oswald, 1997;
Margolis and Salvanes, 2001; Martins 2004b; Rycx and Tojerow, 2004; Van Reenen, 1996).
Findings from this literature show that profitable firms pay higher wages even after detailed
personal and firm characteristics are controlled for.
In the case of Belgium, Du Caju et al. (2010) have shown how rent sharing contributes to the
explanation of inter-industry wage differentials. In their paper, the rent sharing phenomenon
accounts for a significant fraction of the inter-industry wage differentials. They find that the
12ECBWorking Paper Series No 1325April 2011
magnitude, dispersion and significance of inter-industry wage differentials decrease sharply
when controlling for profits.
2.1. Inter-industry Wage Differentials and International Trade: How Does it Work?
Interestingly, several papers finding a positive elasticity of salaries to firms’ quasi-rents
overcome endogeneity problems by instrumenting profits with shocks to foreign competition
(Abowd and Lemieux, 1993; Abowd and Allain, 1996). They indeed consider foreign
competition as exogenously modifying rents and, hence, collective-bargaining conditions and
rent sharing.
Hence, an imperfectly competitive labor model like rent sharing provides channels through
which international trade may affect inter-industry wage differentials (Pavcnik et al., 2004).
Borjas and Ramey (1995) show, for example, that wages are sensitive to net imports in an
open economy version of Abowd and Lemieux’s rent sharing model in which market
structures vary across sectors. Also noteworthy is that according to Abowd and Kramarz
(1999) imports at the firm level have negative effects on wages in France.2
Because trade induces more competition it may impact on rents that workers are extracting
and reduce sectoral wage premia. As a result, industries with more foreign competition pay
lower wages on average. This effect differs from the potential impact of an increase in
competition on returns to skills. Even if more competition at the sectoral level leads to higher
returns to skill, wages for both high-skilled and low-skilled workers may be lower as a result
of the drop in rents. This implies that the overall effect on wages may be ambiguous and
hence raise an empirical question (Guadalupe, 2007).
Kramarz (2008) put forward that imports can affect not only overall profits, but also the result
of the wage bargaining between workers and employers. For example, importers may pay
more to their workers to neutralize hold-up opportunities when they purchase imported
intermediate inputs in advance (Martins and Opromolla, 2009). On the other hand, imports of
finished goods may have a negative impact on wages by decreasing workers’ outside
opportunities and hence their bargaining position. Several papers have focused on the impact
of deregulation on wages and found signi cant effects (Rose, 1987; Hirsch, 1993; Card,
2 However, it should be noted that more competitive arguments can also be put forward. Lawrence (2000), for instance, argues that trade may change the wage structure through its impact on technology and TFP. Moreover, Lovely & Richardson (1998) emphasize that trade can influence the return to skills and therefore also the wage structure.
13ECB
Working Paper Series No 1325April 2011
1996). In the presence of rent-sharing and trade unions, an increase in product market
competition may lead to wage compression through the weakening of union bargaining power
and a decrease in rents (Guadalupe, 2007).
In other words, international trade increases the substitutability of employees (Rodrik, 1997).
Using a production function approach as Hall (1988) and Crépon et al. (2007), Abraham et al.
(2009) try to focus simultaneously on imperfections in product and labor markets. They find
that imports decrease both markups and union bargaining power. They also show that import
competition from low-income countries has a stronger negative impact on union bargaining
power in the Belgian manufacturing sector. Bernard et al. (2006) reach similar results for the
US.
Finally, Cuñat and Guadalupe (2009) focus on the effects of imports competition on US
executive pay. They find that increases in import competition tend to make pay more sensitive
to performance.
Overall, it seems that the rent-sharing model can explain both wage differentials across
sectors and how foreign competition leads to lower wages. Hence, the empirical section
herein focuses on the role of international trade in determining the structure of observed inter-
industry wage differentials through rent-sharing mechanisms.3 In this framework, imports
increase product-market competition in import-oriented industries and, hence, decrease rents
and wages that follow. Furthermore, this negative effect will be stronger the lower the prices
are of import goods, which is the case for imports from low-income countries.4
A similar result could be explained with the specific-factor model. However, this model is
more restrictive. It assumes that workers are immobile in the short- and medium- run and that
3 The Belgian labor market is characterized by a relatively high trade union density, a large collective bargaining coverage rate, industry bargaining (essentially) and a national minimum wage. Given these features, we believe that non-competitive mechanisms have a strong potential in explaining the impact of international trade on the wage structure. This intuition is also supported by the fact that Goos and Konings (2001) and Rycx and Tojerow (2004) provide empirical evidence for the existence of rent-sharing in the Belgian private sector and that Du Caju et al. (2010) show that this rent-sharing phenomenon accounts for a significant part of inter-industry wage differentials.4 Dutta (2007) and Martins and Opromolla (2009) put forward another mechanism that can take place in a labor market with non-competitive features. In this case, rent sharing follows the impact of trade changes on industry- or firm- level productivity, thereby changing industry-relative wages. This explanation concerns precisely more imports of inputs than overall imports of any kind of goods. Access to higher-quality or cheaper intermediate inputs results in higher profits and, hence, in higher wages.
14ECBWorking Paper Series No 1325April 2011
skills are industry-specific. These are two assumptions that are not necessary to explain the
impact of trade on sectoral wage premia within the rent sharing model.5
Regarding the export side, Lundin and Yun (2009) suggest that exports increase profits and
stimulate expansion. In the short run, this situation brings firms to compete more for the same
workforce and as a result, wages increase across the whole industry. Martins and Opromolla
(2009) refer to hold-up opportunities for employees working in the case of export firms
having to make export-related investments. Moreover, in a rent sharing framework, the fact
that exporters are more productive translates into higher wages (De Locker, 2007; Martins
and Opromolla, 2010; Van Biesebrock, 2005).
Schank et al. (2007) propose another argument to explain why exporting industries pay higher
wages. They suggest that high-export sectors offer high wages as the result of relatively
favorable foreign demand shocks. They also put forward that the wage premium in exporting
sectors is compatible with the turnover version of the efficiency wage theory. The point is that
high-export industries succeed thanks to their product quality advantage and the associated
highly qualified workforce. Since this kind of workforce is relatively rare and involves higher
turnover costs, it is argued that firms in these sectors offer wages above the market level to
secure their competitive advantage in the global market.
3. Data and Methodology
3.1. Data
The present study is based upon the SES-SBS, the Belgian linked employer-employee dataset
and the NBB International Trade dataset. While the former contains detailed information on
both workers and firms, the latter gathers import and export flows by industry and country of
origin.
Our linked employer-employee data (SES-SBS) is obtained through the combining of the
Structure of Earnings Survey (SES), and the Structure of Business Survey (SBS) for all years
from 1999 to 2006.6
5 In the case of the standard Hecksher-Ohlin-Samuelson model, inter-industry wage differentials are difficult to explain since factors are mobile and their prices equalize across industries. 6 Due to its cross-sectional nature, workers cannot be followed across time within or between firms.
15ECB
Working Paper Series No 1325April 2011
SES-SBS covers Belgian establishments employing at least ten workers and with economic
activities within sections C to K of the NACE Rev. 1 classification. The survey contains a
wealth of information, provided by establishments’ management, both on firms (e.g. sector of
activity, size of the establishment, and level of wage bargaining) and individual workers (e.g.
education, age, seniority, number of working hours paid, gender, occupation, gross hourly
wages, annual bonuses).7 Gross hourly wages – excluding bonuses8 – are calculated by
dividing total gross earnings (including earnings for overtime hours and premiums for shift
work, night work and/or weekend work) in the reference period (October) by the
corresponding number of total paid hours (including paid overtime hours). Gross hourly
wages – including bonuses – are obtained by adding to the gross hourly wages (excluding
bonuses) the annual bonuses divided by: i) the number of months to which the bonuses
correspond and ii) the total number of paid hours in the reference period, respectively.
After the exclusion of individuals for whom one of the variables used entailed an incorrect or
missing observation, the final samples contain between 94,476 (in 1999) and 105,596 (in
2006) individuals.9
Data on international trade (at the NACE three-digit level) are coming from the NBB
International Trade dataset. They include data on exports and imports by industry and trading
origin. Information on domestic competition (i.e. the Herfindahl index), to be included as a
control variables in the regressions (see below), is extracted from the Structure of Business
Survey.
Table 1 presents domestic competition, import and export exposure, over time. While exports
are measured by the ratio of export to total turnover, imports are expressed by the ratio of
import to consumption i.e. output and imports minus exports.10 Import penetration is
measured overall and by country groups. These groups are based on the World Bank
7 The SES is conducted on the basis of a two-stage random sampling approach of enterprises or local units (first stage) and employees (second stage). The establishments, randomly chosen from the population, report data on a random sample of their workforce. The SES is thus a stratified sample. The stratification criteria refer to the region where the local unit is located (NUTS categories), the principal economic activity (NACE groups) and the size of the local unit (this size is determined by data collected from the Social Security Organisation). Sampling percentages of local units depend positively on the size of the unit. Within a local unit, the number of workers to be considered also depends on size, but negatively. Because of this sampling strategy, weights have to be used to extrapolate employees and local units in the sample to the entire stratum. For more details see Demunter (2000). 8 Annual bonuses include irregular payments which do not occur during each pay period, such as pay for holidays, 13th month or profit-sharing. 9 Descriptive statistics relative to the merged SES-SBS samples are reported in Appendix 1. 10 Total turnover and output are extracted from the firms’ annual accounts.
16ECBWorking Paper Series No 1325April 2011
Analytical Classification presented in World Development Indicators (GNI per capita in US$
Atlas method: gross national income divided by mid-year population). Countries are classified
according to 2000 GNI per capita. The groups are: low income (L), $755 or less; lower
middle income (LM), $756 to $2995; upper middle income (UM), $2996 to $9265; and high
income (H), $9265 or more. The Herfindahl index corresponds to the sum of squared market
shares at the three-digit sector level.
[Insert Table 1 about here]
As shown in Table 1, the export ratio varies between 0.327 in 1999 and 0.331 in 2006. Rather
stable over time, it shows the importance of exports for Belgian firms. For imports, we
observe that Belgian firms are highly exposed to competition from abroad. Around 40 percent
of consumption comes from abroad. While most of the imports are coming from high income
countries, the share from middle and low income countries has increased over time.
[Insert Figure 1 about here]
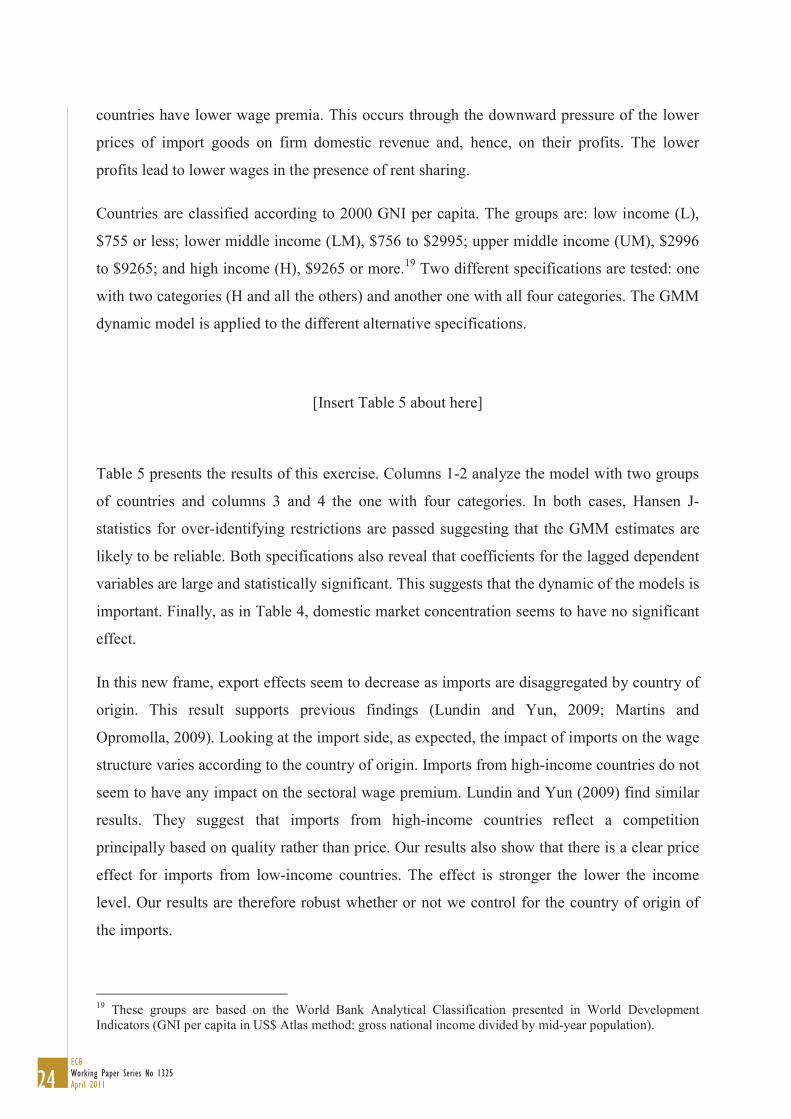
Figure 1 shows means, top 15 and bottom 15 of gross hourly wages for Nace 3-digit
industries for the years 1999 and 2006. We note that on average, the gross hourly wage
including bonuses has been increasing from 14.5 EUR in 1999 to 17.2 EUR in 2006. Figure 1
reveals in addition that mean gross hourly wages fluctuate considerably across sectors. In
1999, the best paying industry is the manufacture of refined petroleum products (Nace 232).
The average worker there earns around 24.6 EUR per hour (26.4 EUR per hour in 2006). This
sector is followed by Real estate activities with own property (Nace 701), Manufacture of
basic chemicals (Nace 241), Research and experimental development on natural sciences and
engineering (Nace 731) and Other computer related activities (Nace 726).
The Bars sector is at the very bottom of the wage scale. The average worker’s hourly wage
here is 7.8 EUR (11.5 EUR per hour in 2006), approximately 200 percent less than that of the
17ECB
Working Paper Series No 1325April 2011
average worker in the best paying industry.11 At the bottom of the scale, we likewise find
Restaurants (Nace 553), Camping sites and other provision of short-stay accommodation
(Nace 552), Industrial cleaning (Nace 747) and Canteens and catering (Nace 555).
Where do these substantial gross wage differentials come from? Can they solely be accounted
for by sectoral heterogeneity in workers’ productive characteristics, working conditions and
specific features of the employers in each firm? Or do they also derive from changes in
international trade? These questions, among others, are analysed in the remainder of this
paper.
3.2. Methodology
To measure the effects of trade on the industry wage structure, we adopt a two-step estimation
procedure:
First, we estimate industry wage differentials at the NACE three-digit level for every year
from 1999 to 2006. The methodology adopted to estimate inter-industry wage differentials
and their dispersion is consistent with that of Krueger and Summers (1988). However, the
standard errors of these differentials have been corrected according to Haisken-DeNew and
Schmidt (1997). This strategy rests upon the estimation, for all the years from 1999 to 2006,
of the following semi-logarithmic wage equation:
ijjkijij ZXwln (1)
with wij the gross hourly wage (including bonuses) of worker i in firm j; Xij the individual
characteristics of worker i in firm j (a dummy for sex, 6 dummies for the highest completed
level of education, 8 dummies for the age of the worker, 3 dummies for the number of years
of tenure, 2 dummies for the type of employment contract, a dummy indicating if the worker
is part-time, a variable showing whether the individual received a bonus for shift, night and/or
weekend work, a dummy for paid overtime and 22 occupational dummies); k the sector
effect (dummy variables relating to individuals’ sectoral affiliation, nomenclature available at
11 To a lesser extent, the 25% percentile and 75% percentile (12.2 EUR & 16.2 EUR respectively) also confirm the existence of gross wage differentials across sectors.
18ECBWorking Paper Series No 1325April 2011
the NACE three-digit level); Zj the characteristics of firm j (7 dummies for the size of the
establishment, a dummy for the type of financial and economic control and a dummy for the
level of collective wage bargaining).
Next, industry wage differentials estimated at the NACE three-digit level for the years 1999
to 2006 are pooled together and used as a dependent variable in a regression aiming to
examine the impact of international trade on wage premia. More precisely, following Lundin
and Yun (2009), we regress industry wage differentials on import penetrations and export
ratios, controlling for domestic competition (Herfindahl index). Since the dependent variable
in this stage is the estimate from equation (1), it is weighted using the inverse of the standard
errors of the industry wage premium. The point is that we want to give more weight to
industry wage premia that are more precisely estimated (i.e. with least variance). The model is
therefore estimated with weighted least squares (WLS) and specified as follows:
where Importkt and Exportkt are import penetrations and export ratios, respectively, at the
three digit level. HIndexk,t is a proxy for domestic competition (i.e. the Herfindahl index).
Finally, DYt is a vector of year dummies. Sensitivity tests are also performed to examine
whether the impact of imports on industry wage premia depends on the country of origin.
The most straightforward approach to estimating equation (2) is to run pooled OLS with year
fixed effects. This approach might however lead to biased and inconsistent estimates due to a
simultaneity problem between wages and export and/or import flows. Indeed, technical
changes or adverse shocks to labor costs could bring reverse causation and, hence, biased and
inconsistent estimates (Feliciano, 2001; Bertrand, 2004). In this case, the OLS-estimate of
import penetration is upward biased and the estimate for export orientation is downward
biased.
To account for this issue, we applied two-stage least squares (2SLS), using lagged variables
as instruments for contemporaneous export ratio and import penetration. We believe that our
instrumenting strategy is of potential interest since we expect lagged variables to be
uncorrelated (or at least less correlated) with the error term and highly correlated with the
19ECB
Working Paper Series No 1325April 2011
endogenous variable (i.e. contemporaneous export ratio and import penetration).12 However,
caution is required given that import and export ratios are relatively persistent over time.
Besides endogeneity problems, running pooled OLS does not allow us to take into account
industry fixed unobserved heterogeneity. For this reason, we are also estimating our model in
a more complete specification with a set of industry dummies that allows to focus on the
within-industry variations of wage premiums over time. Although fixed-effect estimators
control for the unobserved sectoral heterogeneity, they might suffer, like OLS estimates, from
potential endogeneity problems. Hence, the last specification is based on Generalized Method
of Moments (GMM) estimators. This instrumental variables approach not only allows to
control for endogeneity of all the time-varying trade variables, but also for a left-hand-side
variable that depends on its own past realization (Arellano and Bond, 1991; Blundell and
Bond, 1998). Implying the assumption of no serial correlation, it exploits the moment
restriction around the error term to increase the number of instruments.
4. Empirical Results
4.1. Inter-industry Wage Differentials
Inter-industry wage differentials are estimated on the basis of equation (1) using as a
dependent variable the (log of) individual gross hourly wages including annual bonuses.13
Table 2 reports best- and worst- paying industries at the Nace three-digit level over the period
1999-2006.14 These are shown as deviations from the employment-weighted mean. As a
summary statistic, we present the employment-weighted and adjusted standard deviation of
the inter-industry wage differentials. Results show, for all the years from 1999 to 2006, the
existence of wage differentials between workers employed in different sectors, even after
controlling for a large number of individual and establishment characteristics. Between 74
and 83 percent of these differentials are statistically significant at the 10 percent level.
12 Other instruments used in the literature to control for the endogeneity include exchange rate variations, past technological innovations and sales (Bertrand, 2004; Revenga, 1992). 13 Results from the wage regressions are reported in Appendix 2. 14 The complete set of results, i.e. the 139 inter-industry wage differentials by year at the NACE three-digit level, are available upon request.
20ECBWorking Paper Series No 1325April 2011
[Insert Table 2 about here]
The best-paying industry over the period 1999-2006 is, ceteris paribus, Manufacture of
refined petroleum products (232). Depending on the period under investigation, the average
worker earns there between 0.252 log points in 2003 and 0.341 log points in 2001 more than
the average worker in the whole economy. At the top of the conditional wage distribution, we
also find the Manufacture of basic chemicals (241), Manufacture of other chemical products
(246), Other financial intermediation (652) and Real estate activities with own property (701).
At the bottom of the scale, we find, amongst others, Manufacture of other wearing apparel
and accessories (182), Manufacture of jewelry and related articles (362), Hotels (551),
Camping sites (552), Restaurants (553), Bars (554) and Canteens and catering (555).15
Results in Table 2 also show that the dispersion of inter-industry wage differentials, measured
by the weighted adjusted standard deviation (WASD) of inter-industry wage premia, varies
between 0.075 in 2006 and 0.109 in 2005.
[Insert Table 3 about here]
Table 3 shows how the hierarchy of sectors in terms of wages is correlated over time.
Correlation coefficients between the wage differentials estimated for all years from 1999 to
2006 vary between approximately 0.75 and 0.89 percent. These correlations suggest that the
estimated wage differentials between industrial sectors do not derive from transitory
differences in demand or supply across industries.16 Hence, the next section focuses on how
inter-industry wage differentials may be related to international trade and domestic product
market competition.
15 See Du Caju et al. (2010) for detailed analysis of inter-industry wage differentials in Belgium. 16 Yet, it could be argued that the unobserved quality of the labour force is not randomly distributed across sectors. In other words, high-paying industries might simply be those in which the non-observed quality of the labour force is the highest. To examine this issue, we applied Martins’ (2004a) methodology to all the waves of the SES-SBS from 1999 to 2006. Empirical results (available on request) suggest that the contribution of unobserved ability to inter-industry wage differentials in Belgium is limited and hence that other explanations deserve to be investigated.
21ECB
Working Paper Series No 1325April 2011
4.2. Inter-industry Wage Differentials and International Trade
In this section, we present evidence on how, ceteris paribus, sectoral wage premia change in
industries facing increases in export ratio or/and import penetration. We first discuss results
for wage premia and trade intensity from the different models described in the methodology
section (OLS, 2SLS, FE & SYS-GMM). In order to test more precisely how import
penetration affects the sectoral wage structure, we focus in the second part of this section on
the differential impact of changes in import competition from high- versus low-income
countries, controlling for export ratio and domestic market competition. These different
specifications are estimated with the more complete model i.e. Generalized Method of
Moments.
Table 4 shows the effect of international trade on the wage premium. In a first stage, we
estimate this equation by ordinary least squares (OLS) with year-fixed effects and standard
errors that are robust to heteroscedasticity and serial autocorrelation. Our benchmark
regression clearly supports the hypothesis that inter-industry wage differentials are
significantly related to trade flows. First, we find that the coefficient on total import
penetration is negative and significant. This result is consistent with previous work (Revenga,
1992; Bertrand, 2004; Cunat and Guadalupe, 2009). Looking at the export side, we find a
positive effect of exports on the industry wage structure. This result is compatible with the
hypothesis that the increase in profits generated by achieving a competitive position in export
markets does generate higher wages. These findings put in perspective contrasting results
obtained by Lundin and Yun (2009) for Sweden. Our results, nevertheless, are in line with
Schank et al. (2007) who list correlation between exports and wages in 22 countries.
Overall, results for both exports and imports seem (to some extend) in line with Budd and
Slaughter’s (2004) previous finding that profits are shared across borders. Moreover, these
results are particularly interesting since they are amongst the few to include both dimensions
of international trade, i.e. export and imports flows (Martins and Opromolla, 2009).
[Insert Table 4 about here]
Although these results seem accurate, they should be interpreted with caution. Indeed, OLS
estimates reported in Table 4 might be biased and inconsistent due to a simultaneity problem
22ECBWorking Paper Series No 1325April 2011
between industry wage premium and current export ratio and/or import penetration. We,
therefore, estimate equation (2) by two-stage least squares (2SLS). We use the lagged values
of variables as instruments. Results of our 2SLS regressions are presented in column 2 of
Table 4. We still find a significant impact of trade on industry wage differentials.17 A
comparison of columns 1 and 2 in Table 4 seems to validate the relevance of the
instrumentation strategy. While the impact of the export ratio increases from 0.129 to 0.137,
indicating that our previous estimate was downward biased, the negative influence of import
penetration changes from -0.115 to -0.131, revealing that the OLS result was upward biased.
Overall, 2SLS results seem to deal with the endogeneity problem and, hence, support the
causality effects from trade flows on industry wage differentials.
Both OLS and 2SLS may still suffer from the omission of industry fixed effects. Fixed-effect
estimators precisely deal with time-invariant unobserved heterogeneity across industries (such
as production technology or other omitted characteristics at the industry level). They are
presented in column 3 of Table 4. The inclusion of fixed effects has a clear influence on the
magnitude of the impact of export ratio and import penetration. Both coefficients drop
sharply, but are still significant and have the expected sign. In other words, when we rely
solely on within-industry variation, import penetration still has a negative impact on sectoral
wage premia. The export ratio still has a positive impact.18
In addition to the OLS, 2SLS and FE results, Table 4 also presents (static and dynamic)
GMM-SYS estimates. According to Bond (2002, p.156), "Adopting a dynamic specification
is sometimes useful for identifying the parameters of interest, even when the dynamics
themselves are not the principal focus of attention."
Overall, this specification allows us to control for potential endogeneity problems, sectoral
unobserved time-invariant heterogeneity and time effects (Blundell and Bond, 1998). The
dynamic version of the GMM-SYS estimator also controls for the potential state dependence
in the dependent variable. The GMM-SYS specification combines an equation in first
differences with an equation in level. Moreover, variables in the differenced equation are
17 Note that: a) all coefficients in the first-stage regressions are jointly significant at the 1 percent level, b) regression coefficients associated to our main instruments (i.e. lagged export and import ratios) are highly significant and equal to 0.976 and 0.836 respectively, c) the R² of the first-stage regressions stands at 0.97. 18 Results for imports could be interpreted as low bound estimates of their effects on wages. Wage differentials over time could also reflect changes in the firm structure across sector. In each other words, changes in wages could also results from bottom-tail firms leaving the market and hence complicating the comparability of wage differentials over time.”
23ECB
Working Paper Series No 1325April 2011
instrumented by their lagged levels and variables in the level equation are instrumented by
their lagged differences. One year lagged inter-industry wage differentials are also included
among the regressors in the dynamic version of the GMM-SYS model. Two types of tests are
used to assess the model and the validity of the GMM-estimates: the Arellano-Bond second
order autocorrelation tests for the first-differenced residuals and the Hansen test for the
validity of the over-identifying restrictions of the GMM. As shown in column 4 of Table 4,
the coefficients for the dynamic model are significant and of the expected sign. Hansen’s J-
statistic is not statistically significant suggesting that the instruments are valid, but the
autocorrelation tests reject the null of no second order autocorrelation. This casts some doubt
on the dynamic results. However, as explained by Bond (2002), when the model is over-
identified and T > 3, the validity of the assumption that there is no serial correlation can be
tested using the GMM test of over-identifying restrictions.
Finally, we extend our model to control for internal market competition by including a
variable that measures domestic market concentration by industry and year (Herfindahl
index). If the industry wage differential hypothesis is accurate, the more concentrated sectors
should pay higher wages (Guadalupe, 2007). Yet, this prediction does not seem to be valid for
sectors that are exposed to international competition in a small open economy like Belgium.
Indeed, the regression coefficient associated to the Herfindahl index is never statistically
significant (see columns 6 and 8). This result is not surprising as it simply highlights that the
Herfindahl index is not an important determinant of wage setting in sectors that are facing
strong competition from abroad. Be that as it may, findings still support the conclusions that
high export exposure is correlated with higher industry wage differentials, while imports have
a negative impact on them.
4.3. Inter-industry Wage Differentials and International Trade: Does the Country of
Origin Matter?
In this section, we test the robustness of our results with alternative specifications. We divide
imports into categories by country to assess the differentials effects of imports from different
origins on industry wage differentials. This allows us to test more accurately the rent-sharing
hypotheses presented above. Indeed, results consistent with the mechanisms outlined in
section 2 should show that sectors that face higher import competition from low-income
24ECBWorking Paper Series No 1325April 2011
countries have lower wage premia. This occurs through the downward pressure of the lower
prices of import goods on firm domestic revenue and, hence, on their profits. The lower
profits lead to lower wages in the presence of rent sharing.
Countries are classified according to 2000 GNI per capita. The groups are: low income (L),
$755 or less; lower middle income (LM), $756 to $2995; upper middle income (UM), $2996
to $9265; and high income (H), $9265 or more.19 Two different specifications are tested: one
with two categories (H and all the others) and another one with all four categories. The GMM
dynamic model is applied to the different alternative specifications.
[Insert Table 5 about here]
Table 5 presents the results of this exercise. Columns 1-2 analyze the model with two groups
of countries and columns 3 and 4 the one with four categories. In both cases, Hansen J-
statistics for over-identifying restrictions are passed suggesting that the GMM estimates are
likely to be reliable. Both specifications also reveal that coefficients for the lagged dependent
variables are large and statistically significant. This suggests that the dynamic of the models is
important. Finally, as in Table 4, domestic market concentration seems to have no significant
effect.
In this new frame, export effects seem to decrease as imports are disaggregated by country of
origin. This result supports previous findings (Lundin and Yun, 2009; Martins and
Opromolla, 2009). Looking at the import side, as expected, the impact of imports on the wage
structure varies according to the country of origin. Imports from high-income countries do not
seem to have any impact on the sectoral wage premium. Lundin and Yun (2009) find similar
results. They suggest that imports from high-income countries reflect a competition
principally based on quality rather than price. Our results also show that there is a clear price
effect for imports from low-income countries. The effect is stronger the lower the income
level. Our results are therefore robust whether or not we control for the country of origin of
the imports.
19 These groups are based on the World Bank Analytical Classification presented in World Development Indicators (GNI per capita in US$ Atlas method: gross national income divided by mid-year population).
25ECB
Working Paper Series No 1325April 2011
5. Conclusion
In the last decades, international trade has increased between industrialised countries and
between high- and low-wage countries. This important change has raised questions on how
international trade affects the labour market. In this spirit, this paper investigates the impact of
international trade on wage dispersion in a small open economy. The paper is one of the few
to: i) use detailed matched employer-employee data to compute industry wage premia and
disaggregated industry level panel data to examine the impact of changes in international
trade on changes in wage differentials, ii) examine the impact of imports according to the
country of origin.
Results are very stable across specifications (OLS, 2SLS, FE & GMM-SYS). They
systematically show that high export exposure is correlated with higher industry wage
differentials, while imports have a negative impact on them.
Moreover, results obtained by GMM indicate that import penetration from low–income
countries has a significant and negative impact on the inter-industry wage differentials, while
imports from high-income countries seem to have a more ambiguous impact on the wage
structure. Findings thus suggest that trade with low-income and high-income countries may
have different effects on the inter-industry wage differentials.
Results presented in this paper can be easily compared with those of Lundin and Yun (2009).
The latter examined the impact of international trade variables on inter-industry wage
differentials in the Swedish manufacturing sector over the period 1996-2000. Their estimates
suggest, in line with the present paper, that industries facing intensive import competition
from low-wage countries have lower wage premiums. In contrast, they find no significant
effect of export intensities on industry wage differentials. Yet, their study differs from present
one in several ways. Firstly, they do not control for unobserved time-invariant industry
specific effects. Secondly, they use one-year lagged international trade variables to address
the potential endogeneity issue. However, the accurateness of this approach can be discussed
as trade variables are relatively persistent over time and no over-identification test could be
performed given the use of a single instrument. Finally, the potential state dependence of
inter-industry wage differentials is not taken into account in their study. These
methodological differences (with respect to the present paper) may contribute to explain why
results are not exactly the same in both studies. In another closely related paper, Abraham et
al. (2009) analyze how increased economic integration has affected labor and product
26ECBWorking Paper Series No 1325April 2011
markets. Their results, based on a panel of Belgian manufacturing firms, show that important
competition (particularly from low wage countries) has a negative effect on both markups and
union bargaining power. Along the lines of the present paper, they thus suggest that increased
import penetration is associated with a moderation of wage claims in unionized countries.
References
Abowd, J. and Allain, L. (1996), “Compensation Structure and Product Market Competition”,
Annales d'Économie et de Statistique, No. 41/42, pp. 207-217.
Abowd, J. and Kramarz F. (1999), “Econometric Analysis of Linked Employer-Employee
Data”, Labour Economics, Vol. 6, pp. 53-74.
Abowd, J. and Lemieux, Th. (1993), “The Effects of Product Market Competition on
Collective Bargaining Agreements: The Case of Foreign Competition in Canada”, The
Quarterly Journal of Economics, Vol. 108, No. 4 (Nov., 1993), pp. 983-1014.
Abowd, J., Kramarz, F. and Margolis, D. (1999). “High Wage Workers and High Wage
Firms”, Econometrica, Vol. 67, No. 4, pp. 251-333.
Abraham, F., Konings, J. and Vanormelingen, S. (2009), “The Effect of Globalization on
Union Bargaining and Price-Cost Margins of Firms”, Review of World Economics, Vol.
145, pp. 13-36.
Arai, M. (2003). “Wages, Profits and, Capital Intensity, Evidence from Matched Worker-Firm
Data”, Journal of Labor Economics, Vol. 21, No. 3, pp. 593-618.
Araï, M., Ballot, G. and Skalli, A. (1996), “Différentiels intersectoriels de salaire et
caractéristiques des employeurs en France”, Economie et statistique, No. 299, pp. 37-
58.
Arellano, M. and Bond, S. (1991), “Some Tests of Specification for Panel Data: Monte Carlo
Evidence and an Application to Employment Equations”, Review of Economic Studies,
Vol. 58, No. 2, pp. 277-97.
Barth, E. and Zweimüller, J. (1992). “Labour Market Institutions and the Industry Wage
Distribution: Evidence from Austria, Norway and the U.S”, Empirica, Vol.19, No. 2,
pp. 181-201.
27ECB
Working Paper Series No 1325April 2011
Benito, A. (2000). “Inter-Industry Wage Differentials in Great Britain”, Oxford Bulletin of
Economics and Statistics, Vol. 62, No. 0, pp. 727-46.
Bernard, A., Jensen, J., & Schott, P. (2006), “Survival of the Best Fit: Exposure to Low Wage
Countries and the (uneven) Growth of US Manufacturing Plants”, Journal of
International Economics, Vol. 68, pp. 219–237.
Bertrand, M. (2004), “From the Invisible Handshake to the Invisible Hand? How Import
Competition Changes the Employment Relationship”, Journal of Labor Economics,
Vol. 22, No. 4, pp. 723-64.
Björklund, A., Bratsberg, B., Eriksson, T., Jäntti, M. and Raaum, O. (2007). “Inter-Industry
Wage Differentials and Unobserved Ability: Siblings Evidence from Five Countries”,
Industrial Relations, Vol. 46, No. 1, pp. 171-202.
Blanchflower, D., Oswald, A. and Sanfey, P. (1996). “Wages, Profits and Rent-Sharing”,
Quarterly Journal of Economics, Vol. 111, No. 1, pp. 227-51.
Blundell, R. and Bond, S. (1998), “Initial Conditions and Moment Restrictions in Dynamics
Panel Data Models, Journal of Econometrics, Vol. 87, pp. 115-43.
Bond, S. (2002), “Dynamic Panel Models: a Guide to Micro Data Methods and Practice”,
Portuguese Economic Journal, Vol. 1, pp. 141-62.
Borjas, G. and Ramey, V. (1995), “Foreign Competition, Market Power and Wage
Inequality”, Quarterly Journal of Economics, Vol. 110, pp. 1075-1110.
Budd, J. and Slaughter, M. (2004), “Are Profits Shared across Borders? Evidence on
International Rent Sharing”, Journal of Labor Economics, Vol. 22, No. 3, pp. 525-52.
Card, D. (1996), “The Effect of Unions on the Structural of Wages: A Longitudinal
Analysis”, Econometrica, Vol. 64, No. 4, pp. 957-79.
Carruth, A., Collier, W. and Dickerson, A. (2004). “Inter-industry Wage Differences and
Individual Heterogeneity”, Oxford Bulletin of Economics and Statistics, Vol. 55, No. 5,
pp. 811-46.
Christofides, L. and Oswald A. (1992). “Real Wage Determination and Rent-Sharing in
Gross Hourly Wages for Nace 3-Digit Industries (2006)
FIGURE 1
TABLE 1 Industry Characteristics: Trade Exposure# and Herfindahl Index+
Variables / Years 1999 2000 2001 2002 2003 2004 2005 2006 Export Ratio: a 0.327
(0.275) 0.335
(0.326) 0.340
(0.336) 0.339
(0.394) 0.330
(0.382) 0.333
(0.389) 0.330
(0.397) 0.331
(0.425) Import Penetration: b
All countries 0.414 (921)
0.379 (0.420)
0.388 (0.426)
0.402 (0.583)
0.376 (0.531)
0.378 (0.544)
0.384 (0.622)
0.384 (0.646)
High income countries (H) 0.375 (0.873)
0.335 (0.372)
0.338 (0.361)
0.346 (0.471)
0.325 (0.447)
0.324 (0.441)
0.324 (0.494)
0.320 (0.525)
Middle & low income countries (UM, LM, L)
0.042 (0.086)
0.047 (0.085)
0.053 (0.101)
0.059 (0.158)
0.054 (0.115)
0.057 (0.126)
0.063 (0.153)
0.067 (0.149)
Upper-middle income countries (UM)
0.021 (0.043)
0.022 (0.036)
0.025 (0.041)
0.027 (0.054)
0.026 (0.046)
0.027 (0.054)
0.028 (0.062)
0.030 (0.062)
Low-middle income countries (LM)
0.015 (0.039)
0.018 (0.046)
0.021 (0.059)
0.026 (0.099)
0.022 (0.66)
0.023 (0.063)
0.028 (0.084)
0.029 (0.078)
Low income countries (L) 0.006 (0.018)
0.007 (0.020)
0.007 (0.019)
0.007 (0.019)
0.006 (0.017)
0.007 (0.019)
0.007 (0.018)
0.008 (0.020)
Herfindahl Index: c 0.137 (0.145)
0.135 (0.136)
0.133 (0.128)
0.132 (0.127)
0.140 (0.142)
0.137 (0.131)
0.139 (0.134)
0.148 (0.153)
Source:# NBB International trade dataset, +Structure of Business Survey.Note: Standard deviation in parentheses. a Ratio of export to total turnover. b Ratio of import to consumption i.e. output plus imports minus exports. c Sum of squared market share at the three-digit sector level. Country groups are based on the World Bank Analytical Classification presented in World Development Indicators (GNI per capita in US$ Atlas method: gross national income divided by midyear population). Countries are classified according to 2000 GNI per capita. The groups are: low income (L), $755 or less; lower middle income (LM), $756 to $2995; upper middle income (UM), $2996 to $9265; and high income (H), $9265 or more.
35ECB
Working Paper Series No 1325April 2011
TABLE 2Inter-industry wage differentials, 1999-2006: Top & Bottom of the Wage Scale Industry (Nace 3-digit) / Data set: 1999 2000 2001 2002 2003 2004 2005 2006
Top of the wage scale: Quarrying of sand and clay (142) 0.116** 0.078** 0.143** 0.104** 0.145** 0.113** 0.088** 0.064**Manufacture of vegetable and animal oils and fats (154)
Number of industries 139 139 139 139 139 139 139 139Notes: Top 10 and bottom 10 for all the years. Standard errors of the industry wage differentials are computed according to Haisken-DeNew and Schmidt (1997). All the inter-industry wage differentials at the Nace three-digit level are available upon request. **/*/°: significance at the 1, 5 and 10 per cent level, respectively.
37ECB
Working Paper Series No 1325April 2011
TABLE 3 Pearson / Spearman Correlation Coefficients Between Inter-Industry Wage
Notes: Computation based on the inter-industry wage differentials estimated at the Nace 3 digit level. n stands for the number of sectors. **/*/°: coefficient significant at the 1, 5 and 10 per cent, respectively.
TABLE 4 International Trade and Inter-Industry Wage Premiums
OLS 2SLS FE GMM-SYS (static) GMM-SYS (dynamic) Iwd t-1
0.356** (0.067)
0.346** (0.070)
Export ratio 0.129** (0.016)
0.137** (0.019)
0.069** (0.018)
0.071*(0.032)
0.085*(0.042)
0.076*(0.038)
0.078*(0.038)
Import penetration -0.115** (0.013)
-0.131** (0.019)
-0.044** (0.004)
-0.096** (0.017)
-0.093** (0.020)
-0.058** (0.016)
-0.060** (0.016)
Herfindahl Index
-0.065 (0.114)
0.045(0.070)
Year dummies yes (8 y.) yes (8 y.) yes (8 y.) yes (8 y.) yes (8 y.) yes (7 y.) yes (7 y.) Adjusted R2 0.098 0.097 0.090 AR(2) (p-value) 0.555 0.414 0.033 0.036 Hansen test (p-value) 0.332 0.324 0.115 0.092 Number of Observations 984 984 984 984 984 861 861
Notes: Inter-industry wage differentials are estimated on the basis of equation (1). The inverse of adjusted and weighted variances of the inter-industry wage differentials are used as weight. Robust standard errors are reported in brackets. The instruments used in the 2SLS regressions (besides the exogenous variables in equation (1)) are lagged value of variables. **/*/°: coefficient significant at the 1, 5 and 10 per cent, respectively.
38ECBWorking Paper Series No 1325April 2011
TABLE 5 International Trade and Inter-Industry Wage Premiums
Middle & low income countries (UM, LM, L) -0.097* (0.041)
-0.097* (0.042)
Upper-middle income countries (UM) 0.001(0.111)
-0.020 (0.116)
Low-middle income countries (LM) -0.108° (0.066)
-0.118° 0.068
Low income countries (L) -0.361* (0.182)
-0.286° (0.163)
Herfindahl Index 0.011(0.056)
0.067(0.057)
Year dummies yes (8 y.) yes (8 y.) yes (8 y.) yes (8 y.) AR(2) (p-value) 0.034 0.036 0.017 0.026Hansen test (p-value) 0.229 0.213 0.373 0.257
Number of Observations 861 861 861 861Notes: Inter-industry wage differentials are estimated on the basis of equation (1). Robust standard errors are reported in brackets. **/*/°: coefficient significant at the 1, 5 and 10 per cent, respectively.
39ECB
Working Paper Series No 1325April 2011
APPENDIX 1 Means (standard deviations) of selected variables, 1999-2006 (SES-SBS data)
Variables / Year: 1999 2000 2001 2002 2003 2004 2005 2006 Gross hourly wage : (in EUR) includes overtime paid,
premiums for shift work, night work and/or weekend work and bonuses (i.e. irregular payments that do not occur during each pay period, i.e. pay for holiday, 13th
month, profits sharing, etc.).
14.5 (6.5)
14.7 (6.7)
14.8 (6.8)
15.2 (6.6)
15.3 (6.4)
16.5 (7.1)
17.0 (7.4)
17.2 (7.0)
Education: Primary or no degree 11.2 9.2 8.5 8.0 7.3 7.5 7.7 9.3 Lower secondary 27.9 28.6 29.3 28.2 27.1 26.8 20.9 20.0 Technical/Artistic/Prof. upper secondary 20.2 20.4 20.7 19.3 19.7 22.6 27.1 25.0 General upper secondary 16.2 17.7 16.0 19.2 19.0 16.4 16.8 19.0 Higher non-university short type 15.6 15.1 16.9 15.6 17.0 16.7 17.3 15.3 University and non-university education, long type 8.4 8.5 8.2 9.0 9.4 9.4 9.8 10.7 Post graduate or PhD 0.5 0.5 0.4 0.7 0.5 0.6 0.5 0.6
Age of the worker: 20-24 years 8.8 9.4 9.7 8.7 7.9 7.6 7.7 7.6 25-29 years 16.2 15.8 15.6 14.8 14.9 13.9 14.3 13.1 30-34 years 17.8 17.1 16.8 16.8 16.8 16.4 15.7 14.2 35-39 years 16.7 17.1 16.7 17.2 16.9 16.6 16.5 16.0 40-44 years 14.1 14.1 14.3 15.0 14.9 15.4 15.6 16.2 45-49 years 12.4 12.2 12.0 12.3 12.7 13.3 13.2 13.7 50-54 years 9.4 9.6 9.6 9.6 9.9 10.6 10.5 11.3 55-59 years 3.8 3.9 4.5 4.7 5.0 5.2 5.4 6.5 60 years or more 0.8 0.9 1.0 0.9 1.0 1.0 1.1 1.5
Seniority in the company: 0-1 year 24.0 26.6 27.5 23.1 20.4 20.0 18.3 22.7 2-4 years 18.8 19.9 21.3 24.7 25.3 23.5 21.0 17.7 5-9 years 18.5 16.0 14.7 16.1 17.8 19.6 23.4 21.3 10 years or more 38.7 37.5 36.5 36.1 36.5 36.8 37.4 38.4
Female (yes) 30.0 30.4 33.2 31.7 33.3 31.4 32.7 30.8 Paid overtime (yes) 4.2 3.5 2.5 2.2 3.2 4.3 5.4 5.2 Part time (yes) 9.1 8.8 9.5 10.3 10.0 10.4 11.9 10.8 Bonuses for shift, night and/or weekend work (yes) 15.6 14.9 14.2 14.7 15.1 14.3 15.0 15.7 Type of employment contract:
Firm-level collective agreement (yes): collective wage agreement at the firm level for blue- and/or white collars workers
28.5 28.9 26.9 27.9 28.7 30.1 30.5 29.9
Number of observations 97,476 101,551 102,687 100,586 96,724 93,326 94,423 105,596Notes: The descriptive statistics refer to the weighted sample. Descriptive statistics relative to the occupation and the sectoral affiliation of the workers are available upon request.
Number of observations 97,476 101,551 102,687 100,586 96,724 93,326 94,423 105,596Notes : The dependent variable is the individual gross hourly wage, including bonuses (ln). White (1980) heteroscedasticity-consistent standard errors are reported between brackets. a Dummy for sex; 6 dummies for education; 8 dummies for age; 3 dummies for tenure; 2 dummies for the type of employment contract; a dummy indicating if the worker is part-time; a variable showing whether the individual received a bonus for shift work, night work and/or weekend work; a dummy for paid overtime; and 22 occupational dummies. b 7 dummies for the size of the establishment (i.e. number of workers); a dummy for the establishment’s financial and economic control; and a dummy for the level of collective wage bargaining. c NACE three-digit industry classification; **/*/°: significance at the 1, 5 and 10 per cent, respectively.
Type of employment contract:
Permanent Reference category
Work ing PaPer Ser i e Sno 1118 / november 2009
DiScretionary FiScal PolicieS over the cycle
neW eviDence baSeD on the eScb DiSaggregateD aPProach