James Levinsohn Jackson Institute for Global Affairs, Yale University; Neil Rankin Economics Department, Stellenbosch University Gareth Roberts and Volker Schöer African Micro-economic Research Umbrella, University of the Witwatersrand April 2013 Wage subsidies and youth employment in South Africa: Evidence from a randomised control trial
Transcript
James Levinsohn
Jackson Institute for Global Affairs, Yale University;
Neil Rankin Economics Department, Stellenbosch University
Gareth Roberts and Volker Schöer
African Micro-economic Research Umbrella, University of the Witwatersrand
April 2013
Wage subsidies and youth employment in South Africa:
Evidence from a randomised control trial
We gratefully acknowledge funding from: the South African National Treasury and Department of Labour; the Programme to Support Pro-Poor Development (EU); the World Bank (SIEF); and 3ie. We would also like to thank the many people that have provided comments, including David McKenzie here at the World Bank
South Africa, an incredibly interesting experiment
• Largest economy in Africa • Great infrastructure • 39/185 in ease of doing business • Madiba, Desmond Tutu, Sugar Man
“I chose to travel to South Africa as part of my first overseas trip as president of the World Bank Group because of the country’s great importance to the region, continent, and the world. It is the economic engine of Africa, and its story of reconciliation after apartheid is one of the historic achievements of our time.” – Jim Kim
But, South Africa…
• GDP per capita (2000 USD) of $3825 = 31% of world average
• Massive inequality • Corruption, crime and social unrest
“There are few countries in the world that carry as big a burden of history as does South Africa. The brutality of apartheid weighs down not only the pages of the nation’s history books but contemporary policy debates, and statistics. Unemployment among Whites is at a manageable level; unemployment among Blacks would make the worst performing in the Eurozone crisis look good.” – Kaushik Basu
Youth unemployment rates
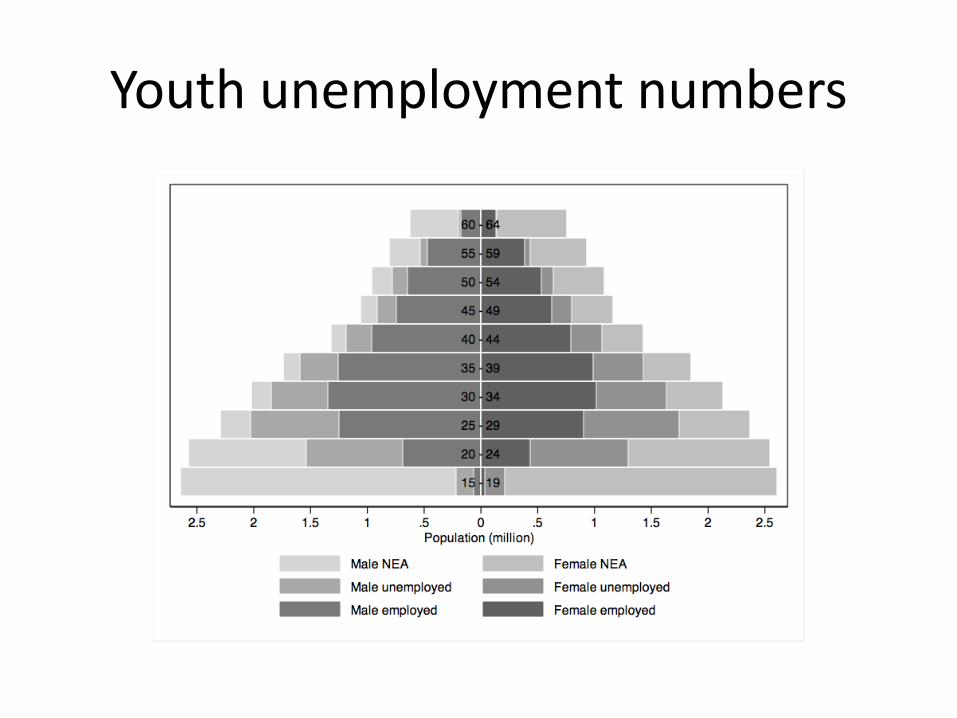
Youth unemployment numbers
A youth wage subsidy Initially proposed by Levinsohn (2008) as part of the International Growth Advisory Panel’s (the ‘Harvard’ group) suggestions A hiring voucher that would make young people cheaper to hire for a temporary period Highest correlate with current employment is previous employment; entry wages in South Africa are relatively high President Zuma formally announced it in the 2010 State of the Nation address Discussion document released in early 2011 by National Treasury
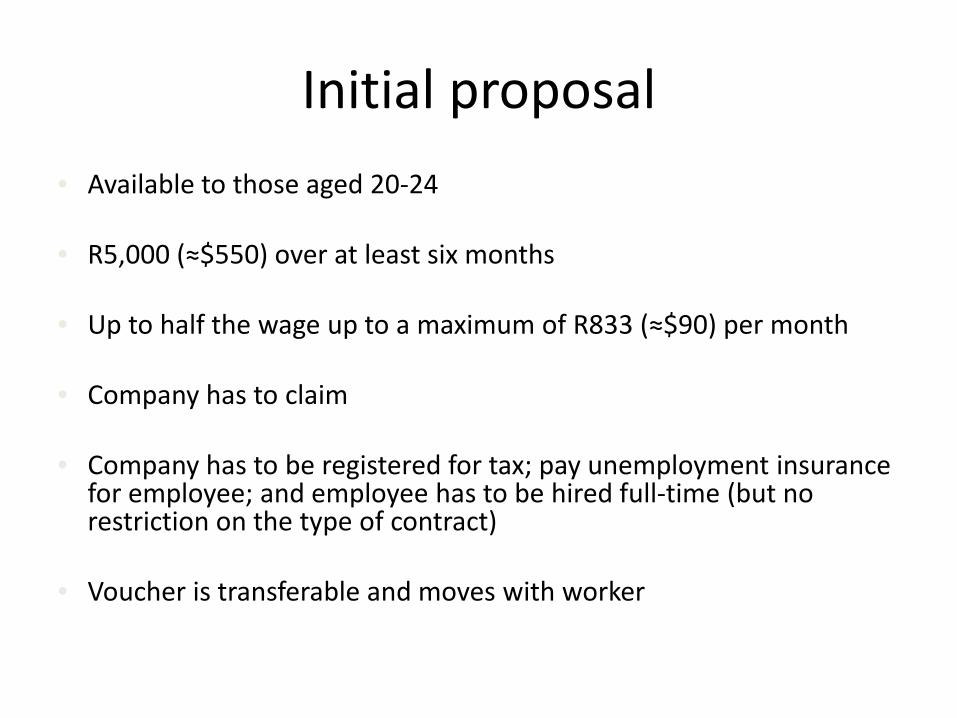
Initial proposal • Available to those aged 20-24
• R5,000 (≈$550) over at least six months
• Up to half the wage up to a maximum of R833 (≈$90) per month
• Company has to claim
• Company has to be registered for tax; pay unemployment insurance
for employee; and employee has to be hired full-time (but no restriction on the type of contract)
• Voucher is transferable and moves with worker
Currently opposed by organised labour:
“Based on Treasury’s own literature which they used to propose this ill-conceived policy, we have shown that there are no empirical grounds for this policy.” - COSTATU
Other research • Not an uncommon policy but characteristics differ across countries
• Large degree of context specificity
• Argentina: positive effects but take up from firms was low suggesting a
• Turkey: Wage subsidies led to a significant increase in jobs, mostly within firms but significant deadweight loss (Betcherman, Daysal, & Pagés, 2010)
• South African CGE simulations suggest potential large effects but driven by wage elasticity assumptions (Go et al, 2010; Burns et al 2010)
Methodology Initial baseline in 2009 (of approximately 4,000 young people), non random and includes Labour Centres Second baseline and allocation of vouchers (to all) in 2010 Voucher allocation based on pair-wise matching, where individuals were matched on geographical location, gender, education, age, number of earners in household, and activity in 2009 Follow up in 2011 and second follow up in 2012 Vouchers initially expired in March 2011 but renewed for one more year
Problems with this methodology
Voucher holders have to understand how the voucher works Voucher holders have to find firms and people in firms who regard the voucher as both genuine and as an incentive Firm HR has to be flexible Experimental context ≠ the context of a national programme (for many reasons) The voucher may just move people up the queue – may be an important problem if control group are in the same queue
Attrition
Balance
Round N Fraction remaining Control (%) Treatment (%)
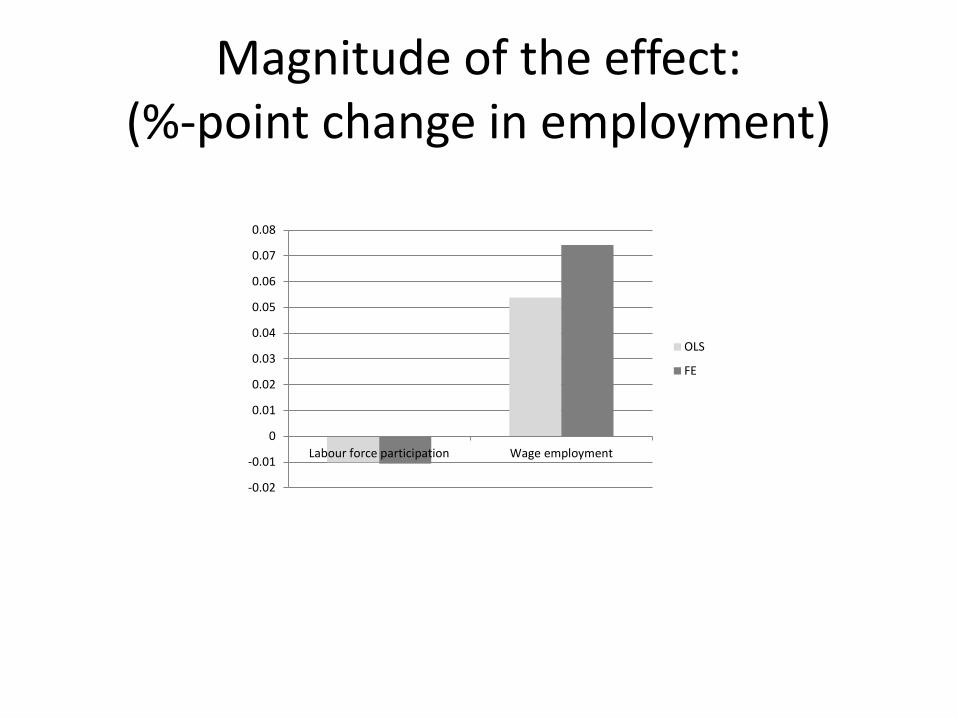
Magnitude of the effect: (%-point change in employment)
-0.02
-0.01
0
0.01
0.02
0.03
0.04
0.05
0.06
0.07
0.08
Labour force participation Wage employment
OLS
FE
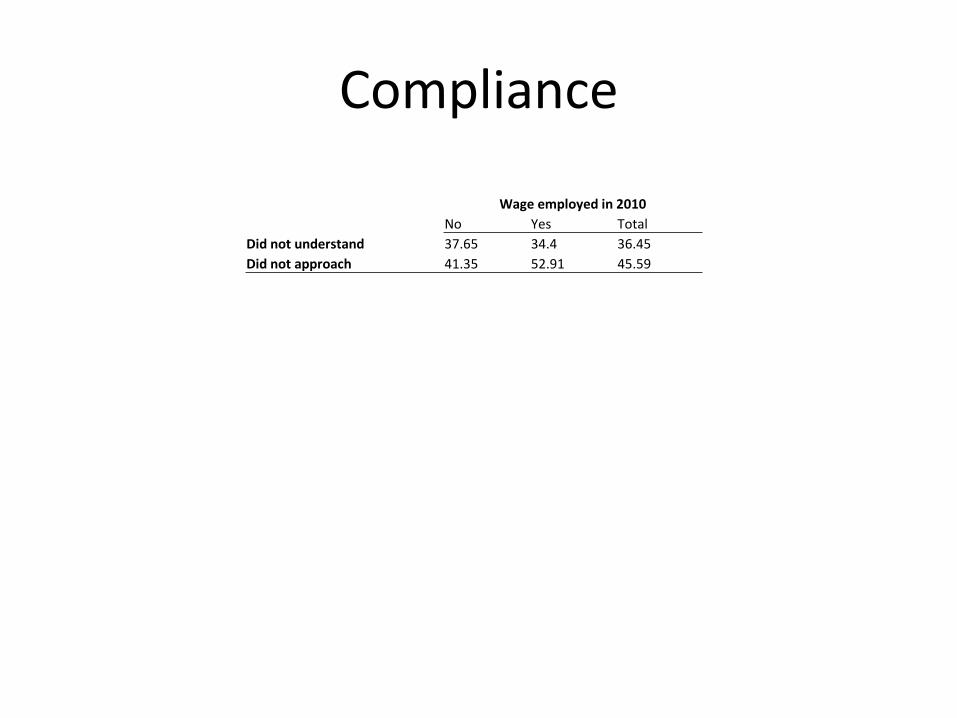
Compliance
Wage employed in 2010 No Yes Total
Did not understand 37.65 34.4 36.45 Did not approach 41.35 52.91 45.59
Instrumenting compliance
1 2 3 4 IV IV-FE IV IV-FE
Understood the voucher 0.0846*** 0.120*** (0.0294) (0.0378)
Used the voucher 0.0999*** 0.127*** (0.0351) (0.0435)
Sampling cluster fixed effects: Yes Yes Observations 2,358 2,358 2,285 2,285 R-squared 0.066 0.080 0.053 0.0722 Number of pairs 1,598 1,576 All regressions control for gender, number of earners in the household in 2009 and education level Robust standard errors in parentheses. *** p<0.01, ** p<0.05, * p<0.1
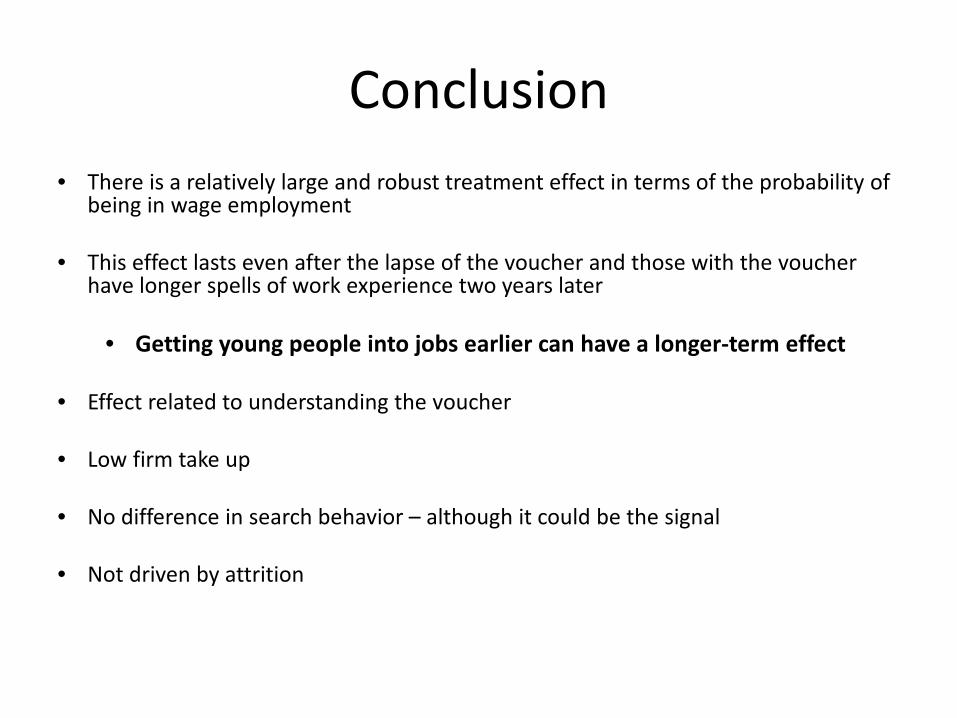
Conclusion • There is a relatively large and robust treatment effect in terms of the probability of
being in wage employment
• This effect lasts even after the lapse of the voucher and those with the voucher have longer spells of work experience two years later
• Getting young people into jobs earlier can have a longer-term effect
• Effect related to understanding the voucher
• Low firm take up
• No difference in search behavior – although it could be the signal • Not driven by attrition
National Budget Review (1/2) • Since 2009, the National Treasury has worked with the
African Micro-Economic Research Unit at the University of Witwatersrand to study the youth labour market.
• The study tracked 4 000 non-economically active and unemployed young people aged 20-24 years, and more than 600 firms, over a period of three years.
• Part of this research included testing the impact of a R5000 hiring voucher on employment outcomes. Half the sample received a hiring voucher that could be used to reduce the initial cost of labour for their prospective employer, over a minimum of six months, while leaving their wage unaffected.
National Budget Review (2/2)
• The main findings of the research included the following: – Young people who were allocated a hiring voucher
were up to 25 per cent more likely to be employed than those who were not. This effect persisted two years after the hiring voucher was allocated.
– The majority of firms stated they would not substitute older workers for younger ones if there was a youth employment incentive, in part because older workers are more reliable and experienced.


![Ancestors of Marianne Mosevius Levinsohn 435/Ancestors of... · 2019. 12. 20. · In 1917: Unteroffizier [non-commissioned officer, equivalent to corporal/sergeant], Army Battalion](https://static.documents.pub/doc/80x56/612943c8c1a5b2775b65ddd7/ancestors-of-marianne-mosevius-435ancestors-of-2019-12-20-in-1917-unteroffizier.jpg)


