National Poverty Center Working Paper Series #05-12 August 2005 Wage Trends among Disadvantaged Minorities George J. Borjas Harvard University This paper is available online at the National Poverty Center Working Paper Series index at: http://www.npc.umich.edu/publications/working_papers/ Any opinions, findings, conclusions, or recommendations expressed in this material are those of the author(s) and do not necessarily reflect the view of the National Poverty Center or any sponsoring agency.
Transcript
National Poverty Center Working Paper Series
#05-12
August 2005
Wage Trends among Disadvantaged Minorities
George J. Borjas Harvard University
This paper is available online at the National Poverty Center Working Paper Series index at: http://www.npc.umich.edu/publications/working_papers/
Any opinions, findings, conclusions, or recommendations expressed in this material are those of the author(s) and do not necessarily reflect the view of the National Poverty Center or any sponsoring agency.
Wage Trends among Disadvantaged Minorities
George J. Borjas Harvard University
August 2005
2
Wage Trends among Disadvantaged Minorities
George J. Borjas* I. Introduction
The resurgence of large scale immigration in recent decades fundamentally altered the
racial and ethnic composition of the disadvantaged population in the United States. In 1960, 21.3
percent of the working men placing in the bottom 20 percent of the wage distribution were
African American and only 3.6 percent were foreign-born. By 2000, the black share in this low-
wage workforce had fallen to 13.1 percent, but the immigrant share had risen to 17.4 percent.
It is well known that the “new immigration” contains a very large number of low-skill
workers (Borjas 1999). In fact, the data reveals that, at least through the mid-1990s, each
successive wave of post-1960 immigrants entered the United States with less earnings potential
than the preceding wave. The sizable increase in the size of the immigrant influx—as well as the
changing demographic and skill characteristics of the immigrants—can be attributed not only to
an increase in illegal immigration (it is estimated that at least 10 million illegal immigrants
resided in the country by 2005), but also to changes in legal immigration policy that emphasize
family reunification, rather than the skills of potential migrants, in the awarding of entry visas.
Inevitably, the changes in immigration policy and the lax border enforcement changed the ethnic
and racial mix of the disadvantaged population. Moreover, these changes are likely to continue
since the pace of modern immigration has not yet abated.
This paper documents and explores some of the implications of these shifts in the
demographic composition of the disadvantaged workforce. In particular, the study analyzes wage
trends among disadvantaged minorities and examines a number of factors that are likely to
influence these trends. The study uses data drawn from the 1980-2000 Integrated Public Use
3
Microdata Samples (IPUMS) of the U.S. decennial Census. Not surprisingly, the data indicate
that the racial-ethnic composition of the disadvantaged population changed dramatically in the
past two decades, becoming heavily Hispanic, and also with an increasing representation of
Asian immigrants. It seems, therefore, that our traditional stereotypes about the racial
composition of the disadvantaged workforce—based on the racial demographics that
characterized the country’s population prior to the resurgence of large scale immigration—are
due for a major overhaul.
The paper identifies and measures the importance of three factors that play important
roles in determining wage trends among disadvantaged minorities: (1) the changing composition
of particular ethnic groups in terms of both immigration status and national origin; (2) the
“excess sensitivity” shown by low-skill minorities, and particularly by low-skill immigrants, to
business cycle fluctuations; and (3) the continuing entry of large numbers of low-skill
immigrants who compete directly in the labor market with the pre-existing disadvantaged
workforce.
II. Data
The empirical analysis uses data drawn from the IPUMS files of the U.S. Census between
1980 and 2000. These data comprise a 5 percent random sample of the population. The entire
available sample in each Census is used in the empirical analysis.
The study focuses on four race-ethnic groups: whites, blacks, Hispanics, and Asians.1 The
classification of workers into these groups uses the information provided by both the race and
Hispanic origin variables in each Census. In particular, the Hispanic origin variable gives the
worker’s self-identification of Hispanic status (and also provides information on the type of
4
Hispanic ancestry). I use this variable to assign workers into the Hispanic category. I then use the
race variable to classify workers who report that they are not of Hispanic origin into the other
categories. By construction, therefore, the groups of white, black, and Asian workers are
composed entirely of persons who are not of Hispanic origin. I further classify workers in each
of the four race-ethnic groups by immigration status. A person is defined to be an immigrant if
he was born abroad and is either a non-citizen or a naturalized citizen; all other persons are
classified as natives.
It is important to emphasize that the Census data contain both legal immigrants as well as
the many illegal immigrants who answered the Census questionnaire, and that the number of
illegal immigrants enumerated by the Census increased rapidly between 1990 and 2000. The
number of foreign-born persons residing illegally in the United States was estimated to be 3.5
million in 1990 and 7 million in 2000 (U.S. Immigration and Naturalization Service 2003).2 The
Census data do not provide any information on the visa status of foreign-born persons so that it is
not possible (without making many heroic assumptions) to ascertain the trends in the skill level
of the illegal immigrant population, or to determine precisely where these immigrants fall in the
skill or wage distribution. Nevertheless, because illegal immigrants now make up at least a
quarter of the foreign-born population enumerated in the Census, it is likely the case that many
of the trends in the disadvantaged population discussed in this paper are greatly influenced by the
growth of illegal immigration.
In each Census, the study is restricted to persons aged 18-54 who work in the civilian
sector, are not enrolled in school, and do not reside in group quarters.3 Whenever appropriate, the
sampling weights reported in the 1990 and 2000 IPUMS data are used in the calculations.
5
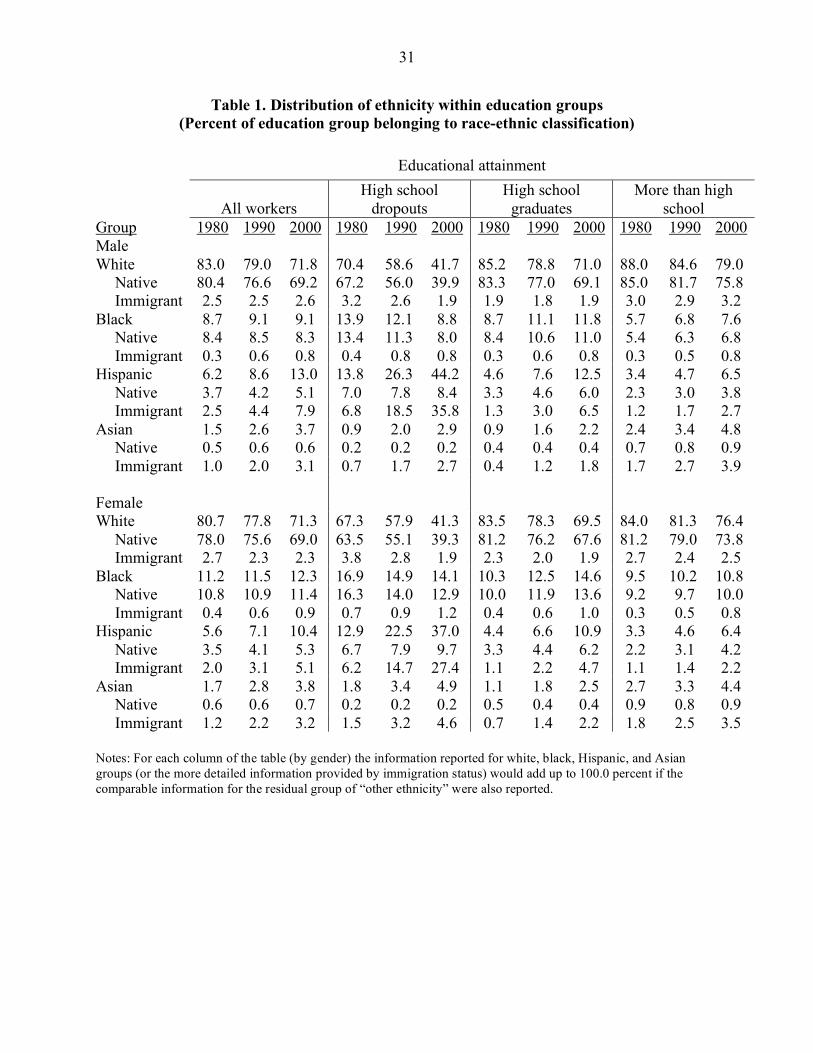
Table 1 begins the descriptive analysis by documenting the changing size of the various
race-ethnic groups between 1980 and 2000. The first three columns of the table report the
fraction of the workforce in each Census year (and by gender) that can be classified into the
various groups.4 The data document the well-known increase in the relative size of the minority
non-black workforce and the corresponding decline in the size of the white workforce. In 1980,
83.0 percent of working men were white. By 2000, this group accounted for only 71.8 percent of
the workforce. Note that the decline in the white male workforce was not accompanied by an
increase in the relative number of African-American working men. The share of the black
workforce, in fact, remained stable at around 9 percent. The fraction of the workforce composed
of men who are of Hispanic origin, however, rose markedly from 6.2 to 13.0 percent, while the
fraction composed of men of Asian ancestry rose from 1.5 to 3.7 percent.
The remaining rows of Table 1 document the extent to which these demographic changes
can be attributed to immigration. It is clear, for instance, that immigration of white workers did
not increase much (at least in proportionate terms) between 1980 and 2000. White immigrants
comprised 2.5 percent of the workforce in 1980 and 2.6 percent of the workforce in 2000.
Similarly, the immigration of black men, though increasing rapidly during this period, is still
only a very small component of total immigration. As a result, black immigrants comprised only
0.3 percent of the workforce in 1980 and 0.8 percent in 2000. Immigration, however, played the
central role in the growth of the Hispanic and Asian workforce, with the immigrant share of the
workforce more than tripling for each of these groups. The share of Hispanic immigrants rose
from 2.5 percent in 1980 to 7.9 percent in 2000, while the share of Asian immigrants rose from
1.0 to 3.1 percent.
6
Although these aggregate statistics show interesting and relevant trends, they also mask a
great deal of the increased clustering of some race-ethnic groups, and particularly of Hispanic
immigrants, into certain segments of the skill distribution. The remaining columns of Table 1
illustrate this clustering effect by reporting the race-ethnic distribution of workers within a
particular education group (for each Census year and gender). I use three educational attainment
groups to simplify the presentation: workers who are high school dropouts (i.e., have less than 12
years of schooling); workers who are high school graduates (i.e., have exactly 12 years of
schooling); and workers who have more than a high school education (i.e., have more than 12
years of schooling).
Consider initially the trend in the representation of Hispanic workers in each of the three
skill categories. In 1980, 13.8 percent of workers who were high school dropouts were Hispanics
(7.0 percent were Hispanic natives and the remaining 6.8 percent were Hispanic immigrants). By
2000, 44.2 percent of workers who were high school dropouts were of Hispanic origin (8.4
percent were Hispanic natives and 35.8 percent were Hispanic immigrants). Therefore, over a
remarkable twenty-year period, the low-skill workforce—at least as defined by very low levels
of educational attainment—became almost majority Hispanic. In contrast, Hispanic workers are
a much less important part of the high-skill workforce. In 1980, 3.4 percent of workers with at
least a high school education were Hispanic; by 2000, 6.5 percent were Hispanic.
In contrast to the increased clustering of Hispanics at the low end of the skill distribution,
the growth of the Asian workforce has been distributed more evenly across the distribution—
even though, as with Hispanics, immigration accounts for much of the growth in the number of
Asian workers. In 1980, Asians comprised 0.9 percent of the high school dropouts (0.2 percent
were native-born Asians and the remaining 0.7 percent were Asian immigrants). By 2000, Asians
7
comprised 2.9 percent of high school dropouts (0.2 percent were native Asians and 2.7 percent
were Asian immigrants). Similarly, in 1980 Asians comprised 2.4 percent of the high-skill group
(0.7 were Asian natives and 1.7 percent were Asian immigrants). By 2000, Asians comprised 4.8
percent of the high-skill group (0.9 percent were Asian natives and 3.9 percent were Asian
immigrants).
Partly because of the rapid increase in the educational attainment of the black native
workforce (June O’Neill, 1990), the fraction of high school dropouts who are black natives
declined markedly between 1980 and 2000 while the fraction of high-skill workers who are
blacks rose significantly. In 1980, for instance, 13.9 percent of high school dropouts were blacks;
by 2000, only 8.8 percent were blacks. In contrast, 4.7 percent of the high-skill workforce in
1980 was black, and this statistic had increased to 7.6 percent by 2000. The fraction of high
school dropouts who are whites also dropped (at an even more precipitous rate) for similar
reasons, from 70.4 to 41.7 percent between 1980 and 2000.
As implied by the trends in the educational attainment of black and white workers, there
may be some confusion in the interpretation of the statistics reported in Table 1: The increasing
representation of some minority groups in the low-skill category may be driven not by an
increase in the number of low-skill minorities, but by the remarkable drop in the number of low-
skill white and black natives. Table 2 looks at the same Census data from a different angle so as
to more directly address this potential problem. In particular, it reports the distribution of
educational attainment within a particular race-ethnic group. This different perspective on the
data can, therefore, isolate the trends in educational attainment within particular minority groups.
The table clearly documents that the decreasing representation of black and white natives in the
low-skill workforce is partly attributable to the fact that there are many fewer black and white
8
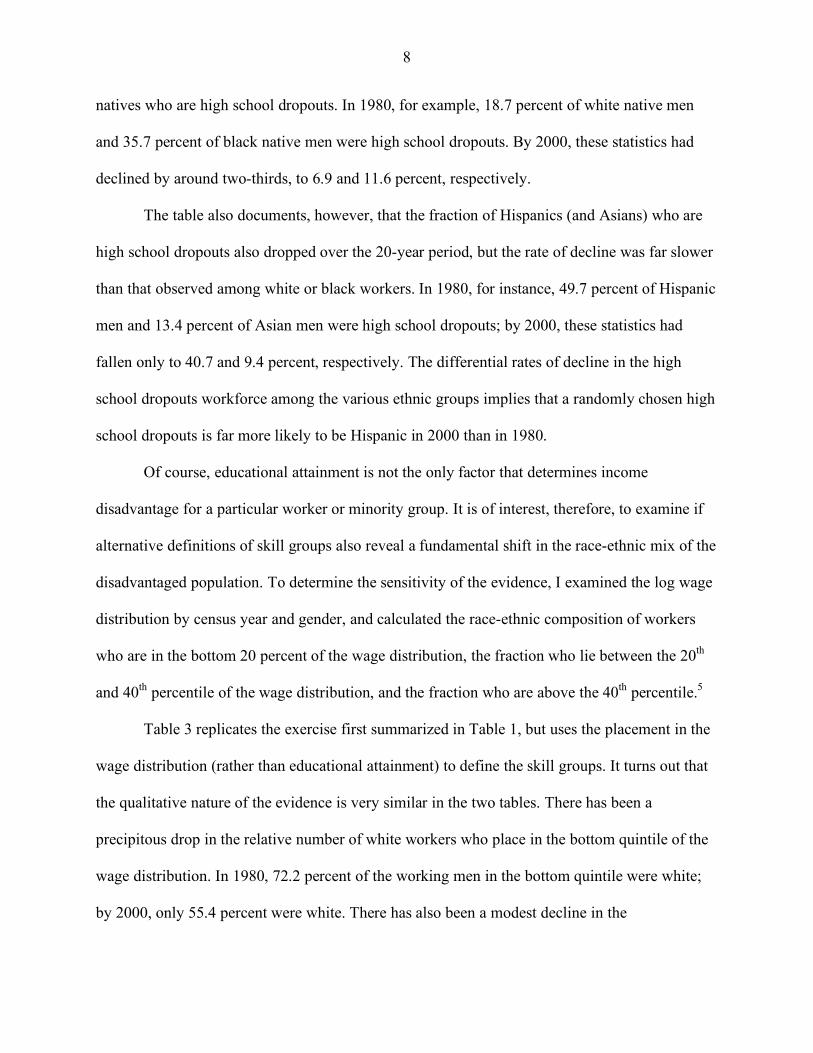
natives who are high school dropouts. In 1980, for example, 18.7 percent of white native men
and 35.7 percent of black native men were high school dropouts. By 2000, these statistics had
declined by around two-thirds, to 6.9 and 11.6 percent, respectively.
The table also documents, however, that the fraction of Hispanics (and Asians) who are
high school dropouts also dropped over the 20-year period, but the rate of decline was far slower
than that observed among white or black workers. In 1980, for instance, 49.7 percent of Hispanic
men and 13.4 percent of Asian men were high school dropouts; by 2000, these statistics had
fallen only to 40.7 and 9.4 percent, respectively. The differential rates of decline in the high
school dropouts workforce among the various ethnic groups implies that a randomly chosen high
school dropouts is far more likely to be Hispanic in 2000 than in 1980.
Of course, educational attainment is not the only factor that determines income
disadvantage for a particular worker or minority group. It is of interest, therefore, to examine if
alternative definitions of skill groups also reveal a fundamental shift in the race-ethnic mix of the
disadvantaged population. To determine the sensitivity of the evidence, I examined the log wage
distribution by census year and gender, and calculated the race-ethnic composition of workers
who are in the bottom 20 percent of the wage distribution, the fraction who lie between the 20th
and 40th percentile of the wage distribution, and the fraction who are above the 40th percentile.5
Table 3 replicates the exercise first summarized in Table 1, but uses the placement in the
wage distribution (rather than educational attainment) to define the skill groups. It turns out that
the qualitative nature of the evidence is very similar in the two tables. There has been a
precipitous drop in the relative number of white workers who place in the bottom quintile of the
wage distribution. In 1980, 72.2 percent of the working men in the bottom quintile were white;
by 2000, only 55.4 percent were white. There has also been a modest decline in the
9
representation of blacks in this low-skill group, from 15.1 to 13.5 percent. In contrast, the
fraction of the workers at the bottom of the wage distribution who are Hispanic rose from 10.2 to
24.6 percent, with much of the increase attributable to immigration (4.6 percent of the workers in
the bottom quintile were Hispanic immigrants in 1980, as compared to 16.9 percent in 2000).
There was also a rise in the Asian share in the bottom quintile (again due to immigration), from
1.5 percent in 1980 to 3.4 percent in 2000.
The descriptive evidence presented in this section, therefore, suggests a remarkable
change in the ethnic-race mix of the disadvantaged workforce over the past two decades. As
recently as 1980, blacks comprised 15.1 percent of low-wage workers (as defined by the bottom
20 percent of the skill distribution), Hispanics comprised 10.2 percent, and Asians 1.5 percent.
By 2000, blacks made up 13.5 percent, Hispanics 24.6 percent, and Asians 3.4 percent. The
economic and social implications of this change in the racial and ethnic composition of the
disadvantaged workforce are not yet fully understood or appreciated, but the “new look” of the
disadvantage workforce will likely be an important part in the inevitable social policy debates for
decades to come.
III. Trends in Relative Wages: Composition Effects
I now use the decennial Census data to document trends in the relative wages of the
various race-ethnic groups between 1980 and 2000 and to highlight how within-group changes in
the demographic composition of the race-ethnic classification can play an important role in
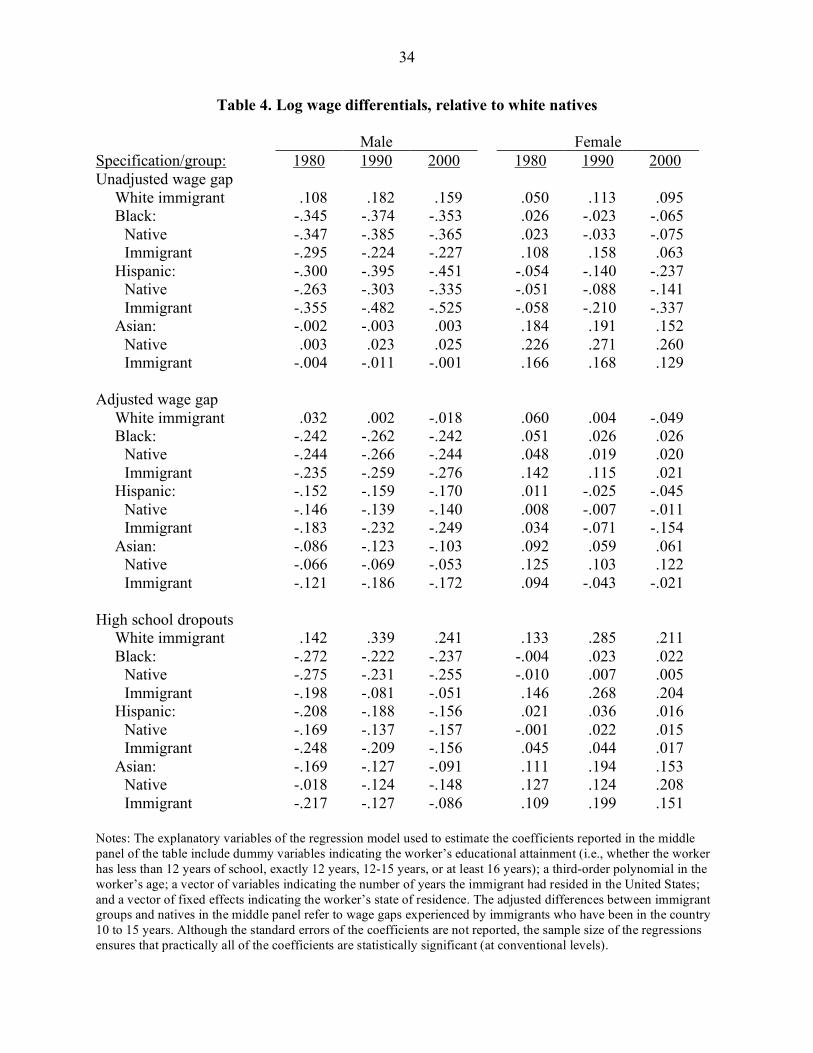
determining the aggregate trend. The top panel of Table 4 reports the unadjusted log weekly
wage differential between the various race-ethnic groups—blacks, Hispanics, and Asians—and a
baseline group consisting of white native workers. The unadjusted wage differentials are
10
calculated separately in each Census and by gender.6 The data indicate that the unadjusted black-
white log wage gap for working men was constant over the past twenty years, hovering at around
-.35 throughout the period. The data also show a stable wage gap between Asian and white
workers—at zero!. The table clearly shows, however, that the relative wage of Hispanics fell
substantially during the period. The log wage gap between Hispanic and white men stood at -.30
in 1980 and dropped to -.45 in 2000.
It turns out that this decline in the relative wage of the “typical” Hispanic worker is quite
misleading, for it is distorted by the increasing number and worsening economic outcomes
experienced by Hispanic immigrants. For each of the race-ethnic groups, Table 4 also reports the
log weekly wage of both native and immigrant workers (relative to the log wage of white
natives). Even though the unadjusted Hispanic-white wage gap fell by 0.15 log points between
1980 and 2000, the decline among native-born Hispanic men was only 0.07 log points. In
contrast, the unadjusted log wage gap between Hispanic immigrants and white natives dropped
from -0.36 to -0.53, a 0.17 log point drop. Not only do Hispanic immigrants earn substantially
less than white natives, but the relative economic status of Hispanic immigrants within the
Hispanic population worsened dramatically in the 20-year period. As a result, much of the drop
in the economic status of the “typical” Hispanic in the United States can be explained by a
composition effect created by an immigration-induced demographic shift in this population. In
other words, much of the decline in the relative wage of Hispanics can be attributed to: (1) the
increasing number of Hispanic immigrants in the workforce (the immigrant share among
Hispanic men increased from 40 percent to over 60 percent between 1980 and 2000); (2) the
lower wage of Hispanic immigrants relative to Hispanic natives; and (3) the worsening economic
outcomes experienced by Hispanic immigrants during the period.
11
The middle panel of Table 4 illustrates the extent to which differences in socioeconomic
characteristics generate some of the observed wage differentials among ethnic-race groups. In
particular, I estimated the following regression model separately by Census year and gender:
(1) log wijt = Xijt βt + γt Rit + vjt + εijt,
where wijt gives the weekly wage of worker i at time t; Xijt is a vector of socioeconomic
characteristics; Rit is a vector of dummy variables indicating the race-ethnic classification of the
worker; and vjt represents a vector of fixed effects indicating the worker’s state of residence. The
vector X includes dummy variables indicating the worker’s educational attainment; a third-order
polynomial in the worker’s age; and a vector of variables indicating the number of years the
immigrant has resided in the United States.7 I estimated two alternative specifications of the
model. The first defines the vector Rijt simply in terms of the four race-ethnic groups: white,
black, Hispanic, and Asian. The second expands the vector Rijt by including variables that
identify whether the worker in a particular ethnic group is native- or foreign-born (for example,
black natives, black immigrants). As before, all of the wage differentials are reported relative to
white natives. Finally, the wage differentials estimated for immigrants refer to the wage gaps
between immigrants who have been in the United States between 10 and 15 years (roughly the
“typical” group in the foreign-born population) and white natives.
The middle panel of Table 4 table reports the adjusted wage differentials. The
comparison of these adjusted wage gaps with the unadjusted differences reported in the top panel
yield a number of interesting findings. First, the unexplained wage gap between black and white
natives was stable over the 1980-2000 period, hovering around -.24 log points. Equally
12
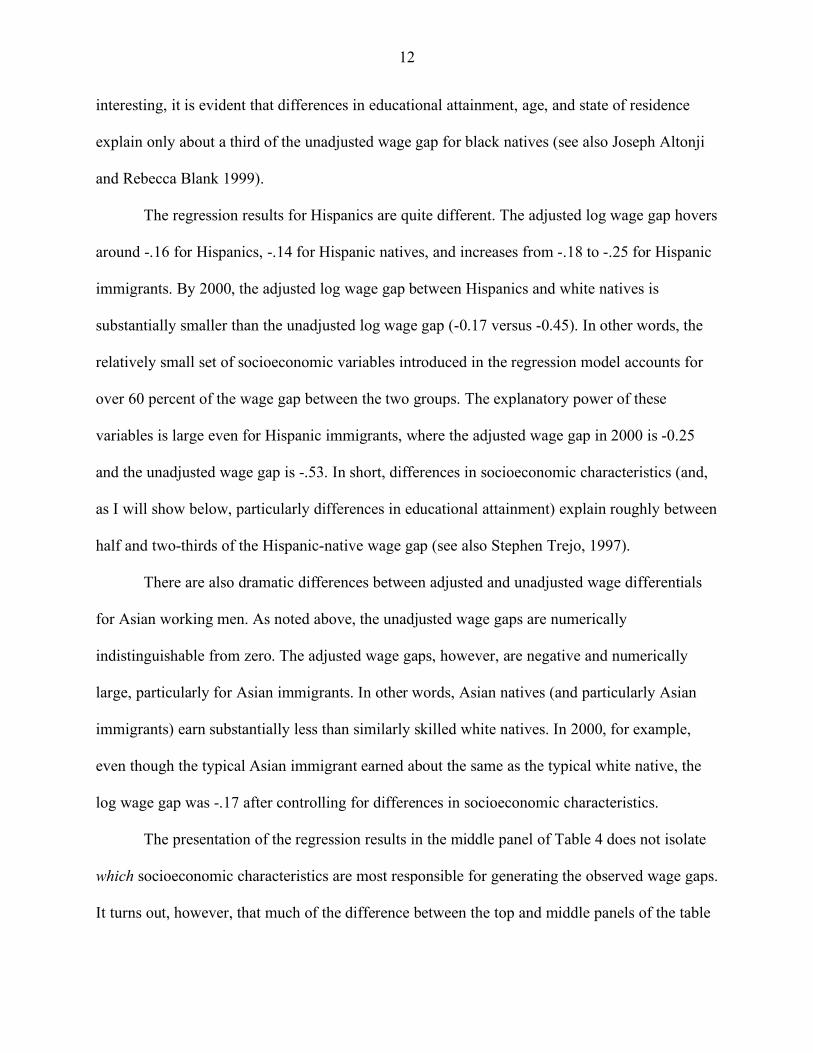
interesting, it is evident that differences in educational attainment, age, and state of residence
explain only about a third of the unadjusted wage gap for black natives (see also Joseph Altonji
and Rebecca Blank 1999).
The regression results for Hispanics are quite different. The adjusted log wage gap hovers
around -.16 for Hispanics, -.14 for Hispanic natives, and increases from -.18 to -.25 for Hispanic
immigrants. By 2000, the adjusted log wage gap between Hispanics and white natives is
substantially smaller than the unadjusted log wage gap (-0.17 versus -0.45). In other words, the
relatively small set of socioeconomic variables introduced in the regression model accounts for
over 60 percent of the wage gap between the two groups. The explanatory power of these
variables is large even for Hispanic immigrants, where the adjusted wage gap in 2000 is -0.25
and the unadjusted wage gap is -.53. In short, differences in socioeconomic characteristics (and,
as I will show below, particularly differences in educational attainment) explain roughly between
half and two-thirds of the Hispanic-native wage gap (see also Stephen Trejo, 1997).
There are also dramatic differences between adjusted and unadjusted wage differentials
for Asian working men. As noted above, the unadjusted wage gaps are numerically
indistinguishable from zero. The adjusted wage gaps, however, are negative and numerically
large, particularly for Asian immigrants. In other words, Asian natives (and particularly Asian
immigrants) earn substantially less than similarly skilled white natives. In 2000, for example,
even though the typical Asian immigrant earned about the same as the typical white native, the
log wage gap was -.17 after controlling for differences in socioeconomic characteristics.
The presentation of the regression results in the middle panel of Table 4 does not isolate
which socioeconomic characteristics are most responsible for generating the observed wage gaps.
It turns out, however, that much of the difference between the top and middle panels of the table
13
reflect the differences in educational attainment among the groups. To illustrate this fact, the
bottom panel of the table pursues a different approach to controlling for differences in
socioeconomic characteristics. Instead of using a regression model, this panel simply reports the
log wage gap between immigrants and natives who are high school dropouts. The evidence tends
to be quite similar to that obtained from the regression model in equation (1). Once the analysis
controls for educational attainment, the log wage gap between Hispanics and white native
workers narrows substantially, while the log wage gap between Asian and white natives
increases substantially. For example, in 2000 the unadjusted wage gap between Hispanic and
white men is -.45, while the wage gap between Hispanic and white men who are high school
dropouts is only -.16. Controlling for differences in educational attainment, therefore, narrows
the wage gap between the two groups substantially.
The data show that the dramatic increase in Hispanic immigration explains a big part of
the relative decline in the economic status of the “typical” Hispanic in the United States. There
is, in fact, an additional compositional effect at work within the Hispanic population. The
Hispanic workforce is composed of four disparate groups that share the same language but differ
substantially in other cultural and economic traits: Mexicans, Puerto Ricans, Cubans, and “other”
Hispanics.8 As documented in the top panel of Table 5, the demographic and economic content
of the label “Hispanic” has itself changed over time. In particular, there has been a dramatic
increase in the fraction of the Hispanic population comprised by Mexican immigrants. In 1980,
only 23.4 percent of Hispanics were Mexican immigrants. By 2000, 40.4 percent of Hispanics in
the were Mexican immigrants. The only other Hispanic group that increased its representation
substantially was the “other Hispanic immigrant” group, composed mainly of workers born in
14
Central and South America. These immigrants comprised 10.6 percent of Hispanics in 1980, but
17.7 percent by 2000.
The increasing demographic importance of these two groups is significant because these
two groups happen to be the least skilled groups in the Hispanic workforce. As the middle panel
of Table 5 shows, 62.2 percent of Mexican immigrants and 41.4 percent of “other Hispanic
immigrants” were high school dropouts in 2000. In contrast, only 20.4 percent of native-born
workers of Mexican ancestry, 21.9 percent of Puerto Rican natives, and 17.5 percent of Cuban
immigrants were high school dropouts.
The changing definition of who is represented by the “typical” Hispanic suggests that the
aggregate trend in the relative wage for either Hispanic natives or Hispanic immigrants is itself
not very meaningful, since the trend could be capturing the changing national origin mix of the
Hispanic population. To illustrate, the bottom panel of Table 5 reports the unadjusted log wage
gap between the various Hispanic subgroups and white (non-Hispanic) natives. These data
suggest that there has been a sizable decline in the relative wage of both Mexican natives and
Mexican immigrants, although the decline is steeper for Mexican immigrants. Between 1980 and
2000, the relative wage of Mexican immigrants fell from -.44 to -.58 log points. This decline is
important because Mexican immigrants make up an increasingly larger part of the Hispanic
workforce and happen to be the least economically successful subgroup among Hispanics.9
Note that the decline observed among Mexican immigrants stands in sharp contrast with
the relatively stable wage disadvantage experienced by Puerto Ricans (they earned 34.9 percent
less than white natives in 1980 and 31.6 percent less in 2000), and with the more modest decline
observed among Cuban immigrants (from a -15.0 percent wage advantage in 1980 to a -21.9
percent wage disadvantage in 2000). The only other group of Hispanics that experienced a
15
substantial decline in the relative wage is the fast-growing group of other Hispanic immigrants,
whose relative wage fell from -26.5 percent in 1980 to -44.3 percent in 2000. This decline may
itself be caused by compositional changes in the national origin mix of this group, as the
immigrants in 1980 may well have originated in a different set of countries than those in 2000.
The descriptive analysis reported in this section yields an important lesson: it is very
difficult to generalize about or correctly interpret aggregate trends in the economic status of the
Hispanic (and, to a lesser extent, Asian) workforce in the United States. The difficulties arise
because Hispanic immigrants are becoming an ever-larger part of the Hispanic population, and
Hispanic immigrants tend to earn less than Hispanic natives. Second, the national origin groups
that make up the Hispanic population have dramatically different economic experiences, and part
of the decline in the economic status of the “typical” Hispanic can be attributed to the increasing
representation in this population of two low-wage groups: Mexican and the “other Hispanic”
immigrants. Obviously, many other factors, besides composition effects, are likely to influence
wage trends among disadvantaged minorities. The remainder of this paper examines two factors
suggested by previous research: business cycle fluctuations and the labor market consequences
of continued immigration.
IV. The Cyclical Sensitivity of Employment Outcomes
Although previous studies have documented the sensitivity of black wages and
employment to the business cycle (Blank, 1989; Shelly Lundberg, 1985), there have relatively
few studies measuring the cyclicality of employment outcomes of other minority groups. To
determine the business cycle sensitivity of employment and wages for the various race-ethnic
16
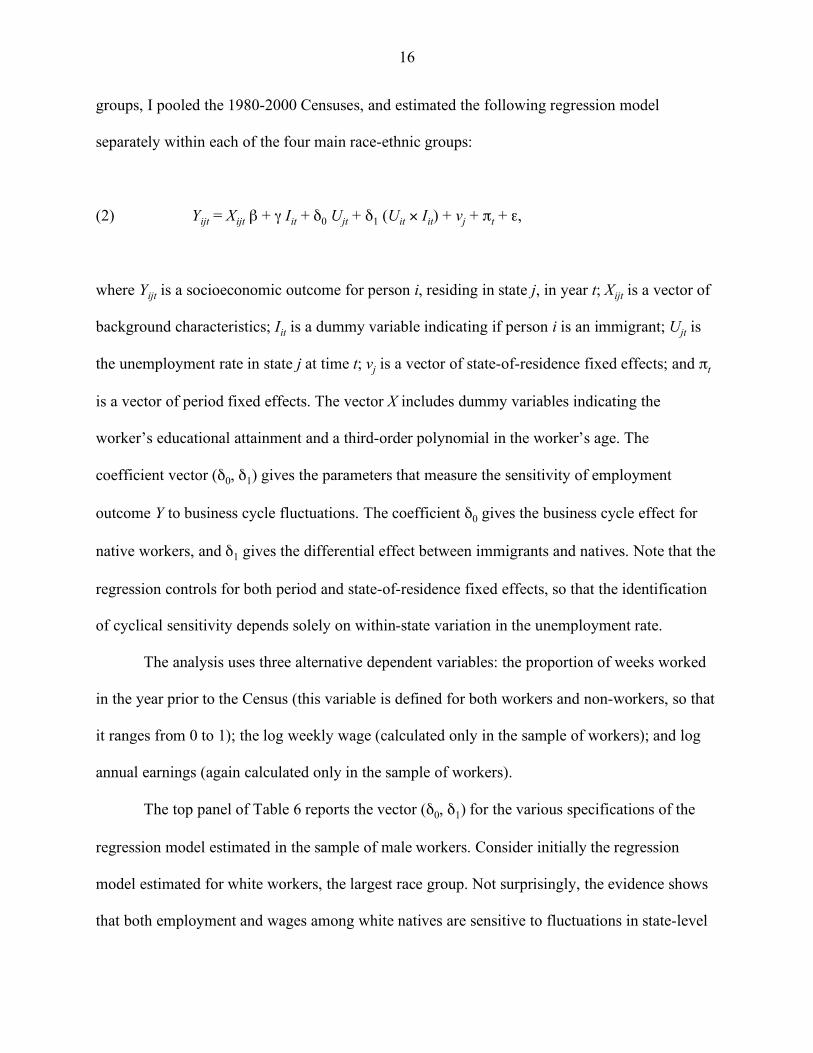
groups, I pooled the 1980-2000 Censuses, and estimated the following regression model
separately within each of the four main race-ethnic groups:
where Yijt is a socioeconomic outcome for person i, residing in state j, in year t; Xijt is a vector of
background characteristics; Iit is a dummy variable indicating if person i is an immigrant; Ujt is
the unemployment rate in state j at time t; vj is a vector of state-of-residence fixed effects; and πt
is a vector of period fixed effects. The vector X includes dummy variables indicating the
worker’s educational attainment and a third-order polynomial in the worker’s age. The
coefficient vector (δ0, δ1) gives the parameters that measure the sensitivity of employment
outcome Y to business cycle fluctuations. The coefficient δ0 gives the business cycle effect for
native workers, and δ1 gives the differential effect between immigrants and natives. Note that the
regression controls for both period and state-of-residence fixed effects, so that the identification
of cyclical sensitivity depends solely on within-state variation in the unemployment rate.
The analysis uses three alternative dependent variables: the proportion of weeks worked
in the year prior to the Census (this variable is defined for both workers and non-workers, so that
it ranges from 0 to 1); the log weekly wage (calculated only in the sample of workers); and log
annual earnings (again calculated only in the sample of workers).
The top panel of Table 6 reports the vector (δ0, δ1) for the various specifications of the
regression model estimated in the sample of male workers. Consider initially the regression
model estimated for white workers, the largest race group. Not surprisingly, the evidence shows
that both employment and wages among white natives are sensitive to fluctuations in state-level
17
economic conditions. The data also indicate significant differences in business cycle sensitivity
between immigrants and natives. Consider the regression where the dependent variable is the
fraction of weeks worked. The coefficient for native workers is -.006 and highly significant. This
coefficient implies that a 2.0 percentage point rise in the unemployment rate (say from 4 to 6
percent) lowers the fraction of weeks worked by about 1.2 percentage points.
Note, however, that the coefficient of the interaction variable between the unemployment
rate and immigration status is positive and significant, and of a magnitude which is exactly equal
to that of the main effect on white natives. In other words, there’s little evidence that the
employment of white immigrants is very sensitive to the business cycle. This result is quite
interesting and raises a number of questions that deserve further study. It is well known, for
instance, that immigrants tend to have larger labor force participation rates than natives (which is
not surprising as long as immigration is motivated mainly by income-maximization motives).
What is surprising, however, is that this type of selection seems to make immigrant employment
rates less sensitive to fluctuations in the aggregate economy.
The first row of the second panel in Table 6 replicates the regression analysis in the
disadvantaged sample of white male high school dropouts. The comparison of the regression
coefficients in this panel with those reported in the top panel suggests that the employment
propensities of low-skill white natives are more cyclically sensitive. The estimated coefficient is
-.012, implying that a 2.0 percentage point rise in the state unemployment rate lowers the
probability of employment during the year by 2.4 percent. Interestingly, the positive coefficient
of the immigration-unemployment interaction variable obtained in the entire sample of white
natives disappears. Instead, the coefficient now becomes slightly negative (but statistically
18
insignificant). Both native- and foreign-born low-skill white natives, therefore, exhibit greater
sensitivity to business cycle fluctuations than white workers with higher levels of skills.
The remaining rows of the table replicate the analysis for the other ethnic groups. Among
native workers, the evidence suggests that the employment propensities of black and Hispanic
men—and, in particular, of low-skill blacks and low-skill Hispanics—exhibit the most cyclical
sensitivity. Among high school dropouts, for example, the regression results imply that a 2
percentage point rise in the unemployment rate reduces the probability of native black
employment by 4.0 percentage points, and that of Hispanics by 2.8 percentage points. The
coefficient of the interaction variable between immigration and unemployment is positive
(though numerically small) for low-skill Hispanic immigrants, suggesting that employment
propensities for the largest immigrant group remain sensitive to the business cycle (though the
employment of low-skill Hispanic immigrants is less cyclically sensitive than the employment of
low-skill Hispanic natives).
The other columns of Table 6 show the cyclical sensitivity of wages, as measured either
by the log weekly wage or log annual income. The regression results indicate that the
coefficients of both the unemployment rate and of the interaction variable are systematically
negative. In general, real wages fall as the unemployment rate rises, and the decline in the real
wage is larger for immigrant workers. There is little evidence, however, to suggest that the wages
of disadvantaged minorities exhibit greater cyclical sensitivity than that of other workers.
Nevertheless, the cyclical effects for low-skill minorities are sizable. In the sample of low-skill
Hispanic workers, for instance, the regression coefficients imply that a 2 percentage point rise in
the unemployment rate reduce the annual earnings of low-skill Hispanic natives by about 9.2
percent, and that of low-skill Hispanic immigrants by 11.4 percent.
19
The bottom two panels of the table replicate the regression analysis using the sample of
working women. Although different factors tend to influence labor force participation decisions
for men and women, the cyclical sensitivity of female employment propensities roughly mirrors
those found among men. The coefficients suggest that native employment propensities are more
cyclically sensitive than those of immigrants. Similarly, the earnings of native women fall
significantly during recessions, while the earnings of immigrant women are at least as cyclically
sensitive as those of native women.
V. The Labor Market Impact of Immigration
Finally, I consider a factor that can potentially play a very large role in determining wage
trends among disadvantaged minority workers: the continuing entry of large numbers of low-
skill immigrants. Economic theory implies that immigration should lower the wage of competing
workers and increase the wage of complementary workers. An immigrant influx of low-skill
workers should reduce the economic opportunities for low-skill workers, who now face stiffer
competition in the labor market. At the same time, high-skill natives may gain substantially.
They pay less for the services that low-skill immigrants provide, and natives who hire these
immigrants can now specialize in producing the goods and services that better suit their skills.
Because of the policy significance associated with determining the impact of immigration
on the labor market opportunities of native workers, a large literature attempts to measure this
impact (see Altonji and David Card, 1991; Card 1990; and Jean Baldwin Grossman, 1982). The
starting point for much of this literature is the fact that immigrants in the United States cluster in
a small number of geographic areas. In 2000, for example, 38.4 percent of immigrants lived in
four metropolitan areas (New York, Los Angeles, Chicago, and San Francisco), but only 12.2
20
percent of natives lived in the four metropolitan areas with the largest native-born populations
(New York, Chicago, Los Angeles, and Philadelphia).
Practically all empirical studies in the academic literature exploit this geographic
clustering to construct the methodological exercise that purports to measure the labor market
impact of immigration. The typical study defines a metropolitan area as the labor market that is
penetrated by immigrants. The study then goes on to calculate a cross-city correlation measuring
the relation between the native wage in a locality and the relative number of immigrants in that
locality. A negative correlation, indicating that native wages are lower in markets with many
immigrants, would suggest that immigrants worsen the employment opportunities of competing
native workers.
Although there is a great deal of dispersion in the findings reported in the literature, there
is a tendency for the estimated cross-city correlations to cluster around zero, helping to create the
conventional wisdom that immigrants have little impact on the labor market opportunities of
native workers, perhaps because “immigrants do jobs that natives do not want to do.” It would
seem, therefore, that a fundamental implication of the standard textbook model of the labor
market—that an increase in supply lowers wages—is soundly rejected by the data.
Recent research, however, raises two questions about the validity of interpreting near-
zero cross-city correlations as evidence that immigration has no labor market impact. First,
immigrants may not be randomly distributed across labor markets. If immigrants cluster in cities
with thriving economies (and high wages), there would be a built-in positive correlation between
immigration and wages. Second, natives may respond to the wage impact of immigration by
moving their labor or capital to other cities. For example, native-owned firms see that cities in
Southern California flooded by low-skill immigrants pay lower wages to laborers. Employers
21
who hire laborers will want to relocate to those cities. Similarly, laborers living in California
may decide to move elsewhere. These flows of labor and capital tend to equalize economic
conditions across localities. As a result, inter-city comparisons of native wage rates may not be
very revealing: capital flows and native migration diffuse the impact of immigration across the
national economy.
Because local labor markets adjust to immigration, some recent studies have begun to
emphasize that the labor market impact of immigration may be measurable only at the national
level (Borjas, Richard Freeman, and Katz 1997). The empirical analysis reported in this section
re-estimates a labor demand model developed by Borjas (2003) to measure the impact of
immigration on the wages of competing workers in the national labor market. This approach
defines national skill groups in terms of educational attainment and work experience. As in
Borjas (2003), male workers are classified into four distinct education groups: workers who are
high school dropouts, high school graduates, workers who have some college, and college
graduates. Work experience is defined as the number of years elapsed since the person
completed school. The analysis is restricted to workers with 1 to 40 years of experience. Workers
are then grouped into eight different experience groups, indicating if the worker has 1-5 years of
experience, 6-10 years, 11-15 years, and so on. There are, therefore, a total of 32 skill groups in
the labor market (four education and eight experience groups).
Suppose the aggregate production function for the national economy at time t is:
(3) 1/
,vv v
t Kt t Lt tQ K L! "= # +#$ %
22
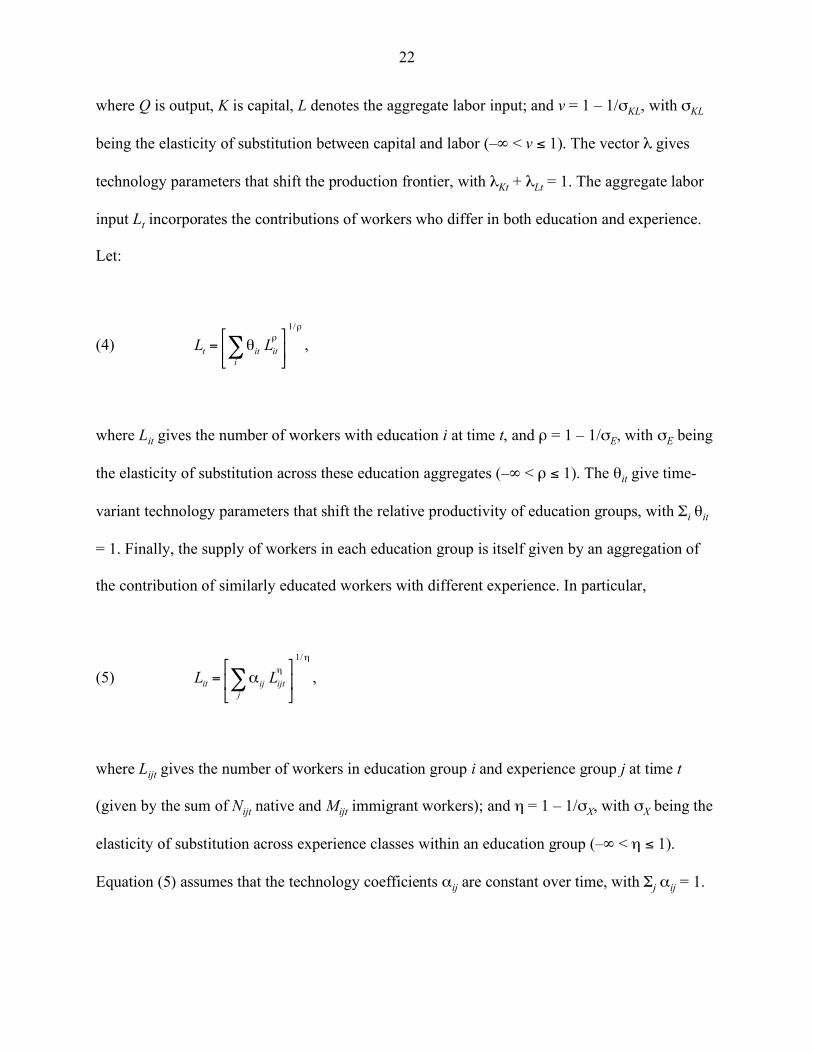
where Q is output, K is capital, L denotes the aggregate labor input; and v = 1 – 1/σKL, with σKL
being the elasticity of substitution between capital and labor (–∞ < v ≤ 1). The vector λ gives
technology parameters that shift the production frontier, with λKt + λLt = 1. The aggregate labor
input Lt incorporates the contributions of workers who differ in both education and experience.
Let:
(4) 1/
t it it
i
L L
!!" #
= $% &' () ,
where Lit gives the number of workers with education i at time t, and ρ = 1 – 1/σE, with σE being
the elasticity of substitution across these education aggregates (–∞ < ρ ≤ 1). The θit give time-
variant technology parameters that shift the relative productivity of education groups, with Σi θit
= 1. Finally, the supply of workers in each education group is itself given by an aggregation of
the contribution of similarly educated workers with different experience. In particular,
(5) 1/
it ij ijt
j
L L
!
!" #= $% &' () ,
where Lijt gives the number of workers in education group i and experience group j at time t
(given by the sum of Nijt native and Mijt immigrant workers); and η = 1 – 1/σX, with σX being the
elasticity of substitution across experience classes within an education group (–∞ < η ≤ 1).
Equation (5) assumes that the technology coefficients αij are constant over time, with Σj αij = 1.
23
Borjas (2003) shows that the key elasticities σX and σE can be estimated by regressing the
log wage of particular education-experience groups on the log of the size of the workforce in the
various cells, and instrumenting the supply variable by the size of the immigrant workforce in the
skill cell. I re-estimated the econometric framework using data from the 1960-2000 IPUMS
samples.10 The estimated elasticities are σX = 3.01 and σE = 2.42. The empirical implementation
of the three-level CES technology described above does not use any data on the aggregate capital
stock so that σKL cannot be directly estimated. However, Daniel Hamermesh (1993, p. 92)
concludes that the aggregate U.S. economy can be reasonably described by a Cobb-Douglas
production function, suggesting that σKL equals one.
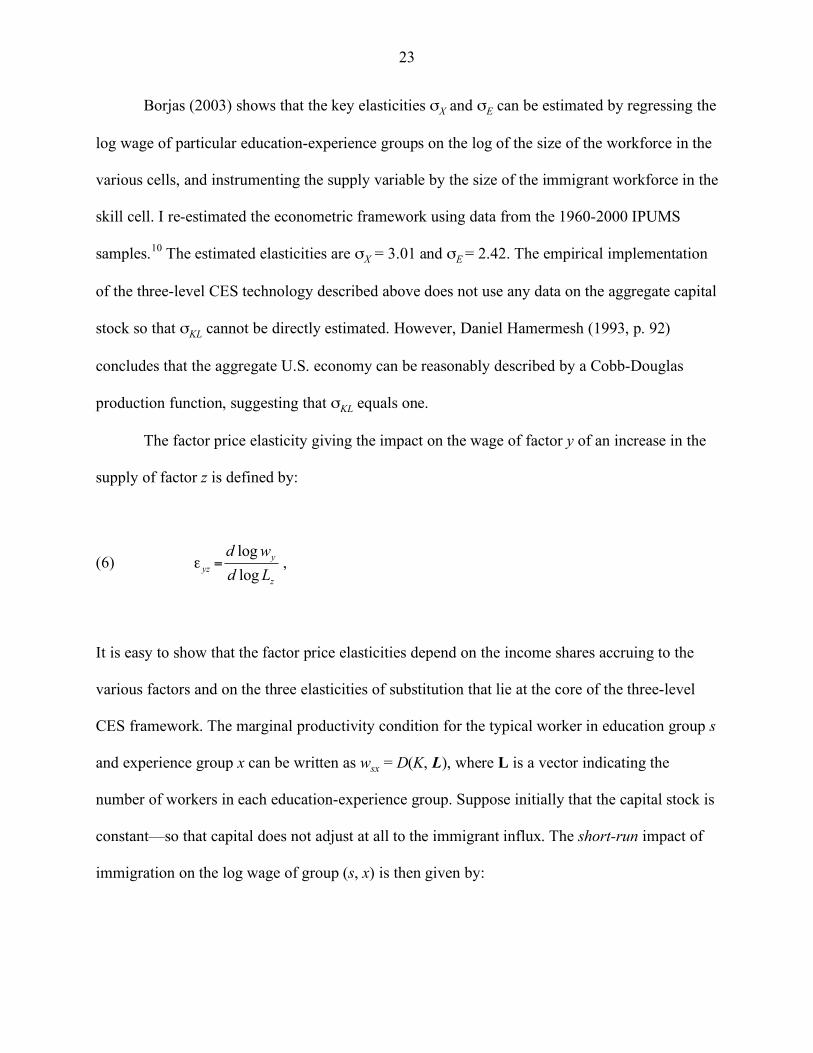
The factor price elasticity giving the impact on the wage of factor y of an increase in the
supply of factor z is defined by:
(6) log
,log
y
yz
z
d w
d L! =
It is easy to show that the factor price elasticities depend on the income shares accruing to the
various factors and on the three elasticities of substitution that lie at the core of the three-level
CES framework. The marginal productivity condition for the typical worker in education group s
and experience group x can be written as wsx = D(K, L), where L is a vector indicating the
number of workers in each education-experience group. Suppose initially that the capital stock is
constant—so that capital does not adjust at all to the immigrant influx. The short-run impact of
immigration on the log wage of group (s, x) is then given by:
24
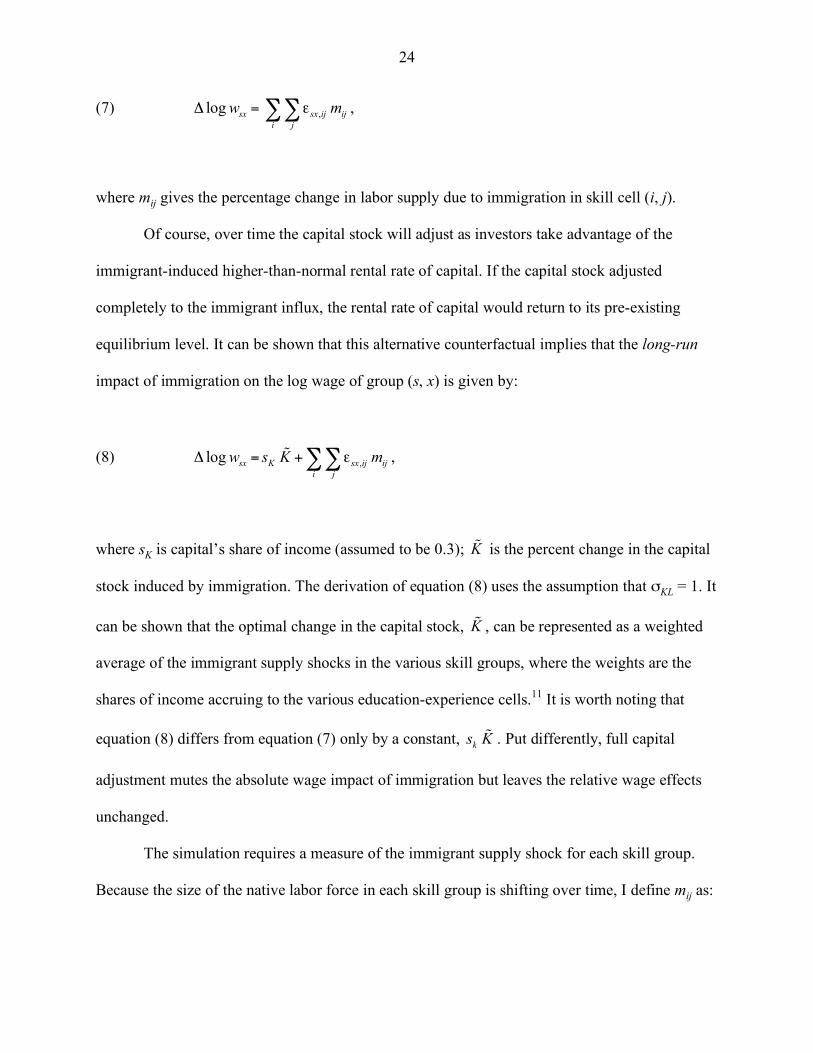
(7) ,log ,sx sx ij ij
i j
w m! = "##
where mij gives the percentage change in labor supply due to immigration in skill cell (i, j).
Of course, over time the capital stock will adjust as investors take advantage of the
immigrant-induced higher-than-normal rental rate of capital. If the capital stock adjusted
completely to the immigrant influx, the rental rate of capital would return to its pre-existing
equilibrium level. It can be shown that this alternative counterfactual implies that the long-run
impact of immigration on the log wage of group (s, x) is given by:
(8) ,log ,sx K sx ij ij
i j
w s K m! = + "##%
where sK is capital’s share of income (assumed to be 0.3); K% is the percent change in the capital
stock induced by immigration. The derivation of equation (8) uses the assumption that σKL = 1. It
can be shown that the optimal change in the capital stock, K% , can be represented as a weighted
average of the immigrant supply shocks in the various skill groups, where the weights are the
shares of income accruing to the various education-experience cells.11 It is worth noting that
equation (8) differs from equation (7) only by a constant, ks K% . Put differently, full capital
adjustment mutes the absolute wage impact of immigration but leaves the relative wage effects
unchanged.
The simulation requires a measure of the immigrant supply shock for each skill group.
Because the size of the native labor force in each skill group is shifting over time, I define mij as:
25
(9) ,2000 ,1980
,1980 ,2000 ,1980
,0.5( )
ij ij
ij
ij ij ij
M Mm
N N M
!=
+ +
so that the baseline population used to calculate the percent increase in labor supply averages out
the size of the native workforce in the skill cell and treats the pre-existing immigrant population
as part of the “native” stock.
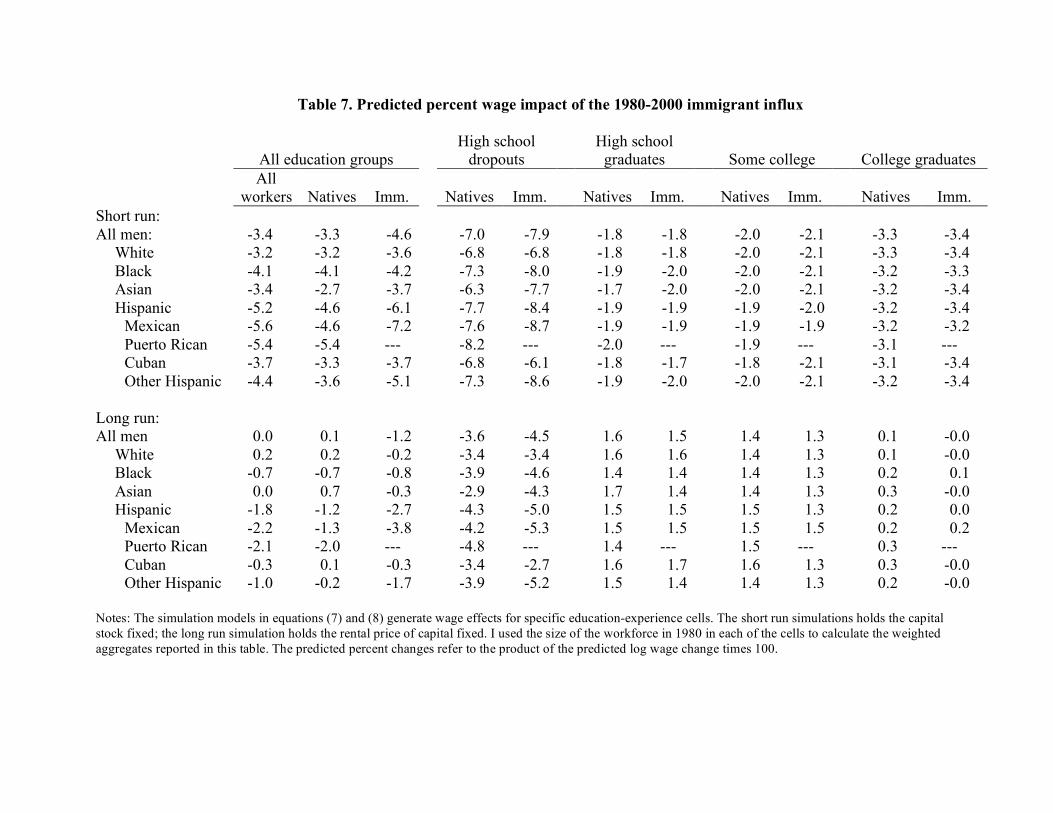
The top panel of Table 6 summarizes the short-run simulation results for the various race-
ethnic groups analyzed in this paper. Note that equation (7) generates a vector of statistics giving
the wage impact of immigration for each education-experience group. This impact is obviously
the same for all workers who have the same educational attainment and experience, regardless of
the race-ethnic background of the workers. The aggregate results reported in Table 6 are
obtained by aggregating the measured impact of immigration across all workers within a
particular race-ethnic group. I use the size of the relevant workforce in 1980 in each of the
education-experience cells to calculate the weighted averages reported in the table.12
The first column reveals a great deal of variation in the measured impact of immigration
across race-ethnic groups. In the short run, the 1980-2000 immigrant influx lowered the wage of
the typical working man by about 3.4 percent. The adverse impact of immigration, however, was
larger for blacks (4.1 percent), and was particularly large for Hispanics (5.2 percent). The data
also reveal that there is a great deal of variability within the Hispanic population, with
immigration having a very large adverse effect on Mexicans and Puerto Ricans (about 5.5
percent) and a smaller effect on Cubans (3.7 percent). The next two columns of the table estimate
the impact of immigration separately for native and foreign-born workers. These calculations
reveal that the pre-existing immigrant stock is more adversely affected by continuing
immigration, and that Hispanic immigrants (and particularly Mexican immigrants) tend to suffer
26
the largest wage losses. In particular, the 1980-2000 immigrant influx lowered the wage of the
pre-1980 Mexican immigrant stock by 7.2 percent.
The bottom panel of Table 6 reports the results obtained from the long-run simulation.
Because the aggregate production function in equation (3) has constant returns to scales, the
long-run effect of immigration on the average wage must be zero. Nevertheless, immigration still
has significant adverse effects on both absolute and relative wages for some race-ethnic groups.
Even in the long-run, after all of the potential adjustments to capital have taken place, the 1980-
2000 immigrant influx generated a 1.8 percent wage reduction for the typical Hispanic working
man, a 2.0 percent wage reduction for the typical Puerto Rican, and a 3.8 percent reduction for
the typical Mexican immigrant.
The remaining columns of Table 6 show that the adverse impacts of immigration are even
larger when the simulation considers only the subsample of low-skill workers (i.e., of workers
who are high school dropouts). The 1980-2000 immigrant influx reduced the wage of low-
educated native workers by 7.0 percent in the short run and by 3.6 percent in the long run. Of
course, immigration also has beneficial wage impacts on some groups in the long run (since the
average wage effect must be zero). Nevertheless, Table 6 shows that the predicted positive
effects (mainly for workers in the middle of the educational attainment distribution) tend to be
relatively small. In short, large-scale immigration of low-skill workers is an important
determinant of wages among low-skill minorities.
Finally, it is worth emphasizing that the simulations obviously rely on the estimated
values of the elasticities of substitution. As a result, it is important to ascertain the sensitivity of
the predicted wage effects to alternative assumptions about the elasticities. I conducted
alternative simulations (not shown) which shifted the elasticity of substitution among education
27
groups or among experience groups by one standard error from the estimated value.13 It turns out
that the predicted wage effects do not change the thrust of the results summarized in Table 6.
Suppose, for instance, that both elasticities of substitution are one standard error below the
values implied by the estimation of the labor demand model. The short-run simulation then
suggests that the 1980-2000 immigrant influx reduced the wage of the typical high school
dropout by 10.9 percent; the wage of the typical Hispanic by 6.7 percent, and the wage of the
typical low-skill Mexican worker by 12.4 percent. In contrast, suppose the elasticities of
substitution are one standard error larger than the regression estimates. The wage of the average
high school dropout falls by 3.3 percent, the wage of the typical Hispanic falls by 3.7 percent,
and the wage of the typical low-skill Mexican worker falls by 4.0 percent.
VI. Summary
This paper examined the changing race-ethnic composition and economic status of the
low-skill workforce in the United States. The analysis uses data drawn from the 1980-2000
decennial Censuses. The data clearly indicate that the race-ethnic composition of the
disadvantaged population has changed dramatically in the past two decades, becoming much
more heavily Hispanic and with an increasing representation of Asians. It seems, therefore, that
our traditional stereotypes about the ethnic-racial composition of the disadvantaged population in
the United States require a major overhaul.
The empirical analysis indicated that aggregate trends in the relative wage of the
“typical” Hispanic and Asian worker in the U.S. workforce mask a great deal of variation that
arises because of the changing composition of these populations. The declining relative wage of
the typical Hispanic, for instance, is in large part due to the disproportionate increase in the
28
number of low-wage immigrants in this population. The analysis also indicated that wage trends
for low-skill minorities are particularly sensitive to business cycle fluctuations (with the wage
being more cyclically sensitive for low-skill immigrant men than for other groups) and to the
labor market impact of the continuing immigrant influx, which has a sizable adverse effect on the
wage of low-skill workers in the United States.
The increasing presence of immigrants in the disadvantaged population raises a number
of policy questions that are sure to generate substantial debate in the future. Perhaps the most
important of these questions concerns the rate of economic mobility between the immigrant
generation and their children and grandchildren. It is unclear that the historical path of social
mobility exhibited by past immigrant waves (like those that arrived in the early 1900s) serves as
a model for the current influx of immigrants. The current low-skill immigration, after all, is
entering a labor market that seems increasingly predisposed to reward high skills and where the
manufacturing sector is rapidly decreasing in importance. Moreover, the current immigrants
enter a cultural and social milieu that often denigrates the process of cultural assimilation, and
instead encourages the preservation of cultural differences. This stands in sharp contrast to the
“melting pot” ideology that earlier immigrant waves encountered. It will be of great interest—
and of fundamental social importance—to witness the mobility experienced by the children and
grandchildren of the current immigrants.
29
REFERENCES
Altonji, Joseph G. and Rebecca M. Blank. 1999. “Race and Gender in the Labor Market,” In Handbook of Labor Economics, Volume 3C, edited by Orley Ashenfelter and David Card. Amsterdam: Elsevier. Altonji, Joseph G. and Card, David. 1991. "The Effects of Immigration on the Labor Market Outcomes of Less-Skilled Natives.” In Immigration, Trade, and the Labor Market, edited by John M. Abowd and Richard B. Freeman. Chicago: University of Chicago Press. Autor, David H., Lawrence F. Katz, and Melissa S. Kearney. 2004. “Trends in U.S. Wage Inequality: Re-Assessing the Revisionists,” Working Paper, Harvard University. Blank, Rebecca M. 1989. “Disaggregating the Effect of the Business Cycle on the Distribution of Income.” Economica 56(2): 141-163. Borjas, George J. 2003. “The Labor Demand Curve Is Downward Sloping: Reexamining the Impact of Immigration on the Labor Market.” Quarterly Journal of Economics 118(4): 1335-74. Borjas George J., Richard B. Freeman, Lawrence F. Katz. 1997. “How Much Do Immigration and Trade Affect Labor Market Outcomes?” Brookings Papers on Economic Activity (1): 1-67. Borjas, George J. and Lawrence F. Katz. 2005. “The Evolution of the Mexican-Born Workforce in the United States.” NBER Working Paper No. 11281.
Card, David. 1990. “The Impact of the Mariel Boatlift on the Miami Labor Market,” Industrial and Labor Relations Review 43(2): 245-257.
Card, David, and Thomas Lemieux. 2001. “Can Falling Supply Explain the Rising Return to College for Younger Men? A Cohort-Based Analysis.” Quarterly Journal of Economics 116(2): 705-746.
Grossman, Jean Baldwin. 1982. “The Substitutability of Natives and Immigrants in Production.” Review of Economics and Statistics 54(4): 596-603.
Katz, Lawrence F., and Kevin M. Murphy. 1992. “Changes in the Wage Structure, 1963-87: Supply and Demand Factors.” Quarterly Journal of Economics 107(1): 35-78. Lundberg, Shelly. 1985. “The Added Worker Effect.” Journal of Labor Economics 3(1): 11-37.
June O’Neill. 1990. “The Role of Human Capital in Earnings Differences between Black and White Men.” Journal of Economic Perspectives 4(4): 25–45
30
Jeffrey Passel. 2005. “Unauthorized Migrants: Numbers and Characteristics.” Pew Hispanic Center. Trejo, Stephen J. 1997. “Why Do Mexican-Americans Earn Low Wages?” Journal of Political Economy 105(6): 1235-1268. U.S. Immigration and Naturalization Service. 2003. “Estimates of the Unauthorized Immigrant Population Residing in the United States: 1990 to 2000.” Office of Policy and Planning.
31
Table 1. Distribution of ethnicity within education groups (Percent of education group belonging to race-ethnic classification)
Educational attainment
All workers High school
dropouts High school
graduates More than high
school Group 1980 1990 2000 1980 1990 2000 1980 1990 2000 1980 1990 2000 Male White 83.0 79.0 71.8 70.4 58.6 41.7 85.2 78.8 71.0 88.0 84.6 79.0
Notes: For each column of the table (by gender) the information reported for white, black, Hispanic, and Asian groups (or the more detailed information provided by immigration status) would add up to 100.0 percent if the comparable information for the residual group of “other ethnicity” were also reported.
32
Table 2. Distribution of educational attainment within race-ethnic groups (Percent of race-ethnic group with a particular level of education)
High school dropouts High school graduates More than high school Group: 1980 1990 2000 1980 1990 2000 1980 1990 2000 Men White 18.9 10.0 7.0 40.3 35.2 33.2 40.8 54.8 60.0
Notes: For a given census year, the rows in this table add up to 100.0 percent (except for rounding error).
33
Table 3. Distribution of ethnicity within skill group, by placement in the wage distribution (Percent of skill group belonging to race-ethnic classification)
Notes: The information reported for white, black, Hispanic, and Asian groups in each column of the table (or the more detailed information provided by immigration status) would add up to 100.0 percent if the comparable information for the residual group of “other ethnicity” were also reported.
34
Table 4. Log wage differentials, relative to white natives Male Female Specification/group: 1980 1990 2000 1980 1990 2000 Unadjusted wage gap
Notes: The explanatory variables of the regression model used to estimate the coefficients reported in the middle panel of the table include dummy variables indicating the worker’s educational attainment (i.e., whether the worker has less than 12 years of school, exactly 12 years, 12-15 years, or at least 16 years); a third-order polynomial in the worker’s age; a vector of variables indicating the number of years the immigrant had resided in the United States; and a vector of fixed effects indicating the worker’s state of residence. The adjusted differences between immigrant groups and natives in the middle panel refer to wage gaps experienced by immigrants who have been in the country 10 to 15 years. Although the standard errors of the coefficients are not reported, the sample size of the regressions ensures that practically all of the coefficients are statistically significant (at conventional levels).
35
Table 5. Size and characteristics of Hispanic groups Male Female 1980 1990 2000 1980 1990 2000 % of Hispanics who are: Mexican: 61.4 63.0 62.3 57.3 57.7 54.7
(0.007) (0.007) (0.012) (0.012) (0.016) (0.016) Notes: Standard errors are reported in parentheses. The variable Ujt gives the unemployment rate in state j at time t; Iijt is a dummy variable indicating if worker i is an immigrant. The regression also includes dummy variables indicating the worker’s educational attainment (i.e., whether the worker has less than 12 years of school, exactly 12 years, 12-15 years, or at least 16 years); a third-order polynomial in the worker’s age; and a vector of fixed effects indicating the worker’s state of residence.
Table 7. Predicted percent wage impact of the 1980-2000 immigrant influx
All education groups
High school dropouts
High school graduates
Some college
College graduates
All workers
Natives
Imm.
Natives
Imm.
Natives
Imm.
Natives
Imm.
Natives
Imm.
Short run: All men: -3.4 -3.3 -4.6 -7.0 -7.9 -1.8 -1.8 -2.0 -2.1 -3.3 -3.4
Notes: The simulation models in equations (7) and (8) generate wage effects for specific education-experience cells. The short run simulations holds the capital stock fixed; the long run simulation holds the rental price of capital fixed. I used the size of the workforce in 1980 in each of the cells to calculate the weighted aggregates reported in this table. The predicted percent changes refer to the product of the predicted log wage change times 100.
38
ENDNOTES * Robert W. Scrivner Professor of Economics and Social Policy, John F. Kennedy School of Government, Harvard University; and Research Associate, National Bureau of Economic Research. I am grateful to Steven Raphael and Rebecca Blank for providing many useful comments on an earlier draft.
1 A small group of persons cannot be classified into any of these four race-ethnic categories. In 1990, only 0.7 percent of the workforce was in this residual category. By 2000, however, the residual workers had grown to 2.3 percent of the workforce, probably because of the redesign of the 2000 Census race question. The economic outcomes experienced by the residual group of “other” workers are ignored in the discussion that follows.
2 The size of the illegal immigrant population has been rising at an even faster since 2000. Jeffrey Passel (2005) estimated that 10.3 million illegal immigrants resided in the United States in March 2004
3 The wage measure is based on a worker’s total income earned from both salaried and self-employment.. Workers who have outlying wage observations are deleted from the analysis. I calculated a wage rate for each worker by taking the ratio of annual earnings to the product of weeks worked and hours worked weekly, and restricted the sample in each Census to workers whose calculated hourly wage rate lies between $1 and $250 (in 1999 dollars).
4 The sum of the relevant categories in each of the columns in Table 1 does not add up to 100 percent because the residual group of “other” workers is included in the calculations, but is not reported in the table.
5 Because the wage distributions of male and female workers are studied separately, the cutoff points differ greatly between the two groups. In 2000, the 20th percentile cutoff points for men and women were 5.715 and 5.206, respectively. Similarly, the 40th percentile cutoff points for the two groups were 6.127 and 5.657.
6 To conserve space, the discussion focuses on the trends in the relative wage of working men. The trends in the relative wage of working women are, of course, affected by differential trends in labor force participation rates and by the self-selection that marks the labor force participation decision. It should be noted, however, that the trends observed among working women often mirror those observed among working men.
7 The vector of variables representing the worker’s educational attainment includes dummy variables indicating if the worker has less than 12 years of school, exactly 12 years, 12-15 years, or at least 16 years. The vector of variables representing the number of years the immigrant has lived in the United States includes dummy variables indicating if the foreign-born worker has lived in the country 0-5 years, 5-10 years, 15-20 years, 20-30 years, and over 40 years. These dummy variables are set to zero for native-born workers.
39
8 Workers in the other Hispanic category originate mainly in Central and South American countries. The Puerto Rican category is defined only for natives because persons born in Puerto Rico, like persons of Puerto Rican ancestry born in the United States, are American citizens.
9 Borjas and Lawrence Katz (2005) analyze the trends in the relative skills and wages of Mexican immigrants in the United States throughout the 20th century. Most of the very large wage disadvantage experienced by Mexican immigrants can be attributed to their very low levels of educational attainment.
10 More precisely, the model generates two estimating equations. The first regresses the log wage of a skill group (defined by education and experience) on various fixed effects and on the log of the size of the workforce in that group. This regression identifies σX. The second aggregates the data to the education group level and regresses the log wage of an education group on vectors of fixed effects and on the log of the size of the workforce in the education group. This regression identifies σE. Borjas (2003) analyzed the earnings of workers in the wage-and-salary sector using data from the Census and Current Population Surveys and estimated σX = 3.5 and σE = 1.3. The replication presented here differs in three significant ways. First, it uses all of the census microdata available between 1960 and 2000. Second, it includes workers who are self-employed. Finally, it incorporates the most recent findings on the trends in relative demand for various skill groups. In particular, Katz and Kevin Murphy (1992) documented that the secular trend in relative demand shifts for high-skill workers in a CES framework could be approximated by linear trends specific to each education group. This approximation became an important identification restriction for the estimation of the elasticity of substitution across education groups in Card and Thomas Lemieux (2001) and Borjas (2003). More recently, David Autor, Katz, and Melissa Kearny (2004) documented that the growth rate in the relative demand for skilled workers slowed in the 1990s. In particular, they find a 20 percent decline in the secular growth rate of demand for skilled workers during the 1990s as compared to the growth rate prior to the 1990s. To capture this break in the secular trend, I included education-specific splines in the marginal productivity equation that identifies σE (instead of simple linear trends). For each education group, this variable is defined by a linear trend that increases at the rate of one per year between 1960 and 1990. The trend variable then increases at a rate of 0.8 per year between 1990 and 2000.
11 To simplify notation, let n be the subscript indicating the education-experience skill group (n = 1,…,32). The immigrant-induced change in the capital stock / ,
n n L
n
K s m s=!% where sL is labor’s
share of income.
12 The natural weighting variable implied by the theoretical framework is the share of income accruing to each education-experience cell. Using this weighting, for example, would imply that the long-run wage change in (8) averaged across groups must be zero because the production function assumes constant returns to scales. This weighting, however, has little policy relevance if, for example, one wishes to estimate the mean impact of immigration on the earnings of a subpopulation that has a large number of low-skill workers. For example, many blacks are high school dropouts and earn relatively little. They would then contribute little to the calculation of the mean wage effect, even though many blacks would be disproportionately affected by
40
immigration. The simulations presented in Table 7 use the 1980 size of the workforce to aggregate the predictions in equations (7) and (8) but calibrate the calculations so that the average wage impact for the total sample (all workers across all education groups) is the mean wage change predicted by the simulation that uses income shares as the weights.
13 The regression estimates of the elasticities of substitution are σX = 3.0 and σE = 2.4. The sensitivity analysis assumes that σX = 2.2 or 4.9, and that σE = 1.2 or 62.5. These additional simulations maintain the assumption that the elasticity of substitution between labor and capital equals one.