59

W A I K A T O R I V E R B A N K E R O S I O N S T U D Y V O L U M E 1
Prepared for Mighty River Power, 17 April 2007 J:\Jobs\42089850\6000\R044 FINAL Rev A 17-4-07.doc
Project Manager: …………………………… Debra Fellows Associate Geotechnical Engineer
Project Director and peer review: ……………………………
Don Macfarlane Senior Principal
URS New Zealand Limited
Level 5, Landsborough House 287 Durham Street, Christchurch PO Box 4479, Christchurch New Zealand Tel: 64 3 374 8500 Fax: 64 3 377 0655
Author:…………………………… Dr Mark Mabin Senior Environmental Scientist
Date:Reference: Status:
17 April 2007 R044 Rev A Final

W A I K A T O R I V E R B A N K E R O S I O N S T U D Y V O L U M E 1
Contents
Prepared for Mighty River Power, 17 April 2007 J:\Jobs\42089850\6000\R044 FINAL Rev A 17-4-07.doc
1
Contents
Executive Summary ............................................................................................ES-1
1 Introduction ................................................................................................... 1-1
2 Scope of Work ............................................................................................... 2-1
3 Data Review................................................................................................... 3-13.1 Previous work .............................................................................................................. 3-1
3.2 Aerial photographs ...................................................................................................... 3-1
3.3 River bank erosion and related studies..................................................................... 3-1
3.3.1 Studies commissioned by Mighty River Power ............................................. 3-1
3.3.2 Reports commissioned by Environment Waikato.......................................... 3-3
3.4 Other investigations .................................................................................................... 3-4
4 Field Data Collection..................................................................................... 4-14.1 Approach ...................................................................................................................... 4-1
4.2 Methodology................................................................................................................. 4-1
4.3 Erosion inventory logging methodology................................................................... 4-3
4.4 Video survey................................................................................................................. 4-6
4.5 River level during fieldwork........................................................................................ 4-6
5 River Reach Analysis.................................................................................... 5-15.1 Background .................................................................................................................. 5-1
5.2 River channels ............................................................................................................. 5-1
5.3 Geological factors........................................................................................................ 5-2
5.3.1 Walton Sub Group ......................................................................................... 5-2
5.3.2 Hinuera Formation......................................................................................... 5-3
5.3.3 Taupo Pumice Alluvium................................................................................. 5-5
5.4 Geomorphic history..................................................................................................... 5-5
5.4.1 Landscape foundations ................................................................................. 5-6
5.4.2 Hinuera Surface............................................................................................. 5-6
5.4.3 The first Waikato River valley........................................................................ 5-6
5.4.4 The Taupo Pumice Eruption.......................................................................... 5-7
5.4.5 Recent changes............................................................................................. 5-8
5.4.6 Summary ....................................................................................................... 5-8
5.5 Waikato River reaches................................................................................................. 5-8
5.6 Waikato River analogue? .......................................................................................... 5-12

W A I K A T O R I V E R B A N K E R O S I O N S T U D Y V O L U M E 1
Contents
Prepared for Mighty River Power, 17 April 2007 J:\Jobs\42089850\6000\R044 FINAL Rev A 17-4-07.doc
2
6 Erosion Inventory.......................................................................................... 6-16.1 Introduction .................................................................................................................. 6-1
6.2 General patterns .......................................................................................................... 6-1
6.2.1 Length of river bank affected by erosion ....................................................... 6-1
6.2.2 Area of bank erosion ..................................................................................... 6-1
6.2.3 Bank erosion and river level .......................................................................... 6-2
6.2.4 River bank slope............................................................................................ 6-3
6.2.5 Bank erosion age........................................................................................... 6-4
6.2.6 Bank erosion at river bends........................................................................... 6-4
6.3 Erosion types ............................................................................................................... 6-4
6.4 Bank erosion distribution ........................................................................................... 6-5
6.5 Bank geology ............................................................................................................... 6-6
6.6 Bank erosion and structures ...................................................................................... 6-7
7 Causative Erosion Factors ........................................................................... 7-17.1 Introduction .................................................................................................................. 7-1
7.2 Causes of slope failure................................................................................................ 7-1
7.3 Bank erosion summary ............................................................................................... 7-2
7.4 Causative erosion factors ........................................................................................... 7-2
7.4.1 General patterns............................................................................................ 7-2
7.4.2 Bank slope characteristics............................................................................. 7-3
7.4.3 Bank materials............................................................................................... 7-4
7.4.4 Vegetation and landuse................................................................................. 7-4
7.4.5 Water as a causative factor ........................................................................... 7-5
7.4.6 River processes............................................................................................. 7-6
7.4.7 Bed degradation issues................................................................................. 7-7
7.4.8 Retrogressive and progressive failure modes............................................... 7-8
7.4.9 Relative ranking of bank erosion causative factors....................................... 7-8
7.5 Future bank erosion .................................................................................................... 7-9
8 Summary and Conclusions.......................................................................... 8-18.1 Summary....................................................................................................................... 8-1
8.1.1 Environmental history .................................................................................... 8-1
8.1.2 Bank erosion characteristics and distribution................................................ 8-1
8.1.3 Bed degradation ............................................................................................ 8-2

W A I K A T O R I V E R B A N K E R O S I O N S T U D Y V O L U M E 1
Contents
Prepared for Mighty River Power, 17 April 2007 J:\Jobs\42089850\6000\R044 FINAL Rev A 17-4-07.doc
3
8.2 Conclusions.................................................................................................................. 8-2
9 References..................................................................................................... 9-1
10 Limitations................................................................................................... 10-1

W A I K A T O R I V E R B A N K E R O S I O N S T U D Y V O L U M E 1
Tables, Figures, Appendices
Prepared for Mighty River Power, 17 April 2007 J:\Jobs\42089850\6000\R044 FINAL Rev A 17-4-07.doc
4
Tables, Figures, Appendices
TablesTable 4-1 Mass movement classification ............................................................................................ 4-5
Table 5-1 Proportions of Waikato River bank formed in the various sediment types ......................... 5-5
Table 5-2 Characteristics of Waikato River reaches........................................................................... 5-9
Table 6-1 Bank length and area affected by erosion .......................................................................... 6-2
Table 6-2 Area of bank erosion features............................................................................................ 6-2
Table 6-3 Vertical distribution of bank erosion.................................................................................... 6-3
Table 6-4 Bank slope at failure sites ................................................................................................... 6-4
Table 6-5 Bank erosion site distribution along the Waikato River valley ............................................ 6-5
Table 7-1 Summary bed degradation rates in Waikato River ............................................................. 7-7
FiguresFigure 2-1 Study Area: Karapiro to Ngaruawahia ................................................................................ 2-2
Figure 4-1 Erosion Inventory Data Collection ...................................................................................... 4-2
Figure 5-1 Schematic geological section of the Waikato River............................................................ 5-4
Figure 5-2 Location of the identified reaches on the Waikato River .................................................. 5-11
Figure 6-1 Distribution of river bank erosion sites down valley from Karapiro Dam (sites/km)............ 6-6Error! No table of figures entries found.
AppendicesVolume 2 - 4
A. Erosion Inventory Sheets
Volume 1
B. Bank Erosion Site Data

W A I K A T O R I V E R B A N K E R O S I O N S T U D Y V O L U M E 1
Executive Summary
Prepared for Mighty River Power, 17 April 2007 J:\Jobs\42089850\6000\R044 FINAL Rev A 17-4-07.doc
ES-1
Executive Summary
Introduction
Mighty River Power commissioned URS New Zealand to undertake a study of bank erosion along the Waikato River between Karapiro and Ngaruawahia. Resource consent Condition 6.11(iv) requires Mighty River Power to determine the amount and investigate the causes of active river erosion. This study discusses these matters and in addition addresses the wider issue of bank erosion resulting from other processes in order to develop a broad understanding of erosion issues along the river valley.
Bank erosion occurs as a result of mass movement processes (where gravity is the primary driving force) and/or fluvial processes (where water is the primary driving force). Mass movement processes have been documented in this study using an internationally recognised standard scheme that classifies the style of movement as a fall, topple, slide, spread or flow. This simple scheme was chosen to avoid pre-judging potential causative factors. Fluvial erosion features were similarly identified using a standard descriptive scheme of sheetwash, rilling, gullying or tunnel erosion.
The survey of bank erosion sites was carried out in August – September 2006, using boats, and all mass movement and fluvial bank erosion sites were logged. An atlas of bank erosion sites has been compiled to accompany this report. In addition, the entire length of river bank was videoed for the purpose of providing a permanent DVD record of the condition of the bank system.
The survey identified all sites where bank erosion could be seen to be presently occurring, or was active in the recent past. The spatial location of each site was recorded, both horizontally along the river length and vertically on the bank. In addition, the size; type of failure; relative age; bank characteristics including height, slope, geology, vegetation cover, and land use; and location with respect to channel bends, and pools was recorded.
The Waikato River
The Waikato River valley is cut in volcaniclastic sediments comprising pumiceous silts, sands and gravels that fall into three different age classes. Most of the valley (77 %) is cut into the geologically recent Taupo Pumice Alluvium, and this is the dominant bank material along much of the valley downstream of Cambridge. The Hinuera Formation forms 16 % of the river banks, and is most common north of Hamilton City. The older Walton Sub-Group sediments form only 7 % of the river banks, and are mostly found in the upstream part of the river between Karapiro Dam and Cambridge.
The Waikato River valley is a geologically very young feature formed in the aftermath of two very large volcanic eruptions originating in Lake Taupo. The main surface of the Hamilton Basin and the first Waikato River valley that is cut into it were formed between about 22,500 and 14,000 years ago after the Oruanui Eruption.
The present Waikato valley is more recent, having formed a few decades after the Taupo Pumice Eruption of 181 AD, and is entirely contained within the older valley. It was formed by massive Lake Taupo outburst floods when discharges in excess of 15,000 m3/sec swept down the Waikato River valley.
About 800 years ago a new phase of river sedimentation began, raising the bed of the river seven to eight metres, and thus reducing the effective height of the valley side slopes. From 1947 no sediment has been transported downvalley from Karapiro Dam, and trends of aggradation of the river bed have been replaced with bed degradation.
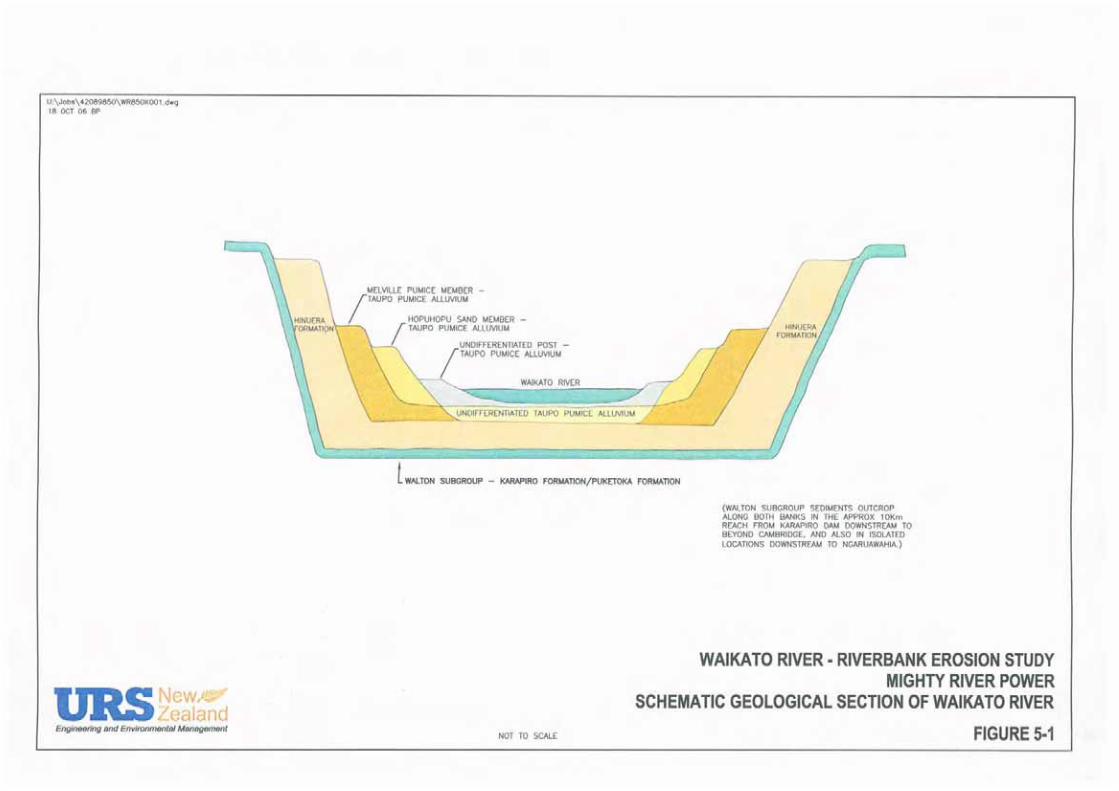
A schematic geological section which shows how the deposits fit within the original valley is presented in Figure 5-1.
This environmental history is important as it shows the present Waikato River valley was formed by a regime with discharges an order of magnitude greater than present flow. The present flow regime did not create the Waikato valley and the river may therefore be regarded as an underfit stream.

W A I K A T O R I V E R B A N K E R O S I O N S T U D Y V O L U M E 1
Executive Summary
Prepared for Mighty River Power, 17 April 2007 J:\Jobs\42089850\6000\R044 FINAL Rev A 17-4-07.doc
ES-2
Erosion Sites
A total of 389 bank erosion sites were identified. However, these were generally small features affecting only 2 % or 4.4 ha of the total valley side area.
The main erosion types are fall/topple mass movement features (60 %), with the remainder being slide failures. Over 57 % of bank erosion sites are on near-vertical or very steep slopes.
Erosion sites occur along the valley at around seven per kilometre, with a marked drop-off in sites in the last 15 km before Ngaruawahia. Sub-reaches with increased numbers of erosion sites occur at kilometres 9-10 near Cambridge, kilometres 22 and 29 upvalley from Hamilton, and kilometres 34 and 37 within Hamilton City.
At 18 % of sites covering 26 % of the total bank erosion area, the toe of the failures did not reach to normal river level, and it is considered very unlikely that river processes were significant causative factors in these features.
Where the toe reached to normal river level, the top of the failures occurred to various heights on the banks. At 10.5 % of sites, the erosion was entirely contained within 1 m of the river level. These sites, covering only 3.6 % of the total erosion area, are considered likely to be significantly affected by river erosion processes.
A further 14.4 % of the total area affected by erosion occurred at up to 3 m above normal river level, and river erosion processes may have contributed to these failures. In 56 % of the bank area affected by erosion, the top of the failures occurred to more than 3 m above normal river level, it is unlikely that river erosion processes would be significant causative factors here.
In total, active river erosion processes may have been contributory causative factors in up to 30 % of bank erosion features. These sites covered only 18 % of the total area affected by erosion.
Bank erosion sites are not preferentially associated with zones of increased flow velocity along the channel. Only 33 % of sites occur on the outside of river bends, and 58 % occur on straight river sub-reaches. Some 30 % of bends had no associated bank erosion.
The pattern of bed degradation was examined and found to show no relationship with bank erosion distribution.
Findings
Bank erosion results from a combination of causative factors and an order of relative significance can be identified as follows.
� Significant causative factors that play a role in all bank erosion features:
o Bank slope
o Bank materials.
� Moderately significant causative factors that play a role in some sites, or occur as a result of specific environmental conditions such as heavy rainfall, or prolonged wet periods:
o Groundwater flow
o Soil moisture
o Tree root prising and wind throw
o Land uses.
� Minor causative factors that are of limited spatial significance or occur due to infrequent major flood events, or that do not yet play a role in bank erosion:

W A I K A T O R I V E R B A N K E R O S I O N S T U D Y V O L U M E 1
Executive Summary
Prepared for Mighty River Power, 17 April 2007 J:\Jobs\42089850\6000\R044 FINAL Rev A 17-4-07.doc
ES-3
o River flow effects
o Vegetation cover
o Bank height
o Bed degradation.
The dominance of fall or topple type slab failures results from the combination of very steep or vertical valley sides with fractures that develop in case hardened or highly cohesive sediments, assisted by tree root prising or wind throw.
Slide failures occur on moderate or steep slopes where bank materials favour percolating groundwater being obstructed by low permeability layers. This results in development of a failure surface along which movement is likely to occur during wet conditions when the slope is loaded with groundwater and soil moisture, and exacerbated by land uses that change slope morphology, concentrate stormwater flow onto the slope, or remove vegetation cover.
River processes are likely to be a contributing factor close to the water line where small scale boat wake erosion may occur, along with scour removal of non-cohesive material, particularly toe deposits of mass movement failures that were initiated higher on the valley side. However, these are of limited spatial extent.
The spatial distribution of bank erosion features along the Waikato River valley between Karapiro Dam and Ngaruawahia both horizontally along the valley, and vertically up the valley sides shows that:
� River erosion processes are not a major causative erosion factor; and
� The activities of Mighty River Power in regulating the flow regime and contributing to on-going bed degradation have only a minor influence on present bank erosion patterns.

W A I K A T O R I V E R B A N K E R O S I O N S T U D Y V O L U M E 1
Section 1 Introduction
Prepared for Mighty River Power, 17 April 2007 J:\Jobs\42089850\6000\R044 FINAL Rev A 17-4-07.doc
1-1
1 Introduction
Mighty River Power Ltd commissioned URS New Zealand Ltd (URS) to undertake a study of bank erosion along the Waikato River between the Karapiro Dam and Ngaruawahia. Mighty River Power operates the Waikato Hydro System under the terms of several resource consents granted by Environment Waikato that came into effect in May 2006.
The Karapiro Dam is the last of the series of eight dams on the river, and Mighty River Power is required by resource consent conditions to monitor aspects of the Waikato River environment in order to document changes that may be occurring downriver from the dam. The principal channel monitoring condition of resource consent WRC105228 directly relevant to this study of bank erosion is as follows:
Condition 6.11 (iv) A 5-yearly geomorphologic survey to determine the amount and to investigate causes of active river and reservoir edge erosion in the Waikato River between Karapiro dam and Ngaruawahia (this part of the survey is to be commenced as soon as practicable and shall include consideration of the effects of ramping rate on active edge erosion).
In addition, two other monitoring conditions are relevant as follows:
Condition 6.11 (vi) A 5-yearly survey of riverbed levels below Karapiro as far as Ngaruawahia.
Condition 6.11 (vii) River bed cross sections in the vicinity of the Hamilton Traffic Bridge, of the Fairfield Bridge, and of the subfluvial water supply main to Hamilton East from the Hamilton Water Treatment Station. These are to be located and measured in a manner sufficient to demonstrate any changes in bed level which may threaten the structural integrity of these facilities.
Mighty River Power thus has a number of objectives for this study.
� Undertake a survey of bank erosion to provide an inventory that satisfies monitoring condition 6.11(iv);
� To undertake an assessment of the factors that cause riverbank erosion;
� Predict future erosion issues with the riverbanks; and
� Provide a basis for determining ongoing changes in the riverbank erosion, so that appropriate planning and engineering responses can be formulated.

W A I K A T O R I V E R B A N K E R O S I O N S T U D Y V O L U M E 1
Section 2 Scope of Work
Prepared for Mighty River Power, 17 April 2007 J:\Jobs\42089850\6000\R044 FINAL Rev A 17-4-07.doc
2-1
2 Scope of Work
The scope of work for this project is based on Section 4 of the Technical Brief prepared by Mighty River Power (G2006/7). This scope detailed three specific areas of work as discussed below.
1. Determine factors contributing to riverbank erosion -This involved a review and assessment of available scientific and hazard information on riverbank erosion processes, and was supplemented by an analysis of geological reports and scientific papers that provided important background to the erosion issues. Information sources have included published public domain information; reports provided by Mighty River Power; limited aerial photographs; and geotechnical reports from Hamilton City Council property files.
This information was used to assess historical and predict future riverbank erosion patterns, and the processes and causative factors involved.
In addition, the review has covered information on the comparison of erosion effects with uncontrolled rivers. There have been previous attempts to define an analogue for the Waikato River. However, as will be discussed below, the characteristics of the Waikato River are unique and it is not practicable to make such a comparison.
2. Determine relative contributions of factors to riverbank erosion – The causative factors of riverbank erosion are potentially varied, and can include many combinations of natural processes, human activities, hydro activities and other factors. The relative contributions of these factors have been assessed.
3. Inventory of Erosion Sites- This aspect of the work was to identify and record an inventory of existing and potential erosions sites. The inventory includes the first 20m of all tributaries. In addition to preparing a hard copy inventory, URS has also prepared a video archive of the river bank condition in 1 km intervals for both banks.
This report has been independently peer reviewed by Prof. M Crozier, Dr. M Hicks and Dr. G Smart. As a result of the peer review comments and on the instruction of Mighty River Power, this report has been revised (issue Rev. A). We note that the peer review comments were wide ranging and some addressed issues beyond the URS scope of work. Only those relevant to our scope have been actioned in the issue of the revised report. The erosion inventory data sheets presented in Appendix A remain unchanged.


W A I K A T O R I V E R B A N K E R O S I O N S T U D Y V O L U M E 1
Section 3 Data Review
Prepared for Mighty River Power, 17 April 2007 J:\Jobs\42089850\6000\R044 FINAL Rev A 17-4-07.doc
3-1
3 Data Review
3.1 Previous work The present study seeks to provide an inventory and analysis of bank erosion along the Waikato River from Karapiro Dam to Ngaruawahia. The bank erosion issue was raised during Mighty River Power’s recent resource consent application processes for the Waikato River hydro system, and some work was done on erosion, and the associated issue of bed degradation. Both Mighty River Power and Environment Waikato have commissioned studies that, in part, concerned these issues, and in this section we briefly outline this work and a variety of other relevant investigations.
3.2 Aerial photographs Historic aerial photographs can be a good source of relatively low cost small scale data (i.e. data that covers a wide area) on changes in river geomorphology. Typically, aerial photographs for most parts of New Zealand are available from the 1940s to the present, and for river surveys, photographs taken 5 to 10 years apart are useful for determining patterns of change. Use of overlapping pairs of images in a stereoscope allows detailed interpretation of surface morphologies. Scale is an important factor, and for a river the size of the Waikato, 1: 25,000 photographs would be the smallest practicable scale to work with. This would show a willow tree canopy at about 1mm diameter, so that bank erosion features down to a size of about 20 m across could be detected. Of more use would be larger scale photographs at 1:10,000 or 1:5,000; however, the disadvantage of these is the increased cost due to many more images being required, particularly when there is nearly 55 kilometres of river to be examined.
Given these cost constraints, aerial photographs were not purchased for this project. Some aerial photography was made available through Environment Waikato via Mighty River Power, and these provided coverage of some sections for the river as follows:
� Runs 632, and 831, flown in June 1943. Coverage of Cambridge area, and parts of Hamilton City.
� Run 3275, flown in May 1963. Covering Ngaruawahia.
� Survey number SN 5479, flown in September 1979. Scattered coverage across the Hamilton Basin.
� Survey number SN 11978 flown in August 1992 and February 1993. Scattered coverage across the Hamilton Basin.
� Survey number SN 9990c, flown in February 2002. Scattered coverage around Hamilton City.
In addition, the 2002 colour aerial photography is available with the MapToaster mapping software. These can be viewed at a scale of 1: 10,000, although the software does not permit stereoscopic examination.
Bank erosion is difficult to detect on these images, in part due to the scale, and also because the steep slope and dense vegetation on most of the banks renders slope features difficult to observe. The main use of the images was to assist in understanding the distribution of the various geological formations along the river.
3.3 River bank erosion and related studies
3.3.1 Studies commissioned by Mighty River Power A wide range of technical studies were commissioned by Mighty River Power in support of its 2001 applications for resource consents to operate the Waikato Hydro System. These works were summarised

W A I K A T O R I V E R B A N K E R O S I O N S T U D Y V O L U M E 1
Section 3 Data Review
Prepared for Mighty River Power, 17 April 2007 J:\Jobs\42089850\6000\R044 FINAL Rev A 17-4-07.doc
3-2
in the Assessment of Environmental Effects report* that accompanied the applications. Generally the whole Waikato River was examined in these studies, and the section from Karapiro Dam to Ngaruawahia did not receive special attention. However, one study focussed on the Hamilton City reach of the river. The following studies are most relevant to the present work.
Waikato River Geomorphic Processes Site Survey Inventory (1999)
This study was carried out by JM Bowler and SR Andrews of OPUS International Consultants Ltd. It included an inventory of bank erosion sites, identifying 95 in the section of the Waikato River from Karapiro Dam to Ngaruawahia. It was noted that the survey had been carried out not long after a series of floods that had occurred in 1998.
Waikato River Geomorphic Processes Study: Repeat Site Survey Inventory and Interpretations; Karapiro to Ngaruawahia, September (2001)
This study was carried out by SJ Harding and SR Andrews of OPUS International Consultants Ltd. It was a repeat of the 1999 study, in part aimed at identifying how the river banks might have recovered from the flood events of 1998. Although 128 sites were recorded, it was noted that some 60 % of the sites previously identified had by then become healed over, at least in part.
Waikato River Geomorphic Processes (2001)
This report by Dr J. McConchie of the Research School of Earth Sciences at Victoria University of Wellington was a major study of the geomorphology of the Waikato River basin and hydro lakes. It included a survey and analysis of bank erosion processes, but did not include a detailed site inventory.
Waikato River Sediment Budget and Processes (2001)
This report was prepared by D.M Hicks and others of NIWA. It dealt with the issue of bed degradation from a sediment budget perspective, and did not specifically address bank erosion. It discussed the variety of processes that had contributed to bed degradation, including sand mining, and the interruption of bed sediment transport that had resulted from construction of the Karapiro Dam.
Waikato River Bed Sediment Characteristics Between Cambridge and Ngaruawahia (2002)
This report was prepared by R.K. Smith and others of OPUS International Consultants, and provided a description of bed sediment characteristics from several sites along the Waikato River, and in particular discussed the bed armouring that appeared to be occurring between Karapiro Dam and Hamilton City in response to continued bed degradation.
Waikato River Bank Stability at Hamilton City (2002)
This report by G.J. Fairless of OPUS International Consultants Ltd conducted a formal analysis of bank stability relationships at sites in Hamilton City.
Taupo Waikato Resource Consent Hearing (2003)
This statement of evidence of Dr J. McConchie was presented to the hearing of the Mighty River Power Taupo Waikato Resource Consent applications. It summarises the work he carried out for his Waikato River Geomorphic Processes study.
* Mighty River Power 2001 Taupo Waikato Resource Consents Application and Assessment of Environmental Effects David Roper
and Environmental Group. March 2001. 206 p.

W A I K A T O R I V E R B A N K E R O S I O N S T U D Y V O L U M E 1
Section 3 Data Review
Prepared for Mighty River Power, 17 April 2007 J:\Jobs\42089850\6000\R044 FINAL Rev A 17-4-07.doc
3-3
List of reports cited
1. OPUS 1999 (J.M. Bowler and S.R. Andrews) Waikato River Geomorphic Processes Site Survey Inventory OPUS International Consultants Ltd. Wellington Office September 1999. Data Report Issue 1: 23/9/1999.
2. OPUS 2001 (S.J. Harding and S.R. Andrews) Waikato River Geomorphic Processes Study: Repeat Site Survey Inventory and Interpretations; Karapiro to Ngaruawahia, September 2001 OPUS International Consultants Ltd. Wellington Office December 2001.
3. McConchie, J. 2001 Waikato River geomorphic processes Earth Sciences, Victoria University 248 p.
4. McConchie, J. 2003 Statement of Evidence Presented to Mighty River Power Taupo Waikato Resource Consent Hearing. Volume 1, 85 p; and Volume 2, 101 Figures.
4. Hicks, D.M., Webby, M.G., Duncan, M.J., and Harding, S. 2001 Waikato River sediment budget and processes NIWA.
5. OPUS 2002, (R.K. Smith et al) Waikato River bed sediment characteristics between Cambridge and Ngaruawahia OPUS International Consultants Ltd. Hamilton Office April 2002. Client report Mighty River Power02240.
6. OPUS 2002 (G.J. Fairless) Waikato River Bank Stability at Hamilton City OPUS International Consultants Ltd. Hamilton Office June 2002. Client Report # 2166.
3.3.2 Reports commissioned by Environment Waikato Environment Waikato has undertaken studies of the Waikato River, with specific attention to bed degradation in the reach centred on Hamilton. The works have been part of Project Watershedundertaken by Environment Waikato on soil conservation, river management, and flood protection in the Waikato River catchment. The relevant reports are referred to as the Middle Waikato Bed Degradation Studies and reports from Stages II, III, and IV have been made available for the present study.
Degradation of the Waikato River Karapiro to Ngaruawahia review of existing knowledge and recommendations for future work (2003)
This report by G. Smart of NIWA reviews evidence presented at Resource Consents hearings and previous bed surveys. It included a general survey of bank condition, but erosion sites were not accurately located.
Middle Waikato River bed investigations Stage II: ramping effects (2004)
This report was prepared by D. Johnson and others of ASR Marine Ltd. It examined the effects of ramping on flow velocities along the Waikato River through the Hamilton City Reach.
Middle Waikato River bed degradation investigations Stage II: Bed Survey (2005)
This report prepared by NIWA scientists provided data from an echo sounding and seismic survey along river thalweg from Narrows to Horotiu.
Analysis of degradation: Waikato River Karapiro to Ngaruawahia (2005)
This report by G. Smart reviewed results of the previous Stage II studies.
Middle Waikato River bed degradation investigations Stages III & IV: Stage IV Bed Degradation Management Strategy Final Draft – Appendices (2006)
This BECA report included an appendix describing bank condition, with erosion features generally described and located, photographs, and a location list of infrastructure.

W A I K A T O R I V E R B A N K E R O S I O N S T U D Y V O L U M E 1
Section 3 Data Review
Prepared for Mighty River Power, 17 April 2007 J:\Jobs\42089850\6000\R044 FINAL Rev A 17-4-07.doc
3-4
Middle Waikato River bed degradation investigations Stages III & IV: Proposed Middle Waikato River Bed Degradation Management Strategy (2006)
This BECA report provided a list of strategies to address bed degradation in the Waikato River.
List of reports cited
1. Smart, G. 2003 Degradation of the Waikato River Karapiro to Ngaruawahia review of existing knowledge and recommendations for future work. Environment Waikato Report, August 2003.
2. ASR 2004 Middle Waikato River bed investigations Stage II: ramping effects Report prepared for Environment Waikato by D. Johnson, K. Black, and J. Mathew. ASR Ltd Marine and Freshwater Consulting and Research. 26 August 2004 110 p.
3. NIWA 2005 Middle Waikato River bed degradation investigations Stage II: Bed Survey Report prepared for Environment Waikato by D. Ramsay, T. Hume, M. Stevens, T. Willison, A. Taumorpeau NIWA Client report HAM2004-050 NIWA Hamilton Office. January 2005.
4. Smart, G. 2005 Analysis of degradation. Waikato River Karapiro to Ngaruawahia Report prepared for Environment Waikato. 65 p.
5. BECA 2006 Middle Waikato River bed degradation investigations Stages III & IV: Stage IV Bed Degradation Management Strategy Final Draft - Appendices Report prepared for Environment Waikato by Beca Infrastructure Ltd, January 2006.
6. BECA 2006 Middle Waikato River bed degradation investigations Stages III & IV: Proposed Middle Waikato River Bed Degradation Management Strategy Report prepared for Environment Waikato by Beca Infrastructure Ltd, May 2006. 28 p.
3.4 Other investigations Other reports not directly related to the above two categories, but containing relevant information are:
Morphological Model Study
This was a 1994 report by Barnett Consultants Ltd. It has not been sighted for the present study, but was referred to by Hicks, Smart, and others. A number of river cross sections were surveyed, and an analysis was carried out that predicted the pattern of bed degradation for several decades into the future. Cross section surveys were done systematically from Karapiro Dam downstream to Victoria Bridge in Hamilton at XS sites: 3-17, 174, 173B, 173, 172, 171, 170 - 159, 159A, and 158 – 151.
Lower Waikato River Survey 1998
This 1999 report by the Asset Management Group provides the data on cross section surveys carried out on the Waikato River between Karapiro Dam and Port Waikato by Discovery Marine in June 1998, with some cross sections repeated in October after the 1998 flood.
Waikato River survey report Horotiu Bridge to Narrows Bridge
This 2002 report by the Asset Management Group reported on cross section surveys carried out by Discovery Marine in central part of river upstream and downstream of Hamilton (from XS 160 near the Narrows Bridge, to XS 137 at Horotiu Bridge). This survey was carried out in August 2002 just after the July flood, which although mainly affecting the Waipa River, was also a significant event in the lower Waikato River. Subsequently, in 2003, Discovery Marine completed the remaining cross sections (between Karapiro and the Narrows, and from Horotiu to Ngaruawahia).
Waikato River riverbed re-survey

W A I K A T O R I V E R B A N K E R O S I O N S T U D Y V O L U M E 1
Section 3 Data Review
Prepared for Mighty River Power, 17 April 2007 J:\Jobs\42089850\6000\R044 FINAL Rev A 17-4-07.doc
3-5
This 2006 report by Discovery Marine contains data on the 93 river cross sections surveyed between Karapiro Dam and Ngaruawahia for Mighty River Power in compliance with their resource consent conditions.
These three complete sets of river cross section surveys have been able to utilise modern total station, GPS and echo-sounding equipment, and have achieved accuracies of between �2 cm to �10 cm over 2 m to 10 m depth ranges. Earlier surveys from the 1930s to the mid-1990s had rather less coverage of cross section sites and the data quality was poorer with accuracies of � several 10s of centimetres.
Morphodynamic channel and stability of the Waikato River: Karapiro to Ngaruawahia Reach
This is a 2006 MSc thesis by A. Wood prepared in the School of Earth Sciences, University of Waikato. It contains voluminous data on many aspects relevant to bed degradation and bank erosion, including an inventory of 139 bank erosion sites along the Waikato River from Karapiro Dam to Ngaruawahia.
W A I K A T O R I V E R B A N K E R O S I O N S T U D Y V O L U M E 1
Section 4 Field Data Collection
Prepared for Mighty River Power, 17 April 2007 J:\Jobs\42089850\6000\R044 FINAL Rev A 17-4-07.doc
4-1
4 Field Data Collection
4.1 Approach Key objectives of the field data collection for this study included:
� Field checking and, where necessary, modifying interpretations from the data review phase;
� Identifying and mapping the type and location of existing erosion sites (i.e. the compilation of an inventory of existing erosion sites); and
� Creating a video record of the condition of the river banks.
Our primary approach to meeting these objectives was to access the riverbanks via a small boat between 16 August 2006 and 15 September 2006, and to undertake detailed mapping of river bank erosion features†. In order to collect sufficient data to assess the causative factors for bank erosion on the Waikato River, this mapping was not limited to mass movement features at the river edge only. Rather, a range of mass movement and fluvial erosion features over the full bank height was documented in order to characterize slope processes and subsequently evaluate causative factors.
A field logging form was developed as the basis for recording field observations, which utilized both mass movement and riverbank classification criteria. Specific details of the methodology used are discussed below. The logging form and methodologies described provide a record of the field procedures used to collect erosion inventory data, and provide a guide so that future surveys can be comparable.
The detailed mapping of erosion features was supplemented by general observations of river bank conditions using boat and foot access, as required, and by a video survey where the current condition of each bank was filmed in its entirety from Ngaruawahia to Karapiro.
4.2 Methodology Information from the data review, including existing geologic information and the preliminary reach analysis, was compiled onto base maps for use in the field. Approximately 30 aerial photograph base maps, at a scale of 1:5,000, were prepared and laminated for use on the river. These showed the river and surrounds, the approximate centre line of the river, the distance from Karapiro Dam, and map co-ordinates. Final site location maps based on these field maps are shown in Appendix A.
A chainage system based on a line down the centre of the river, with the Karapiro Dam as 0 km and the Ngaruawahia S.H. 1 bridge at approximately 54 km, was utilized for this study. Erosion sites were located based on a line projected perpendicular from the centre line onto the true left or true right bank‡.
A detailed Health, Safety and Environment Plan identifying potential hazards for field workers was compiled. This included steps to eliminate or reduce potential hazards and provide safe working methods. Crew were briefed on this plan and subsequently had daily tail-gate safety meetings.
URS used a 15-foot jet boat (see Figure 4-1) for all the on-river work, except for the video survey, which was undertaken using Mighty River Power’s boat.
Identification of erosion sites commenced on 16 August when 4 URS staff, including the technical specialist for the project and two engineering geologists, boated up-river from Hamilton to Karapiro Dam
† The term erosion used here follows the Oxford Dictionary of Earth Sciences (Allaby and Allaby, 1990) definition: Movement of soil and rock material by agents such as running water, wind, moving ice, and gravitational creep (or mass movement).
‡ True left/right referenced when facing downstream.

W A I K A T O R I V E R B A N K E R O S I O N S T U D Y V O L U M E 1
Section 4 Field Data Collection
Prepared for Mighty River Power, 17 April 2007 J:\Jobs\42089850\6000\R044 FINAL Rev A 17-4-07.doc
4-2
to determine the types and approximate number of erosion features to be logged and confirm data logging methodologies.
Figure 4-1 Erosion Inventory Data Collection
W A I K A T O R I V E R B A N K E R O S I O N S T U D Y V O L U M E 1
Section 4 Field Data Collection
Prepared for Mighty River Power, 17 April 2007 J:\Jobs\42089850\6000\R044 FINAL Rev A 17-4-07.doc
4-3
A field data collection programme was implemented to prepare an inventory of erosion sites. URS commenced erosion site mapping on 17 August 2006. A total of 16 days were spent logging erosion sites, between 17 August and 15 September 2006. The number of days spent logging was a function of the number and complexity of erosion sites identified, weather conditions, boating logistics, and river levels. A river level of 13.25 m, or lower, at Hamilton Boat ramp was set in conjunction with Mighty River Power as an approximate Go/No-Go level for mapping activities, as in periods of higher water level, there is less river bank exposed along the lower reaches of the river. However, in the event no days were lost due to this restriction.
4.3 Erosion inventory logging methodology The field logging form used for the erosion site inventory is shown in Appendix A. These forms were completed in the field by a URS engineering geologist.
The location of individual erosion sites was recorded with a hand-held GPS unit. However, as most sites could not be accessed by foot, these often represent the location where the boat could safely be moved near the site (access to sites was recorded on the logs). In addition, GPS units of the type used typically have an accuracy in the order of 30 m +/-, which is further reduced when the number of satellites received drops, as occurred near Karapiro where the river was narrow and the banks steep and high. Due to these limitations, site locations were also estimated from the aerial photographs and the Site ID recorded using the project chainage system. Bearings given on the logging form are true north bearings.
The date and time of mapping was recorded, and the approximate river level at Hamilton at this time was subsequently determined from Environment Waikato online data in order to provide a guide to the general state of the river.
River bank slope angles were estimated where boat only access was available and, where foot access was possible, using a clinometer. Vegetation cover on, and surrounding, the erosion feature was recorded. In the Vegetation Cover category, the approximate maximum heights (above ground level) of specific vegetation species on the river bank was sometimes given e.g. Pines (~30m). “Additional notes on vegetation (width, density, etc)” records, where appropriate: the approximate “width” (i.e. plan distance or “thickness”) of vegetation extending from the river bank inland e.g. >25m, and; the “density” of the vegetation, which was visually assessed as either; sparse (i.e. would be easy to walk through), moderately dense, or dense (i.e. would be difficult to penetrate on foot).
Geologic descriptions were often limited to visual assessment from the boat, checked against the best scale existing maps for the area (e.g. Kear and Schofield 1978). Some additional engineering geologic properties of the materials were recorded where foot access could be obtained or if features were visible from the boat. Engineering geologic descriptions were made according to guidelines from the NZ Geotechnical Society (NZGS 2005).
Key data collected for each erosion site included a description of the size, shape, and vertical location on the bank of the feature. The size of the feature was visually estimated where foot access could not be obtained. Parameters recorded included: the approximate width of the feature (i.e. the maximum horizontal distance across the feature above river level); the approximate height of the feature (i.e. the maximum vertical distance from the crown of the feature to either the toe of the feature§ or to river level (whichever was higher); and the approximate depth of the feature (i.e. the depth material has eroded from the surrounding ground surface, which is generally shown on the Slope Angle diagram as the distance between the solid line (estimated original ground surface) and dotted line (current ground surface)). The “Description of mass movement” category does not record the dimensions of features below river level.
§ Crown and toe as defined by Varnes 1978.

W A I K A T O R I V E R B A N K E R O S I O N S T U D Y V O L U M E 1
Section 4 Field Data Collection
Prepared for Mighty River Power, 17 April 2007 J:\Jobs\42089850\6000\R044 FINAL Rev A 17-4-07.doc
4-4
In cases where the erosion feature reached to river level, some of the toe material is likely to have been below river level. This material was not mapped as it was not possible to make consistent observations in these sites. In many cases no material could be seen due to water depth, clarity, and velocity, and elsewhere any toe deposits seemed to have been already carried away by the river.
The predominant failure mechanism for each mass movement feature was classified according to the Varnes (1975, 1978), and Cruden and Varnes (1996) engineering geologic classification system based on landslide kinematics (i.e. fall, topple, slide, spread or flow). Table 4-1 has details of the classification system used, however, it is recognized that landslides can include several modes of failure. Field logging indicated the majority of erosion sites were fall/topple or slide type failures.
Cruden and Varnes (1996, Figures 3-3, 3-4, and Table 3-3) also provide terminology for the various parts of these mass movement features, and the relevant terms for the present study are as follows (from the top to the bottom of a bank erosion feature).
Crown – practically undisplaced material adjacent to the highest parts of the erosion feature.
Scarp – steep failure surface down which the head of the feature has slid or become detached from.
Head – upper part of the displaced material at the base of the scarp.
Main body – middle parts of the displaced material
Foot – the lower parts of the displaced material that have ‘broken out’ of the slope and are downslope of any failure surface.
Toe – lower margin of displaced material, most distant from the crown of the feature.
Not all of these features are present at all bank erosion sites. For topple and fall features, typically only the crown and scarp are present, the displaced material having fallen into the river and been carried away. However, for slide features many of these parts could be present.
A 3-tier classification system for the activity of the mapped feature (essentially the “freshness” of the feature) was developed for this project. The following classes were adopted;
� Class 1: Active erosion, bare face to scarp, colluvium likely present at toe slope, vegetation at toe slope may still be green.
� Class 2: Recent erosion, bare scarp with some possible water seepage/staining and minor vegetation growth (e.g. mosses, grasses), colluvium likely removed by river processes.
� Class 3: Older erosion, scarp has largely been re-vegetated with grass and scrub, indication of its presence largely from comparison of younger vegetation compared to surrounding areas.
An engineering geologic sketch was made in the field showing key features of the erosion site. The dimensions of features on the majority of these sketches were visually estimated from river level and are therefore considered approximate.

W A I K A T O R I V E R B A N K E R O S I O N S T U D Y V O L U M E 1
Section 4 Field Data Collection
Prepared for Mighty River Power, 17 April 2007 J:\Jobs\42089850\6000\R044 FINAL Rev A 17-4-07.doc
4-5
Table 4-1 Mass movement classification
Failure Type (from Varnes, 1975)
Characteristics Example Waikato River Example
Slide
Down slope movement of soil and/or rock mass occurring predominantly on surfaces of rupture or thin zones of shear strain.
� Volume of displaced material enlarges from an area of local failure. � Often first signs of movement are cracks in original ground surface along
which the main slide scarp will form. � Modes of sliding include rotational and translational.
Fall
Starts with detachment of soil and/or rock from a steep slope along a surface with little or no shear displacement.
� Material descends mainly through the air by falling. � Movement is rapid. � Except when mass has been undercut, falling will be preceded by small
sliding or toppling movements that separate the displaced material from the undisturbed mass.
� Undercutting by waves or eroding river bank can initiate.
Topple
The forward rotation out of the slope of a mass of soil and/or rock about a point or axis below the centre of gravity of the displaced mass. May be very slow or rapid.
� May be driven by gravity exerted by material upslope of the displaced mass. � Topples may lead to falls or slides depending on the geometry of the moving
mass and surface of separation.
Spread
Extension of a cohesive soil and/or rock mass combined with a general subsidence of the mass into softer underlying material.
� Typically the underlying bed becomes plastic causing an overlying bed to be dragged apart with transverse fissures.
� Often sudden and involves underlying saturated silt or sand. � Surface of rupture is not a surface on intense shear.
Not observed along Waikato River valley
Flow
The distribution of velocities in the displaced mass resembles that of a viscous liquid.
� The flow is spatially continuous with surfaces of shear that are short-lived, closely spaced, and usually not preserved.
� May be relatively slow or rapid. � Mass movement can grade from slide to flow depending on water content,
mobility, and evolution of movement.
Not observed along Waikato River valley
Rotational slide Translational debris
Multiple topples
Topple on river bend

W A I K A T O R I V E R B A N K E R O S I O N S T U D Y V O L U M E 1
Section 4 Field Data Collection
Prepared for Mighty River Power, 17 April 2007 J:\Jobs\42089850\6000\R044 FINAL Rev A 17-4-07.doc
4-6
Groundwater springs or seeps can influence slope stability and where these features were present they were described. Where obvious overland flows or waterfalls were observed on the riverbanks, a classification of the erosion associated with these flows was also adopted, where appropriate. This classification included the following erosion types; sheet (flows causing erosion over a large area), rill (linear incised channels typically of limited width), gully (wider channels that may include multiple flow paths), and tunnel (subsurface piping of flows). Rills are small ephemeral channels up to several tens of centimetres across and of similar depth. They often occur on bare ground after intense rainfall event. Gullies are similar, landforms where the scale is typically measured in metres, but may also reach considerable size where the length and width may be many 10s of metres.
Additional notes on land use, particularly where man-made features may have influenced erosion, were added as needed.
All sites identified in the inventory were photographed.
In some areas, erosion features, or multiple erosion features of the same type, extended over significant lengths of river bank. In these cases representative descriptions of the features were made and the length that these features extended was recorded, rather than completing multiple descriptions of very similar features. These portions of river bank are identified by start and end points as shown on the inventory maps in Volumes 2-4.
4.4 Video survey The video survey involved filming with two tripod-mounted video cameras, focused on the true left and true right banks respectively, while motoring up-river at a speed of approximately 5-knots. Filming was undertaken on 14 and 15 September 2006.
Approximately 12 hours of MiniDV format footage was shot for each river bank.
The MiniDV format has been converted into .mpeg format and included on 4 DVDs. These arranged in 1 km “chapters” for both the right and left banks.
The .mpeg DVD format has slightly reduced quality compared to MiniDV format, in order to fit a high volume of data onto DVD disks. However, higher quality screen captures can be obtained from the original MiniDV tapes if needed.
4.5 River level during fieldwork The level of the Waikato River can fluctuate throughout the day in response to variations in the volume of discharge from the Karapiro Power Station as the demand of electricity changes, and this rise and fall of river level is known as ramping. The level of water on the river bank will affect the amount of erosion that is visible. High water levels will cover part of the toes of larger features, and could entirely cover small erosion features. Thus, river level at the time of field survey is potentially important.
Downstream of Karapiro Dam the river level can change about three metres in six hours, but this range is attenuated downstream to 1.5 m at Hamilton, and less than one metre at Ngaruawahia. These are maximum ramping rates, and the more usual changes in water level are about one third of these values.
Water level is only recorded continuously at the Hamilton Traffic Bridge, thus determining water level at any site along the whole 54 km channel is not practicable as it is not possible to accurately predict the precise time that a ramping wave will pass any particular point along the river.
The erosion survey was carried out during the winter of 2006. This is the high baseflow time of the year as water levels are typically slightly higher due to the greater demand for electricity generation. Mean water level during the fieldwork period (excluding weekends) was 13.14 m at the Hamilton Traffic Bridge. This compares to the 2002 – 2006 average of 12.63 m. The range was between 13.84 m and 12.18 m, but as noted above, no fieldwork was conducted on days when the 9 am river level exceeded 13.25 m.

W A I K A T O R I V E R B A N K E R O S I O N S T U D Y V O L U M E 1
Section 5 River Reach Analysis
Mighty River Power, 17 April 2007 89850\6000\R044 FINAL Rev A 17-4-07.doc
5-1
5 River Reach Analysis
5.1 Background In studies of the geomorphic environment (including landforms and process regimes) along major sections of a river valley, it is appropriate to identify river reaches that are sections of the river valley wherein there is an overall similarity of landforms and processes.
Identifying river reaches is a useful way of reducing complexity and focussing attention on those features that are potentially most significant for understanding spatial differences in the landscape. Reaches may be defined on multiple criteria, and it is acknowledged that the resulting classification in part reflects the biases of the classifier. However, it is a useful starting point for an analysis such as this which seeks to understand a large section of a complex river environment.
Criteria that have been used to identify reaches along the Waikato River from Karapiro Dam to Ngaruawahia including such factors as channel plan form and sinuosity; water surface slope; bank geology; bank height; and channel width.
Initially material was compiled from available maps and reports and a preliminary classification developed prior to undertaking the fieldwork. Four reaches were identified, and this classification was used during the fieldwork phase. After analysing the more detailed field data, it was apparent that a simpler reach classification could be used, and this is presented below**.
Prior to presenting information on the reaches, more general aspects of the Waikato River geomorphic environment are discussed. In particular, it is appropriate to establish a broad context for understanding bank erosion by addressing issues of channel characteristics, bank geology, and geomorphic history.
5.2 River channels A river channel is the landform which contains the river flow. The function of the channel is to provide a conduit for the transfer of water and sediment supplied from upstream, and it adjusts its primary morphological characteristics in order to carry this water and sediment load. These primary characteristics are cross section width and depth, longitudinal profile, and plan form, and they are a complex function of flow (usually taken as bankfull discharge, which is the river discharge that fills the channel to the bank full level without it spilling on to the floodplain), bedload (the balance between bedload supply and bedload transport rate), and human factors, interacting with the channel boundary conditions (vegetation, bed and bank materials).
The channels of alluvial rivers are formed in floodplain deposits previously laid down by the river itself. These materials may be cohesive fine sediments, or non-cohesive sands and gravels, and they are typically ‘soft’ enough for the river to easily change its channel dimensions during a single flood event in order to adjust its form to most efficiently carry its load of water and sediment. Bedrock channels are subject to the same forces, but due to the hardness of the rock, channel change is much slower and may take many hundreds or thousands of years, and so these channels are often not in equilibrium with their driving forces.
The concept of soft and hard alluvial channels represents two end members of a range of channel types, and there is probably no hard and fast distinction between the two. In this context, the Waikato River probably falls somewhere between the two types, as it is flowing in a channel cut in alluvium it has previously laid down, but it is not a typical alluvial channel for it has no floodplain, there is no regular sequence of long slow-flowing pools separated by short swift-flowing riffle sections, and its plan form is not meandering, braided, or anabranching. Its behaviour is more like that of a bedrock channel, although
** The initial reach scheme was: Reach 1, Reach 2a/2b, Reach 3, and Reach 4. The final scheme combined Reaches 1 and 2a, and Reaches 2b and 3 to give the following three reaches. Reach 1 (formerly Reaches 1 and 2a); Reach 2 (formerly Reaches 2b and 3); and Reach 3 (formerly Reach 4). Label cards used in filming the river bank DVD included the initial four reach nomenclature. All other references to reaches have been corrected to follow the final three-reach system.

W A I K A T O R I V E R B A N K E R O S I O N S T U D Y V O L U M E 1
Section 5 River Reach Analysis
Mighty River Power, 17 April 2007 89850\6000\R044 FINAL Rev A 17-4-07.doc
5-2
the materials it is flowing through are much softer than for a typical bedrock river channel. It has irregularly spaced deep pools, often at the outside of bends or in sections where the channel is constricted between narrow banks. The overall plan form of the channel has been inherited from a process regime that has not occurred in the Waikato Valley for more than 10,000 years.
In an alluvial channel, bank erosion is a natural process that represents the way in which the river seeks to bring itself into equilibrium with its driving forces. It is thus a visible representation of the river adjusting its channel shape and is likely to result from changes in the balance between the volume of water carried, and the sediment load. Typically the channel will be of sufficient size to accommodate a range of flows up to the size of small to moderate floods that just fill the channel before flooding out over its surrounding floodplain (i.e. the bankfull discharge). In the case of the Waikato River, even the largest floods do not cause the river to leave its channel, and the river may be regarded as an underfit stream as it occupies a valley that has not been formed by the present river flow regime. This will be discussed in Section 5.5 below.
5.3 Geological factors The banks of the Waikato River between Karapiro Dam and Ngaruawahia are formed in a variety of volcaniclastic materials. For the most part these are pumiceous silts, sands, and gravels deposited by the Waikato River, with some layers of air-fall volcanic ash and ignimbrite. There are three distinct packages of sediments that can be distinguished on the basis of their differing ages and state of weathering. They are the Walton sub group, Hinuera Formation, and Taupo Pumice Alluvium. Although the materials comprising these sediment packages are very similar, there are some differences which influence their geotechnical properties and hence are important for understanding aspects of the bank erosion issues.
All of the geological deposits are relatively young and represent a continuum of weathering processes and compaction for alluvial material.
The information in this section has been derived mainly from Kear and Schofield (1978), with additional material from Healy (1946), McCraw (1967), and Selby and Lowe (1992). A schematic of the geological section across the Waikato River is presented in Figure 5-1, and a listing of river bank geology derived from the maps of Kear and Schofield (1978) is shown in Appendix B, Table 3.
5.3.1 Walton Sub Group The Walton Sub-Group sediments form the basement material and low hills on and around which the younger sediments have been deposited. They were laid down between 1.8 – 0.5 million years ago, and in the Hamilton Basin comprise the Puketoka and Karapiro Formations. They have now been weathered, eroded, and dissected. Mostly these basement materials have been buried by the younger sediments, but they form low hills that rise 20 – 50 m above the main level of the Hamilton Basin plains.
Whilst these materials are termed ‘basement’ for this area, they do not exhibit rock properties. The Walton Sub group being the oldest exhibits more compaction, cohesion and weathering to clay minerals than the overlying soils. Thus the geotechnical properties for this deposit include significant cohesion.
The older Puketoka Formation is highly pumiceous, and due to silica case-hardening is able to stand up in vertical bluffs. Thus, where bluffs occur in weathered pumiceous sediments they are interpreted as Puketoka Formation. For example, the 50 m high bluffs in the 3.5 km reach below the Karapiro Dam are mapped as Puketoka sediments, and downstream for a further ~8 km, parts of the lower banks appear to be cut in this material, although here it is overlain by younger alluvium. The Karapiro Formation comprises sandier material which is not as cohesive so does not form bluffs, and consequently it is more difficult to unequivocally identify these sediments in the field. Geological mapping does not show unequivocal Karapiro Formation to outcrop along the Waikato River course, and instead these deposits are mapped as undifferentiated Walton sub-group sediments.
About 3.8 km (7 %) of the river bank is cut in these materials, mostly in the ~3 km section immediately downstream from the Karapiro Dam.

W A I K A T O R I V E R B A N K E R O S I O N S T U D Y V O L U M E 1
Section 5 River Reach Analysis
Mighty River Power, 17 April 2007 89850\6000\R044 FINAL Rev A 17-4-07.doc
5-3
5.3.2 Hinuera Formation The Hinuera Formation deposits overlie and partly cover the Walton Sub-Group deposits. They are the main material in which the broad outlines of the Waikato River valley have been formed through the Hamilton Basin. These current bedded pumiceous sands and silts were deposited by an ancestral Waikato River in an alluvial fan environment that filled the Hamilton Basin with sediments more than 100 m thick sediments, nearly enveloping the underlying Walton Sub-Group. Deposition occurred between about 26,000 and 17,000 years ago.
About 8.4 km (15.5 %) of the Waikato River valley is cut in these materials, mostly in the reach from Hamilton to Ngaruawahia.

W A I K A T O R I V E R B A N K E R O S I O N S T U D Y V O L U M E 1
Section 5 River Reach Analysis
Mighty River Power, 17 April 2007 89850\6000\R044 FINAL Rev A 17-4-07.doc
5-5
5.3.3 Taupo Pumice Alluvium The Taupo Pumice Alluvium comprises highly pumiceous gravels and sands. Its distribution is much more restricted than the older materials, being confined to terraces along the Waikato River valley. Two main members are recognised: the Melville Pumice Member, and the Hopuhopu Sand Member. These materials have been reworked since they were originally deposited, and lower degradation surfaces have referred to as the Taupo Pumice degradation terrace been formed.
The Melville Pumice Member behaves in a similar manner to the Puketoka Formation, as it is prone to silica case-hardening and can stand up in vertical bluffs. The Hopuhopu Sand member is less cohesive, while the reworked degradational terrace materials are weaker still.
Deposition of the Melville Pumice and Hopuhopu Sand occurred about 1,800 years ago. Subsequently some of these deposits have been reworked, and the degradational terraces formed. Subsequently, a renewed phase of deposition occurred within the last 800 years in response to human intervention in the landscape.
About 42 km (77.5 %) of the Waikato River course is incised within Taupo Pumice Alluvium, with the bulk of this being Taupo Pumice degradation terrace that is common downstream of Cambridge.
Proportions of the Waikato River bank formed in the various sediment types are listed in Table 5-1.
Table 5-1 Proportions of Waikato River bank formed in the various sediment types
Sediment type % of Waikato River bank Taupo Pumice Alluvium 77.5 % Degradation terrace 32.2 % Hopuhopu Sand Member 23.2 % Melville Pumice Member 22.1 % Hinuera Formation 15.5 % Walton sub-group 7.0 %
An idealised cross section through the valley system is shown in Figure 5-1. This shows the inset nature of the progressively younger deposits. The river is shown forming its channel in the middle of the valley, with the banks entirely formed in degradation terrace alluvium that had been deposited shortly after the Taupo Pumice Alluvium. This is a common pattern down the valley, but in places the channel is displaced to the side and this has removed several of the lateral sediment packages. As a result, the bank of the river is sometimes formed directly in Hopuhopu Sand, Melville Pumice, Hinuera Formation, or Walton sub-group sediments.
5.4 Geomorphic history Geomorphic history refers to the sequence of events that have resulted in the present landform arrangement in the Hamilton Basin. This provides an important context for interpreting the present behaviour of the landscape, and in particular, the bank erosion processes that are the focus of this investigation.
The Hamilton Basin covers some 1,600 km2 and extends for about 60 km north-south and 30 km east-west. Hamilton lies at the centre, and it is almost completely surrounded by hills and ranges. The Waikato River enters through a narrow gap in the Maungatautari Range at Karapiro Dam and flows northwest to leave the basin through another narrow gap at Taupiri. The main landform elements in the basin are:
� Low hills rising 20 – 50 m above the basin floor;
� The main alluvial surface (Hinuera Surface) of the Hamilton Basin;
� The valley of the Waikato River;

W A I K A T O R I V E R B A N K E R O S I O N S T U D Y V O L U M E 1
Section 5 River Reach Analysis
Mighty River Power, 17 April 2007 89850\6000\R044 FINAL Rev A 17-4-07.doc
5-6
� Terraces within the Waikato River valley; and
� The channel of the Waikato River.
5.4.1 Landscape foundations The present Hamilton Basin landscape is built on a former landscape that had been eroded into the Walton sub-group sediments over a period of probably at least several hundred thousand years. Remnants of this landscape are seen in the low hills that rise above the main surface of the basin. These are comprised of Walton sub-group sediments capped with volcanic ash deposits. They represent the tops of a dissected landscape that had developed between about 500,000 and 26,500 years ago. The present landscape system has developed through deposition of alluvial materials that have largely covered this former landscape.
5.4.2 Hinuera Surface The present landscape system is largely depositional, as most of the floor of the Hamilton Basin is an alluvial surface underlain by the Hinuera Formation. The surface takes the form of a low angle alluvial fan with an apex at about 80 m above sea level at Karapiro, sloping down to the north and west to be at about 20 m above sea level (asl) at Taupiri. The deposition of the Hinuera Formation by the Waikato River occurred as a result of the spectacular Oruanui volcanic eruption at Lake Taupo 120 km to the southeast. This eruption occurred about 26,500 years ago, and triggered a series of major landscape changes that continued for some 12,000 years (see Wilson, 2001; Manville and Wilson, 2004). It is these events which laid the foundation for the present landform system along the Waikato River valley in the Hamilton Basin.
The Oruanui eruption resulted in a major re-organisation of the landscape around Lake Taupo, and subsequently down the Waikato valley. After the eruption, Lake Taupo was filled to a level about 145 m above its present typical elevation, and this was the first time that a recognisable Lake Taupo had existed. An outlet quickly became established through Waihora Bay 25 km west of Taupo, and the lake fell some 20 m to a stable level it held for the next 4,000 years.
Around 22,500 years ago erosion around Huka Falls breached a natural dam at this location, and Lake Taupo was lowered by some 75 m in a series of massive breakout floods that swept down the Waikato valley. These floods caused extensive deposition which resulted in the formation of the main Hinuera Surface in the Hamilton Basin. The deposition appears to have resembled that of an alluvial fan where the Waikato River flowed into the basin through the narrow Maungatautari Gap at the Karapiro Dam, and was then able to spread widely out across the basin. An average of ~25 m built up over the period from before 22,500 years ago until 17,600 years ago. The later phases of this process are recorded on the main surface of the Hamilton Basin where several old channels of the Waikato River can still be seen††.At this stage the present valley of the Waikato River was not in existence.
5.4.3 The first Waikato River valley At about 17,600 years ago the deposition of the Hinuera Surface ended. There had been 5,000 years of very rapid landscape change, and once the phase of deposition had ceased, the landscape was able to
†† One group of channels runs northeast past Cambridge starting in Karapiro Stream and passing through Mangaone, Mangakarakeke and Mangaohua Streams to return to the modern channel just upstream of Hamilton. Other channels went via Komakorau Stream to Taupiri, and via Waitakaruru Stream to Morrinsviile Gap and thence to the Hauraki Plains. One channel system follows the Mangawara Stream around the north margin of the basin and back to the Waikato River at Taupiri. Another group of channels branched away to the west at the Maungatautari Gap and went west in Mangawhero Stream to join the Waipa River at several places. A further group of channels left the Waikato River just downstream of Hamilton, and flowed through Te Kowhai to the Waipa River.

W A I K A T O R I V E R B A N K E R O S I O N S T U D Y V O L U M E 1
Section 5 River Reach Analysis
Mighty River Power, 17 April 2007 89850\6000\R044 FINAL Rev A 17-4-07.doc
5-7
re-adjust itself, and as a result the Waikato River began to erode out and start to form its present valley. This continued over the next 3,500 years.
All of the post-Oruanui Eruption events were occurring during a period of glacial climate and some of the events may have been associated with climate changes. At that time global sea levels were much lower as a result of the glacial period, and so during the period that the Waikato River was forming its valley the ultimate base level that it was working down to was some 115 m to 70 m below present sea level. However, in the Hamilton Basin, a local base level of -20 m asl in the Taupiri gorge limited the depth of incision. It is not known how much incision occurred, but from the distribution of younger deposits, it is apparent that this first Waikato River valley through the Hamilton Basin was at least seven to eight metres deeper than at present. This would mean the post-Hinuera Waikato River valley between Karapiro and Ngaruawahia would have been between 80 m and 20 m deep.
Thus, by about 14,000 years ago the broad outline of the Waikato River valley had been formed, and the river had finished adjusting and readjusting itself to the landscape changes brought about by the Oruanui Eruption. The form of its stable valley can be interpreted from the arrangement of the edge of the Hinuera Formation along the present valley. The average valley width was only 375 m, with many sections being only 100 m wide. The plan form of the valley was almost straight, particularly north from Hamilton City. This small valley lacking in significant development of a meandering pattern is remarkable for such a large river flowing through relatively weak sedimentary materials. It is presumably due to the river having as its primary source discharge from Lake Taupo, which causes significant attenuation of the larger flood discharges that would otherwise have been responsible for accomplishing geomorphic work in the valley.
5.4.4 The Taupo Pumice Eruption The present valley of the Waikato River is largely formed in Taupo Pumice sediments that have been deposited within the post-Hinuera valley. The sequence of events that lead to this deposition was again associated with a volcanic eruption at Lake Taupo – the Taupo Pumice Eruption of 181 AD (ie about 1,800 years ago). A very similar sequence of events occurred, although on a much smaller scale than with the Oruanui Eruption, and this has been described on detail by Manville (2002).
The Taupo Pumice Eruption affected a wide area around Lake Taupo, and resulted in pumice debris flows extending more than 200 km down the Waikato Valley over the next 2-3 years. In the Hamilton Basin this material is the Melville Pumice Member that forms a terrace above the present river level, but well below the level of the Hinuera Surface. Near Karapiro Dam this terrace is 20 m above the river, and it declines downstream to be about 5 m above the river at Ngaruawahia.
The eruption had emptied Lake Taupo and blocked the outlet so that it refilled over the next 20 years to a level > 40 m above its present height. Meanwhile, the much smaller Waikato River without its Lake Taupo discharge eroded a valley into the Melville Pumice. Then, about 200 AD the lake blockage was breached, and Lake Taupo catastrophically drained down to its present level in a series of floods lasting for 1 – 4 weeks, and attaining peak discharges of 15,000 – 30,000 m3/sec. The initial phases of these floods resulted in the deposition of the Hopuhopu Sand Member. The surface of this terrace exhibits a prominent braiding pattern, indicating the very large amounts of bedload that were being carried and deposited by the river. The Hopuhopu Sand Member terrace was built up to a level about 1 – 5 m below the slightly older Melville Pumice terrace. The later flood stages carried less sediment, and the river then rapidly eroded down into the outburst flood deposits, and the present valley of the Waikato River was formed.
As the river eroded down into the Taupo Pumice Alluvium its tributaries were forced to adjust to this lowered base level, and in response they were forced to erode their beds, bringing new sediment into the main valley that was re-deposited as the low post-Taupo eruption degradation terraces that are within a metre or two of the present river level. In forming its present valley, the Waikato River is believed to have eroded down to a level some 6 – 9 m below the present bed (Schofield, 1967; Selby and Lowe, 1992), and remained at this level for about 1,000 years (Manville, 2002). Evidence for this post-Taupo eruption river incision included differences in bed levels between the Waikato River and its tributaries and excavations and drill holes into the bed of the river. Schofield’s data suggests this incision was ~ 9 m at the Karapiro Dam, and ~ 6 m at Ngaruawahia.

W A I K A T O R I V E R B A N K E R O S I O N S T U D Y V O L U M E 1
Section 5 River Reach Analysis
Mighty River Power, 17 April 2007 89850\6000\R044 FINAL Rev A 17-4-07.doc
5-8
5.4.5 Recent changes About 800 years ago a new phase of river aggradation began, which Schofield (1967) attributed to the arrival of humans in the landscape. This was believed to have resulted from catchment wide erosion that occurred after humans entered this landscape, although this model of landscape change has not been tested. The rate of aggradation may have increased again about 150 years ago when Europeans arrived. For example, in 1928 when the river was diverted over the Arapuni spillway, the bed was scoured and a 5,400,000 m3 wave of sandy material was observed migrating downstream in cross section survey data from 1928 – 1938. However, it is doubtful that this sand wave had any long term effect on bed levels, and evidence for post-European bed aggradation is not well documented despite Schofield’s (1967, p124) claim that all observers agreed the Waikato River was in the process of raising its bed.
Schofield (1967) noted that the bed of the Waikato River is some seven to eight metres higher than the beds of its tributaries, and he interpreted this to result from aggradation in the Waikato River. Although these observations date from many decades ago, this situation is still apparent today. Depth soundings taken at the junction of the Waipa and Waikato Rivers during this study showed the bed of the Waikato was still three to four metres higher than the Waipa bed. Smart (2005) reports two 14C ages on organic material obtained from sediments 4.5 – 7.5 m below the river bed at sites within Hamilton City. He interprets the ages of ~2050 years before present to show the organic material was overwhelmed either by Taupo Pumice material or later re-deposition of eroded Taupo eruption material. This latter is consistent with Schofield’s interpretation of several metres of river bed aggradation since 200 AD. Selby and Lowe (1992) suggested that the Waikato River had aggraded its bed nine to ten metres since the events associated with the Taupo Pumice Eruption, however they do not document their evidence for this.
Schofield (1967) discussed a variety of possible causes for this aggradation, including sea level rise and anthropogenic factors. Subsequently Gibb (1986) has shown that sea levels around New Zealand have only varied over the past 2000 years by about �0.5 m. This small amount of sea level change would not be detectable over 100 km upvalley from the coast. Thus, it is considered Schofield’s original interpretation that the aggradation was due to human impacts in the Waikato River catchment is the most likely, although there are as yet few details of how these processes may have worked.
Since the completion of the Karapiro Dam in 1947, aggradation in the Hamilton Basin reaches of the Waikato River has largely ceased, to be replaced by bed degradation. While this is potentially a significant issue, it is apparent that considerable erosion would be required to lower the river bed to the levels that it has formerly occupied within its present valley sides.
5.4.6 Summary This discussion of the geomorphic history of the Waikato valley is important as it provides the necessary context for understanding the present geomorphic process regime. The valley is a young feature in the landscape, formed during two brief periods of intensive fluvial activity. In effect, the valley was formed twice, for the first time between 17,600 and 14,000 years ago, and more recently shortly after 200 AD. When formed around 200 AD, the valley was deeper than at present, probably by at least six metres. The valley side slopes were adjusted to this landscape form and the whole fluvial system appears to have remained stable for around 1,000 years until a new phase of aggradation lead to the river bed being raised to the levels seen in the first half of the 20th Century before bed degradation began to occur.
The present channel of the Waikato River has been formed within an accommodation space created by a very different river flow regimes to the present. The broad outline of the valley was formed by a post-Hinuera Waikato River as it completed its adjustments to the massive landscape changes that had resulted from the Oruanui Eruption. The detailed valley shape results from post-Taupo Pumice Eruption events when the river carried flood discharges of >15,000 m3/sec, a flow that is an order of magnitude greater than the probable maximum flood under the present flow regime of 1,500 m3/sec (at Karapiro Dam, OPUS 1999). Thus the present river channel results from the generally slight modifications that the river has been able to make to broader landform outlines inherited from past flow regimes.
5.5 Waikato River reaches

W A I K A T O R I V E R B A N K E R O S I O N S T U D Y V O L U M E 1
Section 5 River Reach Analysis
Mighty River Power, 17 April 2007 89850\6000\R044 FINAL Rev A 17-4-07.doc
5-9
Three reaches are recognised along the Waikato River from Karapiro Dam to Ngaruawahia:
� Reach One: Karapiro Dam to kilometre 11.8 (just downstream of the Cambridge wastewater treatment plant oxidation ponds).
� Reach Two Kilometre 11.8 to kilometre 32.34 (just downstream of the State Highway 1 Bridge on the southern outskirts of Hamilton City)
� Reach Three Kilometre 32.34 to Ngaruawahia.
The location of the reaches is shown on Figure 5-2, and the characteristics of these reaches are shown in Table 5-2. Data has been complied from topographic maps, various previous reports and eighty-six surveyed cross sections (Discovery Marine, 2006). The reaches were defined primarily on the basis of water surface slope interpreted from Figures 7.23 and 7.24 in the Mighty River Power Taupo Waikato Resource Consents Assessment of Environmental Effects Report, and our observations of channel width. This data is summarised in Table 5-2. It can be seen there are clear differences in water surface slope and channel width in each of the three reaches.
The channel plan form may be classified as sinuous, as the sinuosity is between that of a straight channel (1.05), and a meandering channel (1.5)‡‡. This pattern is inherited form the post-Taupo Pumice Eruption events of ~1,800 years ago. Reach 2 contains more bends than the other reaches and is thus slightly more sinuous, while reach three has the lowest sinuosity and number of bends. The bends identified are typically gentle-moderate, associated with a few degrees directional change, while sharp bends of about 45o change represent less than 20 % of the total.
Constrictions occur where the channel cuts through more cohesive sediments. These are typically Puketoka Formation, or Melville Pumice beds, and they are more common in Reach 1. Pools have been identified from the multibeam data presented by Wood, (2006). They are almost all associated with either channel constrictions (52 %), and/or are located on the outside of bends (58 %).
The water surface slope declines steadily as the river crosses the Hamilton Basin, and mean channel width increases accordingly. In detail, the changes in slope are most obvious as the river passes through constrictions.
Table 5-2 Characteristics of Waikato River reaches
Reach 1 Reach 2 Reach 3 River Length 11.8 km 20.63 km 21.62 km 54.05 km Sinuosity 1.12 1.18 1.11 1.16 Number of bends 26 (2.2/km) 49 (2.4/km) 42 (1.9/km) 117 (2.16/km) Number of constrictions 16 (1.4/km) 17 (0.8/km) 15 (0.7/km) 48 (0.9/km) Number of pools 16 (1.4/km) 29 (1.4/km) 18 (0.8/km) 63 (1.2/km) Water surface slope 0.48 m/km 0.26m/km 0.16m/km 0.27m/km Mean channel width 56 m 68 m 95 m 78 m Mean bed level change 1998 - 2006
-0.23 m -0.19 m -0.31 m -0.25 m
‡‡ Sinuosity is the ratio of channel length to valley length (Morisawa, 1985)

W A I K A T O R I V E R B A N K E R O S I O N S T U D Y V O L U M E 1
Section 5 River Reach Analysis
Mighty River Power, 17 April 2007 89850\6000\R044 FINAL Rev A 17-4-07.doc
5-10
Reach 1 Reach 2 Reach 3 River Valley landform Channel
occupies whole valley floor, with no floodplain. Channel incised 50 – 70 m below Hinuera Surface and 45 – 25 m below the Taupo Pumice
Channel occupies whole valley floor, with no floodplain. Channel incised 25 – 50 m below Hinuera Surface and 10 – 25 m below the Taupo Pumice
Channel occupies whole valley floor, with no floodplain. Channel incised 15 – 25 m below Hinuera Surface and 10 m below the Taupo Pumice


W A I K A T O R I V E R B A N K E R O S I O N S T U D Y V O L U M E 1
Section 5 River Reach Analysis
Mighty River Power, 17 April 2007 89850\6000\R044 FINAL Rev A 17-4-07.doc
5-12
5.6 Waikato River analogue? One approach to assessing the magnitude of effects of an activity on the environment is to compare it with another environment not affected by the activity. In this case, the regulated Waikato River would be compared to a suitable non-regulated river. It would be necessary to select a river system that was un-regulated, and had a flow regime and geomorphic environment similar to that of the Waikato River.
The above analysis of the Waikato River environment in the Hamilton Basin has demonstrated it to be an unusual geomorphic and fluvial system. The valley was formed during two periods of rapid landscape change, between 17,600 – 14,000 years ago, and again around 200 AD (~1,800 years ago). There has been very little slope evolution since those times. The Waikato River occupies a channel at the bottom of its valley, and there is no floodplain between the channel banks and the slopes of the valley side. As discussed above, despite it being one of New Zealand’s largest rivers, today’s Waikato River is in some respects an underfit stream, as it occupies a valley that it did not itself create. Where the probable maximum flood in the Waikato River is 1,500 m3/sec, the valley was actually formed by flows more than ten times this magnitude.
The flow regime in the Waikato River is also unusual, although less so than its geomorphic setting. Being a lake-fed river, its peak flood flows are significantly attenuated, while baseflow is higher. Given this flow regime, the river is likely to be less geomorphically active, and it is therefore not unexpected that its valley and channel forms retain much of their original characteristics. The Waiau River in Southland drains from Lake Manapouri, and it has similarities with the Waikato. It is a large river, but has only managed to form a modest valley in its 100 km course to the coast. Both rivers are now regulated for hydro-electric power generation, but in opposite senses. The Waikato River with its Tongariro River diversions carries an increased flow with daily ramping, while the Waiau River flow has been reduced by over 80 % due to diversion of water through the Manapouri Power Station to Deep Cove.
River bank geology is also rather unique. Both the Hinuera Formation and the Taupo Pumice Alluvium represent unusual distal deposits from the Taupo volcanic zone, and the massive lake out-burst flood deposition style does not occur elsewhere in New Zealand. In addition, the highly pumiceous materials are unusual for their properties of light density and ability to case harden.
Channel form of the Waikato River is also unusual. Although it is flowing though its own alluvial materials, it behaves more like a nearly straight bed rock channel, in contrast to the more typical meandering or braided rivers elsewhere in New Zealand.
Given these constraints, it is difficult to suggest a likely candidate for a Waikato River analogue. For example, two nearby rivers the Waipa and Waihou flow through very similar sediments and have incised channels, but they are much smaller meandering rivers and were not formed by catastrophic floods. The factors driving bank erosion here are likely to be very different to those in the Waikato valley.
There have been previous attempts to define an analogue for the Waikato River (e.g. OPUS, 2000). However, from the above discussion it is concluded this is both unlikely and unnecessary. No two river systems are the same, and comparisons of this nature are not practicable as it is not possible to know with any certainty the relative significance of causative factors. The systems are too complex for it to be possible to assess whether variations in one factor (e.g. flow regulation) could be responsible for different environmental outcomes.

W A I K A T O R I V E R B A N K E R O S I O N S T U D Y V O L U M E 1
Section 6 Erosion Inventory
Mighty River Power, 17 April 2007 89850\6000\R044 FINAL Rev A 17-4-07.doc
6-1
6 Erosion Inventory
6.1 Introduction A total of 393 erosion sites were identified between Karapiro Dam and Ngaruawahia during August and September 2006, using the field data collection methodology described in Section 4. Of these sites, four were identified within the first 20 m of the mouths of tributary streams that join the Waikato River.
The locations of erosion sites identified in this study are shown on the Erosion Inventory Sheets in Volumes 2 – 4, and logs for each of the erosion sites identified are included in these volumes. A collation of field data derived from the sheets and used in the spatial analysis below is in Appendix B.
The DVD’s that accompany this report have complete video coverage of the river banks between Karapiro and Ngaruawahia, as filmed on 14 and 15 September 2006.
This section discusses spatial patterns in the distribution of river bank erosion types, initially by examining the whole river, and then addresses some of the patterns that emerge from within each reach.
6.2 General patterns As noted above, the total number of erosion sites identified along the Waikato River was 393. But four sites were logged in the first 20 m of tributaries of the Waikato River and for the purposes of the following analysis these have not been included. Thus, the total number of sites discussed is 389, of which 346 are individual erosion features, and 43 are grouped sites where small failures occur together over a distance of river bank. This total is larger than cited by previous surveys of bank erosion. OPUS (1999) documented 95 sites of recent bank erosion, and in a resurvey in 2001 they found that 57 of these sites had become stable, while 33 new sites were identified. They attributed the differences to on-going recovery that had occurred after the 1998 flood. Wood (2006) documented 139 bank erosion sites in his survey.
These survey results are difficult to interpret together, as it is unlikely there has been a nearly 3-fold increase in bank erosion in less than one year. The differences presumably relate to the differing purposes of the surveys, and differences in basic approaches. Previous work has sought to identify recent bank erosion caused by the river, while the present survey has attempted to identify all forms of bank erosion, whether due to river or non-river processes, and irrespective of the inferred age of the feature.
6.2.1 Length of river bank affected by erosion The width of each feature was assessed in the field and combining this data shows that 10,525 m of the river bank is affected by erosion. This represents 9.7 % of the full length of river bank from Karapiro Dam to Ngaruawahia (2 x 54.05 km of channel). However, the grouped sites account for 5,684 m of this length, and within these, just 11 sites account for 3,280 m. Erosion does not occur along the full length of these particular sites, and typically the coverage was significantly less than half the distance logged. Assuming half the bank length in the grouped sites is affected by erosion gives an estimated river bank length affected by erosion of 7,683 m, or 7.1 % of the whole bank length.
Table 6-1 shows the bank length affected in each reach. Over half the bank length affected by erosion is in Reach Three.
6.2.2 Area of bank erosion The area affected by each erosion feature can be derived from the estimated erosion site height and width (length). The individual areas vary from 2 m2 to 2,100 m2, with the mean size being 114 m2. As can be seen in Table 6-2, 74 % of sites cover less than 100 m2, but they represent only 22.8 % of the total erosion area. Nearly 32 % of the total bank erosion area is in only 11 sites.
The total bank area affected is 43,846 m2, or 4.4 Ha. Total bank height was also estimated at each site, and from this the average bank height along the river is 19.8 m. The total bank area is therefore

W A I K A T O R I V E R B A N K E R O S I O N S T U D Y V O L U M E 1
Section 6 Erosion Inventory
Mighty River Power, 17 April 2007 89850\6000\R044 FINAL Rev A 17-4-07.doc
6-2
Table 6-1 Bank length and area affected by erosion
Reach Total bank length
Number of erosion sites
Length / mean length of erosion sites
Area / mean area of erosion sites
Reach One 23.60 km 112 2466 m / 22 m 17,968 m2 / 160 m2
Reach Two 41.26 km 146 2391 m / 16 m 11,825 m2 / 81 m2
Reach Three 43.26 km 131 5668 m / 43 m 14,054 m2 / 107 m2
Total 108.1km 389 10525 m / 27 m 43,846 m2 / 113 m2
estimated at 214 Ha (108,100 m of bank length x 19.8 m bank height), so that the erosion represents about 2 % of the bank area. Again, the grouped sites account for a significant proportion of this area, with 1.5 Ha or 35 % of the total. Assuming half this area is actual bank erosion, the estimated bank area affected would be 3.6 Ha, or 1.7 % of the whole bank area.
Table 6-2 Area of bank erosion features
Area of erosion site # sites % sites Erosion area % bank erosion area
Up to 50 m2 211 54.2 % 5,310 m2 12.1 %
50 – 100 m2 78 20.1 % 6,010 m2 13.7 %
100 – 500 m2 89 22.8 % 19,601 m2 44.7 %
500 – 2,100 m2 11 2.8 % 12,925 m2 29.5 %
Total sites/area 389 43,846 m2
Taken together, the length and area of the valley sides and river banks affected by erosion is considered to be modest, despite the Waikato River being one of New Zealand’s largest, and with banks that are generally formed in weakly consolidated alluvial materials§§.
It is noted that the calculated area for each feature is the area projected onto a vertical, bank-parallel plane. The width used is the maximum measured across the erosion feature, and thus the area so calculated will over-estimate the real area. This is considered an appropriately conservative assessment. In addition, the spatial distribution of the area parameter is weighted in an upstream direction and this is simply a result of bank height increasing in this direction.
6.2.3 Bank erosion and river level Erosion sites were classified on the basis of their location on the river bank with respect to the water line at the time of field work***, and any features where the whole erosion form from crown to toe was contained on the slope above the water line were separated from those where any part of the erosion feature intercepted the water line. There were 70 sites that occurred on the valley side above river level, representing 18 % of erosion features, and 25 % of the area affected by erosion. These were mostly in Reaches One and Two (30 and 32 sites respectively).
§§ Volume of bank failures has not been analysed as the depth of erosion features could not be reliably estimated in many locationsdue to the difficulties of access from the river. In general, where the depth of bank could be assessed, it was typically less than 1 m.
*** Fieldwork was carried out during the season of higher baseflow in the Waikato River. “River level” in this report refers to non-floodriver level as discussed in Section 4.2.

W A I K A T O R I V E R B A N K E R O S I O N S T U D Y V O L U M E 1
Section 6 Erosion Inventory
Mighty River Power, 17 April 2007 89850\6000\R044 FINAL Rev A 17-4-07.doc
6-3
Sites where the foot of the erosion feature reached to normal river level accounted for 82 % of all sites, and these 319 sites affected 8.8 km of river bank, or 74.2 % of the bank area affected by erosion. Nearly 41 % of this area was in Reach 1.
The height of erosion features with respect to normal river level was also assessed in groups: small features where the crown occurred within 1 m of river level; features where the crown was up to 3 m above river level; larger features where the crown extends to 5 m above river level; and sites where the foot is at river level and the crown is more than 5 m above. These heights were chosen to approximate respectively bank levels regularly affected by water level fluctuations during ramping; banks affected by floods; banks affected by very large floods; and banks above flood levels. This vertical distribution of erosion sites is shown in Table 6-3. Only 41 sites (10.5 % of the total erosion sites) occur within 1 m of river level, and these represent 3.6 % of the total area affected by erosion, or 0.07 % of the total river bank area. Given their location close to river level it is likely these sites are influenced by river erosion processes.
Although the foot of many erosion features extend to river level, not all of these will have been caused by river erosion processes, particularly where the crown of the failure is well above river level. From Table 6-3 it can be seen that as the crown of the erosion features extends to higher levels on the bank, the features become larger so that more of the bank area is affected, with those sites where the crown is more than 5 m above river level accounting for nearly 42 % of all bank erosion area.
Table 6-3 Vertical distribution of bank erosion
# sites
Length of river bank affected
% of total bank
length
Area of river bank affected
% of total erosion
areaAll sites that extend to river level 319 8,814 m 83.7 32,530 m2 74.2
Sites that extend to river level and are no more than 1 m high
41 1,580 m 15.0 1,580 m2 3.6
Sites that extend to river level and are less than 3 m high
74 3,442 m 32.7 6318 m2 14.4
Sites that extend to river level and are up to 5 m high
86 974 m 9.3 6282 m2 14.3
Sites that extend to river level and are greater than 5 m high
118 2,818 m 26.7 18,350 m2 41.9
Sites that are entirely above normal river level
70 1, 711 m 16.3 11,316 m2 25.8
Summarising these data, it can be seen that 18 % of erosion features representing 25 % of the total area affected by erosion are above river normal level and hence are very unlikely to have been caused by river processes. Conversely, 10.5 % of erosion sites, representing 3.6 % of the total area affected by erosion are within 1 m of river level. These are regularly influenced by the river, and are thus likely to have river processes as significant causative factors. Between these limits are sites that are likely to have been variously affected by river processes as a causative factor, with sites extending further above river level interpreted as being less likely to be affected by river erosion processes. Our interpretation of these relationships is discussed below in Section Seven.
6.2.4 River bank slope River bank slope angles were estimated at each failure site using five broad categories as identified above in Section 4. Unsurprisingly, bank erosion occurred predominantly on very steep or vertical slopes as detailed in Table 6-4.
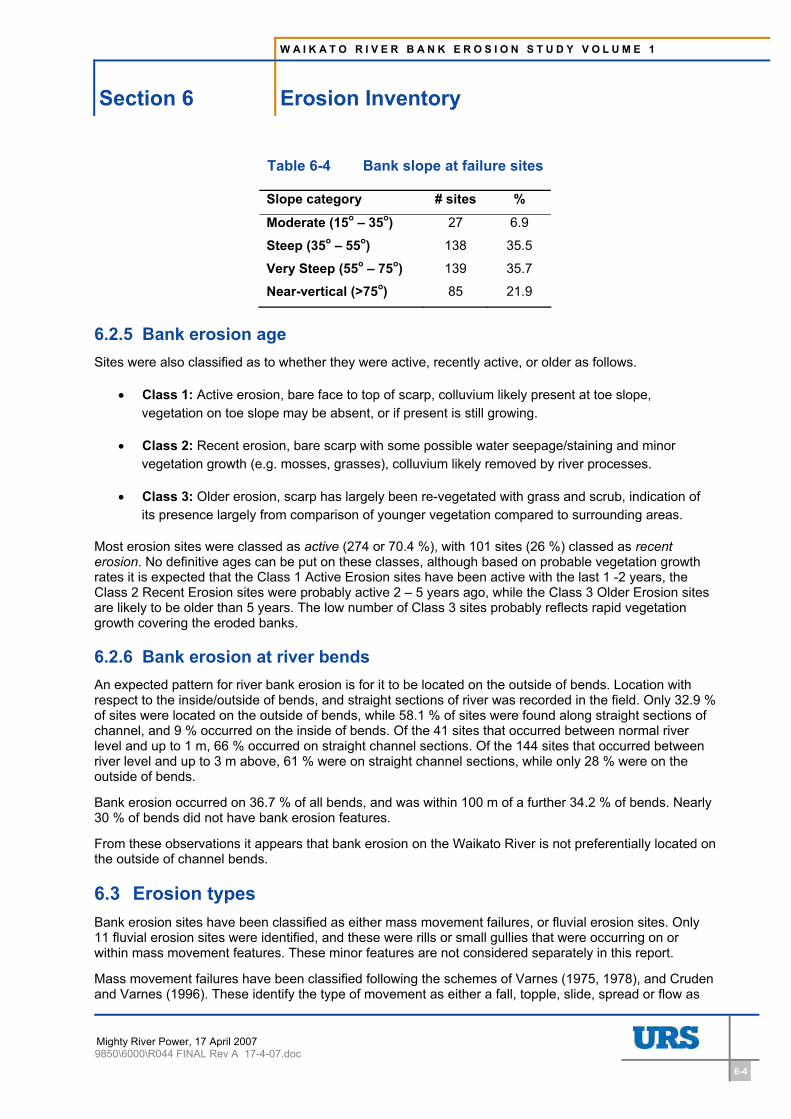
W A I K A T O R I V E R B A N K E R O S I O N S T U D Y V O L U M E 1
Section 6 Erosion Inventory
Mighty River Power, 17 April 2007 89850\6000\R044 FINAL Rev A 17-4-07.doc
6-4
Table 6-4 Bank slope at failure sites
Slope category # sites %
Moderate (15o – 35o) 27 6.9
Steep (35o – 55o) 138 35.5
Very Steep (55o – 75o) 139 35.7
Near-vertical (>75o) 85 21.9
6.2.5 Bank erosion age Sites were also classified as to whether they were active, recently active, or older as follows.
� Class 1: Active erosion, bare face to top of scarp, colluvium likely present at toe slope, vegetation on toe slope may be absent, or if present is still growing.
� Class 2: Recent erosion, bare scarp with some possible water seepage/staining and minor vegetation growth (e.g. mosses, grasses), colluvium likely removed by river processes.
� Class 3: Older erosion, scarp has largely been re-vegetated with grass and scrub, indication of its presence largely from comparison of younger vegetation compared to surrounding areas.
Most erosion sites were classed as active (274 or 70.4 %), with 101 sites (26 %) classed as recenterosion. No definitive ages can be put on these classes, although based on probable vegetation growth rates it is expected that the Class 1 Active Erosion sites have been active with the last 1 -2 years, the Class 2 Recent Erosion sites were probably active 2 – 5 years ago, while the Class 3 Older Erosion sites are likely to be older than 5 years. The low number of Class 3 sites probably reflects rapid vegetation growth covering the eroded banks.
6.2.6 Bank erosion at river bendsAn expected pattern for river bank erosion is for it to be located on the outside of bends. Location with respect to the inside/outside of bends, and straight sections of river was recorded in the field. Only 32.9 % of sites were located on the outside of bends, while 58.1 % of sites were found along straight sections of channel, and 9 % occurred on the inside of bends. Of the 41 sites that occurred between normal river level and up to 1 m, 66 % occurred on straight channel sections. Of the 144 sites that occurred between river level and up to 3 m above, 61 % were on straight channel sections, while only 28 % were on the outside of bends.
Bank erosion occurred on 36.7 % of all bends, and was within 100 m of a further 34.2 % of bends. Nearly 30 % of bends did not have bank erosion features.
From these observations it appears that bank erosion on the Waikato River is not preferentially located on the outside of channel bends.
6.3 Erosion types Bank erosion sites have been classified as either mass movement failures, or fluvial erosion sites. Only 11 fluvial erosion sites were identified, and these were rills or small gullies that were occurring on or within mass movement features. These minor features are not considered separately in this report.
Mass movement failures have been classified following the schemes of Varnes (1975, 1978), and Cruden and Varnes (1996). These identify the type of movement as either a fall, topple, slide, spread or flow as

W A I K A T O R I V E R B A N K E R O S I O N S T U D Y V O L U M E 1
Section 6 Erosion Inventory
Mighty River Power, 17 April 2007 89850\6000\R044 FINAL Rev A 17-4-07.doc
6-5
described above in Section 4. This scheme has been preferred for several reasons including: its wide use around the world; its simple application; and the fact that the terminology does not imply any particular causative factors. Falls and topples are similar types of process occurring on very steep or vertical slopes, where material falls freely downslope, with a topple being a fall where the upper part of the failure tips outwards from the slope. For the purposes of this analysis the distinction is unimportant, and the two types are combined.
Falls/topples comprise 232 or 60 % of all erosion features. These are the slab type failures that are commonly seen on the case-hardened vertical faces of Melville Pumice or Puketoka Formation sediments. They occur fairly uniformly down the valley, with 4.4/km in Reach One, 5.3/km in Reach Two, and 4.2/km in Reach Three.
Slides, and falls/slides comprise the remaining failures, with 157 sites (40 %). These failures are most common in Reach One where they occur at a rate of 5.1/km. They are much less frequent in Reaches Two and Three where they occur at only 1.8/km.
6.4 Bank erosion distribution Figure 6-1 shows the down-valley distribution of bank erosion sites plotted as the number of sites per kilometre, and this shows a general fluctuating pattern downstream to kilometre 40, and a decline in the number of erosion sites thereafter. The overall mean number of erosion sites per kilometre is 7.1, although from the dam to kilometre 40 the mean number is 8.4/km, while from here to Ngaruawahia it is less than half this value (see Table 6-5).
Table 6-5 shows the mean number of erosion sites per kilometre in various sections downvalley, and this indicates some distinctive patterns. Several sub-reaches have erosion site numbers greater than one standard deviation above the mean value. These are kilometres 9 – 10 at the downstream end of Reach One; kilometres 22 and 29 in Reach Two; and kilometres 34 and 37 at the upstream end of Reach Three. There are also sub-reaches where the number of erosion sites is well below the overall mean, from kilometres 12 to 21 at the upstream end of Reach Two, and in the downstream part of Reach Three from kilometre 41, and particularly at kilometres 45, 48 – 49, and 51.
These spatial patterns presumably result from various factors including bank characteristics and possibly land use practices, and are discussed below in Section 7.
Table 6-5 Bank erosion site distribution along the Waikato River valley
Waikato River valley section Mean (standard deviation) number of sites per kilometre
Karapiro Dam to Ngaruawahia 7.1 (� 5.3) per km
Karapiro Dam to kilometre 40 8.4 (� 5.3) per km
Kilometre 12 to kilometre 21 3.8 (� 3.4) per km
Kilometre 41 to kilometre 54 3.2 (� 2.8) per km

W A I K A T O R I V E R B A N K E R O S I O N S T U D Y V O L U M E 1
Section 6 Erosion Inventory
Mighty River Power, 17 April 2007 89850\6000\R044 FINAL Rev A 17-4-07.doc
6-6
0
5
10
15
20
25
0 5 10 15 20 25 30 35 40 45 50 55
Distance downstream from Karapiro Dam (km)
Num
ber o
f ban
k er
osio
n si
tes
Cambridge Ngaruawahia
REACH 1 REACH 2 REACH 3
Hamilton
Figure 6-1 Distribution of river bank erosion sites down valley from Karapiro Dam (sites/km)
6.5 Bank geology Bank geology was recorded in the field, and these observations were checked against the published 1:63,360 scale geological maps. Table 6-6 shows the distribution of erosion sites in each rock type along the river, separated into the three reaches. In general the proportion of bank erosion sites is broadly consistent with the proportions of the different rock types. For example, 23.2 % of river banks are formed in Hopuhopu Sand Member, and 24.7 % of all bank erosion sites occur in this sediment type. Similarly for the Taupo Pumice degradation terrace, 32.2 % of the river bank is formed in this material, and 35.5 % of bank erosion sites occur in this sediment type. There are slight variations through the reaches, with erosion sites being slightly over-represented in Hopuhopu Sand in Reach 1, and under-represented in the other reaches, while erosion sites are slightly over-represented in the Taupo Pumice degradation material in Reaches 2 and 3.
The Hinuera Formation is over-represented in the proportion of erosion sites in all reaches, while the Melville Pumice Member is under-represented in all reaches. The Walton sub-group is over-represented in the proportion of erosion sites in Reaches 2 and 3, but under-represented in Reach 1. This probably reflects the presence of the more coherent Puketoka Formation in Reach 1, in contrast to the presence of the Karapiro Formation downvalley.
These distribution patterns are consistent with the relative strengths of the various rock types discussed above, and allow the following erodibility ranking to be proposed (in declining order of bank erosion resistance):
� Melville Pumice member � Walton sub-group (Puketoka Formation) � Hopuhopu Sand Member

W A I K A T O R I V E R B A N K E R O S I O N S T U D Y V O L U M E 1
Section 6 Erosion Inventory
Mighty River Power, 17 April 2007 89850\6000\R044 FINAL Rev A 17-4-07.doc
6-7
� Taupo Pumice Degradation terrace � Hinuera Formation.
Table 6-6 Distribution of erosion sites relative to reaches and geology
Reach 1 River bank length (m) % # bank
erosion sites % bank
erosion sites Greywacke not included 1 0.9
Hinuera Formation (with Walton sub-group below) 700 3.0 6 5.4
Hopuhopu Sand Member (with Walton sub-group below) 9700 41.1 59 52.7
Melville Pumice Member (with Walton sub-group below) 4600 19.5 13 11.6
Taupo Pumice degradation terrace 2200 9.3 9 8.0
Walton sub-group (Puketoka Formation) 6400 27.1 24 21.4
Total 23600 100 112 100
Reach 2
Hinuera Formation 4650 11.3 25 17.2
Hopuhopu Sand Member 11520 27.9 29 20.0
Melville Pumice Member 7625 18.5 8 6.2
Taupo Pumice degradation terrace 16965 41.1 74 50.3
Walton sub-group 500 1.2 9 6.2
Total 41260 100 145 100
Reach 3 Hinuera Formation 11415 26.4 47 35.6
Hopuhopu Sand Member 3850 8.9 8 6.1
Melville Pumice Member 11675 27.0 20 15.2
Taupo Pumice degradation terrace 15650 36.2 51 38.6
Walton sub-group 650 1.5 6 4.5
Total 43240 100 132 100
Total
Greywacke not included 1 0.3
Hinuera Formation 16765 15.5 78 20.1
Hopuhopu Sand Member 25070 23.2 96 24.7
Melville Pumice Member 23900 22.1 42 10.8
Taupo Pumice degradation terrace 34815 32.2 133 34.2
Walton sub-group 7550 7.0 39 10.0
Total 108100 100 389 100
6.6 Bank erosion and structures Bank erosion was observed at 17 sites in association with various structures. The sites concerned were as follows: R-7.0-A; R-20.92-A; L-30.75-A; L33.06-A; R--29.01-A; R-30.22; R-30.22 to 0.35-A; L-37.1 to 37.48-A; L-39.51-A; L-39.66-A; L-41.54-A; L-41.73-A; L-43.26 to 43.25-A; L-43.43-A; L-4.66 to 44.72-A

W A I K A T O R I V E R B A N K E R O S I O N S T U D Y V O L U M E 1
Section 6 Erosion Inventory
Mighty River Power, 17 April 2007 89850\6000\R044 FINAL Rev A 17-4-07.doc
6-8
;R-42.75-A; and R-47.21-A. Twelve of these sites were in urban areas, one in Cambridge, and the rest in Hamilton. Typically they were associated with larger diameter stormwater outfalls/culverts, and river bank protection works (rip/rap or concrete walls), and involved scour around the pipe or at the ends of the protection work. Less commonly, there was erosion at boat ramps, around bridge piers, at other river access structures such as piers/jetties, at water intakes, and small stormwater outfalls.
A more detailed examination of river bank infrastructure and associated erosion issues is given in BECA (2006a).
W A I K A T O R I V E R B A N K E R O S I O N S T U D Y V O L U M E 1
Section 7 Causative Erosion Factors
Mighty River Power, 17 April 2007 89850\6000\R044 FINAL Rev A 17-4-07.doc
7-1
7 Causative Erosion Factors
7.1 Introduction Our presentation of the results of the Waikato River bank erosion survey has attempted to avoid terminology that carried genetic implications, or that implied any particular causative factors. The study brief sought discussion of causative factors for bank erosion, and this section addresses these issues in the light of the survey data obtained.
At the very broadest level it is possible to say that bank erosion along the Waikato River is entirely caused by the river because if there were no river, there would be no steep-sided valley cut into the Hamilton Basin. However, this is not a very useful statement, since while the river has indeed formed its valley, it did this in two geologically short bursts of landforming activity, the first between 17,600 – 14,000 years ago, and the second between 181 and 200 AD. Little fluvial modification of the valley occurred after either of these valley-forming phases, and since 200 AD a variety of other smaller scale slope forming processes have been active. These processes can be related to both human and natural factors, and the purpose of the discussion below is to draw out some of these distinctions.
The bank erosion features described in this report are various forms of slope failure or mass movement features. The general causes of slope failure are well-enough known, but in this case the presence of the Waikato River at the base of the slope adds another level of complexity.
Slope failure takes place when the slope materials are no longer able to resist the force of gravity. In other words, the shear resistance of the slope materials is not enough to withstand the shear stressacting on the slope. It is the balance between shear resistance and shear stress that determines slope stability. A slope can become unstable through either or both of a decrease in shear resistance, or an increase in shear stress. The change in the balance of these two factors can result from internal causes within the slope materials that reduce their shear strength, and/or external factors that increase the shear stress acting on the slope.
7.2 Causes of slope failure There are numerous possible causes of slope failure, and these can be classified in a number of ways: natural factors, or human induced processes; river processes or slope processes; internal slope factors leading to reduced shear resistance or external factors leading to increased shear stress. Mighty River Power is concerned to understand the significance of its activities as causative factors in bank erosion, in particular whether reduced bed sediment supply and/or changes in flow regime may be affecting these processes. The following factors are potentially relevant to Waikato River bank erosion processes.
� Slope material characteristics such as sediment friction and cohesion, material density, bedding, jointing and fractures, and weathering characteristics.
� Slope morphological characteristics, including slope angle and slope height.
� Vegetation cover, including the effects of tree roots binding the slope and also roots prising and weakening the slope.
� Land use activities including effects on vegetation cover, placement of structures, loading of the slope, and surface water runoff and discharge.
� Water can be a significant factor in slope stability in several ways: flowing or acting at the base of the slope (e.g. scour, current detachment, wetting drying, wave erosion, removal of load bearing strength); flowing down the slope (e.g. rilling, sheetwash, gullying, and tunnelling); and internally as soil moisture or groundwater (e.g. increased pore water pressure due to water table rise and rapid draw down due to ramping or flooding effects).
� Channel morphological change creating different conditions at or below the water line and causing changes in toe support, including bank scour and bed degradation.

W A I K A T O R I V E R B A N K E R O S I O N S T U D Y V O L U M E 1
Section 7 Causative Erosion Factors
Mighty River Power, 17 April 2007 89850\6000\R044 FINAL Rev A 17-4-07.doc
7-2
It is rare for any one of these factors to be the sole driving force of bank erosion, and it is necessary to consider how these factors have worked together to cause bank erosion. To address this it is necessary to first review what bank erosion is like along the Waikato River.
7.3 Bank erosion summary The following bank erosion characteristics were noted.
� 389 bank erosion sites occur down the 54.05 km of river valley.
� Bank failure sites are distributed down valley at 8.4 sites/km to kilometre 40, and thereafter at 3.2 sites/km to Ngaruawahia. Four sub-reaches show increased erosion (kilometres 9-10, 22, 34, and 37), while four others show much reduced erosion (kilometres 14, 45, 48 – 49, and 51).
� The main type of failure were falls/topples (60 %), with these being generally evenly distributed downvalley at around 4 – 5 /km. Slides and fall/slides make up 40 % of bank erosion types, with Reach One showing about 5/km, while Reaches Two and Three have fewer at only 1.8/km.
� The predominant failure slope was near-vertical (64 %), with failures occurring less commonly on very steep slopes (19 %), and steep slopes (16 %).
� Interpretation of the height above river level of the crown of the erosion features suggest that overall it is likely that only about 18 % of the area affected by bank erosion may have river processes as a causative factor.
� 33 % of sites are located on river bends, but 58 % occur on straight channel sections, and 29 % of bends have no bank erosion features.
� Constricted channel sections occupy 26 % of the total bank length, but only 10 % of bank erosion sites are associated with the river level through these sections.
� Bank failures are more likely to occur in the Karapiro Formation of the Walton sub-group. Hinuera Formation deposits also show more failure sites than other sediments. The Puketoka Formation of the Walton sub-group shows less bank failures than other sediments, while the Melville Pumice is significantly under-represented for erosion sites.
7.4 Causative erosion factors Bank erosion results from a variety of causative factors, and typically several processes will be occurring in any one failure. Ascribing an erosion feature to any one or a group of causative factors is a matter of judgement, as rarely can the driving forces be directly observed. Our field identification of bank erosion has sought to avoid attribution of causative factors. Instead, our aim has been to document the spatial distribution of bank erosion, and to examine this for patterns that may be interpreted as resulting from various causative factors.
The bank characteristics and spatial patterns of bank erosion distribution presented above in Section 6 allow some interpretation of potential bank erosion causative factors. In particular, examination of those sub-reaches where more bank erosion is occurring and comparing these to sub-reaches where less erosion is occurring allows identification of possible causative factors.
7.4.1 General patterns The sub-reach with the greatest concentration of bank erosion sites is at kilometres 9 and 10, just downstream of Cambridge. Bank erosion sites occur slightly more frequently on the left bank (55 %), and slides are more common here than elsewhere (55 % vs. 35 % overall.). Bank geology here is distinctive as two different lithologies outcrop along the bank. Walton sub-group sediments occur from river level to about one third of the way up the bank, while the upper sediments are Hopuhopu Sands. The sands are only weakly consolidated, and groundwater seeps were commonly observed emerging from the bank at

W A I K A T O R I V E R B A N K E R O S I O N S T U D Y V O L U M E 1
Section 7 Causative Erosion Factors
Mighty River Power, 17 April 2007 89850\6000\R044 FINAL Rev A 17-4-07.doc
7-3
the base of the sands. Land use on the plains above the true left side of the valley is associated with the Cambridge wastewater treatment plant, and there are numerous ponds and soakage fields that will cause increased groundwater flow.
From these observations it is concluded that the causative factors here are a combination of bank geology, groundwater and slope, where the more consolidated Walton sub-group sediments are able to stand up more steeply below the weaker Hopuhopu Sands which therefore do not have any toe support. In addition, land uses increase the flow of groundwater through the sands, and this then flows laterally along the contact with the underlying Walton sub-group which promotes slide type mass movement processes.
Kilometre 22 has a greater than normal number of bank erosion sites. This sub-reach has generally low banks only 6 – 8 m high, formed in Hopuhopu Sands that are here sufficiently consolidated to stand in near vertical slopes. Small slab failures (falls/topples) are common, mostly less than 60 m2 in area. They are interpreted as resulting from gravity driven failure of the steep slopes combined with some root prising.
Kilometre 29 shows increased bank erosion, and this area is largely formed in the weaker sediments of the Hinuera Formation, Walton sub-group sediments, Taupo Pumice Degradation Terrace, and Hopuhopu Sand Member. Sediment characteristics are interpreted to be a significant causative factor here.
Two sub-reaches at kilometres 34 and 37 within the Hamilton City urban area show increased bank erosion. The former sub-reach is entirely in Hinuera Formation sediments, but 45 % of the banks in kilometre 37 are formed in Melville Pumice. The greater than normal number of bank failures is considered to be related to a combination of weaker sediments, and land use pressures, in particular the presence of walkways and retaining walls close to the river banks.
Sub-reaches with significantly fewer bank failures occur in Reach Two in Kilometre 14, and Reach Three in kilometres 45, 48 – 49, and 51, where one or zero erosion sites per kilometre were recorded. Most of these banks are formed in Taupo Pumice Degradation Terrace and Hinuera Formation, with some Melville Pumice. These are generally the least cohesive sediment types, thus bank geology is not a strong factor in the lack of erosion sites here. Rather, it is interpreted to result from the generally low and less steep river banks.
From these patterns it is interpreted that bank materials, bank slope, groundwater flow, and land use are the more important bank erosion causative factors. Other factors such as river scour, boat wake erosion, and flow regime do not appear to be widely important, although they will be significant at some locations. However, it is unlikely that any of these factors will operate in isolation, and bank erosion will result from a combination of causative factors.
7.4.2 Bank slope characteristics The common association of bank erosion with near-vertical and very steep slopes indicates that slope angle is an important causative factor. This can be seen in the greater concentration of bank failures in river sections with near-vertical banks (for example through kilometres 9 – 10 and 22), and the reduced occurrence of erosion sites downstream of kilometre 37, where the banks become generally lower and of more gentle slope.
It will be recalled that the valley side slopes were originally formed between 17,600 – 14,000 years ago for valley walls cut in the Hinuera Formation, and at around 200 AD for banks formed in Taupo Pumice Alluvium, and the spatial arrangement of these slopes has not changed significantly since that time. These slopes have therefore been in a stable form for a considerable length of time.
Overall bank height does not appear to be a strong causative factor. The highest banks upstream of Cambridge do not show any increase in bank failures, although it is acknowledged that this area has banks cut in more cohesive sediments. However, bank height does decrease in the downstream part of Reach Three north of Hamilton City, and there is a distinct fall-off in number of bank erosion from
W A I K A T O R I V E R B A N K E R O S I O N S T U D Y V O L U M E 1
Section 7 Causative Erosion Factors
Mighty River Power, 17 April 2007 89850\6000\R044 FINAL Rev A 17-4-07.doc
7-4
kilometre 37 onwards. Thus, while greater bank height may not be an obvious causative factor in bank erosion, lower height may contribute to reduced rates of bank erosion.
7.4.3 Bank materials Bank sediment type clearly influences bank erosion. Bank materials are similar throughout the Waikato Basin, comprising volcaniclastic sediments of various ages. These geologically very young materials comprise pumicieous and rhyolitic silts, sands and gravels that have not been compacted to form coherent rock. However, they can behave with some cohesion as they are in places able to stand in vertical slopes.
Two sediment types have particular cohesive properties due to silica case hardening of highly pumiceous beds (Kear and Schofield, 1978): the Melville Pumice Member and the Puketoka Formation of the Walton sub-group. These can stand in near-vertical slopes more than 50 m high, and they show less bank erosion than other sediment types. Together they account for 28 % of the river bank materials, but only 17 % of bank erosion sites.
At the other end of the spectrum, the Karapiro Formation of the Walton sub-group is the oldest sediment in the basin. Weathering has reduced some of the constituents to clay, and the absence of pure pumice beds in these deposits means they have much less cohesion and probably lower frictional strength. As a result, bank erosion is 3 – 5 times more common in this material than would be expected from its distribution alone.
The Hinuera Formation accounts for 20 % of all erosion sites, and 26.5 % of the length of river bank affected. Compared to the 15.5 % of total river bank formed in this material, this indicates these slopes are also over-represented for bank erosion. This may be a response to higher volcanic ash and clay content promoting groundwater and soil moisture related processes, and fewer pure pumice beds in these deposits would mean less case-hardening of exposed faces.
Other material characteristics such as bedding and joints/fracturing do not appear to play a significant role here. The sediments were all laid down predominantly by fluvial processes, and bedding is therefore approximately horizontal and so will not control slope failure. The material has not been consolidated, thus there are unlikely to be significant joint or fracture systems. However, it was noted that on the vertical faces of case-hardened Melville Pumice or Puketoka Formation, the slab type fall slope failures commonly appeared to have a joint behind them. This is interpreted as a combination of stress release and the horizontal penetration of the case hardening into the slope, the stress release process almost certainly taking advantage of the weaker material where the case hardening ceases.
7.4.4 Vegetation and landuse Vegetation cover and land use are usually inter-related factors, as most landuse activities have a major impact on vegetation cover. It is well known that good vegetation cover with low land use pressures will reduce the likelihood of slope failures. Tree roots in particular act to bind slopes together. In general, the banks of the Waikato River are well vegetated with a mixture of native, and introduced trees, shrubs, grasses and flax.
Vegetation will be an important factor in stabilising river bank slopes cut in less cohesive materials such as the Karapiro Formation, Hinuera Formation, reworked Taupo Pumice Alluvium, and Hopuhopu Sand Member. However, on vertical slopes in case hardened Melville Pumice and Puketoka Formation, tree root prising may contribute to fall and topple failures (“slab failures”). However, not all trees found in bank erosion debris will have been causative factors in the failures, as they may have been passively involved in the event.
Vegetation at or in the water line will play a role in providing flow resistance, and will lower velocities near the bank, and reduce the potential for scour.
Vegetation can also be a contributing factor in bank erosion processes, particularly on very steep or near-vertical faces where trees are growing. Roots penetrate fractures behind the face, and assist in prising
W A I K A T O R I V E R B A N K E R O S I O N S T U D Y V O L U M E 1
Section 7 Causative Erosion Factors
Mighty River Power, 17 April 2007 89850\6000\R044 FINAL Rev A 17-4-07.doc
7-5
slabs off the slope. In addition, wind throw of trees during storms will assist this root prising process and contribute to slab failures on the valley sides.
Land use activities in the Hamilton Basin above the Waikato River are quite intense, and spill over onto the banks especially through the urban areas. The association of increased numbers of slide failures along the banks below the Cambridge wastewater treatment plant has been noted above. This is a land use activity that increases rates of groundwater flow as discussed below in Section 7.4.5. There is also a significant trend for rural-residential style development along the river outside of the urban areas. These pressures can result in loss of vegetation cover along the banks as trees are removed to improve river views, and give easier access to the water. Removal of dense tree cover can also promote fluvial erosion and the development of sheet wash, rills and gullies on the steep banks.
Other land uses can also contribute to bank erosion if not adequately managed. Buildings and structures will add load to the slope, thus increasing shear stress. Stormwater drain outlets and pipes can cause small-scale fluvial erosion. Access tracks, paths, and boat ramps all promote use of the river, but can also lead to bank erosion. Use of the banks to dump rubbish may also be a factor in bank erosion at some locations.
7.4.5 Water as a causative factor Water can play a number of roles as a causative factor in bank erosion acting on the slope, within the slope, and at and below river level at the base of the slope.
Surface water on bank slopes
Water flowing over the river bank will cause fluvial erosion. Sheet wash, rilling and gullying are typical results of this process. Overland flow results from water in excess of soil infiltration rate acting on the ground. This is most likely to occur where there is bare soil, or reduced ground cover, and is essentially a land use issue. Few sites of fluvial erosion were observed, and it is not considered to be a significant causative factor at present.
Soil water and groundwater
Increased level of soil water resulting from periods of sustained heavy rainfall results in loading of the slope, and bank erosion is likely to occur. This effect was noted in the Waikato valley by OPUS (1999, 2001). Their initial inventory of bank erosion sites had been carried out shortly after the 1998 flood, and when they re-surveyed the river in 2001, they noted many of the previously active failures had stabilised or grown over completely.
Elevated groundwater levels can also promote slope failure processes. The increased water level results in increased porewater pressures thus reducing slope shear resistance. Slope-W modelling calculations suggest this is potentially a significant factor in the slope materials found along the Waikato River (URS, 2007). The close association of slide failures with the Cambridge wastewater treatment plant is potentially related to the increased groundwater inputs in this area.
Elevated groundwater tables will occur after prolonged periods of wet weather, and some of the slope failures that occurred in 1998 will have resulted from this. As the river level drops after a prolonged flood, the groundwater table will remain high in the banks, and groundwater seeps emerging on the banks above the falling river level may contribute to bank erosion. Persistently high flow levels in the river can also raise groundwater tables where they are connected to the river. It is also noted that due to flow regulation for power generation, and the extra water delivered to the river by the Tongariro diversions, the Waikato River probably flows at a level around 0.5 m above what would occur naturally, and water tables will be graded to this higher level. However, to date there is no evidence that this has caused an increase in bank erosion.
Rapid draw-down of the water table within river banks is a known cause of bank failure. This occurs when bank material is saturated during high river levels and the river level then declines more rapidly than the groundwater in the bank. This results in elevated porewater pressures within the slope, and reduced bank

W A I K A T O R I V E R B A N K E R O S I O N S T U D Y V O L U M E 1
Section 7 Causative Erosion Factors
Mighty River Power, 17 April 2007 89850\6000\R044 FINAL Rev A 17-4-07.doc
7-6
stability, particularly in poorly consolidated materials. This process will occur naturally after the passage of flood peaks (occurring on a timescale of days or weeks), and this is unrelated to the activities of Mighty River Power. However, the effects of the much shorter-term ramping changes in water levels could produce the same effect. For this to occur, the river bank slopes would need to become saturated during the few hours over which the ramping cycles occur. McConchie (2001) investigated this process along the whole Waikato River and found that the permeability characteristics of bank materials were unlikely to support this mechanism. Most sites had rapid permeabilities, equal to or greater than the maximum ramping rate. At these sites, the bank water table would not remain elevated as the river water level fell. At sites where the permeability was low, there would be insufficient time during the ramping cycle for saturation of the bank to occur.
7.4.6 River processes The action of water at and flowing across the base of the riverbank slope can be a causative factor in bank erosion. This can result from a variety of direct and indirect effects such as:
� Wave action from boat wakes undercutting the bank.
� Ramping of the flow regime causing twice-daily fluctuations in water level, and changes in turbulence and erosive power and rapid draw down of soil pressures following ramping.
� High and low baseflow seasons changing the level of water across and within the slope.
� Bank scour removing slope materials, or carrying away the toe of former bank failures.
� Bed degradation lowering the riverbed and thus increasing the height of the river bank.
� Flood events.
The general significance of these river effects can be assessed from the vertical distribution of erosion features across the river banks, and from the longitudinal pattern of erosion down the valley.
The ramping and bank scour effects are directly related to flow velocity, and sites of increased flow velocity are likely to be sites of increased bank erosion. The analysis of bank erosion sites showed no predominance of erosion sites on the outside of river bends (Section 6.2.6). Indeed, nearly 75 % of bank erosion sites are located on straight or inside of bend sections of the river.
Observations of the height on the river bank of erosion features showed that 18 % of sites were entirely contained within the bank above normal river level (see Section 6.2.3). These bank failures are thus not related to river processes. Sites of small-scale erosion at or within 1 m of the observed water line accounted for 10.5 % of all erosion sites, but only 3.6 % of the bank area affected. River processes operating at the base of failure sites that extend higher up the valley side could contribute to bank erosion. However, it is considered unlikely that these processes would extend much beyond 3 m above the river. From Table 6-3 it can be seen that 30 % of sites occur within 3 m of river level, covering 48 % of the length of bank affected by erosion, but only 18 % of the bank area affected.
A study of the effects of ramping on river erosion processes along the banks (McConchie, Toleman and Hawke, 2005) concluded there was generally insufficient increase in current speed to increase sediment transport at the banks during the change in water levels that occurs during typical ramping. The lack of a strong association between bank erosion and sites of potentially increased flow velocity along the channel tends to support this finding.
The rapid draw-down process has been described above in Section 7.4.5. On the Waikato River the ramping cycle is short (i.e. hours) compared with flooding events where water levels remain high for periods of days or weeks. Given this, we would not expect low permeability soils to establish a saturated condition prior to the draw down occurring, and these soils are unlikely to develop an elevated pore pressure condition on draw down. For high permeability soils water pressures will respond to the river level rise due to ramping. However, this fast water uptake response will be mirrored by fast pore

W A I K A T O R I V E R B A N K E R O S I O N S T U D Y V O L U M E 1
Section 7 Causative Erosion Factors
Mighty River Power, 17 April 2007 89850\6000\R044 FINAL Rev A 17-4-07.doc
7-7
pressure dissipation during draw down. Thus for high permeability soils we do not believe that the soils can sustain an elevated pore pressure with the drop in the river level.
Whilst we acknowledge that rapid draw down can impact the river banks in flooding events, it is our opinion that the draw down effects due to ramping will be negligible.
From these observations we conclude that flow in the Waikato River, either naturally, or as a result of managed flow regimes, is typically not a primary causative factor in bank erosion. However, during flood events, more bank erosion is likely, both as a consequence of increased groundwater and soil moisture loading of the valley side slopes due to rainfall, but also near the water line as a result of increase flow velocity and sustained higher water levels. These are natural processes not significantly influenced by the activities of Mighty River Power.
7.4.7 Bed degradation issues Bed degradation has been cited as a cause of bank failure along the Waikato River (Smart, 2003, 2005). It is accepted that since 1947, the Waikato River downstream of Karapiro Dam has been a “hungry river”, as a large proportion of its bed sediment supply has been cut off by the dam. Bed degradation has been occurring for many years, although the rate has been exacerbated by other factors such as sand mining. Concern has been raised that continued bed degradation could accelerate if suspected hard sills that currently afford some level of protection of the bed at strategic locations are breached and less cohesive sediment is thus exposed (Smart, 2003, 2005). An increased rate of bed lowering could then cause the river to widen rapidly as its banks collapse, resulting in significant adverse effects.
Bed level surveys are carried out at regular intervals as part of Mighty River Power’s consent compliance responsibilities, and a full survey of the 93 cross sections between Karapiro Dam and Ngaruawahia was carried out in May this year. Mighty River Power has commissioned an analysis of this data by G. Smart which is presented in a separate report.
For the present study, an initial analysis of this survey data has been carried out by calculating weighted mean bed levels for the flat sections of river bed across these transects. Summary results for the three river reaches are shown in Table 7-1.
Table 7-1 Summary bed degradation rates in Waikato River
Reach # cross sections
Mean change 1998 – 2002/3
Mean change 2002/3 - 2006
Reach 1 14 -0.18 m -0.05 m
Reach 2 36 -0.18 m -0.01 m
Reach 3 37 -0.22 m -0.08 m
The mean annual rate of bed lowering for the river from 1998 – 2006 has been about 3 cm/year, and the rate of change has declined between 2002/3 and 2006 to an average of around 2 cm/year. Indeed, 45 % of cross sections were aggrading in this period. Hicks et al (2001) also noted a decrease in bed degradation rate in the early 1990s. These patterns of reduced bed degradation are consistent with earlier predictions (e.g. Hicks et al 2001) that bed armouring could lead to a reduction in the rate of bed degradation, but that this trend could be interrupted by large floods disturbing the bed and temporarily increasing degradation rates. The recent step-like degradation pattern is as yet short-lived, and it would be premature to suggest this has now become established.
The above pattern of bed degradation in the Waikato River between Karapiro Dam and Ngaruawahia is a continuation of a longer period of bed lowering that has been occurring since about the 1940s. This period of degradation has been a reversal of a much longer period of aggradation that had resulted in the deposition of six to nine metres of sediment on the river bed over the preceding 800 years (Schofield, 1967). The present phase of bed degradation will only have removed the top layers of this sediment.

W A I K A T O R I V E R B A N K E R O S I O N S T U D Y V O L U M E 1
Section 7 Causative Erosion Factors
Mighty River Power, 17 April 2007 89850\6000\R044 FINAL Rev A 17-4-07.doc
7-8
A suggested mechanism for bed degradation-induced bank erosion is bulk sliding (Smart 2003, 2005), whereby as the bed level lowers, a shallow surface layer in the bank above slides downwards towards the river under gravity. Tilted tree trunks leaning in towards the river are cited as evidence this process has recently occurred. However, this evidence is not convincing. Tilted trees can be seen on many other river banks and even on flat surfaces where no slope failure is occurring. The evidence from the Waikato River is not well documented, and in places where tilted trees were observed, many adjacent trees were not tilted, and this would be very unlikely if bulk sliding was occurring here. In addition, other processes could have caused the tilting including wind throw, tree development in order to catch maximum sunlight and the weight of the tree itself. It is concluded that bulk-sliding is not at present a significant cause of bank failure.
A preliminary test for bed degradation as a contributing factor in bank erosion was carried out by checking whether erosion sites were preferentially located close to river cross sections that have experienced more rapid bed degradation in recent years, in sub-reaches where there were deep pools, or where there was evidence from the cross sections of rapid rates of apparent scour of the river bank. Although a few bank erosion sites were noted near these sites, at most there were no bank failures. Thus, it is concluded that at this stage, there is no clear evidence that would directly relate the bank erosion sites documented in this study with present patterns of bed degradation.
7.4.8 Retrogressive and progressive failure modes A further river bank erosion issue concerns the mechanisms of slope failure that can result in retrogressive or progressive failure modes. In a retrogressive failure, causative factors act primarily at the base of the slope and the failure then propagates retrogressively upslope. In progressive failures, the causative factors operate at the upper part of the slope, and the failure then propagates progressively downslope.
River processes could contribute to the retrogressive failure mode by undercutting the base of the slope and initiating failure that then propagates upslope. This would be particularly expected for slide failures where the rupture surface intersects river level. However, most slides were found in Reach One and had failure surfaces well above river level. The most common failure types were falls or topples, and we consider that a retrogressive failure mode is unlikely for these as there was no clear evidence for significant undercutting of the affected slopes, and for topples, the material falls outwards from the top, which is a progressive failure mode. Therefore, we do not consider there is strong evidence for widespread retrogressive failure modes driven by river processes in the study area.
7.4.9 Relative ranking of bank erosion causative factors From the above discussion, a relative ranking of present bank erosion causative factors can be suggested as follows:
� Significant causative factors that play a role in all bank erosion features:
o Bank slope
o Bank materials.
� Moderately significant causative factors that play a role in some sites, or occur as a result of specific environmental conditions such as heavy rainfall, or prolonged wet periods:
o Groundwater flow
o Soil moisture
o Tree root prising and wind throw
o Land uses.
� Minor causative factors that are of limited spatial significance or occur due to infrequent major flood events, or that do not yet play a role in bank erosion:

W A I K A T O R I V E R B A N K E R O S I O N S T U D Y V O L U M E 1
Section 7 Causative Erosion Factors
Mighty River Power, 17 April 2007 89850\6000\R044 FINAL Rev A 17-4-07.doc
7-9
o River flow effects (particularly during floods, and also including bank scour)
o Vegetation cover
o Bank height
o Bed degradation.
Bank slope and material are spatial factors that apply across the study area. Soil moisture, groundwater, vegetation cover and land use are temporal factors that will apply when conditions are (un)favourable (e.g. during prolonged wet weather or floods). Given this spatial and temporal variability, it is not possible to provide meaningful proportions for the relative importance of these causative factors. This is further complicated by the fact that the causative factors rarely act in isolation, and mass movement failures typically result from a combination of causes. Two groups of causative factors are important in explaining the common types of bank erosion along the Waikato valley sides.
A very common type of bank erosion is the fall or topple type slab failure. This results from the combination of very steep or vertical valley sides where the highly cohesive Puketoka Formation or Melville Pumice Member sediments are case hardened. Vertical fractures develop in the slopes, and these are exploited by tree root prising and water inflow, and tree throw during storms will also assist slab failure. Thus, these failures result from a combination of bank slope, bank material characteristics, tree root prising and wind throw, and groundwater flow.
Slide failures are less common, occurring on moderate or steep slopes where bank materials favour percolating groundwater being obstructed by low permeability layers resulting in development of failure a surface that is likely to move during wet conditions when the slope is loaded with groundwater and soil moisture. Entry of water into the slope may be exacerbated by land uses that change slope morphology or remove vegetation cover. Thus, these failures result from a combination of bank material characteristics, bank slope, groundwater and soil moisture conditions, and land use or vegetation cover.
River processes are likely to be contributing factors close to the water line where small scale boat wake erosion may occur, along with scour removal of non-cohesive material, particularly toe deposits of mass movement failures that were initiated higher on the valley side. However, these processes do not result in widespread bank erosion.
River bed degradation is not regarded as a present cause of bank erosion, but may be a possible future causative factor as discussed below.
7.5 Future bank erosion The pattern of bank erosion along the Waikato River documented in this report is in many respects unremarkable. Less than 5 % of the river bank is affected, and there are no sites of accelerated bank erosion that are typical of many New Zealand rivers.
The spatial distribution of bank erosion sites suggests that slope morphological characteristics that have been inherited from the way in which the valley was formed, combined with bank material properties probably exert the main control over bank failure characteristics. These broad valley-wide factors will be moderated by other site specific factors such as slope land use and vegetation cover, and subsurface water conditions both within the soil mass and groundwater table.
The present Waikato River has not been a major agent of landform change in this valley since the great Lake Taupo break-out floods ceased about 1,800 years ago. The river is now managed and is not able to behave in its natural way. There is no clear relationship between bank erosion and river flow such as at bends or along channel constrictions. On-going bed degradation is likely to occur, but the general river bed level is still seven to eight metres above the level of 1,000 years ago, and at 3 cm/yr, it would take over 100 years to lower the bed 4 metres.
These considerations mean that it is difficult to predict future bank erosion, other than to suggest it is likely to continue at the rates observed over the past 7-8 years, and it will occur in sites similar to those where it is currently found. In particular, steep slopes cut in the Walton sub-group (Karapiro Formation),

W A I K A T O R I V E R B A N K E R O S I O N S T U D Y V O L U M E 1
Section 7 Causative Erosion Factors
Mighty River Power, 17 April 2007 89850\6000\R044 FINAL Rev A 17-4-07.doc
7-10
Hinuera Formation, and to a lesser extent the Taupo Pumice degradation terrace and Hopuhopu Sand member, will continue to show bank erosion features, especially during and after persistent heavy rains. Minor failures will continue close to the river level, particularly in the Taupo Pumice degradation terrace that forms much of the Waikato River bank.

W A I K A T O R I V E R B A N K E R O S I O N S T U D Y V O L U M E 1
Section 8 Summary and Conclusions
Mighty River Power, 17 April 2007 89850\6000\R044 FINAL Rev A 17-4-07.doc
8-1
8 Summary and Conclusions
8.1 Summary The following points summarise the main findings of this study.
8.1.1 Environmental history � The Waikato River valley is cut into the Hinuera surface of the Hamilton Basin, which was
formed between about 22,500 and 17,600 years ago. The valley was initially formed between 17,600 and 14,000 years ago and was originally about 400 m wide, and cut at least 30 – 90 metres into the basin floor.
� The present Waikato valley has been formed within the original valley, and resulted from a series of major environmental changes that occurred as a result of the Taupo Pumice eruption of 181 AD. During and shortly after the eruption the Waikato valley was choked with pumice debris flows that partly filled the old valley cut into the Hinuera surface. Subsequently, a series of massive outburst floods from Lake Taupo swept down the valley depositing pumice sand and filling the valley almost to the level of the older pumice debris. Later floods in this sequence then eroded out the pumice debris and sand and formed the present Waikato River valley.
� When formed, the Waikato valley was 75 – 150 m wide and 25 – 85 m deep. The original width has remained largely unchanged, but the valley depth is now shallower as around 800 years ago a new phase of river sedimentation began, apparently in response to human-induced increased rates of erosion in the catchment, and as a result of this the bed of the river aggraded six to nine metres. This aggradation probably increased after European settlement. However, from 1947 no bed load sediment has been able to pass Karapiro Dam, and trends of aggradation of the river bed have been replaced with bed degradation.
� The environmental history of the Waikato River has an important bearing on bank erosion characteristics as follows:
o The present Waikato River valley was formed by flood discharges an order of magnitude greater than the current flow regime. Thus the present river flow regime did not create the Waikato valley and the river is therefore an underfit stream.
o The steep valley sides were formed some 1,800 years ago, and they have retained their general form without being significantly degraded by slope erosion processes despite being effectively four to nine metres taller than at present for 1,000 years.
These factors contribute to both the generally low levels of bank erosion along the river, and the limited role of the Waikato River as a direct causative factor in this erosion.
8.1.2 Bank erosion characteristics and distribution � 389 bank erosion sites were identified affecting 10.5 km (9.7 %) of the bank length, and 4.4 ha
(2 %) of the valley side area, which is only a small proportion of the valley side.
� The main erosion types are fall/topple mass movement features or slab failures (60 %), with the remainder being slide failures. Over 57 % of bank erosion sites are on near-vertical or very steep slopes.
� Erosion sites occur along the valley at around 7/km, with a marked drop-off in sites in the last 15 km before Ngaruawahia. Sub-reaches with increased numbers of erosion sites occur at kilometres 9-10 near Cambridge, kilometres 22 and 29 upvalley from Hamilton, and kilometres 34 and 37 within Hamilton City.

W A I K A T O R I V E R B A N K E R O S I O N S T U D Y V O L U M E 1
Section 8 Summary and Conclusions
Mighty River Power, 17 April 2007 89850\6000\R044 FINAL Rev A 17-4-07.doc
8-2
� At 18 % of sites covering 26 % of the total bank erosion area, the toe of the failures did not reach to normal river level, and it is considered very unlikely that river processes were significant causative factors in these features.
� At 10.5 % of sites, the erosion was entirely contained within 1 m of the river level. These sites, covering only 3.6 % of the total erosion area, are considered likely to be significantly affected by river erosion processes.
� A further 14.4 % of the total area affected by erosion occurred at up to 3 m above normal river level, and river erosion processes may have contributed to these failures. In 56 % of the bank area affected by erosion, the top of the failures occurred to more than 3 m above normal river level, and it is unlikely that river erosion processes would be significant causative factors here.
� In total, river erosion processes may have been contributory causative factors in up to 30 % of bank erosion features. These sites covered only 18 % of the total area affected by erosion.
� Bank erosion sites are not preferentially associated with zones of increased flow velocity along the channel. Only 33 % of sites occur on the outside of river bends, and 58 % occur on straight river sub-reaches. Some 30 % of bends had no associated bank erosion.
8.1.3 Bed degradation � Present bed degradation was not observed to be a factor causing bank erosion. Deep pools
along the river are sites where bed lowering has occurred more rapidly, and there is no pattern of increased bank erosion associated with these sites.
� This lack of association between bed degradation and bank erosion may be due to the fact that while the river banks are becoming slowly higher, they are still much lower than when they were first formed. The amount of bed degradation that has occurred is modest when compared to previous natural bed levels that were seven to eight metres lower than at present that did not result in widespread bank erosion.
8.2 Conclusions � Bank erosion is occurring on only 2 % of the bank area between Karapiro Dam and
Ngaruawahia.
� A relative ranking of present bank erosion causative factors can be suggested as follows:
o Significant causative factors that play a role in all bank erosion features:
� Bank erosion
� Bank materials.
o Moderately significant causative factors that play a role in some sites, or occur as a result of specific environmental conditions such as heavy rainfall, or prolonged wet periods.
� Groundwater flow
� Soil moisture
� Tree root prising and wind throw
� Land use.
o Minor causative factors that are of limited spatial significance or occur due to infrequent major flood events, or that do not yet play a role in bank erosion:
� River flow effects (particularly during floods, and also including bank scour
W A I K A T O R I V E R B A N K E R O S I O N S T U D Y V O L U M E 1
Section 8 Summary and Conclusions
Mighty River Power, 17 April 2007 89850\6000\R044 FINAL Rev A 17-4-07.doc
8-3
� Vegetation cover
� Bank height
� Bed degradation.
� The dominance of fall or topple type slab failures results from the combination of very steep or near-vertical valley sides with fractures that develop in case hardened or highly cohesive Puketoka Formation or Melville Pumice Member sediments, assisted by tree root prising or wind throw.
� Slide failures occur on moderate or steep slopes where bank materials favour percolating groundwater being obstructed by low permeability layers resulting in development of failure a surface that is likely to move during wet conditions when the slope is loaded with groundwater and soil moisture, and exacerbated by land uses that change slope morphology or remove vegetation cover.
� River processes are likely to be a contributing factor close to the water line where small scale boat wake erosion may occur, along with scour removal of non-cohesive material, particularly toe deposits of mass movement failures that were initiated higher on the valley side.
� Future bank erosion is likely to occur in similar locations to the present.
� The spatial distribution of bank erosion features along the Waikato River valley between Karapiro Dam and Ngaruawahia both horizontally along the valley, and vertically up the valley sides shows that:
o River erosion processes do not appear to be major causative erosion factors; and
o The activities of Mighty River Power in regulating the flow regime and contributing to on-going bed degradation have only a minor influence on present bank erosion patterns.

W A I K A T O R I V E R B A N K E R O S I O N S T U D Y V O L U M E 1
Section 9 References
Mighty River Power, 17 April 2007 89850\6000\R044 FINAL Rev A 17-4-07.doc
9-1
9 References
Allaby, A, and M. Allaby, 1990: The Concise Oxford Dictionary of Earth Sciences Oxford University Press, Oxford, 410 p.
ASR 2004: Middle Waikato River bed investigations Stage II: ramping effects Report prepared for Environment Waikato by D. Johnson, K. Black, and J. Mathew. ASR Ltd Marine and Freshwater Consulting and Research. 26 August 2004 110 p.
BEAC 2006a: Stage IV – Bed degradation management strategy Final Draft – Appendices. Report by Beca Infrastructure Ltd prepared for Environment Waikato, 28p.
BECA 2006b: Proposed middle Waikato River bed degradation management strategy Report by Beca Infrastructure Ltd prepared for Environment Waikato, 28p.
Cruden, D.M. and D.J. Varnes 1996 Landslide types and processes. Ch 3, pp 36 – 75 in Turner, A.K. and R.L. Schuster (eds), Landslides Investigation and Mitigation Special Report 247 Transportation Research Board, National Research Council. National Academy Press, Washington, D.C,.
Discovery Marine (2006): Waikato River, River Bed re-survey. Project G2006/5, prepared for Mighty River Power.
Fairless, G.J., 2002: Waikato River Bank Stability at Hamilton City. Report prepared by Opus International Consultants. Hamilton, New Zealand. 11 p.
Gibb, J.G., 1986: A New Zealand regional Holocene eustatic sea-level curve and its application to determination of vertical tectonic movements. Royal Society New Zealand Bulletin, 24: 377-395.
Healy, J.1946: Geology of the Karapiro District, Cambridge. NZ Journal of Science and Technology B27 (3): 133-217.
Healy, T.R., and K. Wo 2002: Sediment characteristics and bed level changes in relation to sand extraction and damming of a sand-gravel river: the lower Waikato River, New Zealand Journal of Hydrology New Zealand 41(2): 175 – 196.
Hicks, D.M.; Webby, M.G.; Duncan, M.J.; Harding, S. 2001: Waikato River sediment budget and processes. National Institute of Water and Atmospheric Research Ltd, Client Report CHC01/24. 105 p.
Kear, D., Schofield, J.C., 1978: Geology of the Ngaruawahia Subdivision New Zealand Geological Survey Bulletin #88. Department of Scientific and Industrial Research, Wellington, 167 p.
Manville, V. 2002: Sedimentary and geomorphic responses to ignimbrite emplacement: readjustment of the Waikato River after the AD 181 Taupo Eruption, New Zealand. Journal of Geology 110: 519 – 541.
Manville, V., and C.N.J. Wilson 2004: the 26.5 ka Oruanui eruption, New Zealand: a review of the roels of volcanism and climate in the post-eruptive sedimentary response. New Zealand Journal of Geology and Geophysics 47: 525 – 547.
McConchie, J., 2001: Waikato River Geomorphic Processes. Report for Mighty River Power. Earth Sciences, Victoria University of Wellington, 248 p.
McConchie, J., 2003: Statement of Evidence Presented to Mighty River Power Taupo Waikato Resource Consent Hearing. Volume 1, 85 p; and Volume 2, 101 Figures.
McConchie, J.A.; and I.E.J. Toleman 2003: Boats wakes as a cause of riverbank erosion: a case study from the Waikato River, New Zealand. Journal of Hydrology New Zealand 42(2): 163 – 179.
McConchie, J.A.; I.E.J. Toleman; and R.M. Hawke 2005: Effect of flow regulation on near-bank velocities and sediment transport potential: A case study from the Waikato River, New Zealand. Journal of Hydrology New Zealand 44(1): 45 – 72.
McCraw, J.D., 1967: The surface features and soil pattern of the Hamilton Basin, Earth Science Journal

W A I K A T O R I V E R B A N K E R O S I O N S T U D Y V O L U M E 1
Section 9 References
Mighty River Power, 17 April 2007 89850\6000\R044 FINAL Rev A 17-4-07.doc
9-2
Moon, V.; Blackstock, H. 2004: A methodology for assessing Landslide Hazard Using Deterministic Stability Models. Natural Hazards 32:111-134.
Morisawa, M. 1985: Rivers Longman, London. 222 p.
NIWA (Ramsay, D., T. Hume; M. Stevens; T. Williston; A. Taumoepeau) 2005: Middle Waikato River bed degradation investigation Stage II bed survey. NIWA Client Report HAM2004-050 prepared for Environment Waikato.
NZGS, 2005: Field description of soil and rock. Guideline for the field classification of soil and rock for engineering purposes. New Zealand Geotechnical Society Inc., December 2005.
OPUS (Bowler, J.M., Andrews, S.R.) 1999: Waikato River Geomorphic Processes Site Survey Inventory.Report prepared by Opus International Consultants. Wellington, New Zealand, September 1999. 23 p.
OPUS, 2000 Waikato River Geomorphic Processes Study: analogues for unmodified river behaviour (Objective 4.1). OPUS Wellington report for Mighty River Power. 5p.
OPUS (Harding, S.J., Andrews, S.R., McConchie, J.A.) 2001: Waikato River Geomorphic Processes Study: Repeat Site Survey Inventory and Interpretations. Report prepared by Opus International Consultants. Wellington, New Zealand, September 2001. 13 p.
Schofield, J.C. 1967: Recent aggradation within the Waikato River Earth Science Journal 1:124 – 129.
Selby, M.J. and Lowe, D.J.; 1992: The middle Waikato basin and hills, In: J.M. Soons and M.J. Selby (eds), Landforms of New Zealand, 2nd edn, Longman Paul, Auckland, pp. 233-255.
Smart, G. 2005: Analysis of degradation. Waikato River Karapiro to Ngaruawahia Report prepared for Environment Waikato. 65 p.
Smart, G., 2003: Degradation of the Waikato River: Karapiro to Ngaruawahia, A Review of Existing Knowledge and Recommendations for Future Work. Report Prepared for Environment Waikato. Hamilton East, Hamilton. 51 p.
Smith, R.K., Kemp, C.L., Taumoepeau, A., Liefting, R.C., Smith, J.P., Stephens, S.A., Dugdale, T.M., 2002: Waikato River bed sediment characteristics between Cambridge and Ngaruawahia. National Institute of Water and Atmosphere Research Ltd, Client Report: MRP02240. Hamilton, New Zealand. 26p.
URS, 2007: Setback Assessment Report, Peacocke Growth Cell. Prepared for Hamilton City Council.
Varnes, D.J., 1975: Slope movements in the western United States pp 1-17 in Mass Wasting GeoAbstracts, Norwich.
Varnes, D.J., 1978: Slope movement types and processes. In Special Report 176: Landslides: Analysis and Control (R.L. Schuster and R.J. Krizek, eds.), TRB, National Research Council, Washington, D.C., pp. 11-33.
Wilson, C.N.J. 2001: The 26.5 ka Oruanui eruption, New Zealand: an introduction and overview. Journal of Volcanology and Geothermal Research 112: 133 – 174.
Wood, A. 2006: Morphodynamic Channel and stability of the Waikato River: Karapiro to Ngaruawhia Reach. MSc Thesis, University of Waikato.

W A I K A T O R I V E R B A N K E R O S I O N S T U D Y V O L U M E 1
Section 10 Limitations
Mighty River Power, 17 April 2007 89850\6000\R044 FINAL Rev A 17-4-07.doc
10-1
10 Limitations
URS New Zealand Ltd (URS) has prepared this report in accordance with the usual care and thoroughness of the consulting profession for the use of Mighty River Power and Hamilton City Council and only those third parties who have been authorised in writing by URS to rely on the report. It is based on generally accepted practices and standards at the time it was prepared. No other warranty, expressed or implied, is made as to the professional advice included in this report. It is prepared in accordance with the scope of work and for the purpose outlined in the Proposal dated 14 July 06.
The methodology adopted and sources of information used by URS are outlined in this report. URS has made no independent verification of this information beyond the agreed scope of works and URS assumes no responsibility for any inaccuracies or omissions. No indications were found during our investigations that information contained in this report as provided to URS was false.
This report was prepared between October and April 2007 and is based on the conditions encountered and information reviewed at the time of preparation. URS disclaims responsibility for any changes that may have occurred after this time.
This report should be read in full. No responsibility is accepted for use of any part of this report in any other context or for any other purpose or by third parties. This report does not purport to give legal advice. Legal advice can only be given by qualified legal practitioners.


