72
1 STRATEGIES TO IMPROVE DELHI’S BUS SYSTEM WAITING FOR A BUS Strategies to improve Delhi’s bus system Centre for Science and Environment Waiting for a bus report.indd 1 05/10/17 3:55 PM

1
STRATEGIES TO IMPROVE DELHI’S BUS SYSTEM
WAITING FOR A BUS
Strategies to improve Delhi’s bus system
Centre for Science and Environment
Waiting for a bus report.indd 1 05/10/17 3:55 PM

Waiting for a bus report.indd 2 05/10/17 3:55 PM

WAITING FOR A BUS
Strategies to improve Delhi’s bus system
Centre for Science and Environment
Waiting for a bus report.indd 3 05/10/17 3:55 PM

Research direction: Anumita Roychowdhury
Lead researchers: Gaurav Dubey and Anu K. Soman
Research inputs: Usman Nasim
Editor: Arif Ayaz Parrey
Design: Ajit Bajaj
Cover: Ritika Bohra
Photographs: Vikas Choudhary
Production: Rakesh Shrivastava and Gundhar Das
Advisor on and assessment of the aggregator model for bus operation: Laghu Parashar
We are grateful to the MacArthur Foundation for institutional support in preparing this document.
© 2017 Centre for Science and Environment
Material from this publication can be used, but with acknowledgement.
Citation: Anumita Roychowdhury, Gaurav Dubey and Anu Soman 2017, Waiting for a bus: Strategies to improve Delhi’s bus system, Centre for Science and Environment, New Delhi
Published byCentre for Science and Environment41, Tughlakabad Institutional Area, New Delhi 110 062Phones: 91-11-40616000Fax: 91-11-29955879E-mail: [email protected] Website: www.cseindia.org
Waiting for a bus report.indd 4 05/10/17 3:55 PM

Why buses in Delhi? 9
1. Challenges for the DTC bus system 17
2. Factors impeding improvement in bus service 24
3. Addressing staggering costs and financing 32
4. Bus aggregators: Innovative model for modal shift from cars 41
The way forward 52
References 57
Annexures 58
Contents
Waiting for a bus report.indd 5 05/10/17 3:55 PM

6
WAITING FOR A BUS
List of figuresFigure 1: Trip booking process for a bus aggregator .......................................44
List of graphsGraph 1: Modal share of all forms of transport in Delhi in 2010 .................. 10Graph 2: Daily ridership of Delhi Metro 2000–16 ......................................... 12Graph 3: DTC earnings linked to volume of passengers ................................ 13Graph 4: Trend in daily ridership in DTC buses ............................................ 13Graph 5: Ridership versus fleet size ............................................................... 14Graph 6: Bus fleet requirement vs existing fleet in Delhi .............................. 18Graph 7: DTC’s fleet size over the years ......................................................... 18Graph 8: Projected fleet size of DTC ............................................................... 25Graph 9: Gap between cost and earnings ....................................................... 33Graph 10: Trend in net losses per km ............................................................... 33Graph 11: Interest payment on government loans ........................................... 34Graph 12: Interest payments in different cities—2013–14 and 2014–15 ........ 34Graph 13: Trend in labour and material cost ................................................... 35Graph 14: Total fuel cost per km ...................................................................... 35Graph 15: Operational losses per km ............................................................... 36Graph 16: Total cost per bus ............................................................................. 36Graph 17: Traffic revenue per km ..................................................................... 37Graph 18: Ticket fare recovery .......................................................................... 37Graph 19: Relative share of different cost components ................................... 37Graph 20: Modal shift ....................................................................................... 47Graph 21: Reason for selecting the services ..................................................... 48
Waiting for a bus report.indd 6 05/10/17 3:55 PM

7
STRATEGIES TO IMPROVE DELHI’S BUS SYSTEM
List of tablesTable 1: Overall modal share of public and personal transport in Delhi .... 10Table 2: Declining share of public modes of transport in Delhi .................. 10Table 3: Trend in bus and metro supply in Delhi 2000–15 .......................... 12Table 4: Timeline of procurement of buses by DTC in recent years ............ 14Table 5: Timeline of procurement of bus under the cluster scheme............ 14Table 6: Passenger load of Delhi and other state transport undertakings .... 15Table 7: Comparison of Delhi’s bus fleet size with world’s megacities ....... 19Table 8: Age profile of DTC’s buses ............................................................... 20Table 9: Service headway of routes in peak hours—DTC ............................ 20Table 10: Service headway of routes in peak hours—cluster scheme ........... 21Table 11: Cancellation of schedules—comparison of Delhi with
other STUs ........................................................................................ 21Table 12: Fleet utilizations for Delhi and other state transport
undertakings ..................................................................................... 21Table 13: Vehicle utilization of DTC and other state transport
undertakings ..................................................................................... 22Table 14: Breakdown rate of DTC buses and other state transport
undertakings ..................................................................................... 22Table 15: Operating ratio for DTC ................................................................... 23Table 16: Operating ratio for DTC, Cluster and other state transport
undertakings ..................................................................................... 23Table 17: Annual bus procurement required by DTC to maintain
a fleet size of 5,500 ........................................................................... 25Table 18: Timeline of procurement of buses by DTC in recent years ............ 26Table 19: Timeline of procurement of buses under the cluster scheme ........ 26Table 20: Supply timeline of buses for Ashok Leyland ................................. 30Table 21: Supply timelines of buses for Tata Motors ..................................... 31Table 22: Supply timelines of buses for Swaraj Mazda .................................. 31Table 23: Supply timelines of buses for Force Motors ................................... 31Table 24: Performance comparison of DTC and the cluster scheme ............. 42Table 25: Functional distribution between the aggregator and operator ....... 44
Waiting for a bus report.indd 7 05/10/17 3:55 PM

8
WAITING FOR A BUS
Waiting for a bus report.indd 8 05/10/17 3:55 PM

9
STRATEGIES TO IMPROVE DELHI’S BUS SYSTEM
Why buses in Delhi?
Travel demand has grown significantly in Delhi. How people choose to travel will decide the severity of pollution and congestion caused by traffic and, ultimately, liveability of the city. If people choose to use more
cars and two-wheelers, the scary trend in pollution and congestion will become irreversible. This is a serious concern, given the rapid increase in trip numbers in the city. According to the 2021 Master Plan of Delhi, the per capita trip rate (excluding walk trips) of Delhi has grown from 0.72 in 1981 to 0.87 in 2008. This means that the total number of daily travel trips has increased from 45 lakh in 1981 to 118 lakh in 2001 and 144 lakh trips in 2008.1 This is projected to increase to 280 lakh daily travel trips by 2020. With an average trip distance of 10.2 km and growing travel intensity, only augmenting road capacity for vehicles will not help. Delhi needs to reinvent its public transport system to expand the people-carrying capacity of roads.
However, a growing body of evidence suggests that there is already a massive slide in the share of public transport ridership in the city. Public transport’s share in the ever-increasing travel demand has been continuously declining since 2001 and is projected to drop even further in the years to come. The share of all public transport has reduced from 64 per cent in 2001 to 54 per cent in 2010. At the same time, the share of all personal vehicles has increased from about 40 per cent to about 46 per cent (see Table 1: Overall modal share of public and personal transport in Delhi and Graph 1: Modal share of all forms of transport in Delhi in 2010).2
This long slide happened during the peiod 1981–2005, when the ratio of public transport to private transport in the passenger kilometres travelled in Delhi increasingly began to change in favour of the latter. There was no preventive strategy to stem the tide (see Table 2: Declining share of public transport in Delhi).3
Delhi’s overall public transport needs are met by buses, a metro system, a suburban rail system, private vehicles, taxis, auto-rickshaws, shared auto-rickshaws, cycles, cycle-rickshaws and walking. These are extremely diverse systems designed to meet travel requirements of different groups of commuters (belonging to different income classes) and varying journey types. Inadequate supply of public transport and poor integration of these systems has resulted in buses and metro systems running at crush capacities during peak hours, making public transport increasingly unattractive. This demands a massive transition in the mobility systems of the city.
Waiting for a bus report.indd 9 05/10/17 3:55 PM

10
WAITING FOR A BUS
Table 1: Overall modal share of public and personal transport in Delhi
Modal split ( in percentage) 2001 20102021 (recommended by Master Plan for
Delhi)
Public transport (including rail, light rail, MRTS, IRBT, bus and tram; excluding on-foot trips)
64.1 54.02 80
Personal modes (including personal and hired fast, hired slow, and bicycles; excluding on-foot trips)
35.9 45.98 20
Source: Master Plan for Delhi, Delhi Development, Authority, 2021
Table 2: Declining share of public transport in Delhi
Passenger kilometres travelled in Delhi through public and private modes (billion passenger km per year)
Year Total Public Private Public to private ratio
1981 69.37 57.22 12.14 4.7
2001 99.49 75.40 24.09 3.1
2005 108.57 76.91 31.67 2.4
Source: Dynamics of Urban Mobility: A comparative analysis of megacities of India by Indira Gandhi Institute of
Development Research, Mumbai, 2010
Graph 1: Modal share of all forms of transport in Delhi in 2010
Train 1% Metro 4%
School bus
12%
RTV 2% Chartered bus 2%
Bus 34%
Shared auto 1%
Auto 3%
Two wheeler 25%
Shared taxi 1%
Taxi 0%
Pool car 0%
Car 15%
Source: Rationalization of Bus Routes in Delhi, Department of Transport, GNCTD, 2011
Role of buses in the mobility transitionWhile a diverse set of public transport systems are needed to meet variable demand based on distances, requirements of high capacity mass movement, desired journey speed, accessibility, and affordability, buses have a special role in mobility transition of cities.
Waiting for a bus report.indd 10 05/10/17 3:55 PM

11
STRATEGIES TO IMPROVE DELHI’S BUS SYSTEM
Buses can be flexibly organized to cover maximum areas of population concentration in a city. Bus routes can flexibly meet the needs of changing demography and land use in a city. They can cover areas with lower travel demand. They also allow more direct connectivity between origin and destination with minimal interchange, thus saving both time and money. Bus services are affordable, cost-effective and space-efficient. A bus network has a much wider and flexible outreach in congested cities. It can also cover areas with lower travel demand that may not merit a rail system. With a much smaller investments, buses can be used to achieve dramatic improvements in the time of travel. Improved services and better performance only increases the number of commuters.
A bus occupies only twice the road space taken by a car, but can carry 40 times the number of passengers. According to a study by the Paris-based International Energy Agency (IEA), a reasonably-full bus can replace anywhere between five and 50 other motorized vehicles. More buses also means an enormous saving in oil (and thus money) and reduction in pollution.
Traditionally, bus usage has been high in Delhi and other Indian cities, but there has been a significant decline in the share of buses in total passenger travel in recent times. Poor people are most dependent on affordable and cheap public transport to access jobs and services. Urban poor can use up to 25–30 per cent of their income on transportation. But buses can also work for the rich as well-designed bus systems improve the comfort of journey by directly linking destinations with minimal interchange.
When the Delhi Master Plan, 2021 set a target of 80 per cent share for public transport in the city by 2020,4 it took cognizance of the Rail India Technical and Economic Service (RITES) estimate that to achieve this target the share of buses will have to be at least 73 per cent of public transport trips.5 Delhi, therefore, has to plan a bus system to enable meeting such a target. While the rail-based metro system is important, it cannot meet all needs.6 Moreover, most metro trips generate at least two bus trips. The ring railway system in Delhi is still quite inconsequential (see Box: Metro and rail supply in Delhi).
Bus services in Delhi are provided jointly by Delhi Transport Corporation (DTC) and under the ‘cluster scheme’ managed by Delhi Integrated Multimodal Transit System (DIMTS) on behalf of Government of National Capital Territory (NCT) of Delhi (GNCTD). At present, DTC owns 3,789 buses (excluding fully-depreciated buses), while DIMTS is operating 1,693 buses under the cluster scheme. This brings the total bus fleet size of Delhi to 5,482. It has to cater to the mobility needs of 17 million people. The role of DTC is very important as it is expected to own and operate at least 50 per cent of the buses. The state of DTC is critical in determining the robustness of the overall bus operation. The fleet of the cluster buses and ridership have grown at a smaller scale.
While the bus system in Delhi can hardly be said to have been ideal at any given point in history, it currently faces a grave crisis which, if not acknowledged and resolved, will result in the gradual death of a system that has formed the backbone of the city’s commuting needs over the past decades, in turn leading to the mushrooming of other informal modes that will invariably come up and step in to fill the supply–demand gap, complicating traffic and pollution management.
Waiting for a bus report.indd 11 05/10/17 3:55 PM

12
WAITING FOR A BUS
Metro and rail supply in Delhi
Metro system
Delhi Metro, operated by the Delhi Metro Rail Corporation (DMRC) is growing steadily since its commissioning in 2002.
Given the state of traffic congestion in Delhi, it provides the quickest way to reach places over long distances in Delhi, Noida
and Gurgaon. It spans a network of about 213 km with 160 stations and carries 25.9 lakh commuters daily (see Graph 2:
Daily ridership of Delhi Metro 2002–16). Over the last decade, among all the public transport providers in the city, the metro
has shown a steady increase in commuter numbers as its infrastructure has expanded. The metro lines have lengthened
steadily (see Table 3: Trend in bus and metro supply in Delhi 2000–15).
In a bid to provide last mile connectivity, DMRC is running a feeder bus service. DMRC has ordered for 400 non-AC midibuses
in 2014. However, the system has only received moderate response in terms of ridership. Proper cognizance of other modes
that also act as feeder, such as auto-rickshaws, e-rickshaws, gramin seva (shared auto-rickshaws), and cycle rickshaws, and
rationalization of the DMRC feeder system around the supply of these modes is required to create a more optimal system.
Graph 2: Daily ridership of Delhi metro 2000–16
0.42 1.12 2.02
4.46
6.92 8.03
11.29
15.81
6 stations3 km at launch
59 stations65.1 km at end of phase-1
85 stations125 km at end of phase-2
18.64
23.57 23.38
25.9
2002 2003 2004 2005 2006 2007 2008 2009 2010 2011 2012 2013 2014 2015 2016
5.62
0.82
21.29
Note: In lakhs
Source: Delhi Metro Rail Corporation
Table 3: Trend in bus and metro supply in Delhi 2000–15Buses (DTC) No. 3,524 3,469 3,444 3,537 3,804 4,725 6,204 5,892 5,445 5,216 4,712 4,169
Cluster buses No. 0 0 0 0 0 0 0 231 300 631 1,406 1,490
Cumulative length of Delhi metro
Km 0 0 33 65 68 74.55 95.84 161.4 190 190 190 193.3
(May 2011)
(July 2012)
(July 2013)
Source: Economic survey reports of Delhi, DMRC Annual Reports, DIMTS Press releases
Ring rail system
The role of the ring rail system of Delhi, constructed in 1930s for the purpose of freight transport, has been emphasized in
intra-urban services for the last 40 years. The system was expected to carry about 12 per cent of the commuter load of Delhi
but actually carries less than 1 per cent. While various reasons have been cited for its inability to deliver a bigger role in the
city’s commute system, the system does remain saturated with freight traffic and may not have spare capacity to cater to
additional passenger load.
Waiting for a bus report.indd 12 05/10/17 3:55 PM
13
STRATEGIES TO IMPROVE DELHI’S BUS SYSTEM
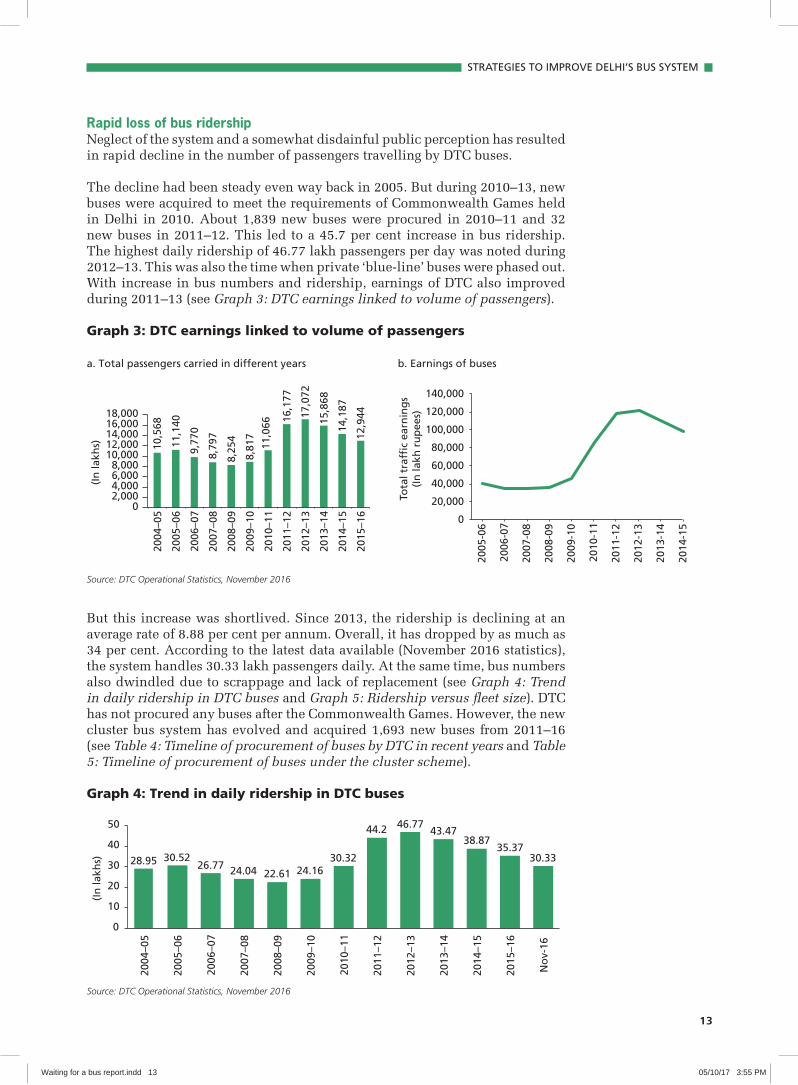
Rapid loss of bus ridershipNeglect of the system and a somewhat disdainful public perception has resulted in rapid decline in the number of passengers travelling by DTC buses.
The decline had been steady even way back in 2005. But during 2010–13, new buses were acquired to meet the requirements of Commonwealth Games held in Delhi in 2010. About 1,839 new buses were procured in 2010–11 and 32 new buses in 2011–12. This led to a 45.7 per cent increase in bus ridership. The highest daily ridership of 46.77 lakh passengers per day was noted during 2012–13. This was also the time when private ‘blue-line’ buses were phased out. With increase in bus numbers and ridership, earnings of DTC also improved during 2011–13 (see Graph 3: DTC earnings linked to volume of passengers).
Graph 3: DTC earnings linked to volume of passengers
a. Total passengers carried in different years b. Earnings of buses
10,5
68
11,1
40
9,77
0
8,79
7
8,25
4
8,81
7
11,0
66 16
,177
17,0
72
15,8
68
14,1
87
12,9
44
0 2,000 4,000 6,000 8,000
10,000 12,000 14,000 16,000 18,000
2004
–05
2005
–06
2006
–07
2007
–08
2008
–09
2009
–10
2010
–11
2011
–12
2012
–13
2013
–14
2014
–15
2015
–16
(In
lakh
s)
0
20,000
40,000
60,000
80,000
100,000
120,000
140,000
2005
-06
2006
-07
2007
-08
2008
-09
2009
-10
2010
-11
2011
-12
2012
-13
2013
-14
2014
-15
Tota
l tra
ffic
ear
nin
gs
(In
lakh
ru
pee
s)
Source: DTC Operational Statistics, November 2016
But this increase was shortlived. Since 2013, the ridership is declining at an average rate of 8.88 per cent per annum. Overall, it has dropped by as much as 34 per cent. According to the latest data available (November 2016 statistics), the system handles 30.33 lakh passengers daily. At the same time, bus numbers also dwindled due to scrappage and lack of replacement (see Graph 4: Trend in daily ridership in DTC buses and Graph 5: Ridership versus fleet size). DTC has not procured any buses after the Commonwealth Games. However, the new cluster bus system has evolved and acquired 1,693 new buses from 2011–16 (see Table 4: Timeline of procurement of buses by DTC in recent years and Table 5: Timeline of procurement of buses under the cluster scheme).
Graph 4: Trend in daily ridership in DTC buses
28.95 30.52 26.77 24.04 22.61 24.16
30.32
44.2 46.77 43.47
38.87 35.37
30.33
0
10
20
30
40
50
2004
–05
2005
–06
2006
–07
2007
–08
2008
–09
2009
–10
2010
–11
2011
–12
2012
–13
2013
–14
2014
–15
2015
–16
No
v-16
(In
lakh
s)
Source: DTC Operational Statistics, November 2016
Waiting for a bus report.indd 13 05/10/17 3:55 PM

14
WAITING FOR A BUS
Graph 5: Ridership versus fleet size
30.5
2
26.7
7
24.0
4
22.6
1
24.1
6
30.3
2 44.2
46.7
7
43.4
7
38.8
7
35.3
7
30.3
3
0 1,000 2,000 3,000 4,000 5,000 6,000 7,000
0
10
20
30
40
50
2005
–06
2006
–07
2007
–08
2008
–09
2009
–10
2010
–11
2011
–12
2012
–13
2013
–14
2014
–15
2015
–16
No
v-16
(In
nu
mb
ers)
(In
lakh
s)
Total passenger carried daily DTC bus fleet
Source: DTC Operational Statistics, November 2016
Table 4: Timeline of procurement of buses by DTC in recent years
YearTotal buses
procured
Low-floor AC buses procured
Low-floor non-AC buses procured
No. of buses depreciated
Fleet at the end of the
year
2010–11 1,839 959 880 360 6,204
2011–12 32 25 7 345 5,891
Source: DTC Operational Statistics, November 2016
Table 5: Timeline of procurement of bus under the cluster scheme
Date No. of buses procured Total no. of buses
May 2011 Cluster system launched in Delhi
November 2011 231 231
December 2012 148 379
September 2013 315 694
April 2014 463 1,157
January 2015 333 1,490
2015–16 (December 2016) 203 1,693
Source: DIMTS Operational statistics; DIMTS Press Releases, 2015–16
Among the mega-metropolitan cities in India, Bengaluru and Chennai are handling more passengers than Delhi. The daily passenger load per bus in Delhi has come down from 952 passengers in 2013–14 to 927 in 2015–16 (see Table 6: Passenger load of DTC and other state transport undertakings). Arguably, this can be attributed to the decline in reliability of services that occurs once the provided frequency is reduced due to inadequate fleet. Concurrently, the stated load factor has also come down from 86.63 per cent in 2013–14 to 82 per cent in 2015–16.
For the buses under the cluster scheme, average daily passenger load is about 831 passengers, with buses carrying a total of 10.6 lakh passengers every day. The lower figure can be attributed to the fact that the fleet under the cluster scheme is comprised only of standard buses while 90 per cent of DTC’s fleet is low-floor buses.
Waiting for a bus report.indd 14 05/10/17 3:55 PM

STRATEGIES TO IMPROVE DELHI’S BUS SYSTEM
Table 6: Passenger load of Delhi and other state transport undertakings
Mumbai Bengaluru Delhi Chennai
2014–15 2014–152015–16
2014–15DTC Cluster
Passengers (lakh per day 33.47 53.06 35.37 10.6 49.64
Passengers per bus per day 788 798 927 831 1311
Source: Review of the Performance of State Road Transport Undertakings (Passenger Services) for April, 2013–March,
2014 (MORTH Publication); DIMTS- Cluster Bus Operational Statistics, 2015–16; DTC Operational Statistics, 2016
DTC overestimating passenger numbersWhile the drop in bus passenger numbers in itself is worrying, there is an additional concern that even the current numbers are an overestimation due to flawed calculations.
As per the latest available DTC statistics (November 2016), a total of 29.58 lakh passengers are carried daily, of which only 13.36 lakhs (45 per cent) are ticketed passengers. The rest of 16.22 lakh (55 per cent) passengers are those estimated to be traveling using passes. As per the same statistics, there are a total of 1.81 lakh passes issued at present for city buses, which give an absurd estimation of each pass-holder traveling roughly nine times per day. Thus, a pass holder is counted as travelling nine times during the course of a single day and that inflates the daily trip number. Essentially, this estimation points towards some discrepancy which if corrected may bring down the official estimates of daily ridership down significantly.
Stem the slide As Delhi follows a hybrid system that includes both public and private operation with greater responsibility resting on the state-run DTC, it will be disastrous to allow DTC to collapse. Declining fleet size and operational inefficiencies results in lesser frequency of buses, and brings down the reliability of the system for users. It is no surprise, therefore, that patronage has been decreasing in overall terms as well as per bus constantly; and while studies have been carried out to rationalize the system in tune with changing commuting patterns of the city, the recommendations have not been implemented, leading to a mismatch between the supply offered by the system and the demand generated by the city’s commuters.
While other cities have moved ahead with integration of Intelligent Transport Systems (ITS), along with various other aspects of their bus system (fare collection, passenger information, vehicle location, and fleet and crew scheduling processes), DTC has lagged behind. This significantly affects both the efficiency of the system as well as the quality of the experience for the user.
Immediate steps need to be taken to set the milestones for fleet renewal and expansion as well as to improve service levels of the system according to a well laid out benchmark. Also, given the fact that the cost of transition will have to be borne largely by the Delhi government and the tax payers of Delhi, it is important to develop a funding strategy to meet the desired level of improvement in bus systems and services.
Waiting for a bus report.indd 15 05/10/17 3:55 PM

16
WAITING FOR A BUS
To understand the challenges and barriers and also to develop a roadmap for bus sector reform in Delhi, Centre for Science and Environment carried out this rapid assessment of the Delhi bus system, particularly state-owned Delhi Transport Corporation (DTC). It has not been possible to carry out detailed analysis of the cluster bus system, the other key bus provider in the city, due to paucity of available information.
This assessment also includes a review of the new model of bus aggregators, an example of shared mobility that is an emerging alternative system to conventional bus operation and management in Delhi. The possibilities of this system, which has already penetrated the taxi system and is expected to be a disruptive idea even for buses, has been evaluated. This system has the potential to draw people from personal vehicles but requires an early review and a roadmap for proper roll-out and management.
Waiting for a bus report.indd 16 05/10/17 3:55 PM

17
STRATEGIES TO IMPROVE DELHI’S BUS SYSTEM
1: Challenges for the DTC bus system
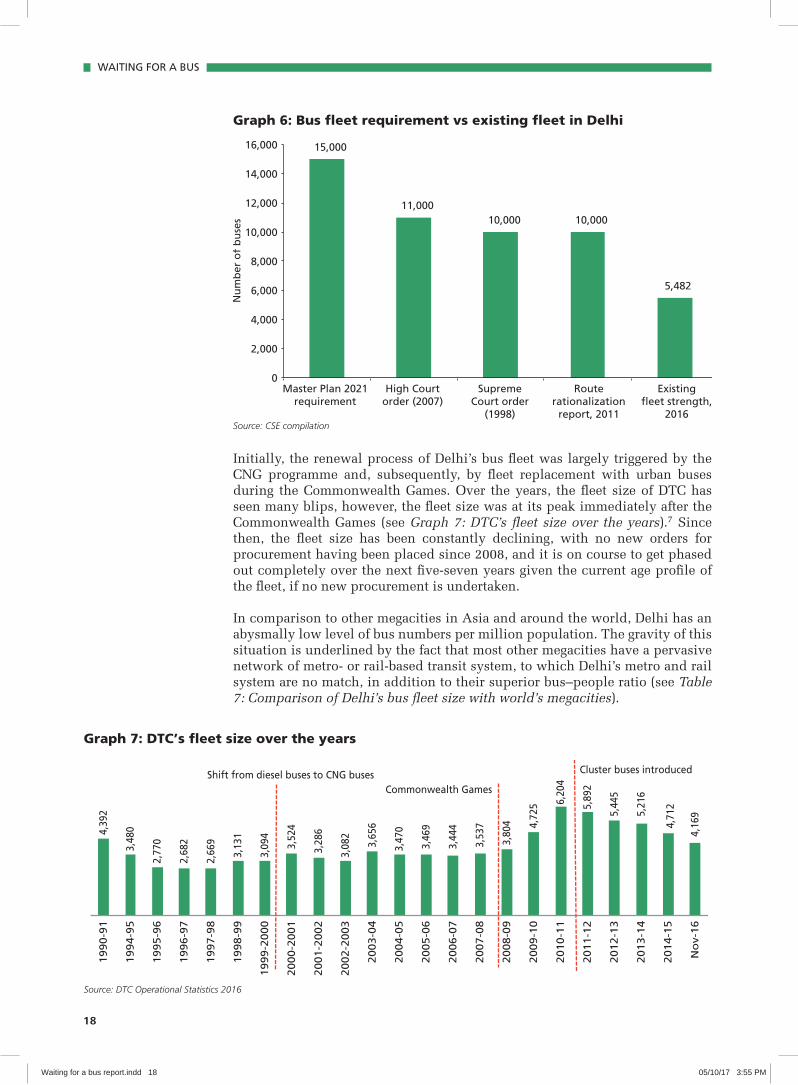
Inadequate bus fleetThe Supreme Court of India, while directing the shift to compressed natural gas (CNG) in Delhi in 1998, had ordered that the city should have 10,000 buses by 2001. GNCTD’s report on route rationalization of the city bus system as well as the Delhi High Court have set a target of 11,000 buses in 2007. Thus, based on various estimates, there is currently a shortfall of roughly 5,000–10,000 buses in Delhi (see Graph 6: Bus fleet requirement vs existing fleet in Delhi).
The existing bus fleet is well short of the target of 10,000 buses that had been recommended in 1998. It has less than half of what the city may need to have a public transport modal share of 80 per cent. The situation becomes graver if one factors in the age profile of existing buses, all of which will be off the roads in the next five–six years. With no order for procurement having been placed by DTC since 2008, this remains the foremost crises facing the corporation and the city’s bus system.
Year upon year of bad planning and equally poor execution within DTC has made scenes like this a common sight in Delhi
Waiting for a bus report.indd 17 05/10/17 3:55 PM
18
WAITING FOR A BUS
Graph 6: Bus fleet requirement vs existing fleet in Delhi
15,000
11,000
Nu
mb
er o
f b
use
s 10,000 10,000
5,482
0
2,000
4,000
6,000
8,000
10,000
12,000
14,000
16,000
Master Plan 2021 requirement
High Court order (2007)
Supreme Court order
(1998)
Route rationalization
report, 2011
Existing fleet strength,
2016
Initially, the renewal process of Delhi’s bus fleet was largely triggered by the CNG programme and, subsequently, by fleet replacement with urban buses during the Commonwealth Games. Over the years, the fleet size of DTC has seen many blips, however, the fleet size was at its peak immediately after the Commonwealth Games (see Graph 7: DTC’s fleet size over the years).7 Since then, the fleet size has been constantly declining, with no new orders for procurement having been placed since 2008, and it is on course to get phased out completely over the next five-seven years given the current age profile of the fleet, if no new procurement is undertaken.
In comparison to other megacities in Asia and around the world, Delhi has an abysmally low level of bus numbers per million population. The gravity of this situation is underlined by the fact that most other megacities have a pervasive network of metro- or rail-based transit system, to which Delhi’s metro and rail system are no match, in addition to their superior bus–people ratio (see Table 7: Comparison of Delhi’s bus fleet size with world’s megacities).
Graph 7: DTC’s fleet size over the years
4,39
2
3,48
0
2,77
0
2,68
2
2,66
9
3,13
1
3,09
4
3,52
4
3,28
6
3,08
2
3,65
6
3,47
0
3,46
9
3,44
4
3,53
7
3,80
4 4,72
5 6,20
4
5,89
2
5,44
5
5,21
6
4,71
2
4,16
9
1990-9
1
1994-9
5
1995-9
6
1996-9
7
1997-9
8
1998-9
9
1999-2
000
2000-2
001
2001-2
002
2002-2
003
2003-0
4
2004-0
5
2005-0
6
2006-0
7
2007-0
8
2008-0
9
2009-1
0
2010-1
1
2011-1
2
2012-1
3
2013-1
4
2014-1
5
No
v-16
Shift from diesel buses to CNG buses Commonwealth Games
Cluster buses introduced
Source: DTC Operational Statistics 2016
Source: CSE compilation
Waiting for a bus report.indd 18 05/10/17 3:55 PM

19
STRATEGIES TO IMPROVE DELHI’S BUS SYSTEM
Table 7: Comparison of Delhi’s bus fleet size with world’s megacitiesCities Metropolitan
population in million (2010)
Fleet (latest available)
No. of buses per million population
Total (mass rapid transit) rail length
(in 2013)
Beijing 20.2 24,347 1,205 456
Bangkok 8.3 7,525 909 50.9
London 8.3 9,300 1,120 436
Singapore 5.3 4,200 792 178
Hong Kong 7.1 10,177 1,433 218
Seoul 10.4 8,955 861 327
New York 8.3 5,800 699 373
Paris 2.2 4,000 1,783 818
Kuala Lumpur 1.6 849 534 208.1
Delhi 16.4 5482 333 190
Source: CSE compilation from multiple sources
How many buses do cities need? There are no uniform established criteria to decide this. There are different conventions. For allocation of buses under the Jawaharlal Nehru National Urban Renewable Mission (JNNURM) bus stimulus programme, government of India followed a norm of 40 buses per lakh population for cities with population of 0.5 to 4.00 million and 50 buses per lakh population for megacities with population of more than 4 million. Subsequently, Service Level Benchmarks (SLBs) adopted for buses by the erstwhile Ministry of Urban Development (now Ministry of Housing and Urban Affairs) considered 60 buses per lakh of population as appropriate. Delhi’s bus scrappage policy has fixed the operational life buses at 10 years or 7.5 lakh km.
In 2010, the Ministry of Finance and Asian Development Bank’s toolkit for public–private partnerships (PPP) in urban bus transport for the state of Maharashtra flagged off a set of criteria for deciding bus numbers for cities. According to this toolkit, a city needs about 60 buses per lakh population. This is followed as a benchmark for bus services widely—especially for PPP projects. But this norm is not expected to be followed in isolation. A range of other criteria, like average passenger trip length, capacity of buses, and average commercial speed of buses, needs to be linked to it. These numbers assume average waiting time of not less than 10 minutes to ensure reliability, and bus productivity to be at least 225–275 km, trip efficiency, km efficiency, punctuality with more than 95 per cent confidence, unreliability to be less than 5 per cent and so on. Thus, numbers are assessed in relation to a guaranteed overall system efficiency. Experts also point out that if a city has a wide network of bus rapid transit routes and is able to ensure reliable service with minimum waiting time and speed, then the number of buses needed can be reduced, thus reducing the capital expenditure as well.
Delhi will have to decide the numbers based on these range of criteria. But it is important to assess this properly to optimize capital investment. Delhi NCR will require special focus as it would need to develop a regional integral plan for bus transport.
Ageing fleet and bus renewalIt is important to put the existing fleet size in the context of the age of the fleet (see Table 8: Age profile of DTC’s buses). The average age of the fleet comes to
Waiting for a bus report.indd 19 05/10/17 3:55 PM

20
WAITING FOR A BUS
be around 6.2 years, which is not a healthy age; given that the scrapping age of buses in DTC is 10 years, most buses are past half their useful age. Under the cluster scheme, while the age distribution is not available, the age of all buses is less than five years.
Table 8: Age profile of DTC’s busesAge in years Number of buses Percentage distribution
0–2 1 0.02
2–4 32 0.73
4–6 3,093 71.07
6–8 657 15.10
8–10 6 0.14
10+ 563 12.94
Note: As on 31 March 2016
Source: DTC Operational Statistics, 2016
The fleet requires massive renewal and modernization to make buses attractive and comfortable for users. This will need huge investment. Delhi has already initiated a massive renewal process largely triggered by the CNG programme and the subsequent fleet expansion and modernization plan. Kolkata also started the process after the High Court ordered phasing out of old buses. Bengaluru and Mumbai and other cities are buying new buses as well.
System performance of DTCBus system is not only about the fleet size but also about operational efficiency, reliability and frequency. Several indicators are used to assess the service quality.
Service headwayAn investigation of overall scheduled dispatch times of buses on all routes of DTC and cluster scheme reveals very discouraging statistics. There is a shockingly low percentage of routes on which average headway of buses during peak hours (time interval between different buses starting from the depot that determines the frequency level) is less than five minutes, regardless of the definition of peak hours (see Table 9: Service headway of routes in peak hours—DTC and Table 10: Service headway of routes in peak hours—cluster scheme). Further, only between 8:30 a.m. and 10 a.m., around 25 per cent of routes in case of DTC and 41 per cent in case of cluster scheme have service headway of less than 15 minutes, which implies longer waiting time for buses. This is very discouraging. Further, in the absence of any passenger information system, such high headway times bring a high degree of unreliability to the system from a user’s perspective.
Table 9: Service headway of routes in peak hours—DTCPeak hour (different definitions)
Percentage of routes having average headway
of buses less than five minutes
Percentage of routes having average
headway of buses less than 10 minutes
Percentage of routes having average
headway of buses less than 15 minutes
7:30–10:30 a.m. 0.25 4.74 12.05
8:30–10:30 a.m. 0.25 8.49 19.07
8:30–10:00 a.m. 0.49 10.99 25.08
7:30–9:00 a.m. 0.74 7.49 18.04
8:00–9:00 a.m. 1.11 6.65 15.54
Source: CSE analysis based on data on DTC website
Waiting for a bus report.indd 20 05/10/17 3:55 PM

21
STRATEGIES TO IMPROVE DELHI’S BUS SYSTEM
Table 10: Service headway of routes in peak hours—cluster schemePeak hour (different definitions)
Percentage of routes having average headway
of buses less than five minutes
Percentage of routes having average
headway of buses less than 10 minutes
Percentage of routes having average
headway of buses less than 15 minutes
7:30–10:30 a.m. 0.53 6.78 21.94
8:30–10:30 a.m. 0.53 13.86 36.96
8:30–10:00 a.m. 1.07 16.31 41.04
7:30–9:00 a.m. 1.34 14.20 34.52
8:00–9:00 a.m. 1.34 9.57 27.27
Source: CSE analysis based on data on DIMTS website
Cancellation of schedulesDuring 2015–16, DTC operated a daily average of 85 per cent of its scheduled trips, which means that roughly 15 per cent, a significantly high percentage, of its scheduled trips were cancelled daily, plausibly due to unavailability of buses or crew (drivers and conductors). The total number of scheduled trips itself has come down by 15 per cent during the last two years (see Table 11: Cancellation of schedules—comparison of Delhi with other state transport undertakings.
Under the cluster scheme, during 2015–16, DIMTS operated 89 per cent of the scheduled trips per day. This implies that on an average about 11 per cent of the trips scheduled under the cluster scheme are cancelled every day.
Table 11: Cancellation of schedules—comparison of Delhi with other state transport undertakings
Cancellation of schedules
Bengaluru Delhi
8.4 DTC Cluster
19.7 11
Note: For 2014–15
Source: DTC Operational Statistics, 2016 and DIMTS Cluster Bus Operational Statistics, 2015–16
Fleet and vehicle utilizationDTC’s fleet utilization has also been going down over the past few years, having come down to 83.63 per cent in 2015–16, from 85.51 per cent in 2013–14. It is significantly lower compared to other cities like Bengaluru Metropolitan Transport Corporation (BMTC; 91 per cent) and Hyderabad (99 per cent). For a city with an already depleted fleet size, low fleet utilization makes matters worse in terms of service provision ability of the operator. In comparison, the fleet utilization of buses under the cluster scheme is 92 per cent (see Table 12: Fleet utilizations of DTC and other state transport undertakings).
Table 12: Fleet utilizations for Delhi and other state transport undertakings
Fleet utilization (per cent)
Mumbai Bengaluru Delhi Chennai
2014–15 2014–15 2015–16 2014–15
85.6 90.4DTC Cluster
84.284 92
Source: Review of the Performance of State Road Transport Undertakings (Passenger Services) for April 2013–March 2014,
MORTH Publication; DIMTS- Cluster Bus Operational Statistic, 2015–16; DTC Operational Statistics, 2016
Waiting for a bus report.indd 21 05/10/17 3:55 PM

22
WAITING FOR A BUS
Figures on vehicle utilization paint a similar picture, with DTC’s buses plying on an average 191 km per day while cluster scheme buses ply 215 km (see Table 13: Vehicle utilization for Delhi and other cities). Low vehicle utilization often results from low travel speeds due to traffic congestion and lack of priority to bus movement. However, the figures are higher for cities such as Bengaluru and Hyderabad, where vehicle utilization is respectively as high as 214.5 km and 240 per bus per day. For a city like Bengaluru, which witnesses higher levels of traffic congestion and slower travel speeds than Delhi, it is remarkable that vehicle utilization is almost 10 per cent higher than DTC (see Table 10: Vehicle utilization of DTC and other state transport undertakings).
Low vehicle utilization either increases the headway offered for any given fleet size or necessitates the requirement of a higher fleet size to serve a particular headway.
Table 13: Vehicle utilization of DTC and other state transport undertakings
Vehicle utilization (km/bus/day)
Mumbai Bengaluru Delhi Chennai
2014–15 2014–15 2015–16 2014–15
157.29 214.5DTC Cluster
254.27191 215
Source: Review of the Performance of State Road Transport Undertakings (Passenger Services) for April 2013–March 2014,
MORTH Publication; DIMTS- Cluster Bus Operational Statistic, 2015-16; DTC Operational Statistics, 2016
BreakdownThe number of breakdowns for DTC has increased from 3.95 incidents per 10,000 operated km in 2013–14 to 4.5 in 2015–16. Buses under the cluster scheme experience a much lower breakdown rate of 0.28 incidents per 10,000 operated km (see Table 14: Breakdown rate of DTC buses and other state transport undertakings).
Such a high breakdown rate means that on an average, roughly 330 buses of DTC are non-functional on any given day due to breakdowns. This resonates with the fleet utilization figures which indicate that roughly 700 buses are not operated daily for multiple reasons.
Table 14: Breakdown rate of DTC buses and other state transport undertakings
Breakdown/10 thousand km
Bengaluru Delhi Chennai
2014–15 2015–16 2014–15
0.06DTC Cluster
0.0014.5 0.28
Source: Review of the Performance of State Road Transport Undertakings (Passenger Services) for April 2013–March,
2014, MORTH Publication; DIMTS- Cluster Bus Operational Statistic, 2015–16; DTC Operational Statistics, 2016
Operating ratioDTC is operating at a very poor operating ratio of 0.21 (see Table 15: Operating ratio for DTC). However, if the component of interest on government loan is taken away from the expenditure (which corresponds to the capital expenditure), the operating ratio improves to 0.48, which remains a very poor operating ratio nevertheless. Bus operators are expected to have an operating ratio of at least one in order to break even their costs.
Waiting for a bus report.indd 22 05/10/17 3:55 PM

23
STRATEGIES TO IMPROVE DELHI’S BUS SYSTEM
With an operating ratio of 0.58 (including capital expenditure), however, buses under the cluster scheme offer better value for money compared to DTC, but are still worse off than Mumbai or Bengaluru (see Table 16: Operating ratio for DTC, cluster and other state transport undertakings).
Table 15: Operating ratio for DTCTotal earning
per km (in Rs)
Total cost per km including interest on Government
loan (in Rs.)
Total cost per km excluding
interest on Government loan (in Rs.)
Operating ratio (including interest in total
cost)
Operating ratio (excluding
interest in total cost)
38.62 177.51 79.97 0.21 0.48
Source: DIMTS—Cluster Bus Operational Statistic; DTC Operational Statistics
Table 16: Operating ratio for DTC, cluster and other state transport undertakings
City Total revenue/ km (Rs lakhs)Total cost/ km
(Rs lakhs)Operating ratio
Mumbai (2014-15) 61.87 96.59 0.64
Bengaluru (2014-15) 47.93 49.3 0.97
Chennai (2014-15) 39.16 45.4 0.86
Delhi DTC (2014–15) 38.62 177.5 0.22
Cluster (2015–16) 30.08 51.54 0.58
Source: Review of the Performance of State Road Transport Undertakings (Passenger Services) for April 2013–March 2014,
MORTH Publication; DIMTS- Cluster Bus Operational Statistic, 2015–16; DTC Operational Statistics, 2016
Waiting for a bus report.indd 23 05/10/17 3:55 PM

24
WAITING FOR A BUS
2: Factors impeding improvement in bus service
The muddle of bus procurementAlmost the entire fleet of DTC will get phased out by 2021, if there is no further procurement, and the current age cap continues (see Graph 8: Projected fleet size of DTC without any procurement). While the fleet size under the cluster scheme will grow in time (projected to be 2,500 by the end of 2017 and, ultimately, 5,500), it will not be adequate by itself, given the gradual decline of DTC’s fleet. Further, it is important to consider the wider consequences of having the entire bus system of a megacity like Delhi under just PPP operations.
It is also necessary to understand that the proposed allocation of 5,500 buses to the cluster scheme has been done to keep a 50:50 ratio of buses held by DTC and under the cluster scheme and to achieve the targeted fleet size of 11,000 buses. However, this figure was allocated at a time when DTC’s fleet was 5,500. Currently, it is roughly 3,800 (not counting fully-depreciated buses) and is constantly declining and will need regular annual procurement to even attain and maintain a figure of 5,500 buses (see Table 17: Annual bus procurement required by DTC to maintain a fleet size of 5,500).
Delhi’s bus system may be caught up in a policy traffic jam , but small adjustments and better planning can help cut the Gordian knot
Waiting for a bus report.indd 24 05/10/17 3:55 PM

25
STRATEGIES TO IMPROVE DELHI’S BUS SYSTEM
The issue of inadequate fleet size is further compounded by low vehicle utilization and a high rate of breakdowns. To put this into perspective, the total fleet not used by DTC on a daily basis is equivalent to the total fleet operated in many other medium-sized cities such as Jaipur.
Low fleet size invariably results in less buses being available for active duty, reducing the frequency at which the service operates. This has a cyclic effect. Lower frequency brings down the reliability of the system, particularly in the absence of any passenger information system. Decreasing reliability reduces the patronage for the system, as has happened in the case of DTC, whereby the number of passengers carried per bus per day has decreased in the past years. Decreasing ridership makes it even less viable to run buses which, in turn, negates the arguments for expanding fleet size.
Graph 8: Projected fleet size of DTC
4,352
3,789 3,783
3,126
33 1 0 0
500
1,000
1,500
2,000
2,500
3,000
3,500
4,000
4,500
5,000
2016 2017 2019 2021 2023 2025 2027
Prac�cally no bus le�
Note: Assumed lifetime of buses, as per DTC standards, is 12 years
Source: CSE analysis
Table 17: Annual bus procurement required by DTC to maintain a fleet size of 5,500
Year 2016 2017 2019 2021 2023 2025 2027
Current fleet 4,352 3,789 3,783 3,126 33 1 0
No. of buses to be procured 1,148 563 6 657 3,093 32 1
Required fleet 5,500 5,500 5,500 5,500 5,500 5,500 5,500
Source: CSE analysis
Barriers to bus procurement by DTCThe entire fleet of low-floor buses comprising more than 90 per cent of the current DTC fleet was acquired during the years 2007–08 to 2011–12 through multiple purchase orders placed during 2007–09 (see Table 18: Timeline of procurement of buses by DTC in recent years).
The buses plying the roads in Delhi under the cluster scheme have been procured since 2011 (see Table 19: Timeline of procurement of buses under cluster scheme).
Waiting for a bus report.indd 25 05/10/17 3:55 PM

26
WAITING FOR A BUS
Table 18: Timeline of procurement of buses by DTC in recent years
YearTotal buses procured
Low-floor AC buses procured
Low-floor non-AC buses procured
No. of buses retired
Net active fleet
2005–06 5 - 5 - 3,469
2006–07 1 - 1 26 3,444
2007–08 159 - 159 66 3,537
2008–09 498 25 473 232 3,804
2009–10 1,254 266 988 333 4,725
2010–11 1,839 959 880 360 6,204
2011–12 32 25 7 345 5,891
Source: 2016, DTC Operational Statistics
Table 19: Timeline of procurement of buses under the cluster scheme
Date No. of buses procured Total no. of buses
May 2011 Cluster system launched in Delhi
by November 2011 231 231
by December 2012 148 379
by September 2013 315 694
by April 2014 463 1,157
by January 2015 333 1,490
(2015–16) December 2016 203 1,693
Source: DIMTS Operational statistics; DIMTS Press Releases, 2015–16
Records show that while attempts have been made by DTC in the last five years to procure more buses, these efforts have either failed or been abandoned midway.
Procedural issues concerning purchase decisionsOne of the problems hindering the procurement of buses is the lack of a systematic fleet acquisition policy within DTC and the Delhi government. It is a standard procedure in other state transport undertakings (STUs) to conduct a fleet audit towards the end of any financial year and understand the depletion that is going to happen in the upcoming year due to buses that will be fully depreciated. Based on this assessment, a purchase requisition is made to the state government which in turn makes a budget provision to cater to the requisition. Adoption of such a policy and process can greatly help in solving the issue of bus fleet shortage of DTC.
Instead, DTC has an unusually protracted process for arriving at a decision to purchase buses. The decision is initiated at the level of GNCTD, rather than at the more reasonable level of DTC. Once, a decision to purchase buses has been taken by the cabinet in principle, DTC is asked to consider the techno-economic considerations related to the purchase and forward its recommendations, approved by its board, to the transport department. Thereafter, the transport department prepares a cabinet note based on which a cabinet committee takes
Waiting for a bus report.indd 26 05/10/17 3:55 PM

27
STRATEGIES TO IMPROVE DELHI’S BUS SYSTEM
a final decision to purchase buses. Once this decision has been arrived at, the responsibility is passed on to DTC’s procurement cell.
The essential problem with this process lies in the de facto absence of power with DTC to arrive at a decision to purchase buses and recommend the same to the Delhi Government. In the current scenario, DTC has to be dependent on the government to take stock of the situation and come up with a proposal to procure buses.
Dated routing systemThe route plan for the system has not been revised, apart from minor occasional alterations made over the years. In contrast, the mobility patterns of Delhi have changed in the last decade, particularly due to the growth of the metro rail in the city. Recommendations made by a study conducted by the Delhi government on rationalization of the city’s bus routes in 2011 have not been adopted either. By continuing to operate buses on older routes, the city’s bus system loses on multiple fronts. It does not cater to the mobility demand that has come up in recent times and, therefore, loses on potential ridership. It continues to ply on routes where the demand patterns may have changed and ends up with sub-optimal utilization of its fleet. Most importantly, given the small size of the fleet, the system loses even the opportunity to provide good service to those who need it within the constraints of the fleet size.
Archaic proceduresDTC still maintains many archaic processes in terms of operating procedures for scheduling and dispatch of buses and on-board crew, and accounting and management of information systems. For example, scheduling is done manually and bus schedules are seldom revised, leading to sub-optimal performance. Modernization of various processes is integral to improving the performance of any city bus system. Brihanmumbai Electric Supply and Transport Undertaking (BEST), Mumbai has managed to save 4–5 per cent operating costs through adoption of technology-based automated scheduling process.
Lack of adoption of technologyIntelligent Transportation System (ITS) refers to the integration of modern technology in various aspects of transportation systems to make them more efficient and user-friendly. For public transportation and, thus, bus systems, there are many avenues for the integration of ITS. Delhi’s bus services are lagging behind on most of these aspects.
Lack of automated fare collection systemCollection of fare inside buses using hand-held electronic ticket vending machines (ETVMs) is soon going to become the norm for city bus systems across the country and globally. Indeed, megacities (like London) across the developed world have moved on to smartcard-based ticketing, completely phasing out cash-based ticketing. However, paper-based tickets are still widely used in DTC buses, and ETVMs are only beginning to be introduced. The buses under the cluster scheme, however, use ETVMs for fare collection.
Paper-based ticketing has multiple disadvantages. It creates opportunities for fare revenue leakage. It increases transaction costs in terms of record-keeping post fare collection. It consumes more time per passenger for each instance of fare collection. It creates undue reliance on the discretion of ticket conductors as they have to ascertain the fare stages throughout the trip,
Waiting for a bus report.indd 27 05/10/17 3:55 PM
28
WAITING FOR A BUS
leading to the possibility of further losses in fare revenue. Lastly, and perhaps, most importantly, fare collection through paper-based tickets takes away the possibility of using the fare data to establish passenger travel patterns and use that to optimize the bus system.
All of these disadvantages manifest themselves in the city’s bus system. The share of tickets of the cheapest denomination (Rs 5) is reportedly higher than 50 per cent, which is grossly inconsistent with the city’s average trip length. Further, in the absence of any data on passenger travel patterns, optimization or rationalization of the system has also not taken place in years.
Delayed adoption of automated vehicle locationAutomated vehicle location systems using on-board GPS units offer an efficient way to centrally monitor bus movement, track incidents, and create back-end data for providing real-time estimated time of arrival (ETA) information to passengers, as well as create data that can be used for software-assisted real-time adjustments in fleet and crew scheduling. Here again, the system has faltered. While buses under the cluster scheme have on-board GPS units that help DIMTS to monitor their movement, DTC buses do not currently have such units, after an attempt to install them failed.
Lack of passenger information systemsPassenger information systems (PIS) comprise means to convey real-time passenger information to bus users through various portals, including LED boards inside buses and at bus stops, and through web and phone applications. It is necessary to have on-board GPS units to develop PIS, currently available only under the cluster scheme. Passengers care only about the overall bus system, so the lack of such systems in DTC undermines their presence in cluster buses as well.
Moreover, other information systems which could make a user’s experience better are also missing in Delhi. For example, Delhi has over 190 km of metro corridors running through the length and breadth of the city with over 150 stations which are, in most cases, not physically integrated with bus stops. Creating information maps at bus stops and metro stations indicating the pathway to all nearest bus stops from a metro station and vice versa can overcome the lack of physical integration, help create a multimodal transit system and increase ridership for both systems.
Staff training and managementRegular training of staff and provision of suitable performance incentives is crucial in optimizing performance. DTC lags behind in these aspects too. This is manifested in the fact that the in-house staff managing the buses is not trained adequately to maintain low-floor buses that have been procured by DTC in the last eight years. Therefore, DTC has to either rely on a bus manufacturer or a third party for the maintenance of buses. This is highly inefficient as a significant segment of DTC’s staff strength as well as space allocated to maintenance, such as dedicated workshops, remain under-utilized.
Institutional issuesOver the last ten years, the average tenure of a DTC chairman-cum-managing director (CMD) has been just over 13 months, with as many as nine CMDs passing through the office in that period. Three of them served for periods of six months or less. This high degree of instability at the top-most institutional level puts constraints on the organization’s ability to take a long-term view of the situation, and to plan and implement accordingly.
Waiting for a bus report.indd 28 05/10/17 3:55 PM

29
STRATEGIES TO IMPROVE DELHI’S BUS SYSTEM
The myth of insufficient parking for busesAs part of the ongoing PIL by M.C. Mehta and the related ruling by the Supreme Court regarding augmentation of public transport, GNCTD had argued that it cannot procure buses as there is no space to park more buses because DDA had failed to provide the requisite land for constructing depots. In a follow up to this issue, Environmental Pollution (Prevention and Control) Authority (EPCA), under instructions from the apex court, investigated the matter and submitted (see Annexure 1: Note submitted by EPCA to the Supreme Court after investigation on land requirement for depots) that GNCTD had sufficient land to provide parking for up to 2,000 buses—1,600 through available new parcels of land and the rest through optimal use of existing depot spaces.
Further, EPCA recommended a change in the provisions of the 2021 Master Plan for Delhi to allow multi-level bus parking to be permitted in depots where only bi-level parking is currently allowed. This will enable a depot having a space of five acres to park 315 buses against the current capacity of 180 buses. This recommendation has been accepted by DDA and the Master Plan has been amended to allow multi-level bus parking in depots. This further enables GNCTD to create parking space for a higher number of buses.
Maintenance issues hindering the procurement of buses There are three basic models for providing maintenance services for freshly procured buses:
In-house maintenanceThis is the most basic form where an operator has well-trained in-house staff along with the requisite infrastructure such as workshops that can undertake maintenance of the fleet. Adopting this process requires robust human resource processes in terms of training and capacity building to keep the staff competent and updated with the requirements of modern buses. BMTC is a classic example of this model of bus maintenance. DTC has not been able to adopt this model due to lack of training accorded to its maintenance staff, who were not equipped to handle Euro-IV engines with electronic transmissions, apart from the additional peculiarities of low-floor buses. New staff requirement, which might have addressed this issue, has also been absent.
ManufacturerThe second model involves asking the manufacturer to provide maintenance services and charge appropriately for it under an annual maintenance contract (AMC). This can seem intuitive as with the evolution of modern engine technologies, the manufacturers ought to be in the best position to provide maintenance too. However, DTC’s requirements with regard to maintenance commitments from the manufacturer have been so stringent as to dissuade them from bidding for supplying buses altogether. The contract clauses are not balanced and give depot managers overwhelming discretionary powers. Moreover, AMCs require a long-term commitment which manufacturers are not keen on due to uncertainty over input costs in the long run. Amongst the three options, this is the most costly.
Third-party maintenanceThis is a more evolved model that is widely being adopted by STUs across the board. Under this model, a third party (other than the STU and the manufacturer) is awarded the AMC. Buses being operated under the cluster scheme are currently maintained under this model. However, DTC has not explored this model so far.
Waiting for a bus report.indd 29 05/10/17 3:55 PM

30
WAITING FOR A BUS
Thus, it is clear that DTC’s insistence on procuring AMC services from the manufacturer, coupled with lack of in-house capability as well as indifference to the third-party-maintenance model is constraining the bus procurement process. However, positive steps have been taken in this regard recently. In the new tender that has been floated for 1,000 buses, the AMC requirement has been deleted.
Locking horns over the size a busA debate ensued in late 2016 over GNCTD’s proposal to purchase smaller buses (mini- and midi-buses) as an alternative to the standard-sized buses. The reason behind this proposal was the inability of bus manufacturers to supply big buses on a scale that fits Delhi’s requirement in a smaller timeframe as well as the high degree of penetration that smaller buses arguably offer in rural areas and unauthorized colonies of Delhi.
CSE examined this proposal in detail and made a series of recommendations in a representation to GNCTD (see Annexure 2: Examining the proposal to buy small buses for public transport services in Delhi).
Higher cost of operations of small busesIt is costlier to operate smaller buses—the cost is 60 per cent higher for minibuses and 32 per cent higher for midibuses. This is because of the increase in staffing cost per seat per km and the fact that staffing costs contribute more than 50 per cent of the total operating costs. Further, the difference between capital cost of midibuses and standard buses is only Rs 5 lakh.
No significant differences in supply of standard and smaller busesContrary to the general notion that the bus industry can supply small buses at a much higher pace than standard buses, a market survey conducted by CSE did not find any difference (see Tables 20–23: Supply timeline of buses for Ashok Leyland, Tata Motor, Swaraj Mazda and Force Motors). Only one manufacturer (Tata) can supply 300 buses per month in all the three categories (standard, midi- and mini- non-AC CNG buses) while Ashok Leyland can provide 100 buses per month in all three categories. Swaraj Mazda can supply only up to 50–70 buses per month in the mini–midi category. Force Motors can provide up to 3,000 buses per month only in the minibus category.
Possible areas for deploymentMidi-buses can be deployed on a case-by-case basis on routes with major road geometry constraints for a significant segment of the route and the passenger demand is not sufficient to deploy standard buses on policy headway (The maximum permissible headway as established by the transit agency or—often—the policy board, usually for off-peak, low-demand periods.) of 15 minutes. Deployment of minibuses should be avoided altogether.
Table 20: Supply timeline of buses for Ashok Leyland
Bus type Maximum possible monthly supply of buses
Mini Not available
Non-AC midi 100
Standard (900 mm floor height) 100
AC standard 50–100 (prototype is under development)
Source: Market survey by CSE
Waiting for a bus report.indd 30 05/10/17 3:55 PM

31
STRATEGIES TO IMPROVE DELHI’S BUS SYSTEM
Table 21: Supply timelines of buses for Tata Motors
Bus type Maximum possible monthly supply of buses
Mini–midi (non-AC) 300
Standard non-AC (900 mm floor height) 300
Standard (low floor) 200
AC standard200 (delivery will start six months after the order
has been placed as CNG model is not readily available)
Source: Market survey by CSE
Table 22: Supply timelines of buses for Swaraj MazdaBus type Maximum possible monthly supply of buses
Mini–midi (AC and non-AC) 50–70
Source: Market survey by CSE
Table 23: Supply timelines of buses for Force MotorsBus type Maximum possible monthly supply of buses
Mini 3,000
Source: Market survey by CSE
Waiting for a bus report.indd 31 05/10/17 3:55 PM

32
WAITING FOR A BUS
3: Addressing staggering costs and financing
Wide gap between cost and earningsThe crisis of the bus sector is showing up in the huge losses DTC is incurring. Overall, the total costs that the agency has to bear are humungous. Urgent internal rationalization and a well-thought out business and financial model is needed to reduce and make the cost bearable, affordable and to improve overall economic efficiency (see Graph 9: Gap between cost and earnings and Graph 10: Trend in net losses per km). Since 2005, the trend in net losses has fluctuated but with a steady increment.
DTC’s tyres are punctured by massive interest payments on the loans it has taken over the years. Easing this burden will help make it a fit mobile unit once more
Waiting for a bus report.indd 32 05/10/17 3:55 PM

33
STRATEGIES TO IMPROVE DELHI’S BUS SYSTEM
Graph 9: Gap between cost and earnings
31.45 48.03
67.18
115.14 97.69
79.96 67.93
83.06
112.78
138.89
0
20
40
60
80
100
120
140
160
180
200
2005-06 2006-07 2007-08 2008-09 2009-10 2010-11 2011-12 2012-13 2013-14 2014-15
Total income (per km)
Lakh
rupe
es p
er k
m
Total expenditure (per km)
Gap between cost and earnings
Source: DTC Operational Statistics, 2015 and 2016
Graph 10: Trend in net losses per km
33.82 46.48
66.32
92.28 97.64
79.91
65.00
82.43
43.06
101.53
0
20
40
60
80
100
120
2005-06 2006-07 2007-08 2008-09 2009-10 2010-11 2011-12 2012-13 2013-14 2014-15
Lakh
rupe
es p
er k
m
Source: DTC Operational Statistics, 2015 and 2016
Interest paymentsDue to excessively high loans and contributions taken from the Central and state governments over time, DTC has to make huge interest payments. To make these payments, it takes more loans that continue to inflate the interest burden. During 2012, the government of Delhi had suggested to DTC not to take any more loans but opt for direct transfers from it for its functioning. DTC has also requested interest waiver from the governments. Until recently, the Delhi government was providing the loans to DTC at rates as high as 10–14 per cent, while it provided loan to DMRC at a meagre 1–2 per cent. Now the government is buying buses upfront for DTC, thereby reducing DTC’s capital costs and hence removing any possibility which might lead to a loan requirement by DTC. Even then, the interest liabilities of DTC have compounded manifold over the years to the extent that today the interest debt of DTC forms half of its total expenditure. This situation does not let DTC recoup the losses it bears every year. By 2010–11, the interest liabilities of DTC were already more than its total working expenditure and operating costs (see Graph 11: Interest payment on government loans). DTC’s costs are spiked by the excessively high interest payments and personnel costs that constitute 70 per cent of its total expenditure.
DTC pays one of the highest amounts in interest rate among STUs (see Graph 12: Interest payments in different cities—2013–14 and 2014–15). Rapid bus renewal for CNG and, thereafter, the urban bus renewal for the Commonwealth
Waiting for a bus report.indd 33 05/10/17 3:55 PM

34
WAITING FOR A BUS
Games required borrowing and led to rapid increase in the interest burden. Most of this renewal has happened without any clear fiscal strategy to offset the costs.
Graph 11: Interest payment on government loans
18.52 30.82
45.56
68.79 61.06 57.45
47.34 57.69
77.58
97.54
0
20
40
60
80
100
120
2005
-06
2006
-07
2007
-08
2008
-09
2009
-10
2010
-11
2011
-12
2012
-13
2013
-14
2014
-15
In lakh rupees per km
Source: DTC Operational Statistics, 2015 and 2016
Graph 12: Interest payments in different cities—2013–14 and 2014–15
0
50,000
1,00,000
1,50,000
2,00,000
2,50,000
3,00,000
Del
hi
Mu
mb
ai
Ban
gal
ore
Ch
enn
ai
Ko
lkat
a
Ah
med
abad
Pun
e
Ch
and
igar
h
2013-14 2014-15
In lakh rupees
Source: DTC Operational Statistics, 2015 and 2016
Personnel costsPersonnel costs weigh down nearly all bus agencies. Internationally, the accepted number of staff per bus is five–six. In Indian bus companies, this number is as high as 10 or more. Enormous labour costs skews the balance sheet of these corporations. In November 2016, DTC had a staff of 28,816 to manage a fleet of 4,128 buses; but since only about 3,537 buses were usually on the road, the staff ratio was close to 6.98. One-third of DTC’s total expenditure is on staff salaries (see Graph 13: Trend in labour cost and material).
Waiting for a bus report.indd 34 05/10/17 3:55 PM

35
STRATEGIES TO IMPROVE DELHI’S BUS SYSTEM
Graph 13: Trend in labour and material cost
Per km (in lakh rupees)
Source: DTC Operational Statistics, 2015 and 2016
Burden of fuel costHigh fuel costs are yet another dimension of operational expenditure. Delhi has a comparatively lesser fuel cost than other bus transport undertakings, mainly due to the use of cheaper CNG. But the price of CNG has gone up three times in Delhi since 2002. Also, within a span of six years, the mileage of DTC buses has fallen from 2.88 to 2.63 km. This is mainly because of newer buses having engines with higher horse powers. This trend is consistent with what has been noted with diesel buses in other cities as well. Growing congestion and frequent start–stop movement on Delhi roads increases fuel consumption as well. The result is rising overall fuel costs (see Graph 14: Total fuel cost per km).
Graph 14: Total fuel cost per km
14.43 16 15.81 16.75 17.55
11.21 13.34
16.43 18.23 17.84
0 2 4 6 8
10 12 14 16 18 20
2005-06 2006-07 2007-08 2008-09 2009-10 2010-11 2011-12 2012-13 2013-14 2014-15
Lubricants CNG HSD- Petrol Total fuel cost
In lakh rupees
Source: DTC Operational Statistics 2015 and 2016
High operational lossesAs all input costs are increasing and operational efficiency is plummeting, the overall operational losses per km is high and increasing (see Graph 15: Operational losses per km).
17.55
22.76 26.72
40.08
45.49
33.49 31.04
34.38
41.27
46.27
8.05 9.15 10.19 10.46 10.87 14.11
16.73
Dat
a n
ot
avai
liab
le
23.74 24.01
0
5
10
15
20
25
30
35
40
45
50
2005-06 2006-07 2007-08 2008-09 2009-10 2010-11 2011-12 2012-13 2013-14 2014-15
Labour cost
Material cost (including fuel)
Waiting for a bus report.indd 35 05/10/17 3:55 PM

36
WAITING FOR A BUS
Graph 15: Operational losses per km
10.37 14.11
17.65
30.65 32.67
17.06 15.65
20.48
29.77
35.47
0
5
10
15
20
25
30
35
40
2005
-06
2006
-07
2007
-08
2008
-09
2009
-10
2010
-11
2011
-12
2012
-13
2013
-14
2014
-15
In lakh rupees per km
Source: DTC Operational Statistics, 2015 and 2016
Very high total cost per busThe overall economic burden of DTC is staggering and is the highest among all key state transport undertakings. The total cost of operating a bus is highest for DTC among all STUs (see Graph 16: Total cost per bus).
Graph 16: Total cost per bus
87.4
50.6
32.7
40.7
32.1
34.4
38.1
37.5
102.
6
55.5
34.9
42.1
29.7
37.4
41.9
42.0
0.0
20.0
40.0
60.0
80.0
100.0
120.0
Del
hi
Mu
mb
ai
Ban
gal
ore
Ch
enn
ai
Ko
lkat
a
Ah
med
abad
Pun
e
Ch
and
igar
h
2013-14 2014-15
In lakh rupees
Source: 2015, 2016, DTC Operational Statistics
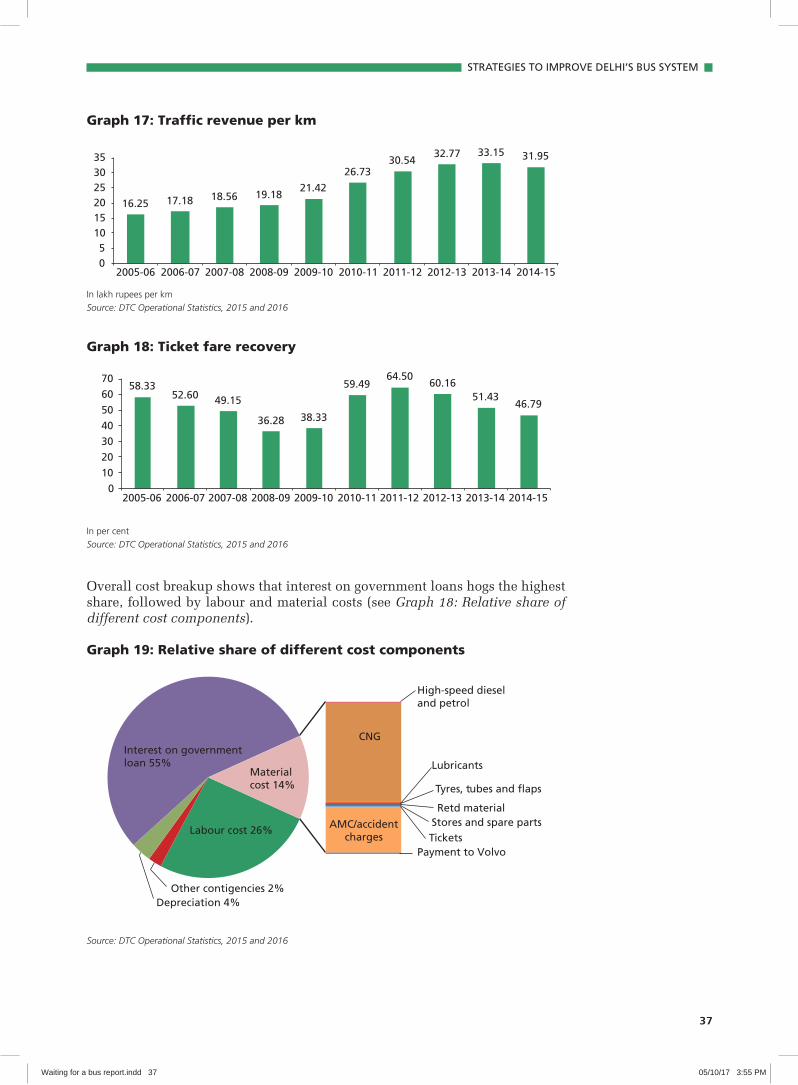
Heavy reliance on fare box without any alternative revenue baseFare box earnings constitute 85 per cent of DTC’s total earnings. Poor fare box collection and limited revenue from other sources is a major source of losses for DTC (see Graph 17: Traffic revenue per km and Graph 18: Ticket fare recovery). For a number of years, BMTC was hailed as a model for financial performance within STUs due to its high non-passenger revenues. While BMTC has also begun to incur moderate losses in the last few years, the model remains worth serious consideration for an organization like DTC having the corpus of valuable land bank in the capital.
The bigger worry for DTC is poor ticket fare recovery, which has been in the range of 36–64 per cent since 2005. During the years 2008–10, recovery was at the lowest, and it has only improved marginally since then.
Waiting for a bus report.indd 36 05/10/17 3:55 PM
37
STRATEGIES TO IMPROVE DELHI’S BUS SYSTEM
Graph 17: Traffic revenue per km
16.25 17.18 18.56 19.18 21.42
26.73 30.54
32.77 33.15 31.95
0 5
10 15 20 25 30 35
2005-06 2006-07 2007-08 2008-09 2009-10 2010-11 2011-12 2012-13 2013-14 2014-15
In lakh rupees per km
Source: DTC Operational Statistics, 2015 and 2016
Graph 18: Ticket fare recovery
58.33 52.60 49.15
36.28 38.33
59.49 64.50
60.16 51.43
46.79
010203040506070
2005-06 2006-07 2007-08 2008-09 2009-10 2010-11 2011-12 2012-13 2013-14 2014-15
In per cent
Source: DTC Operational Statistics, 2015 and 2016
Overall cost breakup shows that interest on government loans hogs the highest share, followed by labour and material costs (see Graph 18: Relative share of different cost components).
Graph 19: Relative share of different cost components
Labour cost 26%
Other contigencies 2% Depreciation 4%
Interest on governmentloan 55%
Material cost 14%
High-speed diesel and petrol
CNG
Lubricants
Tyres, tubes and flaps
Retd material Stores and spare parts Tickets
AMC/accident charges
Payment to Volvo
Source: DTC Operational Statistics, 2015 and 2016
Waiting for a bus report.indd 37 05/10/17 3:55 PM
38
WAITING FOR A BUS
Bus reforms to cost a lot of moneyIn addition to all the other economic burdens, bus sector reforms also burn a hole in DTC’s pocket. Recent estimates are unavailable, but if the 2009 estimate of about Rs 5,444 crore that the Department of Transport had submitted to the Unified Traffic and Transportation Infrastructure (Planning and Engineering) Centre (UTTIPEC) for the desired requirement for bus transport alone is any indication, bus reforms are a costly affair. The estimate included Rs 1,713 crore for 1,500 AC and non-AC low-floor buses (excluding 35 per cent assistance under JNNURM); Rs 660 crore for constructing depots, Rs 2,666 crore for depots for private operators, Rs 105 crore for improvement of bus terminals and construction of 15 new terminals, and Rs 50 crore for building a control room for monitoring private and DTC fleet.
This amount was much more than the total transport budget of Rs 3,348 crore of the Delhi government for the year 2011–12 (about 25 per cent of the total plan outlay). This means the investment requirement in the bus sector is 1.6 times the total transport department’s budget for one year.
Even bringing in private sector is not going to ease matters much for the Delhi government as the upfront capital investment for rapid purchase of buses to meet the target of 11,000 is so huge that it is jacking up the overall cost of investments, needing enormous gap financing. The private sector is expected to operate 50 per cent of the buses in Delhi. In the private cluster bus operations, while costs are as high as Rs 50–60 per km, the operating revenue is expected to be Rs 20–25 per km. In some clusters, this could be lowered a bit only after compromising on the requirement of low-floor buses that cost more and opting for semi low-floor buses. The gap between their income and expenditure will have to be filled by the Delhi government. This gap financing can snowball to Rs 600–1,000 crore annually. In addition to this, there are other demands on infrastructure for which the government will have to make provisions.
Aspects of bus funding
Bus fares and fare box collectionAs bus fares must stay within the affordable limit for a majority of urban residents, it is not desirable to recoup the cost of investments mainly from the fare box collection or increased fares. India has an additional challenge. Increase in bus fares can trigger immediate exodus to personal vehicles like two-wheelers. The operational cost of a two-wheeler is less than the minimum bus fares. Assuming approximately 40 passengers travelling in a bus and a rounded off figure of Rs 180 per km as operational cost (it is Rs 177.5 for Delhi). If this full operational cost were to be transferred to the bus user, they would need to pay around Rs 24 for a journey that they currently cover by paying Rs 5, as against Rs 2.5 which they will have to pay if they use their own two-wheeler. Cities, therefore, need to find ways to mobilize resources for bus fleet augmentation and operational reforms and also disincentivize personal transport. At the same time, bus fares must be kept at affordable levels.
Buses pay more taxes than carsIn Indian cities, buses are made to pay more taxes than cars. A 2002 World Bank study confirms that the total tax burden per vehicle km is 2.6 times higher for public transport buses than cars in India. This trend will have to be reversed to stimulate investment in the bus transport sector and also discourage usage of personal vehicles. Limited information available from the cities shows that as per the prevailing tax rates, cars and two-wheelers pay a miniscule amount as
Waiting for a bus report.indd 38 05/10/17 3:55 PM

39
STRATEGIES TO IMPROVE DELHI’S BUS SYSTEM
lifetime tax compared to the hefty annual taxes paid by buses. Bus operations are treated as a mere commercial enterprise and are made to pay heavy taxes. Cities impose motor vehicle tax on vehicles as road tax and road or passenger tax on buses. As per estimates, the lifetime taxes paid by a bus equal its cost.
In case of personal vehicles, these taxes are imposed on the vehicle at the time of purchase for the lifetime (15 years from the date of registration). In public transport buses, these taxes are calculated annually (or every three months, according to preference of the user) on the basis of the number of passengers carried. According to Road Transport Yearbook 2012–13, buses with seating capacity of more than 18 are supposed to pay a road tax of Rs 1, 915 plus Rs 280 per passenger per annum, while cars and two-wheelers have to pay a one-time tax on the basis of their vehicle cost (2–10 per cent).8 Currently, buses are actually penalized for carrying more passengers than cars. This will have to be reversed. Cars that occupy more road space but carry fewer passengers should be made to pay more. In Delhi, for instance, cars and two-wheelers pay a small life-time road tax, while public transport is taxed every year. According to pre-Goods and Services Tax Act (GST) tax rates, cars pay a tax of Rs 533 annually in Delhi, as compared to Rs 13,765 that buses pay. This needs to be corrected and reversed. Buses, which were already charged with a 26 per cent tax rate, including 12.62 per cent excise duty, have now been taken into the 28 per cent tax slab after the GST notification. The increased tax rate seems antagonistic to the government’s visions of expanding public transport to reduce air pollution. The structure of road tax remains unchanged under the GST regime.
Bus pay more tax than the Delhi metroDespite being a public transport service, buses are made to pay more taxes than the Delhi metro. The metro is exempted from many taxes. Buses have to pay tax according to the seating formula under the Central Motor Vehicle Act, which is 33 seated plus 20 standing. This is a major disincentive. Bus agencies pay property tax, excise, customs, road tax, VAT, motor vehicle tax, and advertisement tax, among others. If such tax obligations are reduced and waived off, it will certainly help in improving the overall economic efficiency of the operations.
While the DTC pays a lot of taxes both at the Central and the state level, DMRC enjoys a range of exemptions. DMRC enjoys subsidized rates of electricity, almost half of the commercial rates. The excess of tax exemptions of DMRC over DTC shows the project preferences of the concerned authorities. Substantial amount of DTC’s costs can be cut down if the corporation gets a tax break similar to DMRC. This percentage reduction in costs, although nominal in relative cost terms, is substantial in absolute amounts.
DTC has a narrower revenue base than DMRCA narrower revenue base undermines self-sustainability of DTC. The corporation has only two sources of revenue—fare box and advertisement revenue. Fare box, the major component, is witnessing a marginal increase as bus ridership first reduced by nearly 17 per cent over a decade, till 2007–08, and thereafter showed a marginal increase. Revenue from advertisement is still very limited. After the purchase of buses in 2010 for the Commonwealth Games, advertisement on buses was stopped for aesthetic reasons. But it has started again on a limited scale about three to four years ago. These are largely government advertisements. DTC has not been able to draw adequate number of vendors through tendering, due to its high ad space rates.
Waiting for a bus report.indd 39 05/10/17 3:55 PM
40
WAITING FOR A BUS
The metro can earn from fare box, feeder bus service, consultancy, advertisement, branding, real estate and commercial development, carbon credits etc. Unless other sources of revenue for DTC are explored and enhanced, reliance on government subsidies for recouping the net losses every year will continue to increase.
Funding scheme for metro system vs bus systemThe 12th Five Year Plan had proposed a detailed fund mobilization scheme for the capital-intensive metro system. This included about one-fifth of the projects envisaged on a PPP basis with 20 per cent viability gap funding each from the Central and state governments. For the remaining four-fifths of the projects, funding is envisaged as 20–30 per cent equity, subordinate debt or grant from the Central government, 20 per cent from state governments (or parastatals), 5 per cent from property development, 5 per cent from developmental agencies, and 50 per cent as loan from international and domestic financial institutions.9
But for the conventional bus system it had proposed that the Union government provide 20 per cent of the fund and the state government and the urban local bodies provide 80 per cent of the costs. Additionally, for bus rapid transit system, Union government and the state government were to share the cost equally. The basic premise here is that bus is a low-cost investment and both the state and national government can find the money to support it.
An important example where the Central government picked up the capital cost of the bus fleet renewal was under the stimulus package under the JNNURM. But it was a one-time grant and there was no medium- and long-term plan to design funding strategies for buses on a continuous basis. One lesson from the JNNURM is that the funding for the bus sector must also address financial, regulatory and operational preparedness at the city level. It has, therefore, become necessary to plan for a public transport funding strategy.
Waiting for a bus report.indd 40 05/10/17 3:55 PM
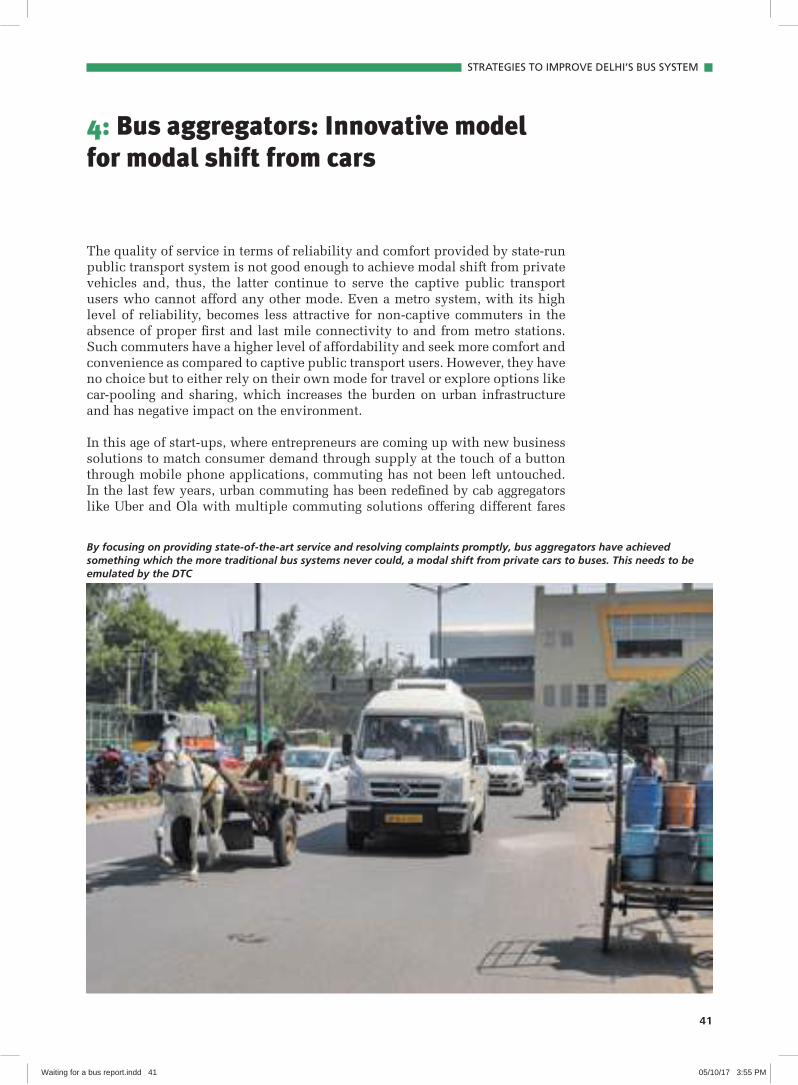
41
STRATEGIES TO IMPROVE DELHI’S BUS SYSTEM
4: Bus aggregators: Innovative model for modal shift from cars
The quality of service in terms of reliability and comfort provided by state-run public transport system is not good enough to achieve modal shift from private vehicles and, thus, the latter continue to serve the captive public transport users who cannot afford any other mode. Even a metro system, with its high level of reliability, becomes less attractive for non-captive commuters in the absence of proper first and last mile connectivity to and from metro stations. Such commuters have a higher level of affordability and seek more comfort and convenience as compared to captive public transport users. However, they have no choice but to either rely on their own mode for travel or explore options like car-pooling and sharing, which increases the burden on urban infrastructure and has negative impact on the environment.
In this age of start-ups, where entrepreneurs are coming up with new business solutions to match consumer demand through supply at the touch of a button through mobile phone applications, commuting has not been left untouched. In the last few years, urban commuting has been redefined by cab aggregators like Uber and Ola with multiple commuting solutions offering different fares
By focusing on providing state-of-the-art service and resolving complaints promptly, bus aggregators have achieved something which the more traditional bus systems never could, a modal shift from private cars to buses. This needs to be emulated by the DTC
Waiting for a bus report.indd 41 05/10/17 3:55 PM

42
WAITING FOR A BUS
Performance comparison of DTC and the cluster scheme
It is important to understand the performance characteristics of DTC and cluster scheme and proceed to address the
question of what model the GNCTD should adopt. It also builds up from the analysis of bus aggregators in this chapter
and outlines the possible role for bus aggregators within this matrix of state–PPP bus provision.
Prior to beginning a discussion on what model the GNCTD should adopt for bus operations in Delhi, it is useful to
compare the performance characteristics of DTC and the cluster scheme (see Table 24: Performance comparison of DTC
and the cluster scheme).
Table 24: Performance comparison of DTC and the cluster schemePerformance characteristic DTC Cluster scheme
Fleet utilization (per cent) 83.63 92
Vehicle utilization (km per bus per day) 191 215
Staffing ratio 7.05 6
Total operating cost per km (Rs) 79.97 51.54
Total traffic revenue per km (Rs) 31.21 30.08
Total passengers per bus per day 927 831
Trip efficiency (ratio of total operated to total scheduled trips daily)
0.85 0.89
Km efficiency (ratio of total operated to scheduled km daily) 0.83 0.88
Breakdown per 10,000 km 4.50 0.28
Source: DTC Operational Statistics, 2015, 2016
It is easy to see that the cluster scheme outperforms DTC in almost all parameters, except traffic revenue. However, a
slightly nuanced analysis is warranted here prior to jumping to conclusions.
Lower vehicle utilization for DTC can be attributed to the fact that DTC services, by virtue of being state-run, normally
render many public interest obligations in terms of catering to rural areas and unauthorized colonies in the city’s
periphery which the cluster scheme may avoid. Quite often, these areas have narrow and congested roads which can
reduce the overall speed of a bus significantly. If this effect is aggregated for all buses on a city scale, it can partly explain
the lower vehicle utilization of DTC buses.
The higher staff ratio can be a combination of the nature of the organization and the lack of bus procurement. DTC,
being a public agency, has staff on rolls that cannot be laid off in the event of their utility having ended. A case in point is
the ‘repair and maintenance’ category of DTC with over 3,300 permanent staffers who have been made redundant since
the procurement of the modern low-floor buses with electronic transmission which they are not technically equipped to
repair and maintain. But they continue to be in service and receive remuneration.
Labour costs are typically higher for any public agency due to additional set of compliance requirements related to
labour laws and wages which private agencies do not necessarily have to fulfil.
The higher occupancy of DTC buses (in terms of passengers per bus per day) can be possibly linked to the difference in
capacity of buses (DTC’s fleet is almost entirely composed of low-floor buses, while only standard buses run under the
cluster scheme.
These plausible justifications notwithstanding, it cannot be denied that the cluster scheme returns better value for
money. This argument seems stronger given the fact that the cluster scheme has been able to take many steps on which
DTC lags behind, such as integration of ITS in its operations (automated vehicle location, passenger information systems,
and automated fare collection).
Waiting for a bus report.indd 42 05/10/17 3:55 PM

43
STRATEGIES TO IMPROVE DELHI’S BUS SYSTEM
ranging from Rs 5–6 per km (for pooled services) to Rs 15 per km. A similar service has been introduced as aggregated bus services where point-to-point passenger demand is being combined and served by multiple bus operators through an aggregator. Such aggregators are basically information technology-based system integrators providing a mobile-based platform to users to book their trip and, thereafter, assigning that trip to en route buses. Such bus services, also conventionally known as ‘demand responsive bus services’, have received good response from commuters in Delhi NCR.
A study was conducted by CSE to understand the operational aspects of such demand responsive bus services and the extent to which these services have been successful at enabling a mode shift, if any, which is the prime indicator for benchmarking any public transport system. The following issues pertaining these services were studied:• Commuter perception of such bus services• Extent of threat to public sector-run bus systems in Delhi NCR by such
services• Legal and regulatory mechanism behind operation of such services
In the following section, the entire model of operations of such services has been explained. The subsequent section highlights the results from a user survey
conducted by CSE, followed by a discussion on the legal and regulatory issues surrounding the operation of such services. The final section concludes with comments on the role that such services can have in a city’s mobility system and the surrounding ecosystem required for optimizing their benefit to users and the city.
Stakeholders in service provisionThere are two primary stakeholders in such bus services: a) Aggregator(s)b) Bus operator(s).
The bus operator’s responsibility includes owning, operating and maintaining the buses and bearing all related expenses including but not limited to manpower. Procuring relevant permits from the transport department is also the responsibility of the operator.
On the other hand, the aggregator functions as an interface between passengers and operators and provides all related services (mostly IT-related) ranging from booking to boarding of the buses (including fare collection) and managing grievances. Demand responsive dynamic route planning and scheduling and IT-enabled monitoring (to ensure adherence to schedule) is also the responsibility of the aggregator (see Table 25: Distribution of responsibilities between the aggregator and operator).
Modus operandi
PassengersFor passengers, the mobile application (or app) offered by the aggregator is a one-stop shop for all their travel needs. To start with, a passenger searches and selects the route that matches best with her origin and destination and timing of the trip, after which she makes the booking by paying the requisite fare through the on-line mode (payment wallet). Upon making the payment, a payment
Waiting for a bus report.indd 43 05/10/17 3:55 PM

44
WAITING FOR A BUS
receipt is generated, bearing the trip details including the origin, destination, timing of bus at the location nearest to the passenger, vehicle number allocated to the passenger along with either a quick response (QR) code or customer identifi cation number (CIN) for on-board validation inside the bus. As all buses can be tracked in real-time, the passenger can make her decision regarding the time required for reaching the nearest pick up location without any hassle or anxiety. After boarding the bus, the driver validates the passenger through an on-board device using the QR code or CIN or mobile number (see Figure 1: Trip booking process for a bus aggregator). Thereafter, the passenger can continue her trip with a confi rmed seat. The buses are generally AC mini-midi buses with a seating capacity of 18–20 passengers.
Figure 1: Trip booking process for a bus aggregator
Table 25: Distribution of responsibilities between the aggregator and operator
Function or liability Aggregator Bus operator
Route permit and related expenditure √
Bus ownership and related expenditure √
Bus maintenance, fi tness and related expenditure √
Bus operation and related expenditure √
Fare collection √
Passenger grievance management √
Monitoring of operations √
Planning and scheduling √
Training of drivers (related to soft skills and using technology)
√
Parking of bus (overnight or lean hours) √
Source: CSE analysis
Validation of ticket
Boarding the bus
Walking to the nearest stop
Selection of origin
Selection of destination
Selection of route and
time
Online payment
Issuance of QR code
Source: CSE analysis
Waiting for a bus report.indd 44 05/10/17 3:55 PM

45
STRATEGIES TO IMPROVE DELHI’S BUS SYSTEM
For a passenger, the entire experience, starting from booking, locating the bus, validation and in-vehicle travel, is swift and convenient and matches up to the experience of a chauffeur-driven car. Passengers can also post their grievances or comments through the mobile application, customer care number, email or social media. The aggregator ensures that the concerns of passengers are answered and resolved within 24–48 hours. After completion of the journey, a passenger has to give a rating (1–5 stars) to the journey based on her overall experience.
OperatorsOperators can be individuals owning as well as driving the vehicle or only owning the vehicle and operating through a hired driver. The majority of operators are owner-cum-drivers, as it makes the operation economically more profitable and viable. Moreover, in order to avoid the monopoly of owners having multiple buses, the aggregator also restricts induction of operators having more than three-four buses. The aggregator defines the broad specifications and age of the bus which can be inducted or contracted by the operators. The contract period between the aggregator and operator may vary from one to three years and is extendable. In order to facilitate financing of the bus, the aggregator also provides a letter of intent and other requisite support to the operator.
The operators get paid in two ways:a) Fixed basic payment against the guaranteed km per day, week or monthb) A variable payment linked with performance against service level
parameters defined under the contract as well as the passenger rating.
Settlement of payment can be weekly, fortnightly or monthly. This payment mechanism ensures that the operators pay their dues against financing, operations and maintenance of the bus, and their (or their drivers’) wages regularly, at the same time providing an opportunity to earn more subject to overall performance under the variable payment system. Moreover, while the operators are bound to operate during weekdays under the contract with the aggregator, during the weekends they are free to operate the buses for any other purpose like tourist service, for events (as allowed under the permit conditions laid down in the Motor Vehicles Act), which provides additional revenue to the operator. In order to facilitate this, the aggregators themselves are now providing the facility of booking the buses during weekends for such purposes through the mobile application.
AggregatorThe role of the aggregator is to aggregate the trip demands generated by passengers and assign them to the buses being operated by various operators under its contract. The aggregator neither owns any buses or physical infrastructure, nor is bound by any regulatory provisions such as permits and insurance. Nevertheless, it provides the interface between the passengers and the operators.
The aggregator runs a high risk of revenue loss in case its customers are dissatisfied with its service. It knows that passengers are sensitive to the system’s reliability as well as the overall experience of the journey, and tries to ensure that both are satisfactory. Therefore, a service level agreement (SLA) is signed with the operators as part of the contract defining key performance indicators (KPIs) to be achieved by the operator. The performance of operators against these KPIs determines their variable payment and penalties. These KPIs are related to operation, bus quality, cleanliness, use of technology and driver
Waiting for a bus report.indd 45 05/10/17 3:55 PM

46
WAITING FOR A BUS
behaviour. Similarly, star rating given by the passengers and the number of complaints registered also makes an impact on variable payment and penalties. An aggregator ensures on-time dispatch of buses from the starting point and arrival at pre-defined stops at the stipulated time (with variations being within permissible limits), tracks any deviation in the route or stop, and ensures the validation of passengers on board. The monitoring functions are delivered by a GPS-enabled system in the control room of the aggregator. Cleanliness and maintenance of buses are monitored through random checks and feedback from passengers.
User surveyIn order to understand the profile, preferences and motivations of passengers using such bus services, an online user survey was conducted on a sample of 50 passengers from two leading bus aggregators in Delhi NCR. The responses received from passengers have been analysed and presented as follows.
Passenger profileA majority of the respondents (92.3 per cent) are in the 22–40 years age group (indicative of the typical tech-savvy service class) whereas the rest are more than 40 years of age. Around 80 per cent of the respondents are male and the rest female. Approximately 80 per cent respondents own a car while 20 per cent own at least a two-wheeler.
Trip lengthBased on origin and destination data provided by respondents, the average trip length has been found to be more than 15 km (with the maximum being as high as 35 km). This is primarily because most of the trips either start or end in the suburbs of Delhi NCR.
Upon being asked about their preferred previous mode of travel, approximately 42 per cent of the respondents said they used to travel by their own car, 31 per cent by the metro rail, 15 per cent by sharing a car with a colleague or friend, and 20 per cent by cab services like Ola and Uber (see Graph 20: Modal shift). Interestingly, none of the respondents stated that they were using a bus earlier, which indicates that aggregated bus services do not pose any threat to public bus service providers. However, a significant chunk of the users have migrated from the metro, primarily because of lack of last mile connectivity, overcrowding, and unavailability of seats, which makes longer trips in the metro tiresome and
Graph 20: Modal shift
Car (self-driven), 42.30%
Metro, 30.80%
Car sharing with colleagues/neighbour, 15.40%
Cab/taxi (Ola/Uber etc.), 11.50%
Source: CSE analysis
Waiting for a bus report.indd 46 05/10/17 3:55 PM

47
STRATEGIES TO IMPROVE DELHI’S BUS SYSTEM
unattractive. A majority of the users (67 per cent) have shifted from cars (self- or chauffeur-driven or cab), which shows that aggregated bus services successfully enable mode shift by offering a level of service equivalent to the car.
Travel costApproximately 46 per cent of the respondents stated that the travel cost of aggregated bus services is less than or equal to their previous mode of travel. These are respondents that mostly used cars to commute previously. The remaining 54 per cent (mostly metro users) responded that these services cost them more than their previous mode.
Reason for using the bus servicePassengers were asked to select multiple reasons amongst a list of choices that govern their decision to use the services offered by the bus aggregator. As many as 54 per cent respondents selected ‘no hassle of driving their own car’ while having the same level of comfort makes these services more attractive (see Graph 21: Reason for selecting the services). In NCR, where commuting between one suburb to other, a trip length between 15–35 km, can take anything between one–two hours during rush-hours, driving one’s own car can be physically as well as mentally tiring. For such passengers, the metro could be another reliable alternative but lack of first and last mile connectivity as well as overcrowding during peak hours makes the metro less attractive. This is corroborated by the fact that 42 per cent of the passengers responded that point-to-point connectivity makes aggregate buses an attractive proposition.
The time taken to commute and safety are not major criteria for passengers while selecting these services as against their previous or alternate modes of travel. Furthermore, only 27 per cent of the respondents stated that ‘less travel cost’ is a basis for selecting these bus services, which shows that these passengers do not mind paying more for a mode that provides them point-to-point connectivity with a level of service that matches or surpasses that of their private mode of travel.
Based on the above analysis of passenger profiles and their travel characteristics, it can be concluded that users of these services are ‘choice riders’ and not necessarily captive riders of public transport services (metro or DTC). The mode choice of such users is generally less sensitive to the cost of travel but more sensitive to the level of service offered by that mode.
Graph 21: Reason for selecting the services
19.20%
15.40%
11.50%
26.90%
42.30%
53.80%
23.10%
0 10 20 30 40 50 60
Others
Safety
Less travel time
Less travel cost
Point-to-point
No hassle of driving own vehicle
Confirmed availability of seat
Source: CSE analysis
Waiting for a bus report.indd 47 05/10/17 3:55 PM

48
WAITING FOR A BUS
Legal and regulatory mechanismIn this section, an attempt has been made to examine the legal aspects behind the operation of aggregated bus services. Under the Motor Vehicles Act, 1988, which regulates motor vehicles and all related functions in India, public service vehicles can be operated through two types of permit systems:a) Stage carriage permitb) Contract carriage permit
Both these classes of permits are intended to meet different requirements. A stage carriage (such as those operating under DTC and the cluster scheme) is intended to meet the requirements of the general commuting public with pick up and drop off of passengers taking place en route. Contract carriage permits are for those who want to hire vehicles collectively or individually for a group or party for their transport from one point to another point and the whole vehicle is at their disposal.
Operators under the aggregated bus service have obtained contract carriage permit which is defined by Section 7 of the Motor Vehicles Act as:• A motor vehicle which carries a passenger or passengers for hire or reward
and is engaged under a contract, whether expressed or implied, for the use of such vehicle as a whole for the carriage of passengers mentioned therein and entered into by a person with a holder of a permit in relation to such vehicle or any person authorized by him in his behalf on a fixed or agreed rate or sum (a) on a time basis, whether or not with reference to any route or distance; or (b) from one point to another, and in either case, without stopping to pick up or set down passengers not included in the contract anywhere during the journey
An attempt has been made to examine this definition from the perspective of Transport Department of GNCTD as well as bus aggregators and both versions have been explained as follows.
As per the discussion with the Delhi government’s transport department, a contract carriage is engaged for the whole of the journey between two points for carriage of a person or persons, and passengers en route cannot be picked up if they are not included in the contract, whereas aggregated bus services are allowing passengers boarding and alighting en route. Moreover, as per the definition, hire or reward should be under ‘a contract’ for the vehicle ‘as a whole’, while in this case, the passenger is allowed to book an individual seat, not the vehicle as a whole. Further, under the contract carriage permit, the list of passengers should be settled in advance before starting the journey but in this case passengers book a seat while the vehicle is en route. If these services are accepted under the current format, there would be no distinction between a stage carriage and contract carriage permit.
It is important to note that while the transport department has clarified its position on contract carriage permit and its existing conflict with aggregated bus services in operation, thousands of unorganized services like shared autos, grameen sewa and chartered buses having contract carriage permits have been operating since many years in Delhi NCR while picking up and dropping passengers en route and charging them for the distance (stages) they travel, which is no different than stage carriage services. Considering the above clarification on contract carriage permit, all these services should also be considered illegal but have been in operation without any hindrance.
Waiting for a bus report.indd 48 05/10/17 3:55 PM

49
STRATEGIES TO IMPROVE DELHI’S BUS SYSTEM
Aggregated bus service providers have their own position and interpretation of the contract carriage permit. They argue that they get into a contract with the operators (not passengers) for a vehicle as a whole. Moreover, passengers not mentioned in the booking list are not allowed to board the vehicle. Fare is charged from the passengers irrespective of the distance they travel unlike stage carriage permits.
If one goes by the version of bus aggregators, any operator having a contract carriage permit can get into a contract with any individual (relative or friend) and can operate the vehicle for picking up and dropping off passengers en route.
Taking into consideration both arguments, it is evident that the definition of contract carriage remains ambiguous and requires clarification.
Need of a framework for bus aggregators Without doubt, aggregated bus service have enable mode shift from private car users and provided them an alternate choice for commuting. Looking at the existing and anticipated urban congestion and the resultant pollution, such innovations should be encouraged.
Overall, operational processes of these services revolve around user satisfaction, which is a big lesson for public transport service providers. In most cases,
Are the aggregator buses plying under stage or contract carraige permits? The way this question is answered has several far-reaching ramifications on the legal status of this service. This and similar technical questions need to be ironed out for a smooth policy performance of this bus system
Waiting for a bus report.indd 49 05/10/17 3:55 PM

50
WAITING FOR A BUS
while financial and physical performance remains the prime concern of public transport service providers, user satisfaction through a structured feedback system remains an area of least priority for them.
Aggregated services are neither a threat nor a substitute for public bus services. Both have their own user base; while public bus services cater to passengers more sensitive to fare (affordability) as against comfort and reliability, aggregated services gives higher priority to comfort and reliability, and are meant for passengers willing to pay the higher fare. Both services can co-exist and help to deal with challenges of urban mobility.
Further, it is evident that the existing regulatory framework for these services is not very clear. At the same time, the importance of such innovations cannot be ignored. In this age of technology-assisted market interventions in public services, regulations need to keep pace so as to facilitate innovations without compromising the safety and interest of passengers. In order to safeguard passengers and integrate such services with the overall urban transport ecosystem, they should be brought under some contractual framework with the transport department (or any other nodal agency).
Is there a ‘right’ model for bus operation? Is it advisable to move completely to a PPP model of operation and abandon the long-standing state-run system and DTC? It is worthwhile to examine the three models that are at the disposal of GNCTD to reform its bus system.• DTC only: This has been the predominant model for bus operations for a
long time in Delhi. This model gives the state complete control over the spatial and temporal provision of bus services within the city, and thus allows it to ensure equitable distribution of what is essentially a public good within the city. Private operators, whether on a net or gross cost model, can shy away from providing services in areas or times where it is less profitable to them. However, the disadvantages of complete state control are the classic problems of monopoly combined with the issues with public sector undertakings in general in this country—operational inefficiencies and subsequent fiscal liabilities on the government.
• PPP only: The efficiency argument seems to warrant the transfer of bus provision entirely to private operators, arguably on a gross cost basis (such as the one that currently exists under the cluster scheme) so reasonable services can be assured in all areas and not just on those routes where it is profitable to run buses, a phenomenon invariably observed in net cost model. However, it must be remembered that for even a gross cost model, private operators can try to avoid operating on less profitable routes if the revenue model of the intermediary agency tasked with monitoring the operations is linked in turn to the profitability or revenue of the private operator (as in the case of DIMTS in Delhi). Furthermore, on a gross cost model, private operators would be reluctant to operate on routes having narrow roads, as is often the case in urban fringes, as it reduces their vehicle utilization and revenue. The final argument against full transfer of bus service provision to a private operator comes from the understanding the bus service is an essential or critical service for a city. Entrusting it entirely to the private sector carries the risk of a service blackout in case of a dispute between the contracting public agency and the operator.
• PPP and DTC: This is the model currently propounded by the Delhi government under which there is supposed to be a 50:50 ratio of service
Waiting for a bus report.indd 50 05/10/17 3:55 PM

51
STRATEGIES TO IMPROVE DELHI’S BUS SYSTEM
distribution between DTC and the cluster scheme. But this arrangement seems increasingly untenable in the absence of a procurement order for new buses since 2008. No clarification is available from the GNCTD or DTC on whether this arrangement is going to continue in the future, but the signs do not seem promising. The presence of private operators provides a frame of reference or benchmark to assess the public operator’s performance, and thus can help in improving DTC’s service over time.
• Role of bus aggregators: There is also the fourth model of bus aggregators who can provide services to ‘choice commuters’ while they continue to pull passengers out of their private cars and metro (thus clearing some space for captive metro ridership). They are not likely to pose a threat to the conventional state carriage bus services (considering significant difference in fare).
Waiting for a bus report.indd 51 05/10/17 3:55 PM

52
WAITING FOR A BUS
5: The way forward
Delhi needs a roadmap to set immediate milestones for reforms of DTC, as well as enable system integration of DTC and cluster scheme of DIMTS. This is urgently needed to arrest the slide in bus ridership and increase its share in trips made by people in Delhi.
Reform bus procurement policy: Procedures to this end must be laid down in the annual plan of DTC, cluster scheme and Delhi Government. This is needed to address bus deficit and maintain a desirable fleet size every year.
The existing bus service plan needs to be optimized: The route rationalization plan prepared by the Delhi government in 2011 may already be dated and out of sync with the mobility patterns that have evolved in the city in the past five years. The study needs to be updated, keeping in mind the future proposals of the Delhi metro rail system, and its recommendations must be implemented. This would, of course, also require fleet augmentation as the plan recommendations require a larger fleet size than the one currently existing in Delhi.
DTC needs to adopt ITS and bus passenger service: This is needed to modernize its internal processes of fleet and crew scheduling, and fleet monitoring as well as multiple user interfaces such as fare collection and passenger information. The fare collection system of DTC, in particular, needs to be paid urgent attention so as to reduce revenue pilferage. This can drastically improve the operating ratio of DTC.
The staff recruitment and incentive policy of DTC needs an overhaul: To optimize the performance of its staff and, thus, to improve its operational and financial performance, it is extremely important to design and implement a meticulous incentive policy for its staff.
Plan for bus parking: While the immediate problem of parking of buses that need to be procured has been addressed, a clear pathway needs to be adopted between Delhi government and Delhi Development Authority to allocate land for bus depots. The recently adopted change in development controls in the Master Plan allowing for multi-level parking of buses in depots should allow DTC and the Delhi government to optimize the usage of its existing depot spaces.
A system for benchmarking DTC’s services against other peer systems as well as the cluster scheme needs to be brought in, including a system for rating by passengers. This can not only provide targets for service improvement, but by linking them to the incentive policy, the motivation to improve the experience for the end user of the bus system can be permeated at the staff level.
A fiscal strategy for bus sector reforms is also needed: There is no single silver bullet to fix the funding strategy for buses. A wide variety of methods will have to be employed for optimal mobilization of resources. It is now quite clear that in large and old operations, public transport fares will have to be supported by other revenue streams. But a quick review of the revenue of the bus corporations shows other sources of revenue, including subsidy and reimbursements or non-traffic revenue like advertisement, commercial development have not been
Waiting for a bus report.indd 52 05/10/17 3:55 PM

53
STRATEGIES TO IMPROVE DELHI’S BUS SYSTEM
explored adequately. Bus agencies have done little to diversify their revenue base and continue to mostly depend on fare box collections. About 90–95 per cent of the earnings still come from fare box.
Improve collection efficiency of fare box: Bus fares cannot be increased beyond a point as that can make bus usage unaffordable for most commuters. That will also escalate shift towards two-wheelers that are cheaper to run. However, it is possible to improve the efficiency of collection of the fares, which is poor right now.
Rationalize and reduce the internal costs and tax burden: Allow DTC to be exempted from all the taxes from which DMRC is exempted. Subsidies to the metro work out to the extent of Rs 95 per passenger per day. This is a substantial amount in absolute amounts. Removal of dead weight taxes would create financial incentives to invest more in the sector. This is also important in order to achieve fiscal equity between DTC and DMRC.
Phase out interest payment: Interest payments constitute half of the current expenditure of DTC. A gradual phasing out of the DTC interest payments must be initiated as soon as possible. The interest burden which keeps compounding every year needs to be nullified. Calculations reveal that with 2030 as the target year, a transfer of fund to DTC or waiver of Rs 100 crore per annum by the government would be required for a complete phasing out of DTC interest debt. This would reduce the losses of DTC by 72 per cent as.
Personnel cost curtailment: Gradual reduction in staff and outsourcing can act as potential cost cutting measures for DTC. With around three-fourths of the losses recouped by merely cutting down on excess costs, the remaining one-fourth of the losses can be recovered by revenue reforms.
Administrative and operational reforms: Financial reforms, per se, would be inadequate and ineffective if not amalgamated with administrative and operational reforms. Time tables of plying of the buses will be accurate and successful only if there is a mechanism to control the lag or advancement of bus schedule. One way to achieve this can be the priority signaling mechanism and controlling the movement of buses from a central control room (like the one already in place at Kashmere Gate).
Rationalize the current budgetary allocation to the transportation sector: In Delhi, budgetary allocation to transport has increased over time and this sector today hogs close to a quarter of the budget. But the allocation to public transport has been declining. For the financial year 2017–18, a sum of Rs 5,506 crore has been earmarked for both transport sector infrastructure and public transport. But bus transport’s share in it is a mere Rs 100 crore, for the construction of bus depots and purchase of DTC buses—this is less than 2 per cent of the proposed transport sector spending. But, Delhi government will contribute Rs 1,156 crore to DMRC for metro in the same period.
Increase revenue from sources under bus corporations’ control: The bus corporations themselves can earn a lot of money from revenue streams that are under their control. The key ones include advertisement and commercial development in their depots and terminals. In fact, in other parts of the world, station naming in which people pay to get the bus stops named after their preference—is an important source of income. The potential of each of these strategies should be assessed and realized.
Waiting for a bus report.indd 53 05/10/17 3:55 PM

54
WAITING FOR A BUS
Advertisement revenue: All bus corporations have some space in their infrastructure and their buses to use for advertisement. This essentially involves advertisement as a wrapper on buses, inside buses, on bus stands, depots and terminals and so on. The potential of this has been amply proven by the BMTC. Even the cluster scheme is Delhi uses its buses to advertise. DTC should certainly look at similar opportunities. At present, advertisement exists only on bus shelters where the revenue is equally shared between the DTC and MCD. Buses should be added to the cohort of advertising as well, wherein the entire revenue would accrue to DTC only.
Commercial development model of bus depots: It may be noted that recently, in view of the crunch for parking space for buses, the Delhi Master plan 2021 has been amended to provide for multi-level parking for buses in DTC depots in Delhi. However, at this stage there is to proposal to have a commercial components at these depots, as is being practiced in other global cities as well as in Bengaluru. The rent from these commercial establishments could go to dedicated revenue stream of DTC. BMTC is known to have adopted such a strategy, developing the Traffic and Transit Management Centers on a PPP basis.
Urban transport fund
Karnataka (state-level) and Bengaluru and Mysuru (city-level)
The government of Karnataka approved the creation of such a fund for the cities of Bengaluru and Mysuru in 2010. The
urban transport fund (UTF) was originally created with an amount of Rs 10 crore; Rs 5 crore were sanctioned from the state
finance corporation (SFC) allocations. The government of Karnataka also approved the setting up of a state-level urban
transport fund (SUTF) and sanctioned Rs 10 crore for it. The Directorate of Urban Land Transport (DULT) is the secretariat
to administer these funds.
This fund laid down a few conditions. DULT, in consultation with other stakeholders such as Bruhut Bengaluru Mahanagar
Palika, Bengaluru Development Authority, Mysuru … UDA, and Mysuru.. CC had to work to find channels for pumping
funds into the UTF. The fund was to be used for the improvement of public transport, non-motorized transport, pedestrian
facilities, parking infrastructure, etc. To start with, DULT would formulate modalities for funding SUTF through three
sources: Cess on motor vehicle tax, cess on taxes collected by urban local bodies (ULBs), and an annual amount of Rs 20
crores which would be granted from SFC grants. In case of other projects, 50 per cent of the expenditure was to be borne
out of UTF and 50 per cent by stakeholders. For the traffic engineering cell, 50 per cent of the cost was to be borne out of
UTF. The stakeholders (ULBs, urban development funds, public transport undertakings etc.) were to together contribute
the remaining 50 per cent. The funds were to be released in three instalments; the stakeholders were required to submit a
utilization certificate and progress reports in the prescribed format to DULT.
Rajasthan
Rajasthan Transport Infrastructure Development Fund (RTIDF) was created to improve the transport infrastructure in the
state. The government of Rajasthan, and Jaipur and Jodhpur development organizations are expected to manage this fund.
Among other things, this was supposed to be a viability gap fund. For the initial package, it has been decided that financial
assistance worth Rs 10 crore would be given to Rajasthan State Road Transport Corporation, Jaipur City Transport Services
Ltd, and Ajmer City Transport Services Ltd to recoup their operational losses. A range of revenue heads were identified
for the RTIDF. These include revenue from an additional tax of 10 per cent on the one-time conventional Rajasthan state
motor vehicle tax and of 5 per cent on other taxes, revenue from green tax on old and new vehicles, revenue from
additional stamp duty, donations or contributions from the accumulated fund of the Rajasthan government, revenue from
government agencies and NGOs, CSR revenue from industries, and other sources to be identified in due course of time.
The local self-governing transport bodies are responsible for the implementation and regulation of RTIDF. These bodies are
authorized to spend 75 per cent of the funds from local self-government and 25 per cent from the transport department.
Waiting for a bus report.indd 54 05/10/17 3:55 PM

55
STRATEGIES TO IMPROVE DELHI’S BUS SYSTEM
Mandate for public transport fund: It is important to note that bus transport is largely funded by the taxpayers of the city, which is different from the funding strategy of the metro rail that taps into the national revenue stream and other financing sources. It is, therefore, important to mobilize resources within the city to generate additional dedicated funds for the bus system. Earlier, the JNNURM reform agenda had included in its reform list a dedicated urban transport fund. It is essentially based on the principle that a wide gamut of transport-related revenue sources that already exist in the city including parking and advertisement revenue, motor vehicle taxation, and earnings from other commercial development in the transportation infrastructure like the terminals and bus stands should be tapped to create a dedicated fund. This will ensure a steady annual flow of funds to take care of the costs of reforms. To this a fraction of the property taxes from land uses that will benefit from the up-scaled public transport system can also be added. Some states like Karnataka and Rajasthan have created such fund (see Box: Urban transport fund). Several global cities are also practicing fiscal strategies to fund public transport (see Box: What are other countries doing?).
An opportunity that has recently emerged in Delhi is the dedicated fund that has been created by the transport department from the environment compensation charge that has been imposed on each truck entry into the city. The Supreme Court, in its directive of 9 October 2015 has ordered that this fund be spent in improving public transport and walking infrastructure. This needs to be leveraged and expanded. The fund should be further developed by tapping into more revenue streams with a clear protocol on spending.
Waiting for a bus report.indd 55 05/10/17 3:55 PM
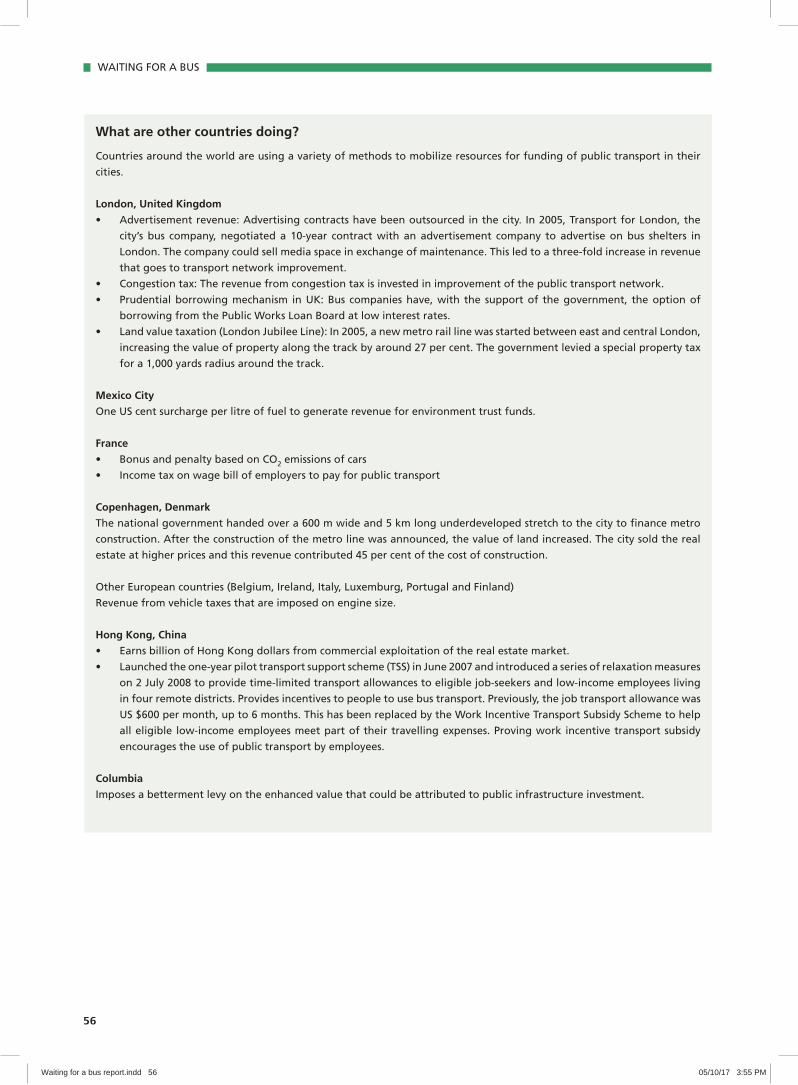
56
WAITING FOR A BUS
What are other countries doing?
Countries around the world are using a variety of methods to mobilize resources for funding of public transport in their
cities.
London, United Kingdom
• Advertisement revenue: Advertising contracts have been outsourced in the city. In 2005, Transport for London, the
city’s bus company, negotiated a 10-year contract with an advertisement company to advertise on bus shelters in
London. The company could sell media space in exchange of maintenance. This led to a three-fold increase in revenue
that goes to transport network improvement.
• Congestion tax: The revenue from congestion tax is invested in improvement of the public transport network.
• Prudential borrowing mechanism in UK: Bus companies have, with the support of the government, the option of
borrowing from the Public Works Loan Board at low interest rates.
• Land value taxation (London Jubilee Line): In 2005, a new metro rail line was started between east and central London,
increasing the value of property along the track by around 27 per cent. The government levied a special property tax
for a 1,000 yards radius around the track.
Mexico City
One US cent surcharge per litre of fuel to generate revenue for environment trust funds.
France
• Bonus and penalty based on CO2 emissions of cars
• Income tax on wage bill of employers to pay for public transport
Copenhagen, Denmark
The national government handed over a 600 m wide and 5 km long underdeveloped stretch to the city to finance metro
construction. After the construction of the metro line was announced, the value of land increased. The city sold the real
estate at higher prices and this revenue contributed 45 per cent of the cost of construction.
Other European countries (Belgium, Ireland, Italy, Luxemburg, Portugal and Finland)
Revenue from vehicle taxes that are imposed on engine size.
Hong Kong, China
• Earns billion of Hong Kong dollars from commercial exploitation of the real estate market.
• Launched the one-year pilot transport support scheme (TSS) in June 2007 and introduced a series of relaxation measures
on 2 July 2008 to provide time-limited transport allowances to eligible job-seekers and low-income employees living
in four remote districts. Provides incentives to people to use bus transport. Previously, the job transport allowance was
US $600 per month, up to 6 months. This has been replaced by the Work Incentive Transport Subsidy Scheme to help
all eligible low-income employees meet part of their travelling expenses. Proving work incentive transport subsidy
encourages the use of public transport by employees.
Columbia
Imposes a betterment levy on the enhanced value that could be attributed to public infrastructure investment.
Waiting for a bus report.indd 56 05/10/17 3:55 PM

57
STRATEGIES TO IMPROVE DELHI’S BUS SYSTEM
References
1. Anon, 2016. Committee on Delhi Traffic Decongestion says no to more flyovers, gated
communities. Press Information Bureau, Ministry of Housing and Urban Affairs. Available at
http://pib.nic.in/newsite/PrintRelease.aspx?relid=145979, as accessed on 12 September 2017
2. Anon, 2011. Rationalization of Bus Routes in Delhi, Department of Transport, GNCTD, New Delhi
3. B. Sudhakara Reddy and P. Balachandra, 2010. Dynamics of Urban Mobility: A Comparative analysis of megacities of India, Indira Gandhi Institute of Development Research, Mumbai. Available at http://www.igidr.ac.in/pdf/publication/WP-2010-023.pdf, as accessed on 12 September 2017
4. Anon, 2010. Master Plan for Delhi- 2021 (modified upto 31 March 2017), Delhi Development Authority, New Delhi, Available at https://dda.org.in/tendernotices_docs/may1/MPD-2021_31.03.2003041717.pdf, as accessed on 12 September 2017
5. Anon, 2010. Transport Demand Forecast Study and Development of an Integrated Road cum Multi-Modal Public Transport Network for Modal Public Transport Network for NCT of Delhi, Transport Department, GNCTD, RITES in association with MVA Asia Ltd. and TERI, New Delhi, Available at http://delhi.gov.in/wps/wcm/, as accessed on 12 September 2017
6. Anon, 2006. City Development Plan- Delhi (JNNURM), Department of Urban Development, Government of Delhi and IL&FS Ecosmart Limited, New Delhi, Available at http://jnnurm.nic.in/wp-content/uploads/2010/12/CDP_Delhi.pdf, as accessed on 12 September 2017
7. Anon, 2016. Delhi statistical handbook, Directorate of Economics & Statistics, GNCTD, New Delhi, Available at http://www.delhi.gov.in/wps/wcm/connect/ab, as accessed on 12 September 2017
8. Anon, 2015. Operational Statistics- February, 2015, DTC, New Delhi
9. Anon, 2015. Road transport yearbook (2012-13), Ministry of Road Transport and Highways, New Delhi
10. Anon. Recommendations of Working Group on Urban Transport for 12th Five Year Plan, Planning commission, government of India. Available at http://planningcommission.gov.in/aboutus/committee/wrkgrp12/hud/wg_%20urban%20Transport.pdf as accessed on 28 September 2017
Waiting for a bus report.indd 57 05/10/17 3:55 PM

58
WAITING FOR A BUS
Annexures
ANNEXURE 1Note submitted by EPCA to the Supreme Court after investigation on land
requirement for depots
Land requirement for depots for augmentation of bus fleet in NCT
Environment Pollution (Prevention & Control) Authority for Delhi and NCR17 May 2016
Delhi needs to augment its fleet of buses for public transport. In its July 1998 order, the Supreme Court had directed the city government to augment its fleet from 5,000 to 10,000 by April 2001. In the ongoing hearing on air pollution in Delhi (5 January 2016), the Amicus had informed the court about urgent need to augment public transport and asked for directions to be issued to the Delhi government to comply on this matter. The Delhi government informed the Supreme Court that it is unable to add to its fleet of buses because of the lack of land for parking the buses and requested for intervention to direct DDA, which reports to the Union government to provide the land expeditiously. In the hearing on 16 February 2016, the matter was discussed again and the Union government submitted that while 7 new land sites for bus depots had been handed over, it was their contention that bus parking areas remained unutilized. The Supreme Court requested EPCA to examine the matter and to make recommendations regarding providing of any further space for parking of buses.
EPCA has since then reviewed the current bus depot land availability and also what is required in future so that this impediment for public transport augmentation is removed.
Assessment of DTC and cluster bus fleet and bus depot land availabilityDTC is operating its fleet of buses from 43 depots with a total area of 249 acres, which also includes Millennium Depot of 46 acres. Considering the recent of order of the honorable court, according to which DTC has been asked to relocate the buses from Millennium Depot within one year, DTC will have 203 acres to park its 4,338 buses.
It is estimated that a bus depot of five acres can house 120 buses (including workshop). In this way DTC can park 4,872 buses on the depot land available with them. Therefore, DTC can park 534 buses in addition, on the available land.
In addition, a total of 2,432 buses have been contracted out under cluster scheme out of which 1,490 buses are under operation
These buses operate from nine depots having a total area of 59 acres, which also includes 120 buses parked in the Millennium Depot with five acres. Considering the said court’s order, 54 acres of land will be available for cluster operation.
Therefore, the total bus depot land available is 257 acres in the city.
Waiting for a bus report.indd 58 05/10/17 3:55 PM

59
STRATEGIES TO IMPROVE DELHI’S BUS SYSTEM
If this bus fleet has to be augmented, then the additional land requirement for a fleet of 11,000 buses is 202 acres and for a fleet of 16,000 buses it is 409 acres.
Additional bus depot land available with Delhi governmentThe Delhi government has given EPCA details of the areas that are currently under their possession for constructing bus depots (see Table: Land available with Delhi government for construction of bus depots).
As per this information, a total of 68 acres is available with Delhi government, where they are currently constructing bus depots. This land can be used to park 1,600 buses.
Table: Land available with Delhi government for construction of bus depots
Depot landArea in acres
Date by which the depot was to be constructed
Completion date
Rewla Khanpur 4 30 June 2016 1 November 2016
Karkari Nahar 5 30 June 2016 1 November 2016
Bawana-1 3.75 30 June 2016 14 February 2017
Dwarka (Two pieces of land) 10 30 December 2016 31 August 2017
Dichwakala 5 30 June 2016 17 November 2016
Rani Khera-I Rohini Phase-V 6.67 30 September 2016 28 February 2017
Rani Khera-II Rohini Phse-V 6 7 October 2016 10 March 2017
Rani Khera-III 6 14 October 2016 17 March 2017
BBM Depot-II 2.72 03 May 2017
Narela 10 Being considered for developing as multi-level depots
East Vinod Nagar 4.8
Bawana Sector-5 4
Total 68 1,600 additional buses can be brought in
In addition, approximately 47.5 acres of land across four pockets (see Table: Land handed over by DDA for bus depots but under litigation) have been allotted by DDA to Transport Department but the possession of these lands could not be given because of litigation issues. As per the discussion with DDA, land pocket at Karkari More (16 acres) will only available. Officials of transport department, DDA and EPCA conducted a joint inspection on 8 March 2016 to check if the land in Karkari More could be available. Based on site visit and discussion with the occupants, the inspection team came to know that said land pocket is under litigation and encroachment. DDA cannot construct an access road because the approach area is used as a cremation ground. Based on this EPCA agreed that these land areas are unsuitable for bus depots and requested DDA to examine new parcels of land.
Waiting for a bus report.indd 59 05/10/17 3:55 PM

60
WAITING FOR A BUS
Table: Land handed over by DDA for bus depots but under litigationLocation Area in sq m Allotted date Remarks
Vasant Kunj 38,900 19 January 2011 Land is in litigation by private party
Rohini Sector-37
49,000 19 March 2012 The matter is under litigation between DDA and private party
Karkari More 64,260 12 February 2015 Land has encroachment, slums and litigation issues. Also the approach road is not enough
Rohini Sector-32Phase-IV
40,000 22 January 2015 Possession could not be made by DDA
The Delhi government has identified potential pockets of land adding up to 55.9 acres. This has been submitted to DDA by EPCA to check if these lands are available and if they can be transferred for building bus depots.
Table: Additional land identified for bus depot by Delhi governmentZone Name of village or place Location Approximate area
(in acre)
Rohini Shahbad Daulatpur Khasra no. 222–229 7
Southeast Saidulajaib -- 9.5
Southeast Maiden Garhi Khasra no. 199–213, 272–280,485–489
20
Southwest Mehrauli Khasra no. 74,077 8.6
Southwest Mahipalpur Khasra no. 924–926 2.2
West Bamnoil Two plots on opposite sides of the road
8.6
Total 55.9
Table: Current and future requirement for bus depot land
Particulars Scenario-1 Scenario-2
Numerical strength of the fleet required in Delhi 11,000 16,000
Distribution ratio between DTC and cluster
DTC Cluster DTC Cluster
5,500 5,500 8,000 8,000
Total land requirement in acres 230 230 335 335
Existing area under depot in acres (excluding 46 acres of Millennium Depot)
203 54 203 54
Total land requirement in acres 202 409
Area of land in 12 other land pockets available for depot (in acres)
68 68
Additional land requirement 134 341
Strategies to optimize on current land EPCA has also reviewed possible strategies to optimize on land that is already available. The following options were explored and discussed with officials of the Delhi Transport Department and DDA.
Waiting for a bus report.indd 60 05/10/17 3:55 PM

61
STRATEGIES TO IMPROVE DELHI’S BUS SYSTEM
a. To use the existing bus terminal lands: Unlike bus depots, these are lands where overnight parking does not happen but only temporary parking. EPCA has done an exhaustive study to identify the terminal lands that are in the vicinity of existing depots so that with the additional provision of security, buses can be parked overnight. As these lands are in the vicinity of the depot a schedule can be drawn up to service buses periodically, which are then parked in the depot workshop.
DTC has approximately 28.30 acres (net of built up area) of land pockets under terminals, (which needs to be used for parking during night.
b. Multilevel parking in depot land: The bus parking can be optimized greatly by constructing multilevel depots. It will optimize the use of land and reduce the dependency on identification of new land pockets for future fleet expansion. Moreover new land pockets will be located outside city limits, which results in high dead mileage, which can be avoided in case of multi-level depot land located within city limits.
In a conventional bus depot of 5 acre 120 buses can be parked. The MPD 2021 provides for bi-level bus parking depots (basement and ground), which would be able to park 180 buses in the same 5 acre land.
However, construction of multilevel bus depots will increase bus parking substantially.. In the multilevel parking, bus parking and depot operations are allowed on ground, first and second floor and roof of second floor. This can park up to 315 buses in 5 acres of land and will take up only 64 sq metre per bus, against conventional ground parking of 169 sq metres/bus (see table below).
Table: Land requirement for parking of buses
ParticularsBase Case (only Ground Level)
Bi-level Multi-level (G+2)
Land area in acres 5 5 5
Land area in sq m 20,234 20,234 20,234
Total buses that can be parked 120 180 315
Area per bus in sq m 169 112 64
EPCA has also assessed the cost implications of conventional, bi- and multi-level parking depots.
The cost of a multilevel depot is higher than conventional on ground bus depot, but it is lower than bi-level depots. When the cost of land taken at Rs 4.75 crore per acre, which is lower than market price but is based on the transfer rate of DDA is taken into account, then the comparison is rationalized—Rs 38.8 crore for conventional depot of 5 acres, as against 94.4 crore for a multi-level depot.
But this cost estimation changes completely, when done on the basis of each bus parked. Then the total cost per bus in a conventional-on ground bus depot is Rs 32.29 lakh per bus, as against 29.95 lakh/bus in multi-level depots.
Waiting for a bus report.indd 61 05/10/17 3:55 PM

62
WAITING FOR A BUS
If a higher (and true) land value is estimated, then the cost of multi-level bus depots becomes even more economical. This provides value for money and provides for much more efficient use of space.
In all cases, the current specifications for bi-level bus depots are uneconomical (see Graphs: Cost analysis (total); Cost analysis (per bus) and Cost per bus at different levels).
Graph: Cost analysis (total)
15 23.8
38.8
93.6
23.8
117.4
70.6
23.8
94.4
0
20
40
60
80
100
120
140
Cost of depot construction Cost of land Total cost
In c
rore
ru
pee
s
S-1: Base case S-2: Bi-level S-3: Multi-level (G+2)
* Land cost @ 4.75 crores per acre transfer rate on a no profit no loss basis
Graph: Cost analysis (per bus)
12.5
19.79
32.29
52
13.19
65.22
22.4
7.54
29.95
0
10
20
30
40
50
60
70
Cost of construction per bus (excluding land)
S-1: Base case S-2: Bi-level S-3: Multi-level (G+2)
Cost of land Total cost
In c
rore
ru
pee
s
Note: All figures in lakhs
* Land cost @ 4.75 crores per acre transfer rate on a no profit no loss basis
Waiting for a bus report.indd 62 05/10/17 3:55 PM

63
STRATEGIES TO IMPROVE DELHI’S BUS SYSTEM
Graph: Cost per bus at different land values
32.2
9
63.0
9
88.3
8
118.
73
65.2
2
85.7
5 102.
61 12
2.85
29.9
5 41.6
9
51.3
2 62.8
9
0
20
40
60
80
100
120
140
@ 4.75 crore/acre @ 12 crore/acre @ 18 crore/acre @ 25 crore/acre
In c
rore
ru
pee
s
S-1: Base case S-2: Bi-level S-3: Multi-level (G+2)
*Total cost of depot per bus in lakhs
EPCA assessment and recommendations on bus depot1. Delhi government has sufficient depot land, which can park up to additional
2,000 buses. Therefore, there is no reason for delay in bus purchase up to 2,000 buses.
2. In the available bus depot land of 257 acres, can house 6,168. Currently, on road there are DTC (4,338) and cluster (1,490), totaling 5,828 buses. In addition, it has got 68 acres of land, which can park up to 1,600 buses.
3. In addition, there is a requirement for augmenting buses. Our assessment is that for parking of 11,000 buses, there is an additional requirement of 134 acres, which goes up to 341 acres for parking 16,000.
4. Transport has given DDA land adding up to 55.9 acres, which DDA is examining to see if these can be made available for depot. This decision will be known in two weeks.
5. Transport depot must examine and implement plan as proposed by EPCA to optimize on its current land by utilizing the terminal lands in the radius of bus depots.
6. DDA should revise the relevant provision in Master Plan Delhi, 2021 (Section 12.14.3.6) regarding bi-level parking to be replaced with Multi level depots parking for public buses.
7. Delhi government should use this revision of MDP, which allows for multi-level bus depots begin process of construction. This will greatly optimize on current land and also reduce the dead-mileage as many of the current bus depots are within city limits.
Waiting for a bus report.indd 63 05/10/17 3:55 PM
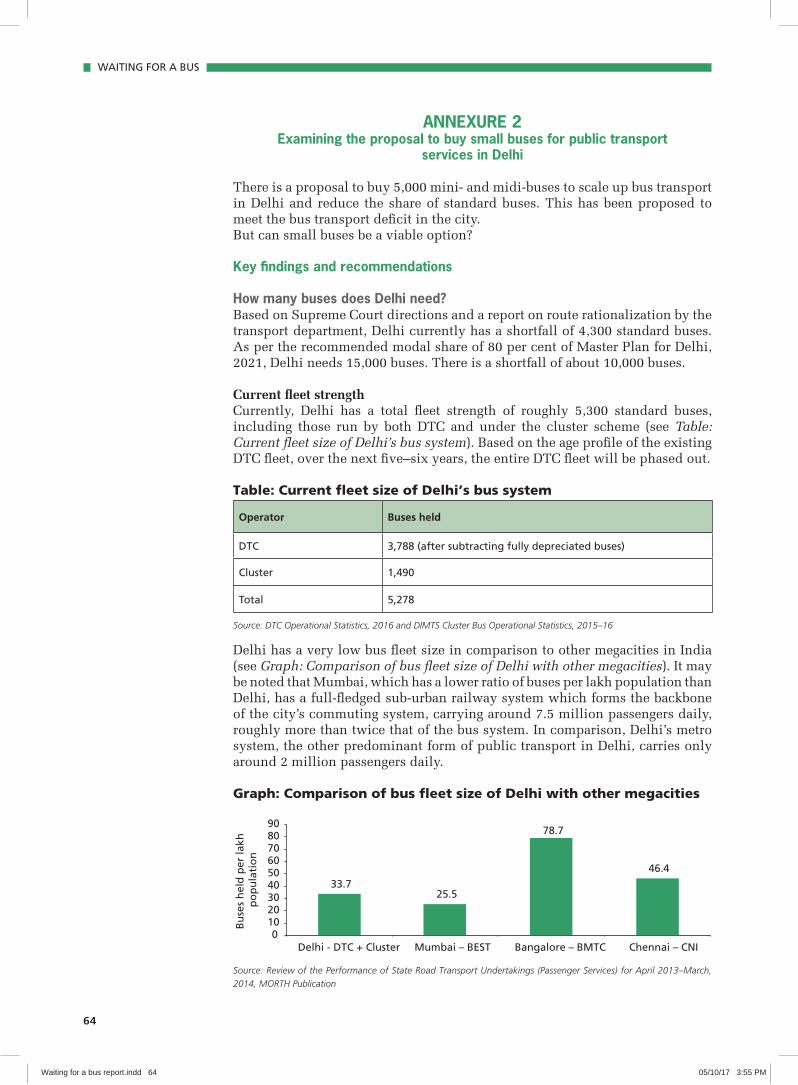
64
WAITING FOR A BUS
ANNEXURE 2Examining the proposal to buy small buses for public transport
services in Delhi
There is a proposal to buy 5,000 mini- and midi-buses to scale up bus transport in Delhi and reduce the share of standard buses. This has been proposed to meet the bus transport deficit in the city. But can small buses be a viable option?
Key findings and recommendations
How many buses does Delhi need?Based on Supreme Court directions and a report on route rationalization by the transport department, Delhi currently has a shortfall of 4,300 standard buses. As per the recommended modal share of 80 per cent of Master Plan for Delhi, 2021, Delhi needs 15,000 buses. There is a shortfall of about 10,000 buses.
Current fleet strengthCurrently, Delhi has a total fleet strength of roughly 5,300 standard buses, including those run by both DTC and under the cluster scheme (see Table: Current fleet size of Delhi’s bus system). Based on the age profile of the existing DTC fleet, over the next five–six years, the entire DTC fleet will be phased out.
Table: Current fleet size of Delhi’s bus system
Operator Buses held
DTC 3,788 (after subtracting fully depreciated buses)
Cluster 1,490
Total 5,278
Source: DTC Operational Statistics, 2016 and DIMTS Cluster Bus Operational Statistics, 2015–16
Delhi has a very low bus fleet size in comparison to other megacities in India (see Graph: Comparison of bus fleet size of Delhi with other megacities). It may be noted that Mumbai, which has a lower ratio of buses per lakh population than Delhi, has a full-fledged sub-urban railway system which forms the backbone of the city’s commuting system, carrying around 7.5 million passengers daily, roughly more than twice that of the bus system. In comparison, Delhi’s metro system, the other predominant form of public transport in Delhi, carries only around 2 million passengers daily.
Graph: Comparison of bus fleet size of Delhi with other megacities
33.7 25.5
78.7
46.4
0 10 20 30 40 50 60 70 80 90
Delhi - DTC + Cluster Mumbai – BEST Bangalore – BMTC Chennai – CNI
Bu
ses
hel
d p
er la
kh
po
pu
lati
on
Source: Review of the Performance of State Road Transport Undertakings (Passenger Services) for April 2013–March,
2014, MORTH Publication
Waiting for a bus report.indd 64 05/10/17 3:55 PM
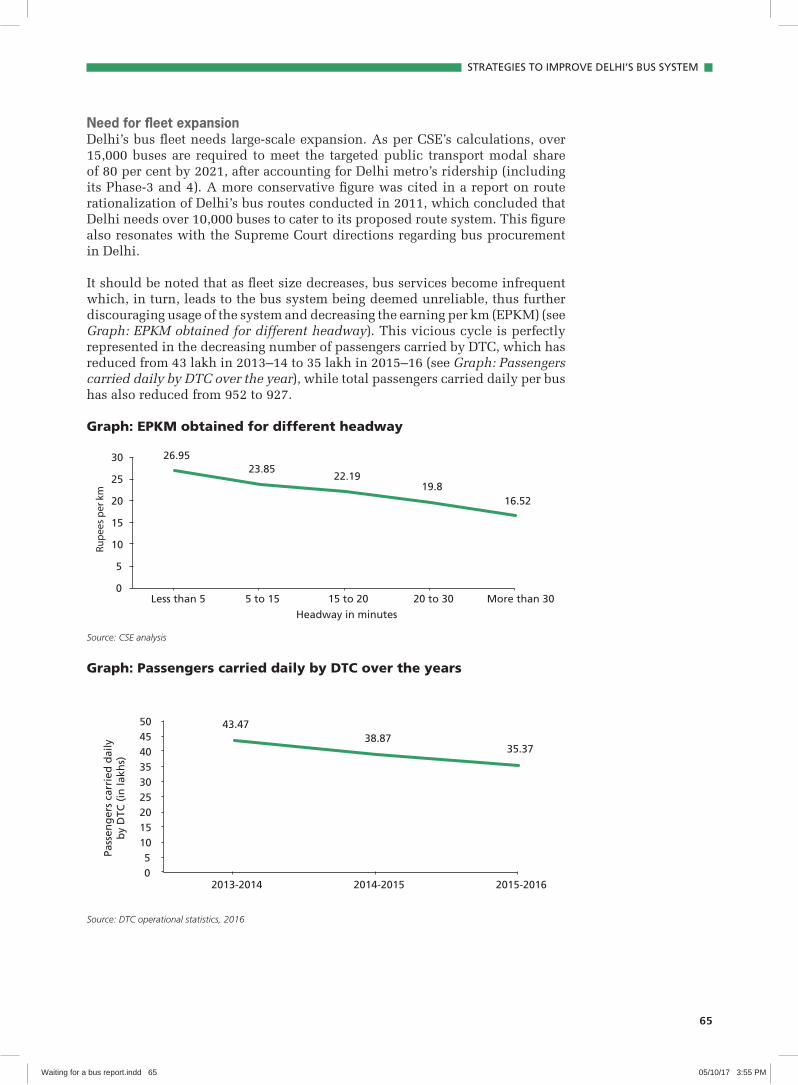
65
STRATEGIES TO IMPROVE DELHI’S BUS SYSTEM
Need for fleet expansionDelhi’s bus fleet needs large-scale expansion. As per CSE’s calculations, over 15,000 buses are required to meet the targeted public transport modal share of 80 per cent by 2021, after accounting for Delhi metro’s ridership (including its Phase-3 and 4). A more conservative figure was cited in a report on route rationalization of Delhi’s bus routes conducted in 2011, which concluded that Delhi needs over 10,000 buses to cater to its proposed route system. This figure also resonates with the Supreme Court directions regarding bus procurement in Delhi.
It should be noted that as fleet size decreases, bus services become infrequent which, in turn, leads to the bus system being deemed unreliable, thus further discouraging usage of the system and decreasing the earning per km (EPKM) (see Graph: EPKM obtained for different headway). This vicious cycle is perfectly represented in the decreasing number of passengers carried by DTC, which has reduced from 43 lakh in 2013–14 to 35 lakh in 2015–16 (see Graph: Passengers carried daily by DTC over the year), while total passengers carried daily per bus has also reduced from 952 to 927.
Graph: EPKM obtained for different headway
26.95 23.85
22.19 19.8
16.52
0
5
10
15
20
25
30
Less than 5 5 to 15 15 to 20 20 to 30 More than 30 Headway in minutes
Rupe
es p
er k
m
Source: CSE analysis
Graph: Passengers carried daily by DTC over the years
43.47 38.87
35.37
0 5
10 15 20 25 30 35 40 45 50
2013-2014 2014-2015 2015-2016
Pass
eng
ers
carr
ied
dai
ly
by
DTC
(in
lakh
s)
Source: DTC operational statistics, 2016
Waiting for a bus report.indd 65 05/10/17 3:55 PM
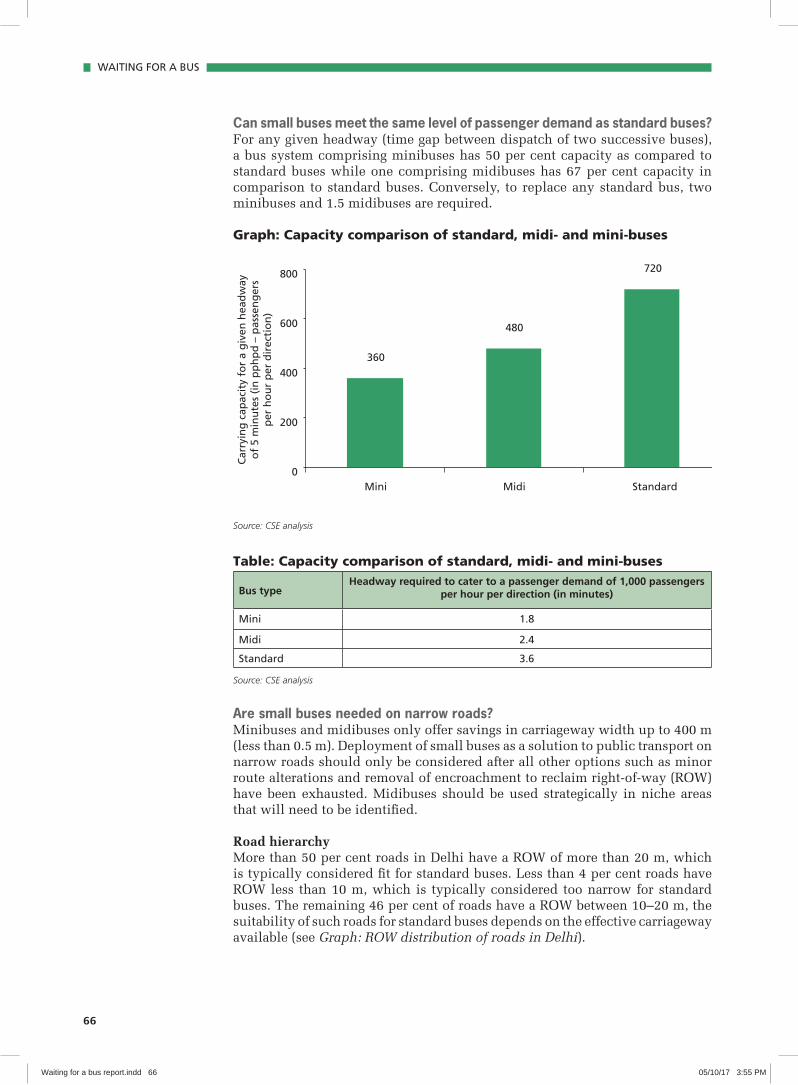
66
WAITING FOR A BUS
Can small buses meet the same level of passenger demand as standard buses?For any given headway (time gap between dispatch of two successive buses), a bus system comprising minibuses has 50 per cent capacity as compared to standard buses while one comprising midibuses has 67 per cent capacity in comparison to standard buses. Conversely, to replace any standard bus, two minibuses and 1.5 midibuses are required.
Graph: Capacity comparison of standard, midi- and mini-buses
360
480
720
0
200
400
600
800
Mini Midi Standard
Car
ryin
g c
apac
ity
for
a g
iven
hea
dw
ay
of
5 m
inu
tes
(in
pp
hp
d –
pas
sen
ger
s p
er h
ou
r p
er d
irec
tio
n)
Source: CSE analysis
Table: Capacity comparison of standard, midi- and mini-buses
Bus typeHeadway required to cater to a passenger demand of 1,000 passengers
per hour per direction (in minutes)
Mini 1.8
Midi 2.4
Standard 3.6
Source: CSE analysis
Are small buses needed on narrow roads? Minibuses and midibuses only offer savings in carriageway width up to 400 m (less than 0.5 m). Deployment of small buses as a solution to public transport on narrow roads should only be considered after all other options such as minor route alterations and removal of encroachment to reclaim right-of-way (ROW) have been exhausted. Midibuses should be used strategically in niche areas that will need to be identified.
Road hierarchyMore than 50 per cent roads in Delhi have a ROW of more than 20 m, which is typically considered fit for standard buses. Less than 4 per cent roads have ROW less than 10 m, which is typically considered too narrow for standard buses. The remaining 46 per cent of roads have a ROW between 10–20 m, the suitability of such roads for standard buses depends on the effective carriageway available (see Graph: ROW distribution of roads in Delhi).
Waiting for a bus report.indd 66 05/10/17 3:55 PM

67
STRATEGIES TO IMPROVE DELHI’S BUS SYSTEM
Graph: ROW distribution of roads in Delhi
< 10 m
46.32%
27.45%
12.33%
8.17%
1.95% 3.78%
10 - 20 m
20 - 30 m
30 - 40 m
40 - 60 m
> 60 m
Source: CSE analysis
Difference in bus sizeThe difference in width of the standard and midibuses is approximately 100–400 mm; it is 400 mm for standard and minibuses (see Table: Dimensions of standard, midi- and mini-buses). Given the insignificant differences in width (a maximum of 400 mm, which is less than 0.5 m), there cannot be appreciable savings on carriageway width for other traffic.
Table: Dimensions of standard, midi- and mini-buses
Bus type
Dimensions in mm
Length* (in mm)Maximum
Width** (in mm)Wheel base
(in mm)Desired Turning
radii (in mm)
Standard 11,000-12,000 2,600 6,010 13,000-15,000
Midi 8,270-9,400 2,500 (min 2,210) 4,200 10,000-12,000
Mini 6,500-6,920 2,200 3,930 8,000-9,000
*May vary slightly for different make of buses
**As per urban bus specifications of the Ministry of Housing and Urban Affairs
Source: CSE analysis
Road geometryRoad geometry in terms of width and available turning radii are important criteria for the selection of a particular type of bus with the latter being essential for smooth steering and manoeuvring of buses, particularly at traffic intersections.
While a lesser turning radius in case of midibuses and minibuses, compared to standard buses, does make them more conducive to areas that are typically served by a lower hierarchy of roads, other options like making minor alterations in routes, removal of encroachment to reclaim actual ROW, and design interventions at intersections, should be exhausted prior to making a decision on opting for smaller buses solely due to constraints of road geometry.It is also worth pointing out here that road network suitability is a function of road geometry as well as traffic congestion and effective ROW. By tackling congestion, reclaiming the original ROW and according priority to buses on the
Waiting for a bus report.indd 67 05/10/17 3:55 PM

68
WAITING FOR A BUS
carriageway through bus lanes, one can address many issues concerning the road geometry for standard buses.
Is it cheaper to run small buses?No, it is costlier to operate smaller buses—60 per cent higher for minibuses and 32 per cent higher for midibuses. This is because of the increase in staffing requirement (5.3 additional drivers and conductors for every extra bus) that will follow from deployment of more buses to cater to the same passenger demand and the fact that staffing costs constitute more than 50 per cent of the total operating costs. Further, the difference between the capital cost of midibuses and standard buses is only Rs 5 lakh. Given the significantly higher cost of operations of minibuses, their deployment should be avoided altogether.
Comparing the cost of busesBased on a market survey of major bus manufacturers conducted by CSE, it has been established that while a standard bus (900 mm floor height) costs about Rs 33 lakh, a midibus costs Rs 28 lakh, and a minibus costs Rs 22 lakh.
Comparing costs of operating standard and small busesOne of the major criteria for selecting any type of bus is the total cost of operation (TCO). An attempt has been made here to compare the major cost components for all three categories of buses.
Fixed cost = annual depreciation + staff costVariable cost = Fuel cost + annual maintenance cost
For the sake of uniformity in comparison, passenger seat-km has been taken as the unit of comparison of costs. The major conclusions drawn from this analysis are:• The capital cost difference between a standard (900 mm) and midibus is
just Rs 5 lakh while the reduction in passenger carrying capacity is more than 30 per cent.
• While staff cost per seat-km will be 50 per cent and 100 per cent higher for midibuses and minibuses respectively, compared to standard buses, the total fixed cost (depreciation + staff cost) will be 47 per cent and 90 per cent higher. This is because the staffing requirement (which accounts for more than 50 per cent of the total cost of operations) will remain constant for all bus sizes.
• Total variable cost per seat-km (fuel cost + AMC cost) will be 5 per cent and 9 per cent higher in case of midibuses and minibuses respectively, compared to standard buses.
• TCO per seat-km (fixed cost + variable cost) will be 32 per cent and 60 per cent higher in case of midibuses and minibuses respectively, compared to standard buses.
• Given the higher cost of operations of minibuses (up to 60 per cent), their deployment as an option should be avoided altogether. Deployment of midibuses may be done strategically on select routes with genuine road geometry constraints and insufficient demand to operate standard buses on headway of less than 15 minutes.
Can the industry supply small and big buses quickly?Contrary to the general notion that the bus industry can supply small buses at a much higher pace than standard buses, a market survey conducted by CSE has not found any difference, except for one manufacturer in only the minibuses category—Tata can supply 300 buses per month in all the three categories
Waiting for a bus report.indd 68 05/10/17 3:55 PM

69
STRATEGIES TO IMPROVE DELHI’S BUS SYSTEM
(standard/ midi- / mini- non-AC CNG bus) while Ashok Leyland can provide 100 buses per month in all three categories. Swaraj Mazda can supply only up to 50–70 buses per month in the mini-midi category. Force Motors can provide up to 3,000 buses per month only in the minibus category.
Can we have small AC CNG buses? The lack of variants in AC CNG midi and mini category, coupled with the varying fare sensitivity issues of various user segments and a general decline in demand for AC buses in general in non-summer months render the deployment of small AC CNG buses in Delhi challenging.
Have other cities experimented with small buses?Yes, cities like Mumbai and Chennai have used them, but in very limited proportions (10 per cent in Mumbai and 3 per cent in Chennai) and for very specific purposes, such as feeder routes to suburban rail system in Mumbai.
Can small buses be used as feeder to trunk bus routes across Delhi?Using small buses as feeder to trunk bus routes may not be a viable option due to the increased cost of interchanges (time and money) that will not get offset by the relative saving of time that the trunk bus system will typically offer. Further, they will face competition from an efficiently functioning IPT system of autos that can offer much higher flexibility to users in terms of lesser waiting time due to smaller size of vehicles. Besides, the competition will also affect the livelihoods of those who operate the IPT vehicles.
Where can small buses be deployed?Midibuses can be deployed on a case-by-case basis on those routes where there are significant road geometry constraints for a significant segment of the route and the passenger demand is not sufficient to deploy standard buses on policy headway of 15 minutes. The set of routes categorized as ‘secondary routes’ in the report on route rationalization conducted by the transport department in 2011 can be considered for such deployment. Deployment of minibuses should be avoided altogether due to concerns flagged earlier.
Examining the proposal to buy small buses for public transport in DelhiThere is a proposal to buy 5,000 mini- and midi-buses to scale up bus transport in Delhi and reduce the share of standard buses. This has been proposed to meet the bus transport deficit in the city. But can small buses be a viable option?
Waiting for a bus report.indd 69 05/10/17 3:55 PM

70
WAITING FOR A BUS
Table: Assumptions taken for economic analysis of cost of operations of standard, mini-, midi-busesCharacteristic Unit Standard bus Midibus Minibus Remarks
Typology 11 m length, 900 mm floor height, front engine and
manual transmission
9.3 m length, 900 mm floor height,
front engine and manual transmission
6.8 m length, 900 mm
floor height, front engine and manual transmission
Buses with similar specifications taken for uniformity in comparison
Unit capital cost (Non-AC) Lakh rupees 33 28 22 Based on the latest figures obtained from the industry by CSE
Seating capacity Number of passengers
34–42 26–30 18–22
Total capacity Number of passengers
60 40 30 Includes standees + seated passengers
Mileage (CNG) Km per kg 3.5 5.0 6
Fuel cost (CNG) Rupee per kg 37 37 37
Assumed life of the bus Years 10 10 10 Same for all three types
Requirement of drivers + conductors
Staff per bus 5.3 5.3 5.3 Taken as per DTC norms
Salary of drivers and conductors
Rupees per month 18,000 18,000 18,000 Same for all three types
Requirement of other staff (repair and maintenance + administration
Staff per bus 1.75 1.75 1.75 Taken as per DTC norms
Salary of other staff Rupees per month 50,000 50,000 50,000 Same for all three types
Vehicle utilization per day Km 200 200 200 Same for all three types
Cost of annual maintenance (average over an assumed life of 10 years)
Rupees per km 10 7 5
Source: CSE analysis
Waiting for a bus report.indd 70 05/10/17 3:55 PM

Waiting for a bus report.indd 71 05/10/17 3:55 PM

The bus system in Delhi is plagued with multiple problems. On the one hand, the city does not have enough buses to cater to the demands of its teeming millions. On the other hand, it does not have the money to buy new buses, to fulfil requirements set by the Supreme Court and the Delhi High Court on multiple occasions. Inadequate fleet size means inability to convert the demand in the city into revenue. Lack of revenue prevents the augmentation of the fleet, and is a serious handicap in providing the kind of public service the bus system should ideally provide. Caught in this vicious cycle and with a mounting debt trap, the situation is dire indeed, particularly for the Delhi Transport Corporation (DTC).
But there is hope. Delhi’s transport system is not in shambles due to absence of opportunity to grow and flourish. Rather, it has been a victim of poor policy and management. Proper planning and the smallest of financial interventions by the government can resurrect the flat-tyres of DTC and the bus system at large. This report suggests some simple and effective solutions to these chronic problems.
Centre for Science and Environment
41, Tughlakabad Institutional Area, New Delhi 110 062
Phones: 91-11-40616000 Fax: 91-11-29955879
E-mail: [email protected] Website: www.cseindia.org
Waiting for a bus report.indd 72 05/10/17 3:55 PM


