33
WALGREENS Andy Guar, Akrati Johari, Mike Lavin, Yanyan Xu, Yili Xu Presented on 10/22/2009 Akrat i Johar i (akra tijoh ari@g mail. com)
| Date post: | 14-Jan-2016 |
| Category: |
Documents |
| Upload: | frederica-thornton |
| View: | 214 times |
| Download: | 1 times |

WALGREENSAndy Guar, Akrati Johari, Mike Lavin, Yanyan Xu, Yili Xu
Presented on 10/22/2009
Akrati Johari ([email protected])

I. Company Overview (Andy)II. Company Strategy (Akrati)III. Macro-economic Outlook (Eric/Mike)IV. Industry Analysis (Eric/Mike)V. Competitors (Eric/Mike)VI. Valuation (Yanyan/Andy)VII. Client Portfolio (Andy)VIII. Recommendation
Deliverable Outline2

History3
Founded in 1901 by Charles R Walgreen Sr.. Rose to 5 stores by 1915 By the mid 1920s, there were about 65 stores
with an annual sale of 1.2 million dollars. In 1927, the company went public and by the
end of 1929, there were 397 Walgreen stores in 87 cities; annual sales were $47 million with net earnings of $4 million
History (continued)4
In the 1950s, Walgreens began to build self-service instead of clerk service stores in the Midwest and became the largest self-service retailer in the country by 1953In the early 1980s, the company pioneered computerized pharmacies connected by satelliteIn 1991, Walgreens completed the installation of point-of-sale scanning to speed checkoutsIn 1992, the company became the first drugstore with a drive-thru pharmacyWalgreens.com is launched in 1999, a comprehensive online pharmacy offering customers a convenient and secure way to take care of my pharmaceutical and healthcare needs online1000th Store in 1984 and 2000th store in 1994, 5000th in 2005, 7000th in 2009.
Present5
Presently runs stores in all 50 states with about 200,000 EmployeesWalgreens is named to Fortune magazine’s Most Admired Companies in America list for the 15th consecutive yearRanked 40th on the Fortune 500 list of the largest U.S.-based companiesIn 2008, Walgreens acquired McKesson Corporation’s specialty pharmacy, I-trax, IncIn 2009 announced acquisition of New Jersey's Drug Fair chain,Walgreens's expansion differs from that of its competitors, CVS/pharmacy and Rite Aid, in that Walgreens usually expands by opening new stores in new markets instead of by acquisitions though.

Management6
Gregory Wasson- President and CEO• On January 26, 2009, was named CEO effective February
1, 2009
• Internal hire, with the company since 1980
Alan McNally- Chairman• Replaced Jeff Rein as Chairman and Acting CEO after his
retirement on October 10, 2008
• Served on Walgreens board of directors since 1999
Jeff Rein- Former Chairman and CEO
• Served as CEO from 2006 until October 10, 2008
• Speculation that his retirement was forced by the board of directors
• Conflict over future growth of the company

Business Strategy7
Source: https://materials.proxyvote.com/Approved/931422/20081121/AR_28708/HTML2/walgreens-ar2008_0040.htm (Accessed Oct 8, 2009)

Business Strategy (continued)
8
Focus on serving its customers better Low-cost alternatives and the best overall value Eg: Prescription Savings Club Improve customers’ experience
Adjusted our organic store growth Slower growth offers two big positives:
More time to develop our management ranks and focus on improving the customer experience
Greater flexibility to invest in opportunities

Business Model9
Source: https://materials.proxyvote.com/Approved/931422/20081121/AR_28708/HTML2/walgreens-ar2008_0040.htm
(Accessed Oct 8, 2009)
Store Model10
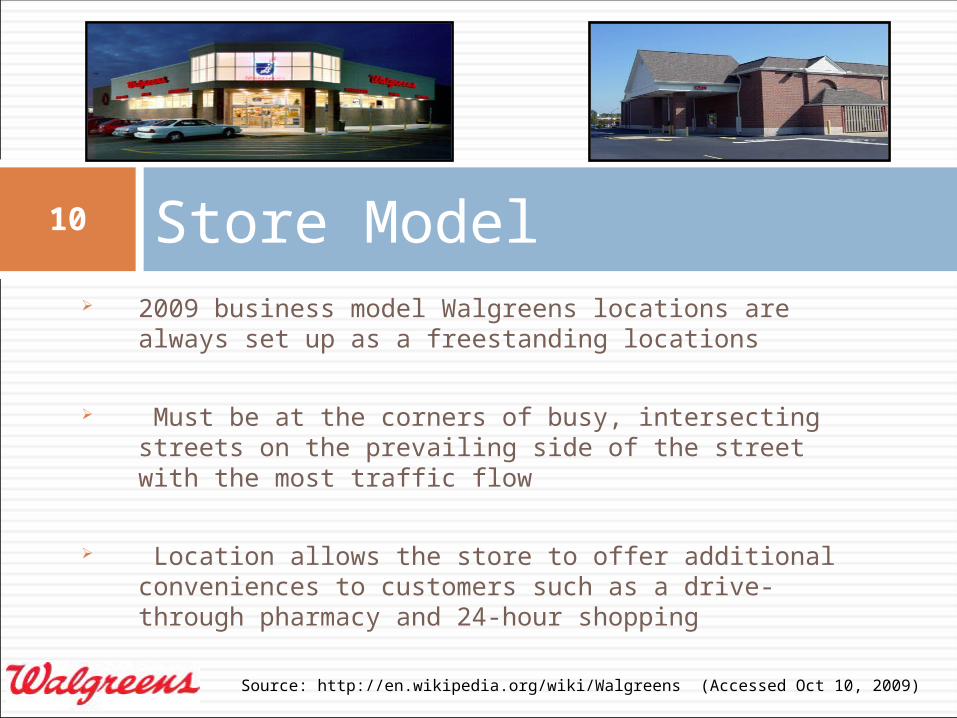
2009 business model Walgreens locations are always set up as a freestanding locations
Must be at the corners of busy, intersecting streets on the prevailing side of the street with the most traffic flow
Location allows the store to offer additional conveniences to customers such as a drive-through pharmacy and 24-hour shopping
Source: http://en.wikipedia.org/wiki/Walgreens (Accessed Oct 10, 2009)

Business Locations11
Source: https://materials.proxyvote.com/Approved/931422/20081121/AR_28708/HTML2/walgreens-ar2008_0040.htm (Accessed Oct 8, 2009)

Business Locations (continued)
12
New store openings:
June ’09 - Walgreen Co. announced the opening of the first drugstore nationwide to meet top environmental requirements for efficiency and design.
July ’09 – Walgreen Co. to open store in Alaska on July 12, 2009. The Wasilla store, along with two Anchorage locations that will open in August, includes products from local vendors, including coffee and moose nuggets to ulus and fishing supplies.
August ’09 - Walgreen Co. will celebrate the grand opening of the first drugstore in Illinois to meet top environmental requirements for efficiency and design.

Business Locations (continued)
13
Acquisitions and JV:
Feb ‘09 - Walgreens signed an agreement to purchase 12 Rite Aid locations, including seven in San Francisco and five in eastern Idaho
Aug ‘09 - Walgreen Co. has entered into a joint venture with Vanderbilt Medical Center. The joint venture will operate under the name Vanderbilt Home Care, affiliated with Walgreens Infusion and Respiratory Services, and will be located in Brentwood, Tenn

I. The current economic climate continues to put strain on credit markets, forcing companies and consumers to hold onto their cash.
II. Robeco’s Macroeconomic Outlook Report predicts that 2009 will be characterized by an economic recession that is longer and deeper than any that have occurred for a quarter of a century.
III. In spite of the economic crisis and continued expansion, Walgreens reduced the growth in expenses by 6% in fiscal 2008. This signifies increased efficiency.
Macro-economic Outlook14
I. In recent years the drug retail sector has been growing at a fluctuating rate.I. CAGR for 2004-2008 = 5% and is expected to
increase to 5.8% for five year period 2008-2013.
II. The retail drug sector, valued at $1.5 billion in 2008, is expected to reach $2 billion by the end of 2013.
Industry Analysis15
http://globalbb.onesource.com/web/Reports/ReportMainIndustry.aspx?SicCodeID=220585&Process=CP&Report=INDUSTRYSUMMARY( Accessed September 30, 2009)
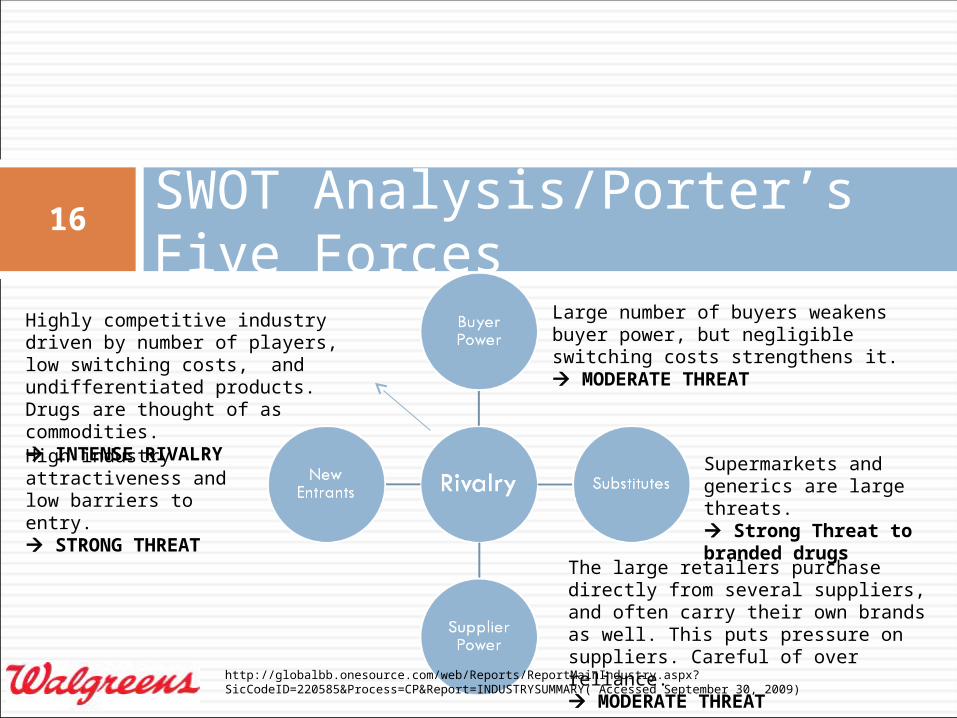
SWOT Analysis/Porter’s Five Forces
16
Large number of buyers weakens buyer power, but negligible switching costs strengthens it. MODERATE THREAT
Supermarkets and generics are large threats. Strong Threat to branded drugs
The large retailers purchase directly from several suppliers, and often carry their own brands as well. This puts pressure on suppliers. Careful of over reliance. MODERATE THREAT
High industry attractiveness and low barriers to entry. STRONG THREAT
Highly competitive industry driven by number of players, low switching costs, and undifferentiated products. Drugs are thought of as commodities. INTENSE RIVALRY
http://globalbb.onesource.com/web/Reports/ReportMainIndustry.aspx?SicCodeID=220585&Process=CP&Report=INDUSTRYSUMMARY( Accessed September 30, 2009)

Walgreen is one of the largest drugstore chains in the US, in terms of sales. The drugstores are engaged in the sale of prescription drugs (65%), non-prescription drugs (10%), and general merchandise (25%).
CVS Caremark's operations are grouped into two business segments: retail pharmacy and pharmacy services. The retail pharmacy business segment comprises retail drugstores, an online retail website, CVS.com, and retail healthcare clinics. The retail drugstores operate under the label, 'CVS Pharmacy'. CVS Caremark also operates MinuteClinic, a store-based clinic.
Rite Aid has an alliance with GNC to co-market a line of vitamins and nutritional supplements called PharmAssure that are sold in Rite Aid and GNC stores. It offers approximately 3,000 products under the Rite Aid private brand. In June 2007, the company completed its acquisition of 1,854 Brooks and Eckerd stores and six distribution centers from The Jean Coutu Group (PJC). Rite Aid also fills prescriptions for state sponsored Medicaid and Medicare programs.
Competitors- Comparative Descriptions
17
http://globalbb.onesource.com/web/Reports/ReportMainIndustry.aspx?SicCodeID=220585&Process=CP&Report=INDUSTRYSUMMARY( Accessed September 30, 2009)

Competitors- Comparative Ratios18
2004-2008
Profit Margin
Total Asset Turnover
Equity Multiplier
Return on Equity
Current ROE
Current ROA
Walgreen
3.70% 2.76 1.70 17.36% 14.73% 8.54%
CVS 3.40% 1.66 1.82 10.27% 9.85% 6.70%
Rite Aid 0.66% 2.44 7.23 11.64% Negative 0.92%Walgreens had September sales of $5.35 billion, an increase of 10.3% from $4.85 billion for the same month in 2008. Sales in comparable stores (those open at least a year) increased 5.3%, while comparable store front-end sales increased 2.0%.
September pharmacy sales increased 11.2%, while comparable pharmacy sales increased 7.0%. Positively impacted by flu shots and negatively impacted by generics.
http://finance.yahoo.com/q?s=wag(Accessed October 8, 2009)

Assumptions – Business Mix19
Fundamental shift in business mix towards prescription drugs
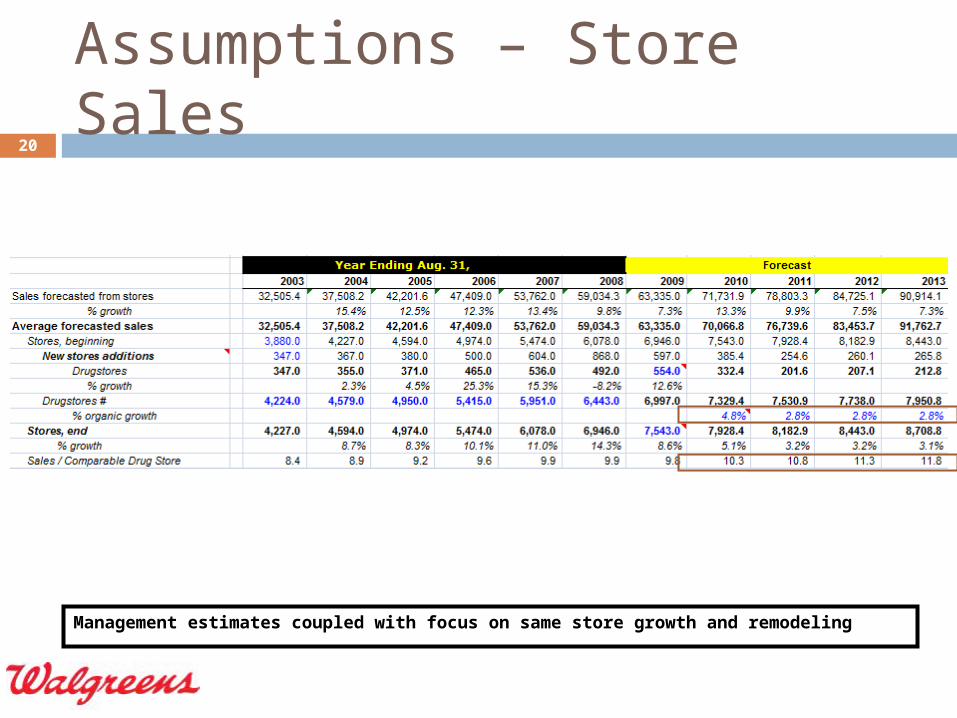
Assumptions – Store Sales20
Management estimates coupled with focus on same store growth and remodeling

WACC21
Focus on Goal Post, which uses an average cost of equity from CAPM and ROE
Beta 0.81 Yahoo 0.85 Bloomberg 0.9 Google 0.77Risk free rate 3%Risk Premium 6%Stock Price $40.37Cost of Equity 8.27%Market Value of Equity 40,018.8
Cost of Debt 4.71%Tax Rate 36.60%Market Value of Debt 2,351.0 Enterprise Value $42,369.78Growth Rate 3.00%
Cost of equityCAPM
Cost of equity 8.27%
ROECost of equity 16.72%
Goal PostCost of equity 12.50%
WACC (Goal Post)Debt/TV 5.5%Equity/TV 94.5%Wacc 11.97%
WACC (ROE)Debt/TV 5.5%Equity/TV 94.5%Wacc 15.96%
WACC (CAPM)Debt/TV 5.5%Equity/TV 94.5%Wacc 7.98%
Goal PostSum of Present Value's 25,151Less Debt 2,351Intrinsic Value 22,800# Shares Outstanding 991Intrinsic Value per share $23.00 -/+ 10% $20.70 / $25.30
ROESum of Present Value's 16,339Less Debt 2,351Intrinsic Value 13,988# Shares Outstanding 991Intrinsic Value per share $14.11 -/+ 10% $12.70 / $15.52
CAPMSum of Present Value's 48,482Less Debt 2,351Intrinsic Value 46,131# Shares Outstanding 991Intrinsic Value per share $46.54 -/+ 10% $41.88 /
$51.19

Goal Post22
Appears low compared to current price of ~$40, look at operating leases!
Goal PostSum of Present Value's 25,151Less Debt 2,351Intrinsic Value 22,800# Shares Outstanding 991Intrinsic Value per share $23.00 -/+ 10% $20.70 / $25.30
Intrinsic Value1 2 3 4 5 6
2008 2009 2010 2011 2012 2013 TVFree Cash Flows 163 1,382 1,888 2,453 2,750 3,070 35,238Present Value (Goal Post) 146 1,102 1,345 1,561 1,562 1,557 17,879

WACC – Contractual Obligations
23
Focus on Goal Post, which uses an average cost of equity from CAPM and ROE
Beta 0.81 Yahoo 0.85 Bloomberg 0.9 Google 0.77Risk free rate 3%Risk Premium 6%Stock Price $40.37Cost of Equity 8.27%Market Value of Equity 40,018.8
Cost of Debt 4.71%Tax Rate 36.60%Market Value of Debt 2,351.0 Enterprise Value $42,369.78Growth Rate 3.00%
Cost of equityCAPM
Cost of equity 8.27%
ROECost of equity 16.72%
Goal PostCost of equity 12.50%
WACC (Goal Post)Debt/TV 33.2%Equity/TV 66.8%Wacc 9.36%
WACC (CAPM)Debt/TV 36.8%Equity/TV 63.2%Wacc 6.36%
WACC (ROE)Debt/TV 30.1%Equity/TV 69.9%Wacc 12.62%
Goal PostSum of Present Value's 40,518Less Debt 2,351Intrinsic Value 38,167# Shares Outstanding 991Intrinsic Value per share $38.50 -/+ 10% $34.65 / $42.35
CAPMSum of Present Value's 78,736Less Debt 2,351Intrinsic Value 76,385# Shares Outstanding 991Intrinsic Value per share $77.06 -/+ 10% $69.35 /
$84.76
ROESum of Present Value's 26,154Less Debt 2,351Intrinsic Value 23,803# Shares Outstanding 991Intrinsic Value per share $24.01 -/+ 10% $21.61 /
$26.41

Goal Post – Contractual Obligations
24
Operating leases significantly change the intrinsic value
Cap StructureDebt 2,351.0 PV of Obligations 17,583.3 Equity 40,018.8 Total debt + equity 59,953.0
Intrinsic Value0 1 2 3 4 5
2008 2009 2010 2011 2012 2013 TVFree Cash Flows 163 1,382 1,888 2,453 2,750 3,070 49,679Present Value (Goal Post) 163 1,263 1,578 1,876 1,922 1,962 31,753
Goal PostSum of Present Value's 40,518Less Debt 2,351Intrinsic Value 38,167# Shares Outstanding 991Intrinsic Value per share $38.50 -/+ 10% $34.65 / $42.35
Payments due by period
Less than Over 5
1 year 1-3 years 3-5 years years TotalOperating leases 1,811 3,849 3,763 23,615 33,038

Multiples ValuationMultiples Valuation

Multiples Valuation26
Multiple Computed PriceP/E (ttm): 32.94
P/E (Forward): 22.76P/S (ttm): 25.13P/B (mrq): 25.32
TEV/EBITDA 35.95
Range : $ 25 - 35Range : $ 25 - 35

I. Stock Performance Graph
II. Stock Ownership Profile
III. Transaction History
IV. RCMP Portfolio Correlation
V. RCMP Portfolio Weights
Client Portfolio27

1 Year Stock Price28
http://www.google.com/finance?q=wag (Accessed October 20, 2009)

5 Year Stock Price29
http://www.google.com/finance?q=wag (Accessed October 20, 2009)
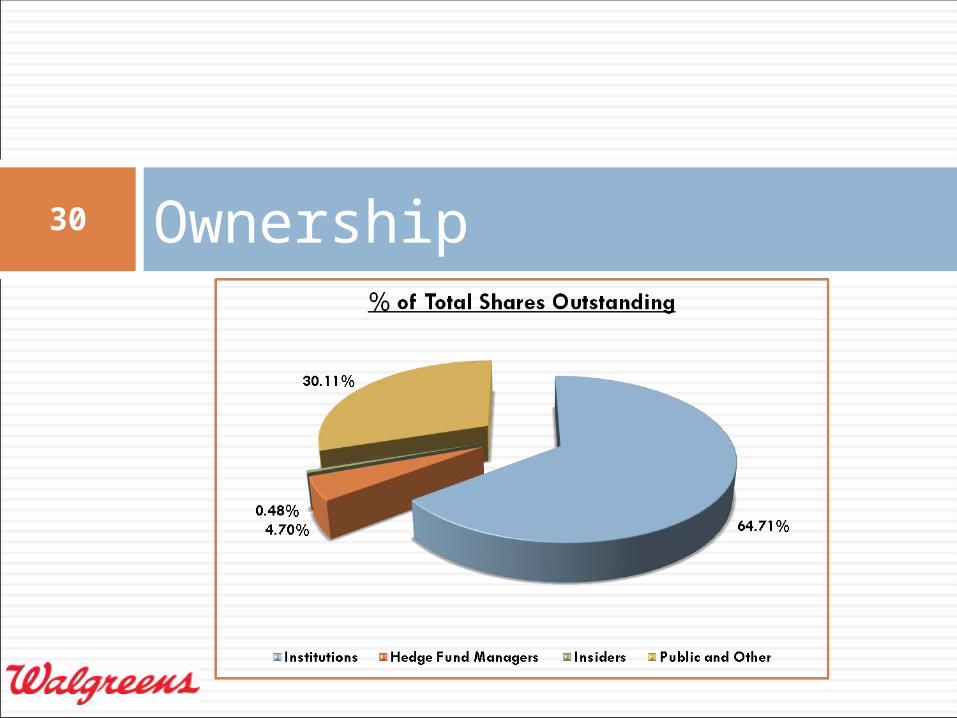
Ownership30

RCMP Current portfolio31

Transaction history & RCMP Transaction history & RCMP CorrelationCorrelation
32
•October 6th, 1999, entered position
1000 shares at $25.00 per share
•September 20th, 2006Sold 500 shares at $49.94 /share
Realized gain of $12,470
•Current PositionOwn 500 shares Current unrealized profit $ 7477.50
Company WAG
AEE 0.32
AEO 0.29
CPRT 0.07
DO 0.14
FR 0.33
JKHY 0.13
KMB 0.32
SRCL 0.08
WFR 0.14

I. Hold 500 shares @ $39.64
II. Intrinsic value range @ $34-42
III. Strong managementI. Focused on same store growth
II. Concentrating on generic drugs with higher profit margin
III. Customer Centric Pharmacy Wellness Program
Recommendation33


