Page 1
REGULAR PAPER
Wall-climbing robot for non-destructive evaluation usingimpact-echo and metric learning SVM
Bing Li1 • Kenshin Ushiroda2 • Liang Yang1 • Qiang Song2 • Jizhong Xiao1
Received: 2 December 2016 / Accepted: 30 June 2017 / Published online: 31 July 2017
� Springer Nature Singapore Pte Ltd. 2017
Abstract The impact-echo (IE) acoustic inspection
method is a non-destructive evaluation technique, which
has been widely applied to detect the defects, structural
deterioration level, and thickness of plate-like concrete
structures. This paper presents a novel climbing robot,
namely Rise-Rover, to perform automated IE signal col-
lection from concrete structures with IE signal analyzing
based on machine learning techniques. Rise-Rover is our
new generation robot, and it has a novel and enhanced
absorption system to support heavy load, and crawler-like
suction cups to maintain high mobility performance while
crossing small grooves. Moreover, the design enables a
seamless transition between ground and wall. This paper
applies the fast Fourier transform and wavelet transform
for feature detection from collected IE signals. A distance
metric learning based support vector machine approach is
newly proposed to automatically classify the IE signals.
With the visual-inertial odometry of the robot, the detected
flaws of inspection area on the concrete plates are visual-
ized in 2D/3D. Field tests on a concrete bridge deck
demonstrate the efficiency of the proposed robot system in
automatic health condition assessment for concrete
structures.
Keywords Wall-climbing robot � Non-destructiveevaluation � Impact-echo � Wavelet transform � Distancemetric learning � Support vector machine � Machine
learning
1 Introduction
The aging problem of civil infrastructures including
bridges, tunnels, and dams has been an important research
topic of structural health monitoring (SHM). The structural
integrity and deterioration levels is critical, and the failure
of tracking and predicting the SHM of these constructions
might lead to tremendous tragedies, such as the I-35W
Mississippi River bridge collapse (Hao 2009) in 2007,
United States. SHM is a significant tool to evaluate the
health of these infrastructures by collecting the routine
inspection data, and further analysis is performed to eval-
uate the sustainability of these infrastructures.
It is very challenging (Liu et al. 2014) and costly to
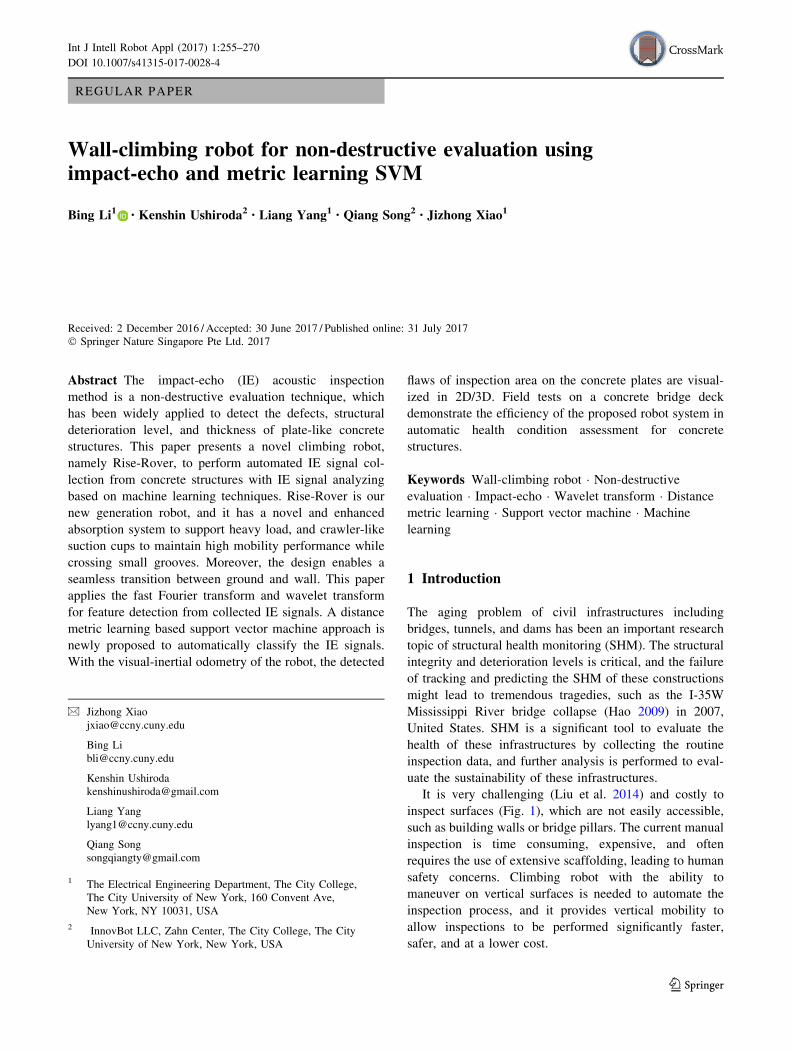
inspect surfaces (Fig. 1), which are not easily accessible,
such as building walls or bridge pillars. The current manual
inspection is time consuming, expensive, and often
requires the use of extensive scaffolding, leading to human
safety concerns. Climbing robot with the ability to
maneuver on vertical surfaces is needed to automate the
inspection process, and it provides vertical mobility to
allow inspections to be performed significantly faster,
safer, and at a lower cost.
& Jizhong Xiao
[email protected]
Bing Li
[email protected]
Kenshin Ushiroda
[email protected]
Liang Yang
[email protected]
Qiang Song
[email protected]
1 The Electrical Engineering Department, The City College,
The City University of New York, 160 Convent Ave,
New York, NY 10031, USA
2 InnovBot LLC, Zahn Center, The City College, The City
University of New York, New York, USA
123
Int J Intell Robot Appl (2017) 1:255–270
DOI 10.1007/s41315-017-0028-4
Page 2
In addition to the visual inspection of surface flaws,
various non-destructive evaluation (NDE) technologies
(McCann and Forde 2001) were developed to inspect the
structural integrity and deterioration [i.e., cracks, delami-
nation, or voids (Xiao and Agrawal 2015)] levels of the
inner concrete structure, such as the approaches of ultra-
sound (Tan et al. 1996), ground-penetrating radar (GPR)
(Daniels 2000), seismic pavement analyzer (PSA) (Gu-
cunski and Maher 2002), IE (Sansalone and Streett 1997).
Among these available NDE devices, hand-held IE is the
most commonly used technology for evaluating concrete
and masonry structures, since the advantages of IE tech-
nology includes easy usage, low cost, and reliability. This
technology was invented by the US National Bureau of
Standards and Cornell University (Sansalone and Streett
1997; Carino 2001), and was commercialized by impact-
echo Instruments LLC and Olson Engineering Inc (Olson
2010), which developed the handheld 2D/3D impact-echo
detection devices without automatic inspection function. In
addition, the 2D view [such as B-Scan, C-Scan (Liu et al.
2004)] and volumetric view (Liu and Yeh 2012) were also
researched to visualize detected IE results.
To design a NDE robot for automatic IE collection and
interpretation for both horizontal plates and vertical sur-
faces, based on our previous research (Xiao and Agrawal
2015; Xiao et al. 2005a, b, 2006, 2015; Xiao and Sadegh
2007; Xiao and Wang 2015; Li et al. 2014), this paper
proposed a novel wall-climbing robot (namely Rise-Rover)
for IE NDE, and the main contributions of this paper
include:
1. Designed our new generation wall-climbing robot,
with the suction cups novelly embedded in the wheel
track to improve both mobility and stability.
2. To the best of our knowledge, this paper newly applied
the metric learning-support vector machine (ML-
SVM) approach for the IE classification for concrete
structures. Conventional SVM support vectors distance
is considered uniformly for all features, and it causes
classification inaccuracy, but ML provides an adaptive
distance metric according to different classes and
features.
3. The IE NDE device was deployed in our Rise-Rover
for the field data collection on a concrete bridge deck
with cracks, and data analysis shows the effectiveness
of the proposed approaches.
The rest of the paper is organized as follows: In Sect. 2, the
related works are presented. Then in Sect. 3, the overview
design of the proposed NDE robot is described. Subse-
quently, Sect. 4 elaborates the mechatronics design of the
Rise-Rover. In Sect. 5, the theoretical analysis of the IE
signal using fast Fourier transform (FFT) and wavelet
transform (WT), and distance ML-SVM classifier are
elaborated upon. Section 6 shows the experimental results.
Finally the conclusion and future work of this research are
discussed in Sect. 7.
2 Related works
Impact acoustic inspection method is based on the impact
sound signal generated by a small hard object knocking on
the surface of concrete structures. It is the pattern of the
waveforms and power spectral density (PSD) of the
impact-echo signals that indicate the existence and loca-
tions of the flaws. Sansalone and Streett (1997) also points
out that when the transducer is placed close to the impact
point, the response is dominated by P-wave echoes, which
can be analyzed by the Fourier transform technique. The
PSD of the acoustic signal frequency is used as the source
of the signal features, such as: the power accumulation
ratio (Wu and Siegel 2000), the sound intensity ratio (Liu
et al. 2007), and the area of interval PSD (Tong et al.
2008). The threshold limitation evaluation method, as a
traditional approach, was applied by several researchers
(Liu et al. 2007; Ito and Uomoto 1997). Although it is a
simple approach, its sensitivity to the noise makes it
unreliable for practical applications.
In addition to Fourier analysis on the frequency spec-
trum domain, Wavelet transform (WT), as a time-fre-
quency analysis approach, became a prevalent method to
interpolate underlying characteristics inside of IE signal as
well as for signal de-noising (Sardy et al. 2001). The
wavelet packet decomposition (WPD) was applied in the
research of WICBOT (Luk et al. 2009) and the features of
PSD using WPD were used for the artificial neural network
Fig. 1 Manual inspection using NDE instruments Xiao and Agrawal
(2015)
256 B. Li et al.
123
Page 3
(ANN) classification. To overcome the difficulties of FT
(such as to avoid phenomena of ripple and multiple-peak),
an enhanced Fourier spectrum approach was presented by
multiplying the Fourier spectrum with wavelet marginal
spectrum (Yeh and Liu 2008). Wavelet decomposition was
also applied for feature extracting and concrete full con-
dition assessment (Zhang et al. 2016).
To automate the evaluation of SHM from NDE devices,
various machine learning techniques have been applied on
the extracted features from the collected signals. The
overview of data-driven machine learning applications on
SHM can be referred in Harley (2014), Farrar and Worden
(2012), Ying et al. (2012) and Srivastava and Han (2011).
For the impact-echo NDE, a few researches have applied
some conventional machine learning techniques to recog-
nize and classify the IE signals. ANN is a typical machine
learning technique which has been used for the Impact
acoustic signal analysis (Pratt and Sansalone 1992; Luk
et al. 2009) in the past decades. The extreme learning
machine (ELM) approach, as a type of feed-forward neural
networks, has been newly used to explored for the IE
analysis (Zhang et al. 2016). The drawbacks of ANN are
that it needs a large amount of training samples, depends
heavily on the empirical principles, and also the charac-
teristics of the impact acoustic features suppress the gen-
eralization capability of ANN (Tong et al. 2008).
Support vector machine (SVM), which is based on the
statistical learning theory, is characterized for classification
with the capability of learning from datasets at small size,
and has been applied for the IE classification such as in
Tong et al. (2008) and in our previous research Li et al.
(2014). Farrar and Worden (2012) chapter 11 gives more
details of SVM for structural health monitoring. The SVM
transfers the low dimensional feature space of IE signal
into higher dimension, so that to classify the signal into
different classes by maximizing the margin using a
hyperplane. To find an adaptive margin threshold for dif-
ferent classes in the SVM, in this research we propose to
use a distance metric learning (ML) approach to learn a
distance measurement over the IE signal datasets. Distance
learning approach was initially presented by Short and
Fukunaga (1981), and ML which is proposed by Xing et al.
(2003) was an earlier work for the unsupervised clustering
learning. Later it was applied with SVM to learn a
Mahanalobis distance for the classification (Nguyen and
Guo 2008; Liu and Caselles 2011).
To successfully accomplish the automation NDE
inspection task, various types of climbing robots and
adhesion mechanisms are explored (Xiao et al.
2005b, 2006; Ward et al. 2013; Guan et al. 2013; Bi et al.
2012). The climbing robot from International Climbing
Machines (ICM) which produces a large climbing robot
using an AC vacuum pump to generate strong suction and
uses rolling tread with thick foam to create a seal
perimeter. It is so far one of the most mature robot pro-
totypes that has the potential to be used in NDE inspection
of civil infrastructure (Strickland 2013). The ICM robot
can generate very strong adhesion on smooth and rough
surfaces and overcome small surface irregularities using
thick foam. However, the major weakness of this robot is
that it has one vacuum chamber that requires perfect
sealing enclosed by the thick foam tread. The robot falls
when the vacuum breaks, and it happens when the robot
crosses a ditch or deep groove/gaps, which are very com-
mon on brick/concrete walls. For the impact-echo robot,
WICBOT shows a tile-wall inspection mechanical system
(Luk et al. 2009), and it uses a cable driving mechanism to
move along the tile wall for IE inspection.
3 System overview
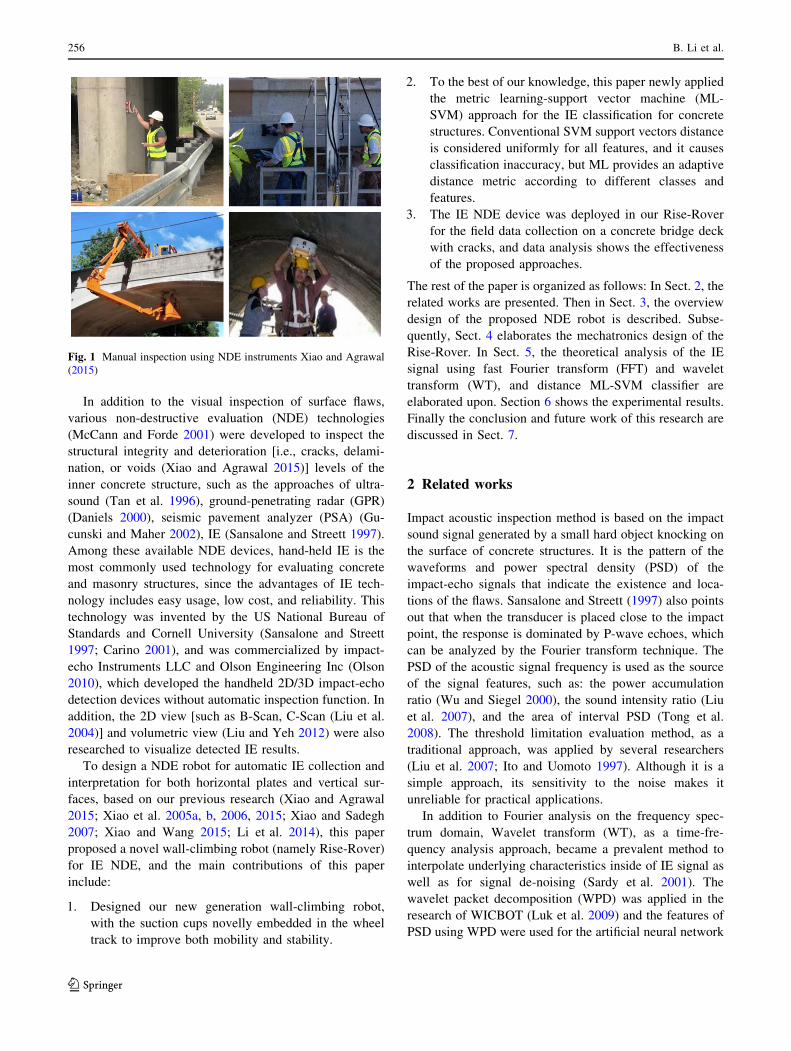
The Rise-Rover climbing robot (as shown in Fig. 2) is
designed to perform NDE inspection on both horizontal
and vertical concrete plates, with caterpillar chain-tracks
wheels to achieve fast locomotion on flat surfaces and
embedded suction cups for adhesion reliability. By
recording the odometry of the robot during the inspection,
the IE signals are stored with regards to corresponding
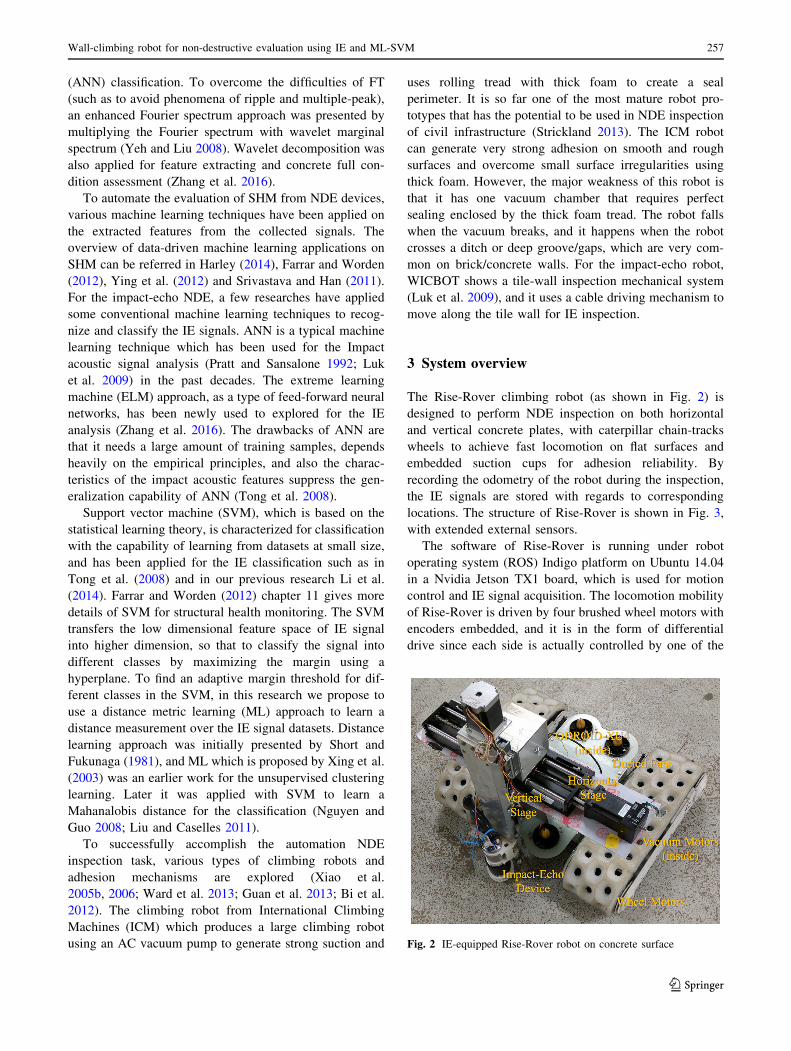
locations. The structure of Rise-Rover is shown in Fig. 3,
with extended external sensors.
The software of Rise-Rover is running under robot
operating system (ROS) Indigo platform on Ubuntu 14.04
in a Nvidia Jetson TX1 board, which is used for motion
control and IE signal acquisition. The locomotion mobility
of Rise-Rover is driven by four brushed wheel motors with
encoders embedded, and it is in the form of differential
drive since each side is actually controlled by one of the
Fig. 2 IE-equipped Rise-Rover robot on concrete surface
Wall-climbing robot for non-destructive evaluation using IE and ML-SVM 257
123
Page 4
pulse width modulation (PWM) channels. When the Rise-
Rover detaches the vertical surface in any case, the four
ducted fans are used to push the robot toward the wall.
Using a ZED stereo camera and nine-axis Xsens inertial
measurement unit (IMU), a stereo visual odometry (Mur-
Artal and Tardos 2016) is fused with IMU using multi-state
extended kalman filter (MS-EKF) is applied for positioning
in the environment. The robot can be controlled by the
ground station using an industrial laptop or radio controller,
and the onboard camera can be enabled for image capturing
and live inspection.
4 Mechatronics design
4.1 Mechanism system
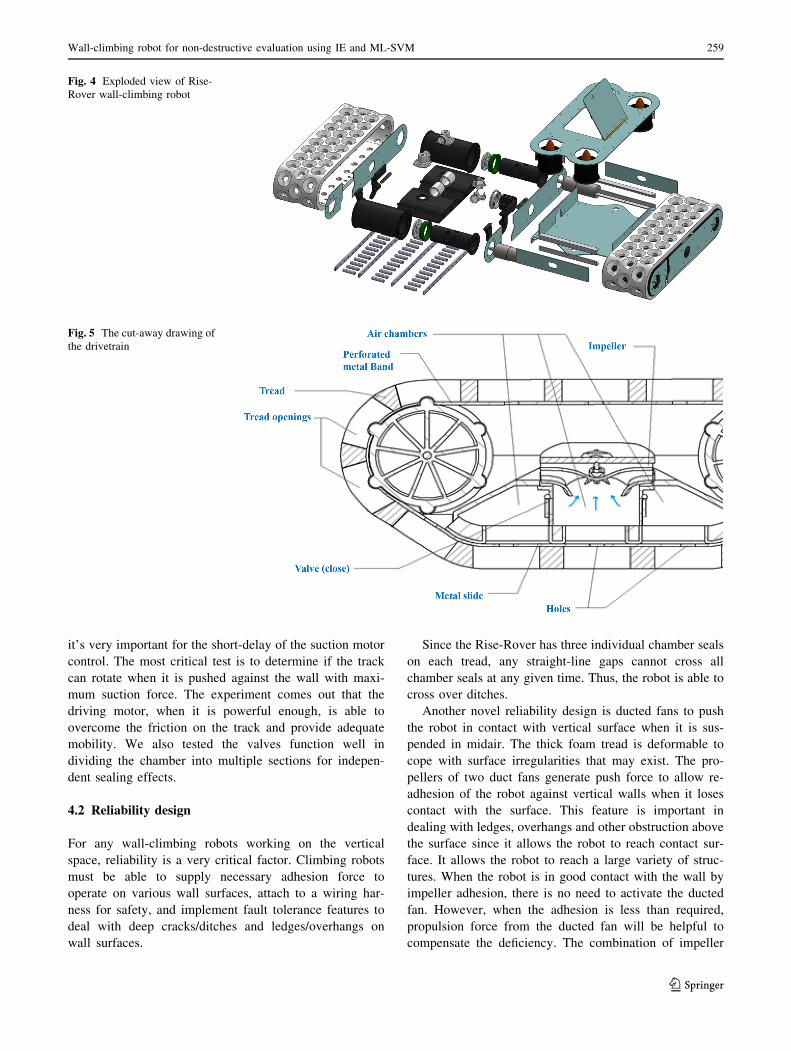
Figure 4 shows the exploded view of our innovative design
for Rise-Rover wall-climbing robot prototype. The robot
uses two individual drivetrains on both sides and two
ducted fans in the middle of the chamber.
The innovative design of the drivetrain system for Rise-
Rover climbing robot is as shown in Fig. 5. The drivetrain
consists of two drive wheels, a foam tread, a rotor package
with air chamber and impeller, and a perforated spring steel
band (belt). The backside of the foam tread is lined with the
belt which provides structure and prevent deformation to
the tread. The chamber seals are used to prevent/reduce the
air flowing from the edge via like gaps, while the pressure
valve is driven by the suction motor to extract the air so
that a certain negative pressure in the chamber can be
controlled by the suction motor controller based on pro-
portional-integral-derivative (PID). The holes in the belt
allow the drive wheels to pull the belt with matching teeth,
and also serves as ports so that the air can be evacuated
from the circular openings in the foam. The ultra-high-
density foam is adaptable to surface irregularity and pro-
vides a rolling seal to the chamber. The chamber is evac-
uated by a 2.75-inch diameter vacuum impeller powered by
a light, quiet, and high-speed brushless motor. The cham-
ber is divided into three sections and contains two pressure
valves which close upon the breaking of a seal, virtually
increasing the number of independent chamber seals to
three.
The rotor package is with improved features for Rise-
Rover robot. The rotor package produces adhesion for the
drivetrain to scale vertical walls while the high-density
foam helps to reduce disturbance and muffle the impeller
noise. The design had several iterations of improvement
with multiple validation tests. We evaluated the relation-
ship between impeller speed and adhesion force, and the
improvement in noise/disturbance reduction. We found that
Fig. 3 Rise-Rover system
configuration
258 B. Li et al.
123
Page 5
it’s very important for the short-delay of the suction motor
control. The most critical test is to determine if the track
can rotate when it is pushed against the wall with maxi-
mum suction force. The experiment comes out that the
driving motor, when it is powerful enough, is able to
overcome the friction on the track and provide adequate
mobility. We also tested the valves function well in
dividing the chamber into multiple sections for indepen-
dent sealing effects.
4.2 Reliability design
For any wall-climbing robots working on the vertical
space, reliability is a very critical factor. Climbing robots
must be able to supply necessary adhesion force to
operate on various wall surfaces, attach to a wiring har-
ness for safety, and implement fault tolerance features to
deal with deep cracks/ditches and ledges/overhangs on
wall surfaces.
Since the Rise-Rover has three individual chamber seals
on each tread, any straight-line gaps cannot cross all
chamber seals at any given time. Thus, the robot is able to
cross over ditches.
Another novel reliability design is ducted fans to push
the robot in contact with vertical surface when it is sus-
pended in midair. The thick foam tread is deformable to
cope with surface irregularities that may exist. The pro-
pellers of two duct fans generate push force to allow re-
adhesion of the robot against vertical walls when it loses
contact with the surface. This feature is important in
dealing with ledges, overhangs and other obstruction above
the surface since it allows the robot to reach contact sur-
face. It allows the robot to reach a large variety of struc-
tures. When the robot is in good contact with the wall by
impeller adhesion, there is no need to activate the ducted
fan. However, when the adhesion is less than required,
propulsion force from the ducted fan will be helpful to
compensate the deficiency. The combination of impeller
Fig. 4 Exploded view of Rise-
Rover wall-climbing robot
Fig. 5 The cut-away drawing of
the drivetrain
Wall-climbing robot for non-destructive evaluation using IE and ML-SVM 259
123
Page 6
and propeller (duct fan) is a fault tolerant feature that
makes the robot a versatile machine which is capable of
scaling even on the most irregular surfaces. A cable reel
will be used to feed tether to the wall-climbing robot that
enhances safety, supplies power, and provides control
signals to operate Rise-Rover robot and inspection sensors.
4.3 Electronics design
The Rise-Rover platform was designed initially with mini-
mal control and sensing to reduce the mass of the overall
system and simplify the electronics configuration. Rise-
Rover is running on Ubuntu 14.04 ROS (Indigo) in a Nvidia
Jetson TX1 board, powered by a 3-Cell, 11.1-V 1200-mAh
Lithium Polymer battery. The electronic system of Rise-
Rover consists of two brushless vacuum motors with enco-
ders (up to 300 oz-in and 10K RPM), four brushed wheel
motors with encoders (100 oz-in and 3KRPM), four brushed
ducted fan motors (50 oz-in and 3K RPM), and a 2-linear
motion stage. External sensors include an IE NDE device, a
TED stereo camera, and a nine-axis Xsens IMU.
To ensure reliable adhesion for the vacuum suction
system, we designed a high-speed brushless DC motor
controller and driver board as shown in Fig. 6, which is
with a PIC24FJ48 microcontroller unit (MCU). It is com-
pactable in the dimension of 50 mm � 30 mm. By inte-
grating with a onboard pressure sensor, a proportional-
integral-derivative (PID) algorithm is implemented for
pressure control and robust fast step response.
The robot is equipped with a set of NDE impact-echo
device as shown in Fig. 3 including impactor (hardened
steel spheres) which can be selected in various sizes, a
cylindrical transducer and an analog-to-digital (AD) data
acquisition board. The impact action is controlled by servo
motor, the transducer transfers the received acoustic signal,
and it was sampled by the AD board. The transducer is
mounted on a 2-linear motion stage, so that the horizontal
stage enables the detection points in 2D, while the vertical
stage leads the transducer attaching or detaching the con-
crete plate surface.
5 Impact-echo inspection
After several design and test iterations, we have suc-
cessfully developed our Rise-Rover prototype (Fig. 2), with
impact-echo device installed on the robot (Fig. 7) to per-
form IE inspection. The mechanical characteristics of the
IE cylindrical transducer is in the diameter around 62 mm.
The diameter impacting sphere can be chosen in a series of
diameter sizes from 1.5–10 mm. The transducer produces a
voltage in the maximum range of 2.5 volts. More details
info of IE device can be referred to Impact-Echo Users
Manual1 from Impact-Echo Instruments, LLC.
It is the patterns of the waveforms and spectra (espe-
cially the latter) that provide information about the exis-
tence and locations of flaws (cracks, voids, delamination,
etc.) in concrete plates (Galt et al. 1997). The comparison
of the two signals with different frequencies during the
impact process is shown in Fig. 8. The reflected waveforms
differ in the aspect of d, which is the distance between the
Fig. 6 High-speed brushless
DC controller and driver
1 http://www.impact-echo.com/_resources/Impact-Echo-Manual.pdf
260 B. Li et al.
123
Page 7
impact knocking point and transducer. Cp is the propaga-
tion speed of the P wave in the medium.
5.1 Signal analysis
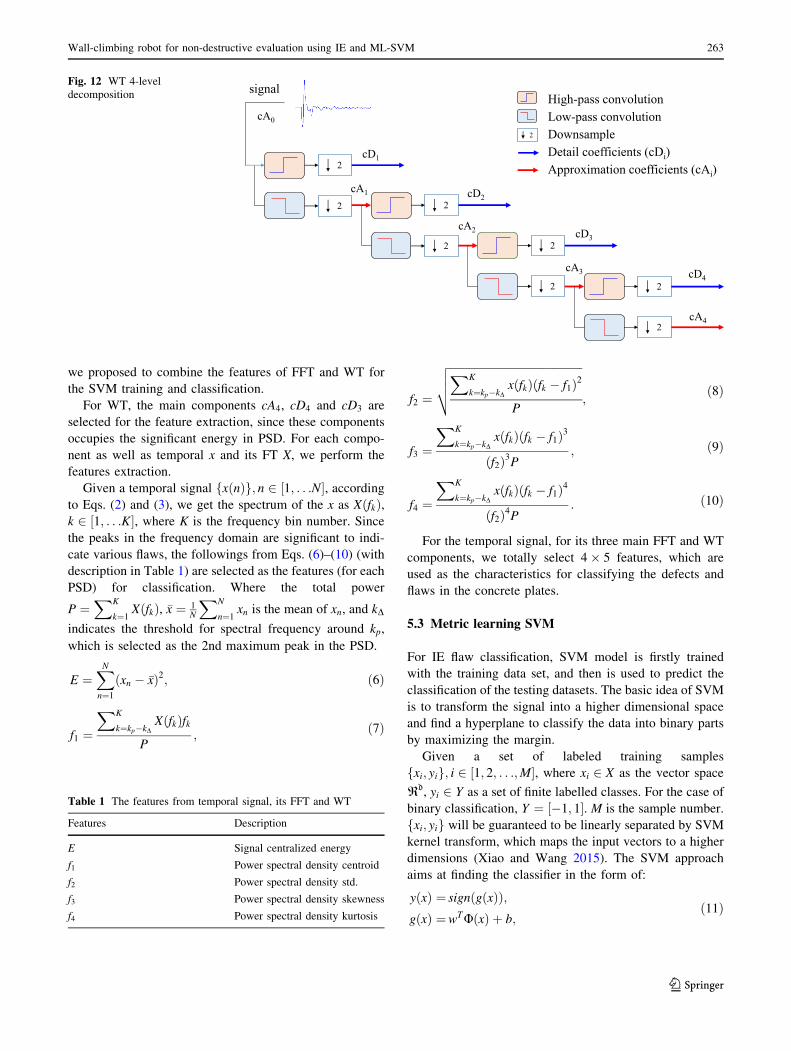
Figure 9 shows the methodology framework for the impact-
echo (IE) analysis. After the IE signals are acquired and
pre-processed with the de-noising, FFT and DWT are
performed. Then PSD and SDW coefficients are selected as
the pattern features for SVM. The distance metric learning
(ML) is applied to learn the Mahalanobis distance as the
marginal for the support vector distance for the hyperplane
classification using semi-definite programming (SDP).
5.1.1 FFT analysis
The IE signal is sampled and stored in the form of discrete
digital sequence, which we represent as a resultant below:
xn ¼ xn þ �n; n 2 ½1; :::;N�; ð1Þ
where N is the signal sampled temporal length, xn is the IE
signal, and �n is the contaminated noise.
To reduce the influence of contaminated noise in the
temporal signal, a de-noising filter is applied. For the noise
with proportional distribution in the frequency spectrum
(such as white noise), only the overall amplitude of the
frequency spectrum is distorted. In this way, a high fre-
quency rejected filter is applied, and the majority of the
selected feature patterns are retained and distortion is
suppressed.
Fourier transform (FT) is a powerful tool to analyze the
signal characteristics in the frequency domain, and it has
been applied conventionally to the IE analysis to determine
the internal cracks and flaws of concrete structure by the
peak analysis in the Fourier spectrum. a discrete-time
Fourier transform (DTFT) is applied for the N-periodic
temporal sequence samples, as the complex valued func-
tion shown in Eq. (2).
XðkÞ ¼XN�1
n¼0xðnÞe�2pjkn=N ; ð2Þ
x(n) is the discrete-time instant signal, X(k) is the DTFT
transformed frequency spectrum, and k 2 ½1; :::N� is the
real-valued discrete-frequency which is with periodicity.
The normalized power spectral density (PSD) distribu-
tion pattern of DTFT is defined as:
qðkÞ ¼ XðkÞ � X�ðkÞg
; k 2 ½1; :::N�; ð3Þ
where X�ðkÞ is the conjugation of X(k), and g is the nor-
malization factor to normalize the influence of the IE
strength, and is calculated by the sum of all numerator.
5.1.2 Wavelet transform
The wavelet transform (WT) is applied to extract the
salient features from IE signals in this research, and it’s
able to analyze the signals in both temporal and scale
information simultaneously, so that to capture the fre-
quency content of sudden changes in a certain time
interval.
Let’s denote Wða; fÞ as the WT of an IE signal x(n), we
have:
Wða; fÞ ¼ gXN�1
n¼0xðnÞU n� f
a
� �;
g ¼ 1ffiffiffiap ;
a ¼Wðf Þ;
ð4Þ
where UðtÞ is the mother function of wavelet decomposi-
tion, a is the dealation parameter as a function of pseudo-
frequency f, that a ¼ Wðf Þ is defined corresponding to the
selected wavelet function UðtÞ [which is Daubechies (dbN)
Wavelets in our cases]. f is the wavelet translation
Fig. 7 Rectangles from left to right: position limit switch, IE
transducer and IE impactor on Rise-Rover
Fig. 8 Frequency and depth of two compared waves
Wall-climbing robot for non-destructive evaluation using IE and ML-SVM 261
123
Page 8
parameter which is the middle of N. g is the normalized
factor for the unitary of each wavelet energy based on
wavelet function and the pseudo-frequency f.
Figure 10 shows the IE signal and its main discrete
wavelet transform (DWT) coefficients.
The density distribution of jWða; fÞj2 is called scalo-
gram, which represents the signal energy distribution in
time and frequency domain, and the temporal variation
information corresponding to f. The scalogram of an IE
signal is shown in Fig. 11. The wavelet marginal spectrum
(WMS) provides the pseudo-frequency f content of IE
signal in time domain, and can be obtained via the scalo-
gram by:
Mðf Þ ¼X
a
jWða; fÞj2
¼Xþ1
f¼1jWðWðf Þ; fÞj2:
ð5Þ
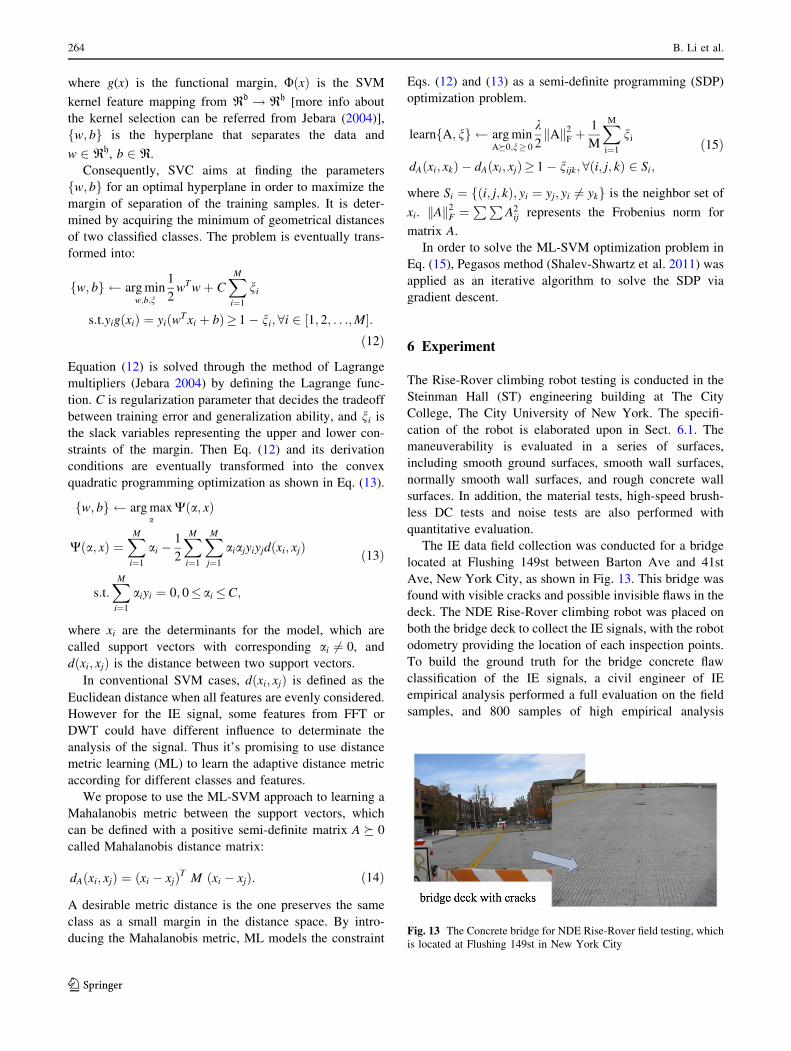
Discrete WT decomposes the IE signal into orthonormal
bases sets which are corresponding to scales or resolutions
of different time and frequency. A 4-level wavelet
decomposition is applied to decomposed the IE signals, and
the Daubechies dbN Wavelets is applied as the mother
wavelet functions (N is the vanishing moments number,
and two is selected from our experimental analysis). The
decomposition concept is shown in Fig. 12. Starting from
cA0 ¼ xðnÞ as the original temporal signal, and it’s
decomposed into the first-level of approximation cA1 and
detail coefficients cD1. Then the approximation of each
level is decomposed into a lower level of WT. Each
approximation includes the high-scale and low-frequency
components, while the detail coefficients includes the
components of low-scale and the high-frequency.
5.2 Pattern extraction
Before the classification for the IE signals of various flaws,
we perform the feature extraction, which indicates the
underlying features of the flaws for predictive models of
the metric learning SVM. Although WT is able to capture
the sudden changes of the IE signal, it comes with lower
frequency resolution compared with FT. In this research,
Fig. 9 Proposed methodology for the IE analysis
0 200 400 600 800 1000 1200 1400 1600 1800 2000t (ms)
-2
-1
0
1
2
(a) a
mpl
itude
A normal IE signal, and its DWT decomposition components
0 100 200 300 400 500 600n
-4
-2
0
2
4
(b) m
agni
tude
Fig. 10 IE signal and its DWT coefficients
Impact-Echo signal WT scalogram(percentage of energy for each wavelet coefficient)
200 400 600 800 1000 1200 1400 1600 1800 2000Time t (ms)
1 27 53 79105131157183209235261287313339365391417443469495
Sca
le a
(cor
resp
ondi
ng to
f)
1
1.5
2
2.5
3
3.5
4
4.5
5
10-3
Fig. 11 IE signal scalogram
262 B. Li et al.
123
Page 9
we proposed to combine the features of FFT and WT for
the SVM training and classification.
For WT, the main components cA4, cD4 and cD3 are
selected for the feature extraction, since these components
occupies the significant energy in PSD. For each compo-
nent as well as temporal x and its FT X, we perform the
features extraction.
Given a temporal signal fxðnÞg; n 2 ½1; . . .N�, accordingto Eqs. (2) and (3), we get the spectrum of the x as XðfkÞ,k 2 ½1; . . .K�, where K is the frequency bin number. Since
the peaks in the frequency domain are significant to indi-
cate various flaws, the followings from Eqs. (6)–(10) (with
description in Table 1) are selected as the features (for each
PSD) for classification. Where the total power
P ¼XK
k¼1 XðfkÞ, �x ¼1N
XN
n¼1 xn is the mean of xn, and kD
indicates the threshold for spectral frequency around kp,
which is selected as the 2nd maximum peak in the PSD.
E ¼XN
n¼1ðxn � �xÞ2; ð6Þ
f1 ¼
XK
k¼kp�kDXðfkÞfk
P;
ð7Þ
f2 ¼
ffiffiffiffiffiffiffiffiffiffiffiffiffiffiffiffiffiffiffiffiffiffiffiffiffiffiffiffiffiffiffiffiffiffiffiffiffiffiffiffiffiffiffiffiffiffiffiffiXK
k¼kp�kDxðfkÞðfk � f1Þ2
P
vuut;
ð8Þ
f3 ¼
XK
k¼kp�kDxðfkÞðfk � f1Þ3
ðf2Þ3P; ð9Þ
f4 ¼
XK
k¼kp�kDxðfkÞðfk � f1Þ4
ðf2Þ4P: ð10Þ
For the temporal signal, for its three main FFT and WT
components, we totally select 4� 5 features, which are
used as the characteristics for classifying the defects and
flaws in the concrete plates.
5.3 Metric learning SVM
For IE flaw classification, SVM model is firstly trained
with the training data set, and then is used to predict the
classification of the testing datasets. The basic idea of SVM
is to transform the signal into a higher dimensional space
and find a hyperplane to classify the data into binary parts
by maximizing the margin.
Given a set of labeled training samples
fxi; yig; i 2 ½1; 2; . . .;M�, where xi 2 X as the vector space
Rd, yi 2 Y as a set of finite labelled classes. For the case of
binary classification, Y ¼ ½�1; 1�. M is the sample number.
fxi; yig will be guaranteed to be linearly separated by SVM
kernel transform, which maps the input vectors to a higher
dimensions (Xiao and Wang 2015). The SVM approach
aims at finding the classifier in the form of:
yðxÞ ¼ signðgðxÞÞ;gðxÞ ¼wTUðxÞ þ b;
ð11Þ
Fig. 12 WT 4-level
decomposition
Table 1 The features from temporal signal, its FFT and WT
Features Description
E Signal centralized energy
f1 Power spectral density centroid
f2 Power spectral density std.
f3 Power spectral density skewness
f4 Power spectral density kurtosis
Wall-climbing robot for non-destructive evaluation using IE and ML-SVM 263
123
Page 10
where g(x) is the functional margin, UðxÞ is the SVM
kernel feature mapping from Rd ! Rh [more info about
the kernel selection can be referred from Jebara (2004)],
fw; bg is the hyperplane that separates the data and
w 2 Rh, b 2 R.
Consequently, SVC aims at finding the parameters
fw; bg for an optimal hyperplane in order to maximize the
margin of separation of the training samples. It is deter-
mined by acquiring the minimum of geometrical distances
of two classified classes. The problem is eventually trans-
formed into:
fw; bg argminw;b;n
1
2wTwþ C
XM
i¼1ni
s:t:yigðxiÞ ¼ yiðwTxi þ bÞ� 1� ni; 8i 2 ½1; 2; . . .;M�:ð12Þ
Equation (12) is solved through the method of Lagrange
multipliers (Jebara 2004) by defining the Lagrange func-
tion. C is regularization parameter that decides the tradeoff
between training error and generalization ability, and ni isthe slack variables representing the upper and lower con-
straints of the margin. Then Eq. (12) and its derivation
conditions are eventually transformed into the convex
quadratic programming optimization as shown in Eq. (13).
fw; bg argmaxa
Wða; xÞ
Wða; xÞ ¼XM
i¼1ai �
1
2
XM
i¼1
XM
j¼1aiajyiyjdðxi; xjÞ
s:t:XM
i¼1aiyi ¼ 0; 0� ai�C;
ð13Þ
where xi are the determinants for the model, which are
called support vectors with corresponding ai 6¼ 0, and
dðxi; xjÞ is the distance between two support vectors.
In conventional SVM cases, dðxi; xjÞ is defined as the
Euclidean distance when all features are evenly considered.
However for the IE signal, some features from FFT or
DWT could have different influence to determinate the
analysis of the signal. Thus it’s promising to use distance
metric learning (ML) to learn the adaptive distance metric
according for different classes and features.
We propose to use the ML-SVM approach to learning a
Mahalanobis metric between the support vectors, which
can be defined with a positive semi-definite matrix A 0
called Mahalanobis distance matrix:
dAðxi; xjÞ ¼ ðxi � xjÞT M ðxi � xjÞ: ð14Þ
A desirable metric distance is the one preserves the same
class as a small margin in the distance space. By intro-
ducing the Mahalanobis metric, ML models the constraint
Eqs. (12) and (13) as a semi-definite programming (SDP)
optimization problem.
learnfA; ng argminA0;n� 0
k2kAk2F þ
1
M
XM
i¼1ni
dAðxi; xkÞ � dAðxi; xjÞ� 1� nijk; 8ði; j; kÞ 2 Si;
ð15Þ
where Si ¼ fði; j; kÞ; yi ¼ yj; yi 6¼ ykg is the neighbor set of
xi. kAk2F ¼PP
A2ij represents the Frobenius norm for
matrix A.
In order to solve the ML-SVM optimization problem in
Eq. (15), Pegasos method (Shalev-Shwartz et al. 2011) was
applied as an iterative algorithm to solve the SDP via
gradient descent.
6 Experiment
The Rise-Rover climbing robot testing is conducted in the
Steinman Hall (ST) engineering building at The City
College, The City University of New York. The specifi-
cation of the robot is elaborated upon in Sect. 6.1. The
maneuverability is evaluated in a series of surfaces,
including smooth ground surfaces, smooth wall surfaces,
normally smooth wall surfaces, and rough concrete wall
surfaces. In addition, the material tests, high-speed brush-
less DC tests and noise tests are also performed with
quantitative evaluation.
The IE data field collection was conducted for a bridge
located at Flushing 149st between Barton Ave and 41st
Ave, New York City, as shown in Fig. 13. This bridge was
found with visible cracks and possible invisible flaws in the
deck. The NDE Rise-Rover climbing robot was placed on
both the bridge deck to collect the IE signals, with the robot
odometry providing the location of each inspection points.
To build the ground truth for the bridge concrete flaw
classification of the IE signals, a civil engineer of IE
empirical analysis performed a full evaluation on the field
samples, and 800 samples of high empirical analysis
Fig. 13 The Concrete bridge for NDE Rise-Rover field testing, which
is located at Flushing 149st in New York City
264 B. Li et al.
123
Page 11
certainty were further evaluated by the conventional SVM,
and ML-SVM with FFT and DWT analysis.
6.1 Rise-Rover climbing robot testing
The performance of the Rise-Rover is evaluated and the
specifications are summarized as follows:
Dimension of each drivetrain module: 8 inches � 21
inches � 5.5 inches.
The maximum normal suction force generated by each
module: 30 lbs.
Whole unit self-weight (two drivetrain modules plus
payload chamber): 24 lbs.
Pull-up force (i.e., payload carrying on vertical wall): 16
lbs.
Locomotion speed: 30 m/min.
Power consumption: Peak 4 KWh.
The Rise-Rover test videos can be seen at:2 and.3
6.1.1 Maneuverability test
The maneuverability of Rise-Rover was revealed in various
types of the wall surfaces, which includes: smooth ground
surface,4 smooth wall surface,5 normally smooth wall
surface (with small gaps),6 and rough concrete wall surface
(with big gaps).7 The designed Rise-Rover is also capable
of transiting from the ground to the surface wall.8 Exper-
iment of climbing in different directions, rotations and
overcoming gasp are carried out on the surface walls as
well. However in current stage, the Rise-Rover might
detach the wall surface when performs the wall transition,
so a re-adhesion mechanism using ducted fans is designed
to cope with this failure, then the robot is able to recover
the adhesion.
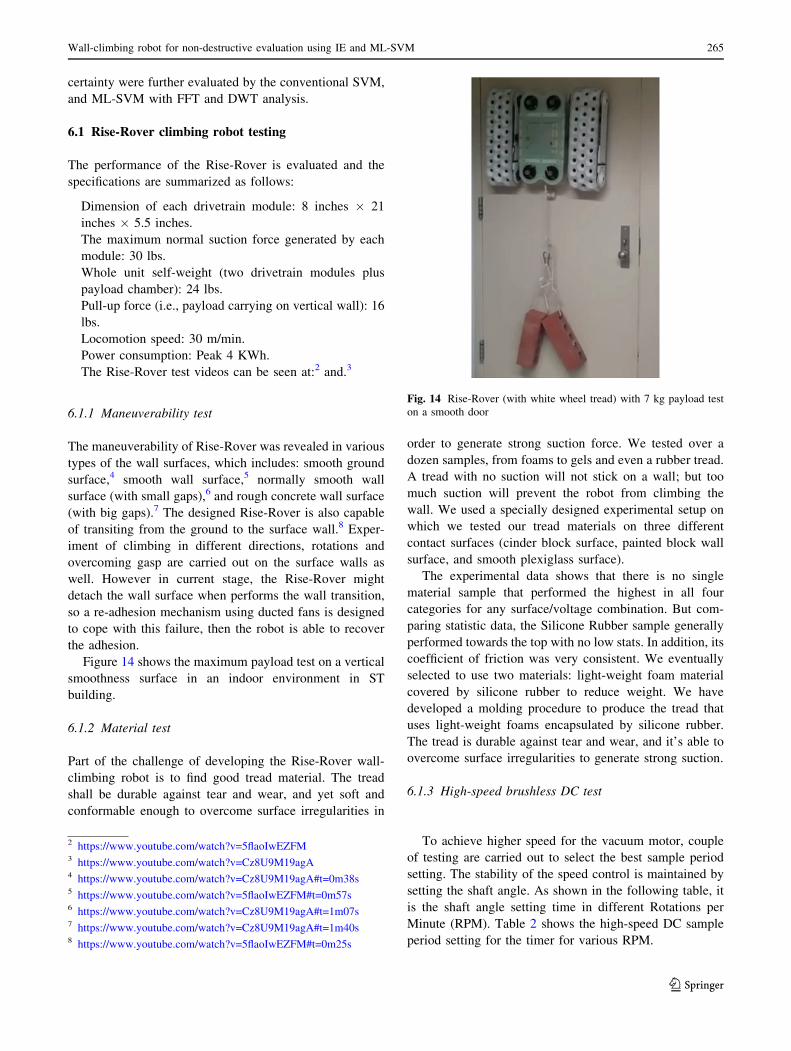
Figure 14 shows the maximum payload test on a vertical
smoothness surface in an indoor environment in ST
building.
6.1.2 Material test
Part of the challenge of developing the Rise-Rover wall-
climbing robot is to find good tread material. The tread
shall be durable against tear and wear, and yet soft and
conformable enough to overcome surface irregularities in
order to generate strong suction force. We tested over a
dozen samples, from foams to gels and even a rubber tread.
A tread with no suction will not stick on a wall; but too
much suction will prevent the robot from climbing the
wall. We used a specially designed experimental setup on
which we tested our tread materials on three different
contact surfaces (cinder block surface, painted block wall
surface, and smooth plexiglass surface).
The experimental data shows that there is no single
material sample that performed the highest in all four
categories for any surface/voltage combination. But com-
paring statistic data, the Silicone Rubber sample generally
performed towards the top with no low stats. In addition, its
coefficient of friction was very consistent. We eventually
selected to use two materials: light-weight foam material
covered by silicone rubber to reduce weight. We have
developed a molding procedure to produce the tread that
uses light-weight foams encapsulated by silicone rubber.
The tread is durable against tear and wear, and it’s able to
overcome surface irregularities to generate strong suction.
6.1.3 High-speed brushless DC test
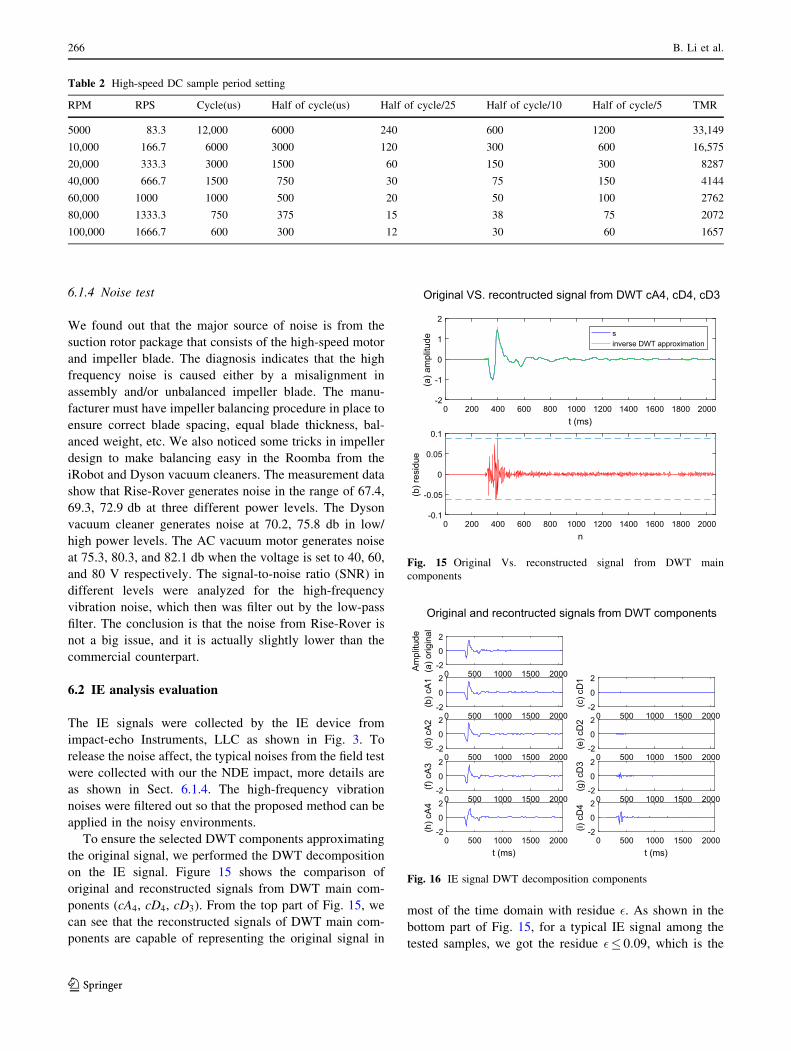
To achieve higher speed for the vacuum motor, couple
of testing are carried out to select the best sample period
setting. The stability of the speed control is maintained by
setting the shaft angle. As shown in the following table, it
is the shaft angle setting time in different Rotations per
Minute (RPM). Table 2 shows the high-speed DC sample
period setting for the timer for various RPM.
Fig. 14 Rise-Rover (with white wheel tread) with 7 kg payload test
on a smooth door
2 https://www.youtube.com/watch?v=5flaoIwEZFM3 https://www.youtube.com/watch?v=Cz8U9M19agA4 https://www.youtube.com/watch?v=Cz8U9M19agA#t=0m38s5 https://www.youtube.com/watch?v=5flaoIwEZFM#t=0m57s6 https://www.youtube.com/watch?v=Cz8U9M19agA#t=1m07s7 https://www.youtube.com/watch?v=Cz8U9M19agA#t=1m40s8 https://www.youtube.com/watch?v=5flaoIwEZFM#t=0m25s
Wall-climbing robot for non-destructive evaluation using IE and ML-SVM 265
123
Page 12
6.1.4 Noise test
We found out that the major source of noise is from the
suction rotor package that consists of the high-speed motor
and impeller blade. The diagnosis indicates that the high
frequency noise is caused either by a misalignment in
assembly and/or unbalanced impeller blade. The manu-
facturer must have impeller balancing procedure in place to
ensure correct blade spacing, equal blade thickness, bal-
anced weight, etc. We also noticed some tricks in impeller
design to make balancing easy in the Roomba from the
iRobot and Dyson vacuum cleaners. The measurement data
show that Rise-Rover generates noise in the range of 67.4,
69.3, 72.9 db at three different power levels. The Dyson
vacuum cleaner generates noise at 70.2, 75.8 db in low/
high power levels. The AC vacuum motor generates noise
at 75.3, 80.3, and 82.1 db when the voltage is set to 40, 60,
and 80 V respectively. The signal-to-noise ratio (SNR) in
different levels were analyzed for the high-frequency
vibration noise, which then was filter out by the low-pass
filter. The conclusion is that the noise from Rise-Rover is
not a big issue, and it is actually slightly lower than the
commercial counterpart.
6.2 IE analysis evaluation
The IE signals were collected by the IE device from
impact-echo Instruments, LLC as shown in Fig. 3. To
release the noise affect, the typical noises from the field test
were collected with our the NDE impact, more details are
as shown in Sect. 6.1.4. The high-frequency vibration
noises were filtered out so that the proposed method can be
applied in the noisy environments.
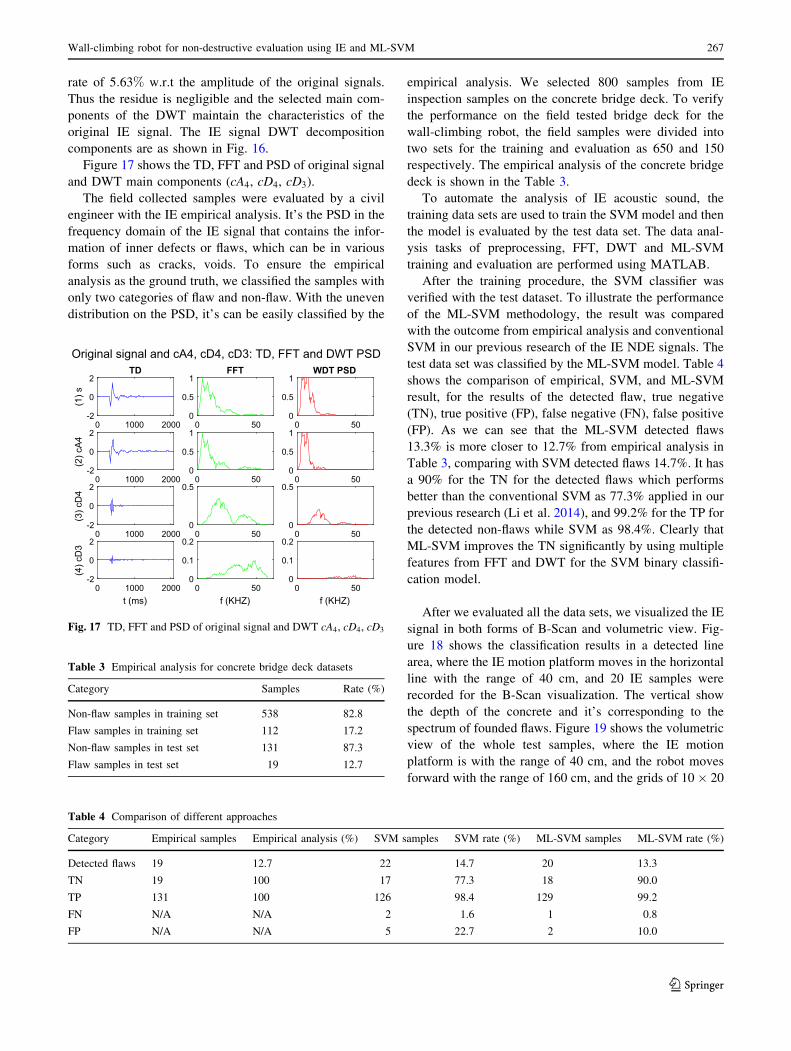
To ensure the selected DWT components approximating
the original signal, we performed the DWT decomposition
on the IE signal. Figure 15 shows the comparison of
original and reconstructed signals from DWT main com-
ponents (cA4, cD4, cD3). From the top part of Fig. 15, we
can see that the reconstructed signals of DWT main com-
ponents are capable of representing the original signal in
most of the time domain with residue �. As shown in the
bottom part of Fig. 15, for a typical IE signal among the
tested samples, we got the residue �� 0:09, which is the
Table 2 High-speed DC sample period setting
RPM RPS Cycle(us) Half of cycle(us) Half of cycle/25 Half of cycle/10 Half of cycle/5 TMR
5000 83.3 12,000 6000 240 600 1200 33,149
10,000 166.7 6000 3000 120 300 600 16,575
20,000 333.3 3000 1500 60 150 300 8287
40,000 666.7 1500 750 30 75 150 4144
60,000 1000 1000 500 20 50 100 2762
80,000 1333.3 750 375 15 38 75 2072
100,000 1666.7 600 300 12 30 60 1657
0 200 400 600 800 1000 1200 1400 1600 1800 2000t (ms)
-2
-1
0
1
2
(a) a
mpl
itude
sinverse DWT approximation
Original VS. recontructed signal from DWT cA4, cD4, cD3
0 200 400 600 800 1000 1200 1400 1600 1800 2000n
-0.1
-0.05
0
0.05
0.1
(b) r
esid
ue
Fig. 15 Original Vs. reconstructed signal from DWT main
components
0 500 1000 1500 2000-2
0
2
Am
plitu
de(a
) orig
inal
0 500 1000 1500 2000-2
0
2
(b) c
A1
0 500 1000 1500 2000-2
0
2
(c) c
D1
0 500 1000 1500 2000-2
0
2
(d) c
A2
0 500 1000 1500 2000-2
0
2
(e) c
D2
0 500 1000 1500 2000-2
0
2
(f) c
A3
0 500 1000 1500 2000-2
0
2
(g) c
D3
0 500 1000 1500 2000t (ms)
-2
0
2
(h) c
A4
Original and recontructed signals from DWT components
0 500 1000 1500 2000t (ms)
-2
0
2
(i) c
D4
Fig. 16 IE signal DWT decomposition components
266 B. Li et al.
123
Page 13
rate of 5:63% w.r.t the amplitude of the original signals.
Thus the residue is negligible and the selected main com-
ponents of the DWT maintain the characteristics of the
original IE signal. The IE signal DWT decomposition
components are as shown in Fig. 16.
Figure 17 shows the TD, FFT and PSD of original signal
and DWT main components (cA4, cD4, cD3).
The field collected samples were evaluated by a civil
engineer with the IE empirical analysis. It’s the PSD in the
frequency domain of the IE signal that contains the infor-
mation of inner defects or flaws, which can be in various
forms such as cracks, voids. To ensure the empirical
analysis as the ground truth, we classified the samples with
only two categories of flaw and non-flaw. With the uneven
distribution on the PSD, it’s can be easily classified by the
empirical analysis. We selected 800 samples from IE
inspection samples on the concrete bridge deck. To verify
the performance on the field tested bridge deck for the
wall-climbing robot, the field samples were divided into
two sets for the training and evaluation as 650 and 150
respectively. The empirical analysis of the concrete bridge
deck is shown in the Table 3.
To automate the analysis of IE acoustic sound, the
training data sets are used to train the SVM model and then
the model is evaluated by the test data set. The data anal-
ysis tasks of preprocessing, FFT, DWT and ML-SVM
training and evaluation are performed using MATLAB.
After the training procedure, the SVM classifier was
verified with the test dataset. To illustrate the performance
of the ML-SVM methodology, the result was compared
with the outcome from empirical analysis and conventional
SVM in our previous research of the IE NDE signals. The
test data set was classified by the ML-SVM model. Table 4
shows the comparison of empirical, SVM, and ML-SVM
result, for the results of the detected flaw, true negative
(TN), true positive (FP), false negative (FN), false positive
(FP). As we can see that the ML-SVM detected flaws
13.3% is more closer to 12.7% from empirical analysis in
Table 3, comparing with SVM detected flaws 14.7%. It has
a 90% for the TN for the detected flaws which performs
better than the conventional SVM as 77.3% applied in our
previous research (Li et al. 2014), and 99.2% for the TP for
the detected non-flaws while SVM as 98.4%. Clearly that
ML-SVM improves the TN significantly by using multiple
features from FFT and DWT for the SVM binary classifi-
cation model.
After we evaluated all the data sets, we visualized the IE
signal in both forms of B-Scan and volumetric view. Fig-
ure 18 shows the classification results in a detected line
area, where the IE motion platform moves in the horizontal
line with the range of 40 cm, and 20 IE samples were
recorded for the B-Scan visualization. The vertical show
the depth of the concrete and it’s corresponding to the
spectrum of founded flaws. Figure 19 shows the volumetric
view of the whole test samples, where the IE motion
platform is with the range of 40 cm, and the robot moves
forward with the range of 160 cm, and the grids of 10� 20
0 1000 2000-2
0
2
(1) s
TD
0 500
0.5
1FFT
0 500
0.5
1WDT PSD
0 1000 2000-2
0
2
(2) c
A4
0 500
0.5
1
0 500
0.5
1
0 1000 2000-2
0
2
(3) c
D4
0 500
0.5
0 500
0.5
0 1000 2000t (ms)
-2
0
2
(4) c
D3
0 50f (KHZ)
0
0.1
0.2
Original signal and cA4, cD4, cD3: TD, FFT and DWT PSD
0 50f (KHZ)
0
0.1
0.2
Fig. 17 TD, FFT and PSD of original signal and DWT cA4, cD4, cD3
Table 3 Empirical analysis for concrete bridge deck datasets
Category Samples Rate (%)
Non-flaw samples in training set 538 82.8
Flaw samples in training set 112 17.2
Non-flaw samples in test set 131 87.3
Flaw samples in test set 19 12.7
Table 4 Comparison of different approaches
Category Empirical samples Empirical analysis (%) SVM samples SVM rate (%) ML-SVM samples ML-SVM rate (%)
Detected flaws 19 12.7 22 14.7 20 13.3
TN 19 100 17 77.3 18 90.0
TP 131 100 126 98.4 129 99.2
FN N/A N/A 2 1.6 1 0.8
FP N/A N/A 5 22.7 2 10.0
Wall-climbing robot for non-destructive evaluation using IE and ML-SVM 267
123
Page 14
are used to detected the IE samples. The group position of
some detected points in the space can also indicate a high
possibility of flaws existing in the corresponding positions
of the inner bridge deck.
7 Conclusion
We proposed a novel wall-climbing robot (Rise-Rover)
which is equipped with an IE device, to perform NDE on
concrete structures based on FFT, WT and Metric learning
SVM. A novel vacuum suction module was newly
designed in the caterpillar chain-tracks wheels of the robot
to maintain adhesion reliability while ensuring the loco-
motion mobility. With the self-weight 24 lbs, the Rise-
Rover can carry 16 lbs on vertical wall at the locomotion
speed of 30 m/min. The IE signals were automatically
analyzed using both Fourier transform and Wavelet trans-
form, then the features were extracted based on the power
spectral density statistics, and a distance ML-SVM
approach was applied for the automatic classification. The
experiment shows that the Rise-Rover works effectively on
the vertical surface with small gaps or ditches. Future
research will focus on reducing the mechanical weight of
the motion platform so that it can perform inspection on
vertical concrete plates, and use other modalities (such as
vision, or GPR) of NDE for automatic inspection.
Acknowledgements This research was supported by US National
Science Foundation (NSF) I-Corps program and The Small Business
Technology Transfer (STTR) Phase-1 grant: Wall-climbing Robots
for Nondestructive Inspection to Ensure Sustainable Infrastructure,
and US Department. of Transportation (RITA/USDOT) Grant
49997-41-24: Robotic Inspection of Bridges Using impact-echo
Technology. The authors would like to thank Dr. Anil Agrawal and
Dr. Hongfan Wang at the Department of Civil Engineering, The City
College of New York, for providing guidance on empirical analysis
for our experiment on impact-generated stress wave on the concrete
bridge.
Fig. 18 2D B-Scan view of a
subset samples
Fig. 19 Volumetric view of
ML-SVM classified IE flaws
268 B. Li et al.
123
Page 15
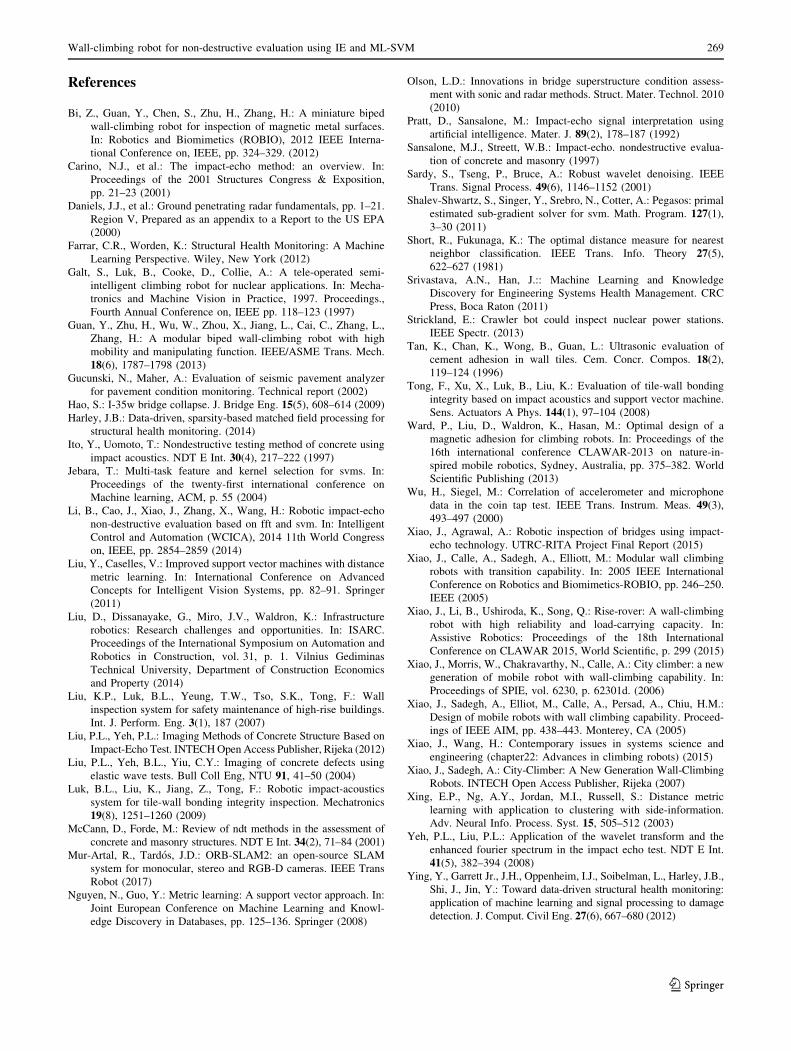
References
Bi, Z., Guan, Y., Chen, S., Zhu, H., Zhang, H.: A miniature biped
wall-climbing robot for inspection of magnetic metal surfaces.
In: Robotics and Biomimetics (ROBIO), 2012 IEEE Interna-
tional Conference on, IEEE, pp. 324–329. (2012)
Carino, N.J., et al.: The impact-echo method: an overview. In:
Proceedings of the 2001 Structures Congress & Exposition,
pp. 21–23 (2001)
Daniels, J.J., et al.: Ground penetrating radar fundamentals, pp. 1–21.
Region V, Prepared as an appendix to a Report to the US EPA
(2000)
Farrar, C.R., Worden, K.: Structural Health Monitoring: A Machine
Learning Perspective. Wiley, New York (2012)
Galt, S., Luk, B., Cooke, D., Collie, A.: A tele-operated semi-
intelligent climbing robot for nuclear applications. In: Mecha-
tronics and Machine Vision in Practice, 1997. Proceedings.,
Fourth Annual Conference on, IEEE pp. 118–123 (1997)
Guan, Y., Zhu, H., Wu, W., Zhou, X., Jiang, L., Cai, C., Zhang, L.,
Zhang, H.: A modular biped wall-climbing robot with high
mobility and manipulating function. IEEE/ASME Trans. Mech.
18(6), 1787–1798 (2013)
Gucunski, N., Maher, A.: Evaluation of seismic pavement analyzer
for pavement condition monitoring. Technical report (2002)
Hao, S.: I-35w bridge collapse. J. Bridge Eng. 15(5), 608–614 (2009)
Harley, J.B.: Data-driven, sparsity-based matched field processing for
structural health monitoring. (2014)
Ito, Y., Uomoto, T.: Nondestructive testing method of concrete using
impact acoustics. NDT E Int. 30(4), 217–222 (1997)
Jebara, T.: Multi-task feature and kernel selection for svms. In:
Proceedings of the twenty-first international conference on
Machine learning, ACM, p. 55 (2004)
Li, B., Cao, J., Xiao, J., Zhang, X., Wang, H.: Robotic impact-echo
non-destructive evaluation based on fft and svm. In: Intelligent
Control and Automation (WCICA), 2014 11th World Congress
on, IEEE, pp. 2854–2859 (2014)
Liu, Y., Caselles, V.: Improved support vector machines with distance
metric learning. In: International Conference on Advanced
Concepts for Intelligent Vision Systems, pp. 82–91. Springer
(2011)
Liu, D., Dissanayake, G., Miro, J.V., Waldron, K.: Infrastructure
robotics: Research challenges and opportunities. In: ISARC.
Proceedings of the International Symposium on Automation and
Robotics in Construction, vol. 31, p. 1. Vilnius Gediminas
Technical University, Department of Construction Economics
and Property (2014)
Liu, K.P., Luk, B.L., Yeung, T.W., Tso, S.K., Tong, F.: Wall
inspection system for safety maintenance of high-rise buildings.
Int. J. Perform. Eng. 3(1), 187 (2007)
Liu, P.L., Yeh, P.L.: Imaging Methods of Concrete Structure Based on
Impact-Echo Test. INTECHOpen Access Publisher, Rijeka (2012)
Liu, P.L., Yeh, B.L., Yiu, C.Y.: Imaging of concrete defects using
elastic wave tests. Bull Coll Eng, NTU 91, 41–50 (2004)
Luk, B.L., Liu, K., Jiang, Z., Tong, F.: Robotic impact-acoustics
system for tile-wall bonding integrity inspection. Mechatronics
19(8), 1251–1260 (2009)
McCann, D., Forde, M.: Review of ndt methods in the assessment of
concrete and masonry structures. NDT E Int. 34(2), 71–84 (2001)
Mur-Artal, R., Tardos, J.D.: ORB-SLAM2: an open-source SLAM
system for monocular, stereo and RGB-D cameras. IEEE Trans
Robot (2017)
Nguyen, N., Guo, Y.: Metric learning: A support vector approach. In:
Joint European Conference on Machine Learning and Knowl-
edge Discovery in Databases, pp. 125–136. Springer (2008)
Olson, L.D.: Innovations in bridge superstructure condition assess-
ment with sonic and radar methods. Struct. Mater. Technol. 2010
(2010)
Pratt, D., Sansalone, M.: Impact-echo signal interpretation using
artificial intelligence. Mater. J. 89(2), 178–187 (1992)
Sansalone, M.J., Streett, W.B.: Impact-echo. nondestructive evalua-
tion of concrete and masonry (1997)
Sardy, S., Tseng, P., Bruce, A.: Robust wavelet denoising. IEEE
Trans. Signal Process. 49(6), 1146–1152 (2001)
Shalev-Shwartz, S., Singer, Y., Srebro, N., Cotter, A.: Pegasos: primal
estimated sub-gradient solver for svm. Math. Program. 127(1),3–30 (2011)
Short, R., Fukunaga, K.: The optimal distance measure for nearest
neighbor classification. IEEE Trans. Info. Theory 27(5),622–627 (1981)
Srivastava, A.N., Han, J.:: Machine Learning and Knowledge
Discovery for Engineering Systems Health Management. CRC
Press, Boca Raton (2011)
Strickland, E.: Crawler bot could inspect nuclear power stations.
IEEE Spectr. (2013)
Tan, K., Chan, K., Wong, B., Guan, L.: Ultrasonic evaluation of
cement adhesion in wall tiles. Cem. Concr. Compos. 18(2),119–124 (1996)
Tong, F., Xu, X., Luk, B., Liu, K.: Evaluation of tile-wall bonding
integrity based on impact acoustics and support vector machine.
Sens. Actuators A Phys. 144(1), 97–104 (2008)
Ward, P., Liu, D., Waldron, K., Hasan, M.: Optimal design of a
magnetic adhesion for climbing robots. In: Proceedings of the
16th international conference CLAWAR-2013 on nature-in-
spired mobile robotics, Sydney, Australia, pp. 375–382. World
Scientific Publishing (2013)
Wu, H., Siegel, M.: Correlation of accelerometer and microphone
data in the coin tap test. IEEE Trans. Instrum. Meas. 49(3),493–497 (2000)
Xiao, J., Agrawal, A.: Robotic inspection of bridges using impact-
echo technology. UTRC-RITA Project Final Report (2015)
Xiao, J., Calle, A., Sadegh, A., Elliott, M.: Modular wall climbing
robots with transition capability. In: 2005 IEEE International
Conference on Robotics and Biomimetics-ROBIO, pp. 246–250.
IEEE (2005)
Xiao, J., Li, B., Ushiroda, K., Song, Q.: Rise-rover: A wall-climbing
robot with high reliability and load-carrying capacity. In:
Assistive Robotics: Proceedings of the 18th International
Conference on CLAWAR 2015, World Scientific, p. 299 (2015)
Xiao, J., Morris, W., Chakravarthy, N., Calle, A.: City climber: a new
generation of mobile robot with wall-climbing capability. In:
Proceedings of SPIE, vol. 6230, p. 62301d. (2006)
Xiao, J., Sadegh, A., Elliot, M., Calle, A., Persad, A., Chiu, H.M.:
Design of mobile robots with wall climbing capability. Proceed-
ings of IEEE AIM, pp. 438–443. Monterey, CA (2005)
Xiao, J., Wang, H.: Contemporary issues in systems science and
engineering (chapter22: Advances in climbing robots) (2015)
Xiao, J., Sadegh, A.: City-Climber: A New Generation Wall-Climbing
Robots. INTECH Open Access Publisher, Rijeka (2007)
Xing, E.P., Ng, A.Y., Jordan, M.I., Russell, S.: Distance metric
learning with application to clustering with side-information.
Adv. Neural Info. Process. Syst. 15, 505–512 (2003)
Yeh, P.L., Liu, P.L.: Application of the wavelet transform and the
enhanced fourier spectrum in the impact echo test. NDT E Int.
41(5), 382–394 (2008)
Ying, Y., Garrett Jr., J.H., Oppenheim, I.J., Soibelman, L., Harley, J.B.,
Shi, J., Jin, Y.: Toward data-driven structural health monitoring:
application of machine learning and signal processing to damage
detection. J. Comput. Civil Eng. 27(6), 667–680 (2012)
Wall-climbing robot for non-destructive evaluation using IE and ML-SVM 269
123
Page 16
Zhang, J.K., Yan, W., Cui, D.M.: Concrete condition assessment
using impact-echo method and extreme learning machines.
Sensors 16(4), 447 (2016)
Bing Li is a Ph.D student in
CCNY Robotics Lab at the
Department of Electrical Engi-
neering of The City College,
City University of New York.
He received his M.E, and B.E.
degree from Beihang University
and Beijing Forestry University,
Beijing, China, in 2009 and
2006 respectively. His research
interests include assistive
robotics, indoor navigation,
robotic NDE inspection,
machine learning, and 3D
SLAM.
Kenshin Ushiroda received a
Mechanical Engineering degree
from The City College, The
City University of New York in
2013. After receiving the NSF
Phase I SBIR grant, he worked
to develop a wall climbing
machine at the CCNY Robotics
Lab as the principle investiga-
tor. He was employed in 2017 at
3D Platforms as a Mechanical
Design Engineer to help
develop and produce a high
volume flow filament extruder
for their 3D printers.
Liang Yang is a Ph.D student at
The City College, City Univer-
sity of New York, and Ph.D
candidate of State Key Labora-
tory of Robotics, University of
Chinese Academy of Sciences.
He received his bachelor degree
from Shenyang Aerospace
University in 2012. From 2015,
he works as research assistant at
the Robotics Lab at the City
College of New York. He is
currently working at CCNY
Robotics Lab, he focuses on
visual navigation, SLAM, visual
inspection based on deep learning approach, and unmanned system.
Qiang Song received a MS
degree in control theory and
control engineering from
Taiyuan University of Technol-
ogy. From 2006 to 2012, He
worked as an associate profes-
sor in Taiyuan Institute of
Electrical Engineering. From
2010 to 2011. He worked as a
visiting scholar in The City
College, The City University of
New York. His research focuses
on the real-time embedded sys-
tem, motion algorithm and
control, circuit design etc.
Jizhong Xiao is a full professor
at the Department of Electrical
Engineering at The City Col-
lege, City University of New
York, where he has directed the
CCNY Robotics Lab since
2002. He received B.S. and M.S
from East China Institute of
Technology in 1990 and 1993
respectively, a M.Eng. from
Nanyang Technological
University, Singapore in 1999,
and a Ph.D. from Michigan
State University in 2002, His
research interests include the
wall-climbing robots, Micro-UAV, assistive navigation, and 3D
SLAM.
270 B. Li et al.
123