. 1 FOR IMMEDIATE RELEASE Contacts: Zenia Mucha November 18, 2004 818-560-5300 John Spelich 818-560-8543 THE WALT DISNEY COMPANY REPORTS RESULTS FOR THE YEAR AND QUARTER ENDED SEPTEMBER 30, 2004 • EPS before the cumulative effect of accounting change for the year increased sharply to $1.12 compared to $0.65 in the prior year, driven by segment operating income growth at all of the operating segments. • EPS for the fourth quarter increased to $0.25 from $0.20 in the prior- year quarter, helped by operating income growth at Media Networks, Parks and Resorts and Consumer Products, partially offset by a decrease at Studio Entertainment. • EPS for the fourth quarter was also favorably impacted by the settlement of certain income tax matters totaling approximately $0.06 per share as compared to a similar benefit of approximately $0.03 per share in the prior-year quarter. • Cash flow from operations and free cash flow for the year increased to record high levels for the Company of $4.4 billion and $2.9 billion, respectively. BURBANK, Calif. – The Walt Disney Company today reported higher fourth quarter earnings and significantly increased earnings and record cash flow for their fiscal year ended September 30, 2004. Diluted earnings per share for the year were $1.12, an increase of 72% compared to prior-year earnings per share of $0.65 before the cumulative effect of an accounting change. For the fourth quarter, diluted earnings per share were $0.25, compared to $0.20 in the prior-year fourth quarter.
Transcript
.
1
FOR IMMEDIATE RELEASE Contacts: Zenia Mucha November 18, 2004 818-560-5300 John Spelich 818-560-8543 THE WALT DISNEY COMPANY REPORTS RESULTS FOR THE YEAR
AND QUARTER ENDED SEPTEMBER 30, 2004 • EPS before the cumulative effect of accounting change for the year
increased sharply to $1.12 compared to $0.65 in the prior year, driven by segment operating income growth at all of the operating segments.
• EPS for the fourth quarter increased to $0.25 from $0.20 in the prior-
year quarter, helped by operating income growth at Media Networks, Parks and Resorts and Consumer Products, partially offset by a decrease at Studio Entertainment.
• EPS for the fourth quarter was also favorably impacted by the
settlement of certain income tax matters totaling approximately $0.06 per share as compared to a similar benefit of approximately $0.03 per share in the prior-year quarter.
• Cash flow from operations and free cash flow for the year increased
to record high levels for the Company of $4.4 billion and $2.9 billion, respectively.
BURBANK, Calif. – The Walt Disney Company today reported
higher fourth quarter earnings and significantly increased earnings and
record cash flow for their fiscal year ended September 30, 2004.
Diluted earnings per share for the year were $1.12, an increase of 72%
compared to prior-year earnings per share of $0.65 before the cumulative
effect of an accounting change.
For the fourth quarter, diluted earnings per share were $0.25,
compared to $0.20 in the prior-year fourth quarter.
.
2
"By any measure, 2004 was an outstanding year for The Walt Disney
Company," said Disney CEO Michael Eisner. "All three of our core
financial measures – cash flow, earnings per share and return on invested
capital – showed strong growth, and we increased our operating income at
each of our operating segments demonstrating the balanced nature of the
company's performance. As we begin the new fiscal year, our focus
remains on delivering long-term value to our shareholders through the
continued creation of the kind of outstanding content that widens the
global appeal of our great existing brands and helps build exciting new
ones."
.
3
Revenues, segment operating income, income before the cumulative
effect of accounting change, net income and diluted earnings per share
amounts for the year and quarter are as follows (in millions, except per
share amounts):
Year Ended
September 30, Three Months Ended
September 30, 2004(1) 2003 Change 2004(1) 2003 Change Revenues $ 30,752 $ 27,061 14 % $ 7,543 $ 7,014 8% Segment operating income $ 4,488 $ 3,174 41 % $ 899 $ 830 8% Income before the cumulative effect of accounting change $ 2,345 $ 1,338 75 % $ 516 $ 415 24% Net income $ 2,345 $ 1,267 85 % $ 516 $ 415 24% Diluted earnings per share before the cumulative effect of accounting change $ 1.12 $ 0.65 72 % $ 0.25 $ 0.20 25% Diluted earnings per share $ 1.12 $ 0.62 81 % $ 0.25 $ 0.20 25%
(1) As discussed further below, the Company adopted FASB Interpretation No. 46R, Consolidation of
Variable Interest Entities (FIN 46R) and as a result, consolidated the balance sheets of Euro Disney and Hong Kong Disneyland as of March 31, 2004 and the income and cash flow statements beginning April 1, 2004, the beginning of the Company’s current fiscal third quarter. Under FIN 46R transition rules, Euro Disney and Hong Kong Disneyland’s operating results continued to be accounted for on the equity method for the six month period ended March 31, 2004.
Earnings per share for the current year include a benefit in the fourth
quarter from the favorable settlement of certain income tax matters ($120
million or $0.06 per share). This benefit was partially offset by
restructuring and impairment charges ($64 million or $0.02 per share) in
connection with the sale of the Disney Stores in North America, the
majority of which were recorded in the third quarter. Earnings per share
for the prior year included a $0.04 negative impact due to the write-off of
an aircraft leveraged lease investment during the first quarter and a $0.03
benefit from the favorable settlement of certain income tax matters in the
fourth quarter. In the fourth quarter of 2003, the Company adopted EITF
.
4
No.00-21, Revenue Arrangements with Multiple Deliverables, which resulted
in an after-tax charge of $71 million for the cumulative effect of a change in
accounting principle as of the beginning of fiscal 2003.
Operating Results Media Networks
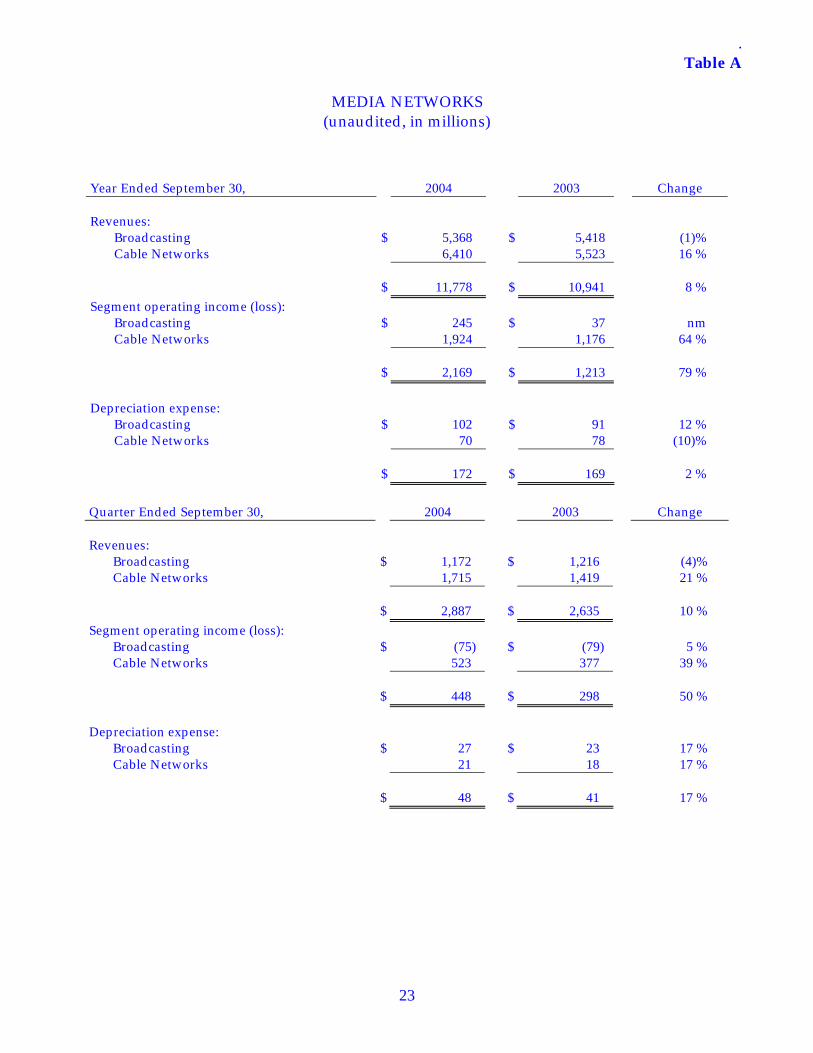
Media Networks revenues for the year increased 8% to $11.8 billion,
and segment operating income increased 79% to $2.2 billion. For the
quarter, revenues increased 10% to $2.9 billion and segment operating
income increased 50% to $448 million from $298 million in the prior year.
See Table A for further detail of Media Networks results.
For the year, segment operating income reflected stronger
performance at ESPN as a result of higher affiliate and advertising
revenues and lower NFL rights amortization, improvements at the ABC
Television network primarily due to higher advertising revenue, increases
at the domestic and international Disney Channels driven by higher
affiliate revenue, and growth at ABC Family due to higher advertising
revenue.
Segment operating income attributable to broadcasting improved by
$208 million for the year driven by higher advertising revenues at the ABC
Television Network and lower programming and production costs,
partially offset by higher pension and other administrative costs and
higher costs for the Company’s MovieBeam venture. Increased advertising
revenues were primarily due to higher rates at the ABC television network,
partially offset by lower ratings. Lower programming and production
costs reflected lower sports programming costs due primarily to the airing
.
5
of the Super Bowl in the prior year. Additionally, the prior year included
higher news production costs due to coverage of the military conflict in
Iraq.
For the fourth quarter, segment operating loss attributable to
broadcasting declined by $4 million, as higher advertising sales at the ABC
television network were largely offset by higher administrative costs and
higher MovieBeam costs.
Segment operating income attributable to cable increased by $748
million for the year, primarily due to higher affiliate and advertising
revenue at ESPN, lower NFL programming costs at ESPN, higher affiliate
revenue at the domestic and international Disney Channels, the favorable
impact of a bankruptcy settlement with a cable operator in Latin America
and higher advertising revenue at ABC Family. These increases were
partially offset by other programming, sales, marketing, pension, and
administrative cost increases. Higher affiliate revenue at ESPN was
primarily due to contractual rate adjustments while increases at the Disney
Channels were primarily due to subscriber growth. Lower NFL
programming costs were primarily due to lower amortization for the NFL
contract due to commencing the three-year option period. The increase in
advertising revenue at ABC Family was primarily due to increased ratings.
For the fourth quarter, segment operating income attributable to
cable increased by $146 million, primarily due to similar revenue gains as
discussed above, partially offset by higher sales, marketing and
programming cost increases.
.
6
Parks and Resorts
Parks and Resorts revenues for the year increased 21% to $7.8 billion
and segment operating income increased 17% to $1.1 billion. For the
quarter, revenues increased 31% to $2.2 billion and segment operating
income increased 25% to $282 million. The consolidation of Euro Disney
and Hong Kong Disneyland (principally Euro Disney) contributed $715
million of the increase in revenue and $64 million of the increase in
operating income for the year and $383 million and $49 million of the
increase in revenue and segment operating income for the quarter,
respectively. Excluding these consolidation impacts, revenue grew $623
million (or 10%) and segment operating income increased $102 million (or
11%) for the year; and for the quarter, revenue grew $131 million (or 8%)
and segment operating income increased $8 million (or 4%). See tables C,
D, E, F, and G for the impact of consolidating Euro Disney and Hong Kong
Disneyland.
Excluding the consolidation impacts, revenue and operating income
growth for the year was primarily driven by increases at Walt Disney
World. Growth for the quarter reflected improvements at Disneyland
primarily due to increased per capita guest spending driven by ticket price
increases and less discounting.
Revenue and operating income growth at the Walt Disney World
Resort for the year was primarily driven by higher theme park attendance,
hotel occupancy and guest spending at the theme parks. Higher visitation
at Walt Disney World from both domestic and international tourists as
well as Florida residents reflected the continued success of Mission:
SPACE, Mickey’s PhilharMagic and Disney’s Pop Century Resort and
.
7
improvements in travel and tourism. Increased guest spending was driven
by ticket price increases and less discounting. For the quarter, operating
income at Walt Disney World decreased slightly as increased guest
spending was offset by decreased attendance as a result of the Florida
hurricanes, which resulted in the temporary closure of the theme parks and
increased costs. Higher guest spending at Disneyland for the year and
quarter was also driven by ticket price increases and less discounting.
Costs and expenses increased $1.2 billion for the year, of which, $651
million was due to the consolidation of Euro Disney and, to a lesser extent,
Hong Kong Disneyland. For the quarter, costs and expenses increased
$457 million, of which $334 million was due to the consolidation of Euro
Disney and Hong Kong Disneyland. The remaining increases of $521
million and $123 million, for the year and quarter, respectively, were
driven primarily by higher labor and other volume related expenses and
increased costs for employee benefits, marketing and sales initiatives,
depreciation, new product offerings and information technology.
Studio Entertainment
Studio Entertainment revenue for the year increased 18% to $8.7
billion and segment operating income increased 7% to $662 million. For
the quarter, revenues decreased 14% to $1.9 billion and segment operating
income decreased to $23 million from $205 million in the prior-year
quarter.
Segment operating income growth for the year was primarily driven
by improvements in worldwide home entertainment and television
distribution, partially offset by declines in worldwide theatrical motion
picture distribution. The improvement in worldwide home entertainment
.
8
revenues was driven by higher DVD sales of current year titles including
Disney/Pixar’s Finding Nemo, Pirates of the Caribbean and The Lion King
Platinum Release as compared to the prior year, which included Lilo &
Stitch and Beauty and the Beast. Television distribution growth was driven
by higher pay television revenues due to better performing live-action
titles. Lower theatrical motion picture distribution revenues reflected the
weaker performance of current year titles including Home on the Range, The
Alamo and King Arthur as compared to the prior year, which included the
strong performances of Finding Nemo and Pirates of the Caribbean.
Lower segment operating income for the quarter was primarily due
to declines in worldwide home entertainment and worldwide theatrical
motion picture distribution, partially offset by improvements in television
distribution, as well as lower production and development write-offs. The
decrease in worldwide theatrical motion picture distribution results
reflected lower performance of current period titles compared to strong
prior year performances of Pirates of the Caribbean and Finding Nemo.
Lower domestic home entertainment revenues reflected weaker
performance of current period titles which included Kill Bill Vol. 2 and
Hidalgo, compared to the prior year quarter titles which included Chicago,
Bringing Down the House and Gangs of New York. Revenue increases in
television distribution reflected higher pay television revenues for live-
action titles.
.
9
Consumer Products
Consumer Products revenues for the year increased 7% to $2.5 billion
and segment operating income increased 39% to $534 million. Revenues
for the quarter increased 10% to $618 million and segment operating
income increased 43% to $146 million.
Higher segment operating income for the year was driven by an
improvement of $117 million at the Disney Store as well as increases at
merchandise licensing and publishing. The improvement at the Disney
Store was driven by cost reductions due to overhead savings, the impact of
the closure of underperforming stores in North America and margin
improvements. Merchandise licensing increases were due to higher sales
of the home infant gift collection, stationery products, fast moving
consumer goods, apparel and accessories driven by the strong performance
of Disney Princess and certain film properties. Growth at publishing was
primarily due to the strong performance of Finding Nemo books and
W.I.T.C.H. magazines.
Higher segment operating income for the quarter was primarily due
to an improvement of $48 million at the Disney Stores, due to the factors
described above.
Restructuring and Impairment Charges
On October 19, 2004, the Company entered into a definitive agreement
to sell substantially all of the Disney Store chain in North America under a
long-term licensing arrangement to a wholly-owned subsidiary of the
Children’s Place (“TCP”). Pursuant to the terms of the sale, the Disney
Store will retain its lease obligation and will be a wholly owned subsidiary
.
10
of TCP following the transaction. TCP will also pay the Company a royalty
on the physical retail store sales beginning on the second anniversary of
the closing date of the sale.
During the year, the Company recorded $64 million of restructuring
and impairment charges related to the Disney Store. The bulk of the charge
($50 million) was an impairment of the carrying value of the fixed assets
related to the stores to be sold which was recorded in the third quarter.
Additional charges recorded during the year related to the closure of stores
that would not be sold and to transaction costs related to the sale.
Subject to the satisfaction of certain closing conditions customary for a
transaction of this kind, such as third party consents and regulatory
approvals, the transaction is scheduled to close during November 2004.
Additional charges for working capital and other adjustments will be
reported at the date of closing. Additional transaction and restructuring
costs will also be recognized later in fiscal 2005. We expect that the total
costs that will be recorded in fiscal 2005 could range from $40 million to
$50 million.
Corporate and Unallocated Shared Expenses
Corporate and unallocated shared expenses decreased 3% for the
year and the fourth quarter to $428 million and $144 million, respectively.
The current year reduction reflected favorable legal settlements, partially
offset by higher legal and other administrative costs.
.
11
Net Interest Expense
Net interest expense was as follows (in millions):
Interest and investment income (loss) 28 (13) 12 5 Net interest expense $ (617) $ (793) $ (171) $ (134)
Excluding an increase of $51 million for the year and $24 million for
the quarter due to the consolidation of Euro Disney and Hong Kong
Disneyland, interest expense decreased $88 million (or 13%) for the year
and increased $4 million (or 3%) for the quarter. Lower interest expense
for the year was primarily due to lower average debt balances.
Interest and investment income (loss) for the year, was income of $28
million compared to a loss of $13 million in the prior year. The current year
includes interest income for Euro Disney and Hong Kong Disneyland,
while the prior-year period included a loss on the early repayment of
certain borrowings.
Equity in the Income of Investees
Income from equity investees, consisting primarily of A&E
Television, Lifetime Television and E! Entertainment Television, increased
11% to $372 million for the year and decreased 21% to $72 million for the
quarter. The current year increase was driven by stronger performance at
A&E, Lifetime, and E! Entertainment Television. The improvements at
A&E and E! were driven by advertising revenue increases and the increase
.
12
at Lifetime was due to lower programming costs. The decrease during the
quarter reflected higher programming costs at Lifetime and E!
Entertainment.
Income Taxes
The effective income tax rate was 32.0% for the year and 10.0% for
the fourth quarter compared to 35.0% and 27.0% for the prior year and
fourth quarter, respectively. Both the year and fourth quarter comparisons
were affected by the income tax settlements discussed above.
Stock Repurchases
During the fourth quarter, the Company repurchased 14.9 million
shares of Disney common stock for approximately $335 million. As of
September 30, 2004, the Company had authorization in place to repurchase
approximately 315 million additional shares.
.
13
Borrowings and Cash Flow
Total borrowings and net borrowings are detailed below (in
millions):
Sept. 30, 2004
Sept. 30, 2003
Change
Amounts including Euro Disney and Hong Kong Disneyland (1): Current portion of borrowings (2) $ 4,093 $ 2,457 $ 1,636Long-term borrowings 9,395 10,643 (1,248)Total borrowings 13,488 13,100 388Less: cash and cash equivalents (2,042) (1,583) (459)Net borrowings (3) $ 11,446 $ 11,517 $ (71) Net borrowings (3) $ 11,446 $ 11,517 $ (71)Less: net borrowings of Euro Disney and Hong Kong Disneyland (2,454) — (2,454)Net borrowings excluding Euro Disney and Hong Kong Disneyland (4) $ 8,992 $ 11,517 $ (2,525)
(1) As discussed below, pursuant to FIN 46R, the Company has consolidated the balance sheets of Euro Disney and Hong Kong Disneyland as of March 31, 2004.
(2) All of Euro Disney’s borrowings totaling $2.2 billion are classified as current liabilities in the consolidated balance sheet as they are subject to acceleration if the current restructuring plan is not finalized.
(3) Net borrowings is a non-GAAP financial metric. See the discussion of non-GAAP financial metrics that follows.
(4) Net borrowings excluding Euro Disney and Hong Kong Disneyland is a non-GAAP financial metric. See the discussion of non-GAAP financial metrics that follows below. Excluding the impact of consolidating Euro Disney and Hong Kong
Disneyland, net borrowings decreased from $11.5 billion at September 30,
2003 to $9.0 billion at September 30, 2004 as free cash flow was used to pay
down borrowings.
.
14
Cash provided by operations and free cash flow are detailed below
(in millions):
Year Ended
September 30, 2004 2003 Change Cash provided by operations $ 4,370 $ 2,901 $ 1,469Investments in parks, resorts and other property (1,427) (1,049) (378)Free cash flow (1) $ 2,943 $ 1,852 $ 1,091
(1) Free cash flow is a non-GAAP financial metric. See the discussion of non-GAAP financial metrics that follows below.
The increase in free cash flow for the year as compared to the prior
year was due primarily to increased net income and lower film and
television spending (the latter due in large part to timing). The Company
expects to incur a higher net cash investment in film and television
productions in fiscal 2005. The increases in fiscal 2004 were partially offset
by higher capital expenditures which included the impact of consolidating
Euro Disney and Hong Kong Disneyland.
.
15
Investments in parks, resorts and other property were primarily for
new rides and attractions at the theme parks and for company-wide
information technology projects at corporate. Capital expenditures by
business segment are as follows (in millions):
Year Ended September 30, 2004 2003 Media Networks $ 221 $ 203 Parks and Resorts: Domestic 719 577 International(1) 289 — Studio Entertainment 39 49 Consumer Products 14 44 Corporate and unallocated shared expenditures 145 176 $ 1,427 $ 1,049
(1) Represents 100% of Euro Disney and Hong Kong Disneyland’s capital expenditures beginning April 1, 2004. Capital expenditures for Hong Kong Disneyland totaled $251 million of which $202 million was funded by partner contributions and bank borrowings which are included in financing activities in the consolidated statement of cash flows.
Non-GAAP Financial Metrics
This earnings release presents net borrowings, net borrowings
excluding Euro Disney and Hong Kong Disneyland, free cash flow and
aggregate segment operating income which are important financial metrics
for the Company but are not GAAP-defined metrics.
Net borrowings – The Company believes that net borrowings provide
investors with useful information regarding our financial condition. Net
borrowings reflect the subtraction of cash and cash equivalents from total
borrowings. Since we earn interest income on our cash balances that
offsets a portion of the interest expense we pay on our borrowings, net
borrowings can be used as a measure to gauge net interest expense. In
addition, a portion of our cash and cash equivalents is available to repay
.
16
outstanding indebtedness when the indebtedness matures or when other
circumstances arise. However, we may not immediately apply cash and
cash equivalents to the reduction of debt, nor do we expect that we would
use all of our available cash and cash equivalents to repay debt in the
ordinary course of business.
Net borrowings excluding Euro Disney and Hong Kong Disneyland – The
Company uses net borrowings excluding Euro Disney and Hong Kong
Disneyland to evaluate direct claims on the general assets of the Company
separate from the direct claims on the assets of Euro Disney and Hong
Kong Disneyland. The Company believes that this information is useful to
investors because it allows investors to evaluate the effects on our
borrowings and cash and cash equivalents resulting from the adoption of
FIN 46R.
The following table reconciles net borrowings excluding Euro Disney
and Hong Kong Disneyland to total borrowings and net borrowings at
September 30, 2004 (in millions):
Amounts excluding Euro
Disney and Hong Kong Disneyland
Euro Disney and Hong Kong
Disneyland Total Current portion of borrowings $ 1,872 $ 2,221 $ 4,093 Long-term borrowings 8,850 545 9,395 Total borrowings 10,722 2,766 13,488 Cash and cash equivalents (1,730) (312) (2,042) Net borrowings $ 8,992 $ 2,454 $ 11,446
Free cash flow - The Company uses free cash flow (cash flow from
operations less investments in parks, resorts and other property), among
other measures, to evaluate the ability of its operations to generate cash
that is available for purposes other than capital expenditures.
.
17
Management believes free cash flow provides investors with an important
perspective on the cash available to service debt, make strategic
acquisitions and investments and pay dividends.
Aggregate segment operating income - The Company evaluates the
performance of its operating segments based on segment operating
income, and management uses aggregate segment operating income as a
measure of the performance of operating businesses separate from non-
operating factors. The Company believes that aggregate segment
operating income assists investors by allowing them to evaluate changes in
the operating results of the Company's portfolio of businesses separate
from non-operational factors that affect net income, thus providing
separate insight into both operations and the other factors that affect
reported results.
These measures should be used in conjunction with GAAP financial
measures and are not presented as alternative measures of borrowings,
cash flow or net income as determined in accordance with GAAP. Net
borrowings, net borrowings excluding Euro Disney and Hong Kong
Disneyland, free cash flow and aggregate segment operating income as we
have calculated them may not be comparable to similarly titled measures
reported by other companies.
.
18
FORWARD-LOOKING STATEMENTS
Management believes certain statements in this earnings release may
constitute “forward-looking statements” within the meaning of the Private
Securities Litigation Reform Act of 1995. These statements are made on the
basis of management’s views and assumptions regarding future events
and business performance as of the time the statements are made and
management does not undertake any obligation to update these
statements. Actual results may differ materially from those expressed or
implied. Such differences may result from actions taken by the Company,
including restructuring or strategic initiatives and information technology
improvements, as well as from developments beyond the Company’s
control, including international, political, health concern, weather related
and military developments that may affect travel and leisure businesses
generally and changes in domestic and global economic conditions that
may, among other things, affect the performance of the Company’s
theatrical and home entertainment releases, the advertising market for
broadcast and cable television programming, expenses of providing
medical and pension benefits and demand for consumer products.
Changes in domestic competitive conditions and technological
developments may also affect performance of all significant company
businesses.
Additional factors are set forth in the Company’s Annual Report on
Form 10-K for the year ended September 30, 2003 under the heading
“Factors that may affect forward-looking statements.”
.
19
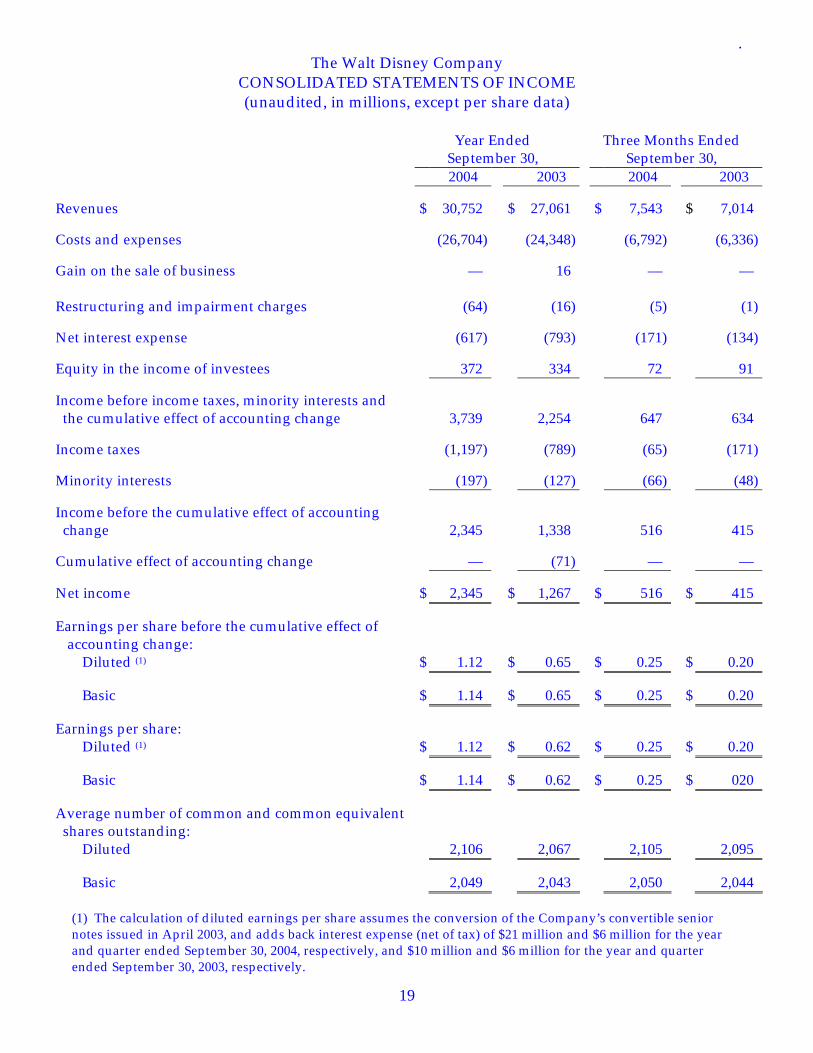
The Walt Disney Company CONSOLIDATED STATEMENTS OF INCOME (unaudited, in millions, except per share data)
Year Ended
September 30, Three Months Ended
September 30, 2004 2003 2004 2003
Revenues $ 30,752 $ 27,061 $ 7,543 $ 7,014
Costs and expenses (26,704) (24,348) (6,792) (6,336)
Gain on the sale of business — 16 — — Restructuring and impairment charges (64) (16) (5) (1)
Net interest expense (617) (793) (171) (134)
Equity in the income of investees 372 334 72 91
Income before income taxes, minority interests and the cumulative effect of accounting change 3,739 2,254 647 634
Income taxes (1,197) (789) (65) (171)
Minority interests (197) (127) (66) (48)
Income before the cumulative effect of accounting change 2,345 1,338 516 415
Cumulative effect of accounting change — (71) — — Net income $ 2,345 $ 1,267 $ 516 $ 415 Earnings per share before the cumulative effect of
(1) The calculation of diluted earnings per share assumes the conversion of the Company’s convertible senior notes issued in April 2003, and adds back interest expense (net of tax) of $21 million and $6 million for the year and quarter ended September 30, 2004, respectively, and $10 million and $6 million for the year and quarter ended September 30, 2003, respectively.
The Company evaluates the performance of its operating segments based on segment operating income. A reconciliation of segment operating income to income before income taxes, minority interests and the cumulative effect of accounting change is as follows:
Year Ended
September 30, Three Months Ended
September 30, 2004 2003 2004 2003
Segment operating income $ 4,488 $ 3,174 $ 899 $ 830 Corporate and unallocated shared expenses (428) (443) (144) (148) Amortization of intangible assets (12) (18) (4) (4) Gain on the sale of business — 16 — — Restructuring and impairment charges (64) (16) (5) (1) Net interest expense (617) (793) (171) (134) Equity in the income of investees 372 334 72 91 Income before income taxes, minority interests and the cumulative effect of accounting change $ 3,739 $ 2,254 $ 647 $ 634 Depreciation expense is as follows:
Year Ended
September 30, Three Months Ended
September 30, 2004 2003 2004 2003 Media Networks $ 172 $ 169 $ 48 $ 41 Parks and Resorts Domestic 710 681 170 152 International(1) 95 — 47 — Studio Entertainment 22 39 8 11 Consumer Products 44 63 6 16 Segment depreciation expense 1,043 952 279 220 Corporate 155 107 47 27 Total depreciation expense $ 1,198 $ 1,059 $ 326 $ 247 Segment depreciation expense is included in segment operating income and corporate depreciation expense is included in corporate and unallocated shared expenses. (1) Represents 100% of Euro Disney and Hong Kong Disneyland’s depreciation expense beginning April 1, 2004, the start of the Company’s third quarter of fiscal 2004.
.
21
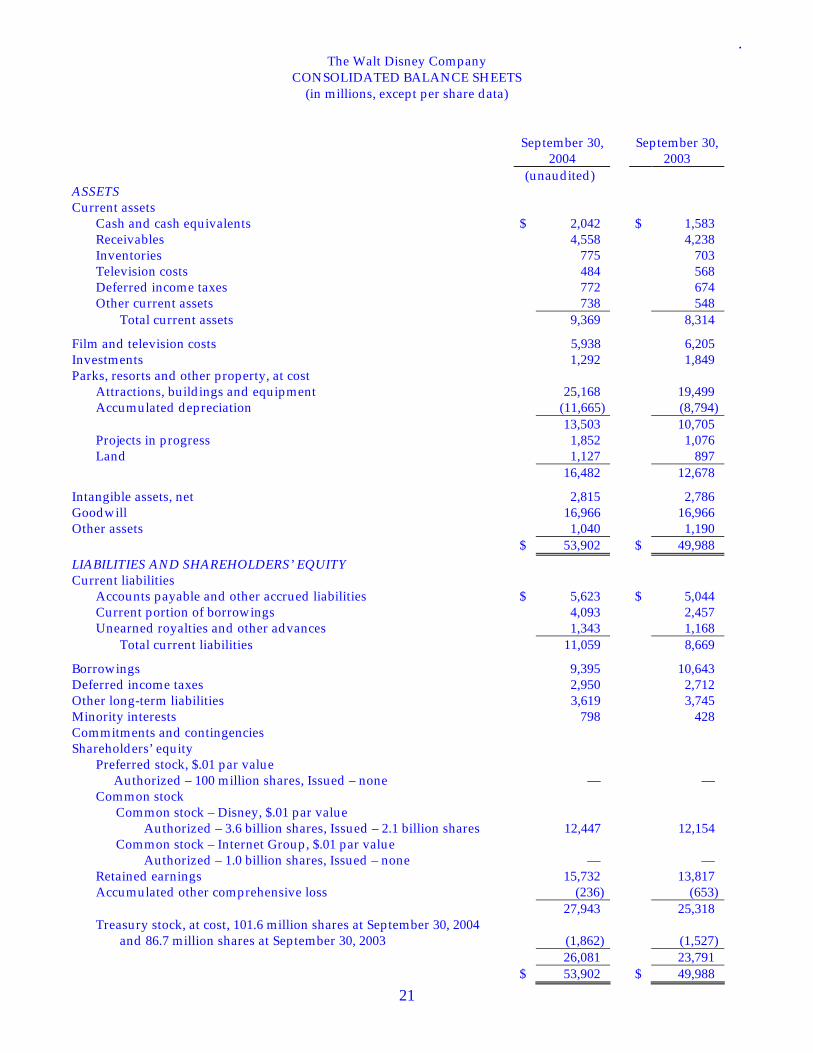
The Walt Disney Company CONSOLIDATED BALANCE SHEETS
(in millions, except per share data)
September 30, 2004
September 30, 2003
(unaudited) ASSETS Current assets
Cash and cash equivalents $ 2,042 $ 1,583 Receivables 4,558 4,238 Inventories 775 703 Television costs 484 568 Deferred income taxes 772 674 Other current assets 738 548
Total current assets 9,369 8,314
Film and television costs 5,938 6,205 Investments 1,292 1,849 Parks, resorts and other property, at cost
Attractions, buildings and equipment 25,168 19,499 Accumulated depreciation (11,665) (8,794)
13,503 10,705 Projects in progress 1,852 1,076 Land 1,127 897
16,482 12,678
Intangible assets, net 2,815 2,786 Goodwill 16,966 16,966 Other assets 1,040 1,190 $ 53,902 $ 49,988 LIABILITIES AND SHAREHOLDERS’ EQUITY Current liabilities
Accounts payable and other accrued liabilities $ 5,623 $ 5,044 Current portion of borrowings 4,093 2,457 Unearned royalties and other advances 1,343 1,168
Total current liabilities 11,059 8,669
Borrowings 9,395 10,643 Deferred income taxes 2,950 2,712 Other long-term liabilities 3,619 3,745 Minority interests 798 428 Commitments and contingencies Shareholders’ equity
Preferred stock, $.01 par value Authorized – 100 million shares, Issued – none — — Common stock Common stock – Disney, $.01 par value Authorized – 3.6 billion shares, Issued – 2.1 billion shares 12,447 12,154 Common stock – Internet Group, $.01 par value Authorized – 1.0 billion shares, Issued – none — — Retained earnings 15,732 13,817 Accumulated other comprehensive loss (236) (653)
27,943 25,318 Treasury stock, at cost, 101.6 million shares at September 30, 2004
and 86.7 million shares at September 30, 2003 (1,862) (1,527) 26,081 23,791
$ 53,902 $ 49,988
.
22
The Walt Disney Company
CONSOLIDATED STATEMENTS OF CASH FLOWS (unaudited, in millions)
Year Ended September 30,
2004 2003 OPERATING ACTIVITIES Net income $ 2,345 $ 1,267 Depreciation 1,198 1,059 Amortization of intangible assets 12 18 Deferred income taxes (98) 441 Equity in the income of investees (372) (334) Cash distributions received from equity investees 408 340 Restructuring and impairment charges 52 13 Write-off of aircraft leveraged lease 16 114 Minority interests 197 127 Change in film and television costs 460 (369) Changes in noncurrent assets and liabilities, and other 203 (39) 2,076 1,370 Changes in working capital Receivables (115) (194) Inventories (40) (6) Other current assets (89) (28) Accounts payable and other accrued liabilities 237 275 Television costs (44) 217 (51) 264
Cash provided by operations 4,370 2,901 INVESTING ACTIVITIES Investments in parks, resorts and other property (1,427) (1,049) Other (57) 15 Cash used by investing activities (1,484) (1,034) FINANCING ACTIVITIES Borrowings 176 1,635 Reduction of borrowings (2,479) (2,059) Commercial paper borrowings, net 100 (721) Repurchases of common stock (335) — Dividends (430) (429) Minority partner contributions 66 — Exercise of stock options and other 201 51 Cash used by financing activities (2,701) (1,523) Increase in cash and cash equivalents 185 344 Cash and cash equivalents due to the initial consolidation of Euro Disney and Hong Kong Disneyland
274 —
Cash and cash equivalents, beginning of period 1,583 1,239 Cash and cash equivalents, end of period $ 2,042 $ 1,583
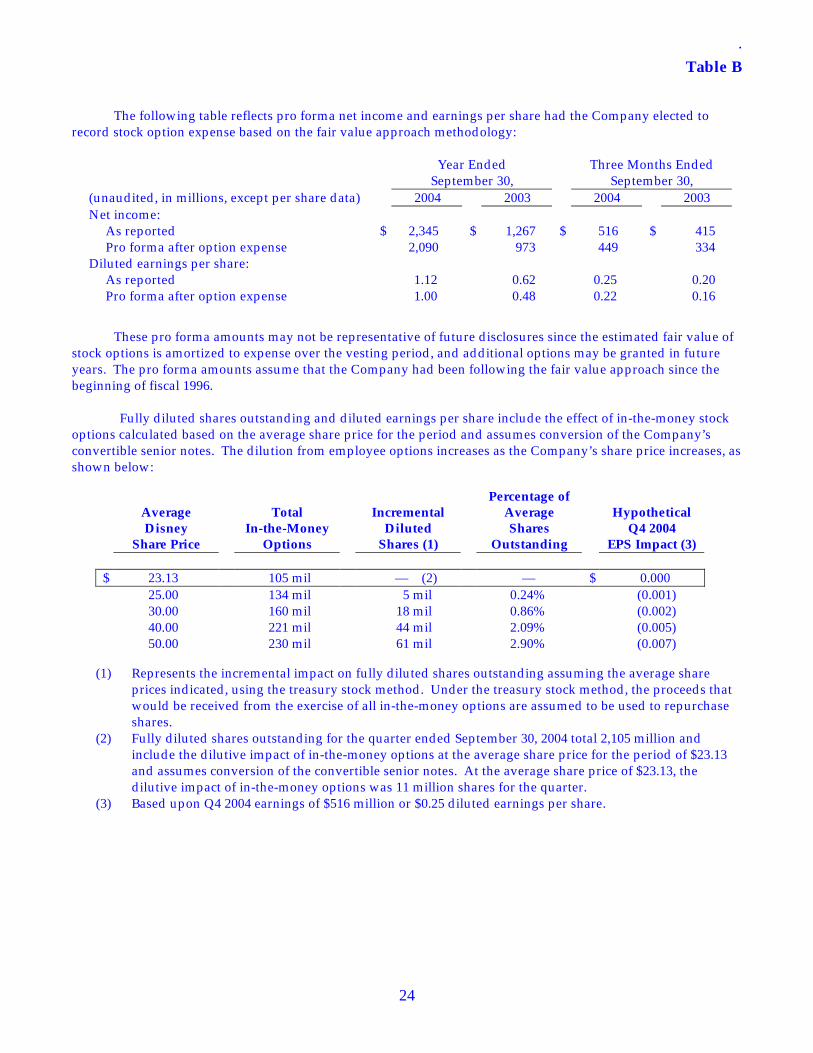
The following table reflects pro forma net income and earnings per share had the Company elected to
record stock option expense based on the fair value approach methodology:
Year Ended September 30,
Three Months Ended September 30,
(unaudited, in millions, except per share data) 2004 2003 2004 2003 Net income: As reported $ 2,345 $ 1,267 $ 516 $ 415 Pro forma after option expense 2,090 973 449 334 Diluted earnings per share: As reported 1.12 0.62 0.25 0.20 Pro forma after option expense 1.00 0.48 0.22 0.16
These pro forma amounts may not be representative of future disclosures since the estimated fair value of stock options is amortized to expense over the vesting period, and additional options may be granted in future years. The pro forma amounts assume that the Company had been following the fair value approach since the beginning of fiscal 1996.
Fully diluted shares outstanding and diluted earnings per share include the effect of in-the-money stock
options calculated based on the average share price for the period and assumes conversion of the Company’s convertible senior notes. The dilution from employee options increases as the Company’s share price increases, as shown below:
Average Disney
Share Price
Total
In-the-Money Options
Incremental
Diluted Shares (1)
Percentage of Average Shares
Outstanding
Hypothetical
Q4 2004 EPS Impact (3)
$ 23.13 105 mil — (2) — $ 0.000 25.00 134 mil 5 mil 0.24% (0.001) 30.00 160 mil 18 mil 0.86% (0.002) 40.00 221 mil 44 mil 2.09% (0.005) 50.00 230 mil 61 mil 2.90% (0.007)
(1) Represents the incremental impact on fully diluted shares outstanding assuming the average share
prices indicated, using the treasury stock method. Under the treasury stock method, the proceeds that would be received from the exercise of all in-the-money options are assumed to be used to repurchase shares.
(2) Fully diluted shares outstanding for the quarter ended September 30, 2004 total 2,105 million and include the dilutive impact of in-the-money options at the average share price for the period of $23.13 and assumes conversion of the convertible senior notes. At the average share price of $23.13, the dilutive impact of in-the-money options was 11 million shares for the quarter.
(3) Based upon Q4 2004 earnings of $516 million or $0.25 diluted earnings per share.
.
25
Table C
The Walt Disney Company CONDENSED CONSOLIDATING INCOME STATEMENT WORKSHEET
(unaudited, in millions)
In December 2003, the Financial Accounting Standards Board amended FASB Interpretation No. 46, Consolidation of Variable Interest Entities (FIN 46) by issuing FIN 46R which generally deferred the effective date of FIN 46 to March 31, 2004. The Company adopted FIN 46R and as a result, began consolidating the balance sheets of Euro Disney and Hong Kong Disneyland on March 31, 2004. The Company began consolidating the income and cash flow statements of Euro Disney and Hong Kong Disneyland beginning April 1, 2004, the beginning of the fiscal third quarter. Under FIN 46R transition rules, the operating results and cash flows of Euro Disney and Hong Kong Disneyland continued to be accounted for on the equity method for the six-month period ended March 31, 2004. This table C as well as tables D, E, F and G that follow, provide supplemental information on the impact of consolidating Euro Disney and Hong Kong Disneyland.
The following supplemental worksheet presents the condensed consolidating income statement of the
Company for the year and quarter ended September 30, 2004, reflecting the impact of consolidating the income statements of Euro Disney and Hong Kong Disneyland beginning April 1, 2004.
Year Ended September 30, 2004
Before Euro Disney and Hong Kong Disneyland
Consolidation
Euro Disney, Hong Kong Disneyland and
Adjustments Total Revenues $ 30,037 $ 715 $ 30,752 Cost and expenses (26,053) (651) (26,704)Restructuring and impairment charges (64) — (64)Net interest expense (575) (42) (617)Equity in the income of investees 398 (26) 372 Income before income taxes and minority interests 3,743 (4) 3,739 Income taxes (1,199) 2 (1,197)Minority interests (199) 2 (197)Net income $ 2,345 $ — $ 2,345
Three Months Ended September 30, 2004
Before Euro Disney and Hong Kong Disneyland
Consolidation
Euro Disney, Hong Kong Disneyland and
Adjustments Total Revenues $ 7,160 $ 383 $ 7,543 Cost and expenses (6,458) (334) (6,792)Restructuring and impairment charges (5) — (5)Net interest expense (149) (22) (171)Equity in the income of investees 102 (30) 72 Income before income taxes and minority interests
650 (3)
647
Income taxes (67) 2 (65)Minority interests (67) 1 (66)Net income $ 516 $ — $ 516
.
26
Table D
The Walt Disney Company CONDENSED CONSOLIDATING BALANCE SHEET WORKSHEET
(unaudited, in millions)
This supplemental worksheet presents the condensed consolidating balance sheet of the Company, reflecting the impact of consolidating the balance sheets of Euro Disney and Hong Kong Disneyland as of September 30, 2004.
Before Euro Disney and Hong Kong Disneyland
Consolidation
Euro Disney, Hong Kong Disneyland
and Adjustments Total
Cash and cash equivalents $ 1,730 $ 312 $ 2,042 Other current assets 7,103 224 7,327 Total current assets 8,833 536 9,369 Investments 1,991 (699) 1,292 Fixed assets 12,529 3,953 16,482 Intangible assets 2,815 — 2,815 Goodwill 16,966 — 16,966 Other assets 6,843 135 6,978 Total assets $ 49,977 $ 3,925 $ 53,902 Current portion of borrowings (1) $ 1,872 $ 2,221 $ 4,093 Other current liabilities 6,349 617 6,966 Total current liabilities 8,221 2,838 11,059 Borrowings 8,850 545 9,395 Deferred income taxes 2,950 — 2,950 Other long term liabilities 3,394 225 3,619 Minority interests 487 311 798 Shareholders' equity 26,075 6 26,081 Total liabilities and shareholders' equity $ 49,977 $ 3,925 $ 53,902
__________ (1) All of Euro Disney's borrowings are classified as current as they are subject to acceleration if the
current restructuring plan is not completed.
.
27
Table E
The Walt Disney Company CONDENSED CONSOLIDATING CASH FLOW STATEMENT WORKSHEET
(unaudited, in millions)
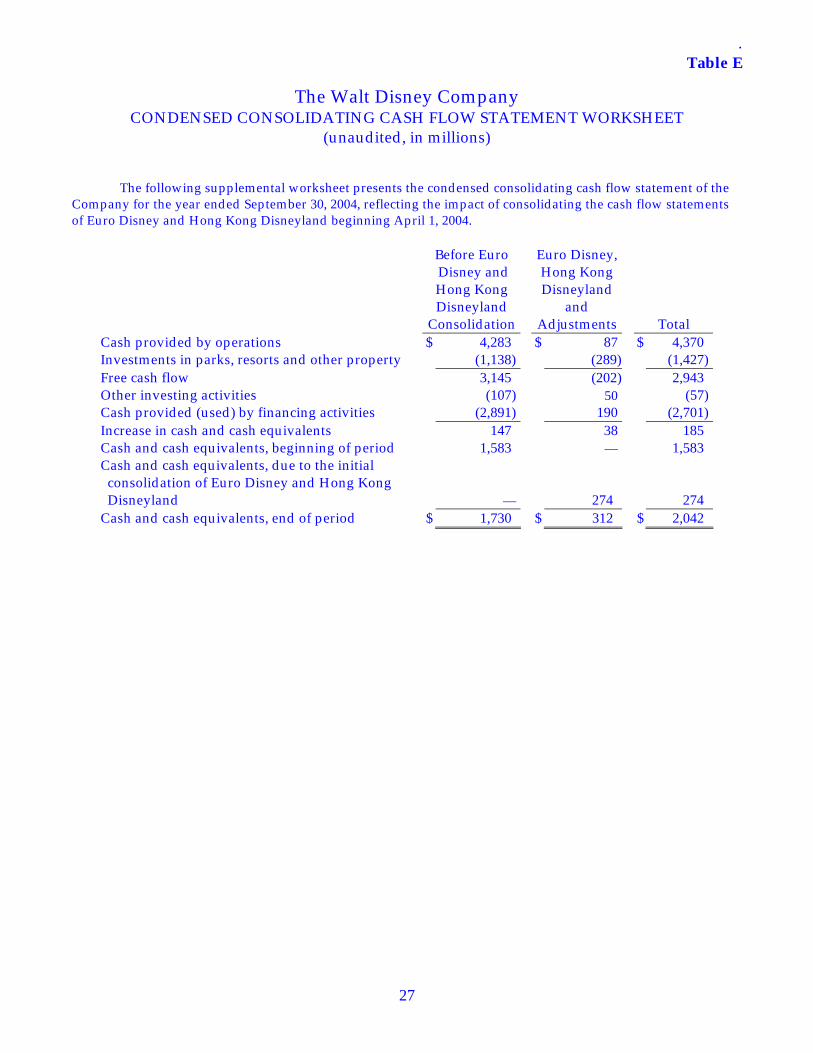
The following supplemental worksheet presents the condensed consolidating cash flow statement of the Company for the year ended September 30, 2004, reflecting the impact of consolidating the cash flow statements of Euro Disney and Hong Kong Disneyland beginning April 1, 2004.
Before Euro
Disney and Hong Kong Disneyland
Consolidation
Euro Disney, Hong Kong Disneyland
and Adjustments Total
Cash provided by operations $ 4,283 $ 87 $ 4,370 Investments in parks, resorts and other property (1,138) (289) (1,427)Free cash flow 3,145 (202) 2,943 Other investing activities (107) 50 (57)Cash provided (used) by financing activities (2,891) 190 (2,701)Increase in cash and cash equivalents 147 38 185 Cash and cash equivalents, beginning of period 1,583 — 1,583 Cash and cash equivalents, due to the initial consolidation of Euro Disney and Hong Kong Disneyland — 274 274 Cash and cash equivalents, end of period $ 1,730 $ 312 $ 2,042
.
28
Table F
The Walt Disney Company QUARTERLY CONDENSED CONSOLIDATED INCOME STATEMENT WORKSHEET
(unaudited, in millions, except per share data)
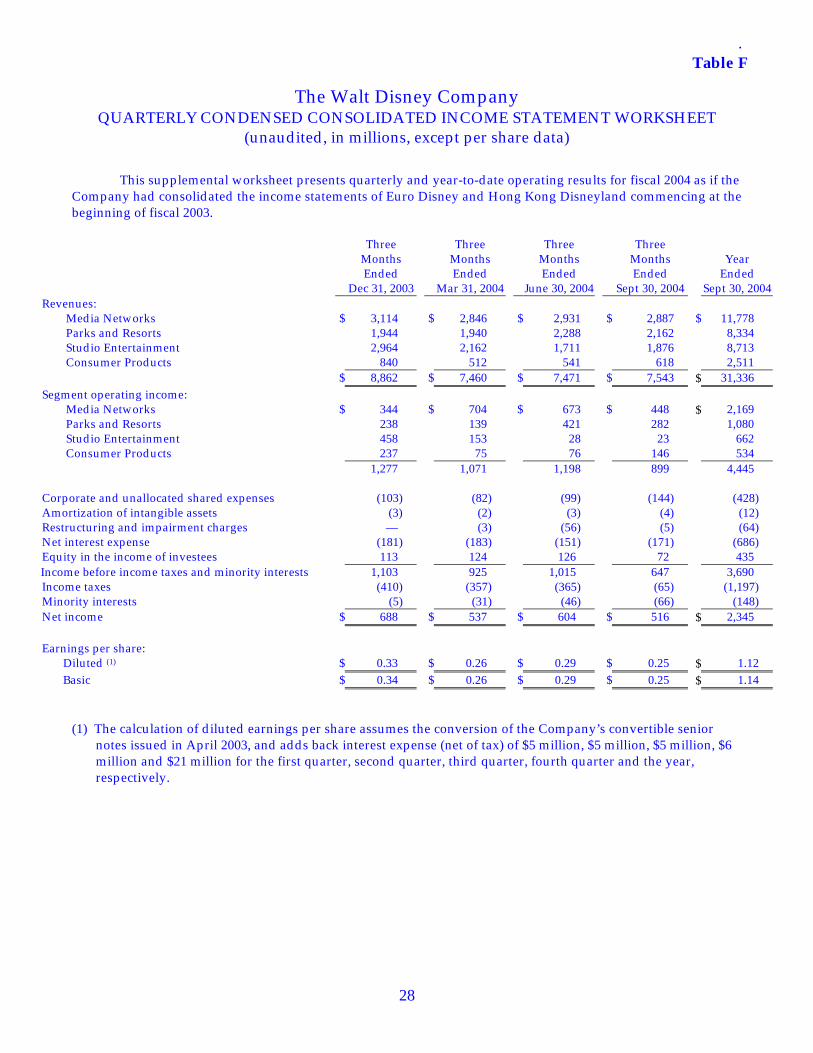
This supplemental worksheet presents quarterly and year-to-date operating results for fiscal 2004 as if the Company had consolidated the income statements of Euro Disney and Hong Kong Disneyland commencing at the beginning of fiscal 2003.
Three Months Ended
Dec 31, 2003
Three Months Ended
Mar 31, 2004
Three Months Ended
June 30, 2004
Three Months Ended
Sept 30, 2004
Year
Ended Sept 30, 2004
Revenues: Media Networks $ 3,114 $ 2,846 $ 2,931 $ 2,887 $ 11,778 Parks and Resorts 1,944 1,940 2,288 2,162 8,334 Studio Entertainment 2,964 2,162 1,711 1,876 8,713 Consumer Products 840 512 541 618 2,511 $ 8,862 $ 7,460 $ 7,471 $ 7,543 $ 31,336 Segment operating income: Media Networks $ 344 $ 704 $ 673 $ 448 $ 2,169 Parks and Resorts 238 139 421 282 1,080 Studio Entertainment 458 153 28 23 662 Consumer Products 237 75 76 146 534 1,277 1,071 1,198 899 4,445 Corporate and unallocated shared expenses (103) (82) (99) (144) (428) Amortization of intangible assets (3) (2) (3) (4) (12) Restructuring and impairment charges — (3) (56) (5) (64) Net interest expense (181) (183) (151) (171) (686) Equity in the income of investees 113 124 126 72 435 Income before income taxes and minority interests 1,103 925 1,015 647 3,690 Income taxes (410) (357) (365) (65) (1,197) Minority interests (5) (31) (46) (66) (148) Net income $ 688 $ 537 $ 604 $ 516 $ 2,345 Earnings per share:
(1) The calculation of diluted earnings per share assumes the conversion of the Company’s convertible senior
notes issued in April 2003, and adds back interest expense (net of tax) of $5 million, $5 million, $5 million, $6 million and $21 million for the first quarter, second quarter, third quarter, fourth quarter and the year, respectively.
.
29
Table G
The Walt Disney Company QUARTERLY CONDENSED CONSOLIDATED INCOME STATEMENT WORKSHEET
(unaudited, in millions, except per share data)
This supplemental worksheet presents quarterly and year-to-date operating results as if the Company had consolidated the income statements of Euro Disney and Hong Kong Disneyland commencing at the beginning of fiscal 2003.
Three Months Ended
Dec 31, 2002
Three Months Ended
Mar 31, 2003
Three Months Ended
June 30, 2003
Three Months Ended
Sept 30, 2003
Year Ended
Sept 30, 2003 Revenues: Media Networks $ 2,944 $ 2,653 $ 2,709 $ 2,635 $ 10,941 Parks and Resorts 1,808 1,702 2,014 1,960 7,484 Studio Entertainment 1,891 1,862 1,440 2,171 7,364 Consumer Products 787 500 497 560 2,344 $ 7,430 $ 6,717 $ 6,660 $ 7,326 $ 28,133 Segment operating income (loss): Media Networks $ (71) $ 400 $ 586 $ 298 $ 1,213 Parks and Resorts 230 112 390 267 999 Studio Entertainment 138 206 71 205 620 Consumer Products 190 53 39 102 384 487 771 1,086 872 3,216 Corporate and unallocated shared expenses (102) (93) (100) (148) (443) Amortization of intangible assets (5) (7) (2) (4) (18) Gain on the sale of business - - 16 - 16 Net interest expense (319) (205) (213) (157) (894) Equity in the income of investees 97 78 99 84 358 Restructuring and impairment charges - - (15) (1) (16) Income before income taxes, minority interests and
cumulative effect of accounting change 158 544 871 646
2,219 Income taxes (77) (219) (322) (171) (789) Minority interests 26 (11) (47) (60) (92) Income before cumulative effect of accounting change 107 314 502 415 1,338 Cumulative effect of accounting change (71) - - - (71) Net income $ 36 $ 314 $ 502 $ 415 $ 1,267 Earnings per share before cumulative effect of
(1) The calculation of diluted earnings per share assumes the conversion of the Company’s convertible senior
notes issued in April 2003, and adds back interest expense (net of tax) of $4 million, $6 million and $10 million for the third quarter, fourth quarter and year, respectively.