Transportation Cost Index: A Comprehensive Performance Measure for Transportation and Land Use Systems Liming Wang, Portland State University In Collaboration with Jenny Liu, Huajie Yang, Shi Wei (PSU) Bud Reiff (Metro), Brian Gregor (Oregon System Analytics)
Transcript
Transportation Cost Index:A Comprehensive Performance Measure for Transportation and Land Use Systems
Liming Wang, Portland State University
In Collaboration with Jenny Liu, Huajie Yang, Shi Wei (PSU)
Bud Reiff (Metro), Brian Gregor (Oregon System Analytics)
Outline● Why yet another performance
measure (YAPM)?● Transportation cost index: the idea● Implementations and application● Ongoing and future work
Demand for Comprehensive Measures● As a supplement/replacement of
traffic-centric measures: LOS, travel delay
● MAP-21 emphasizes use of performance measures in transportation planning & operation
● State legislations: Oregon Job and Transportation Act (OJTA)
Existing Measures● Handy and Niemeier, 1997● Geurs and van Wee, 2004● NCHRP Report 311, 618, 694, 708 ...
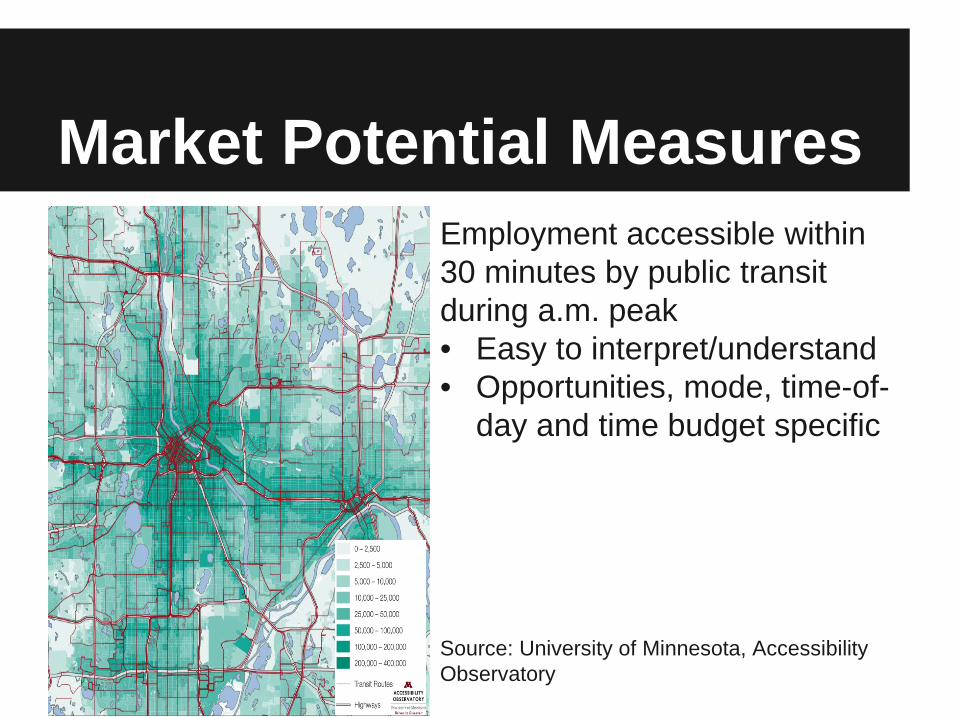
Market Potential MeasuresEmployment accessible within 30 minutes by public transit during a.m. peak• Easy to interpret/understand• Opportunities, mode, time-of-
day and time budget specific
Source: University of Minnesota, Accessibility Observatory
Utility-based MeasuresLogsum as an accessibility measure • Elegant, composite measures
for all modes; possible to derive net user benefit between scenarios
• Hard to interpret by itself; unable to compare across regions/times
E(CS) = ln �𝑚𝑚′
exp 𝑈𝑈𝑚𝑚′𝑘𝑘𝑘𝑘 + 𝐶𝐶
Generalized Costs Indicator
per distance generalized costs for motorized trips• Easy to
interpret/understand; able to monitor trends and compare scenarios
• ignores land use system; mode, time-of-day specific
Source: Koopmans, et al, 2013
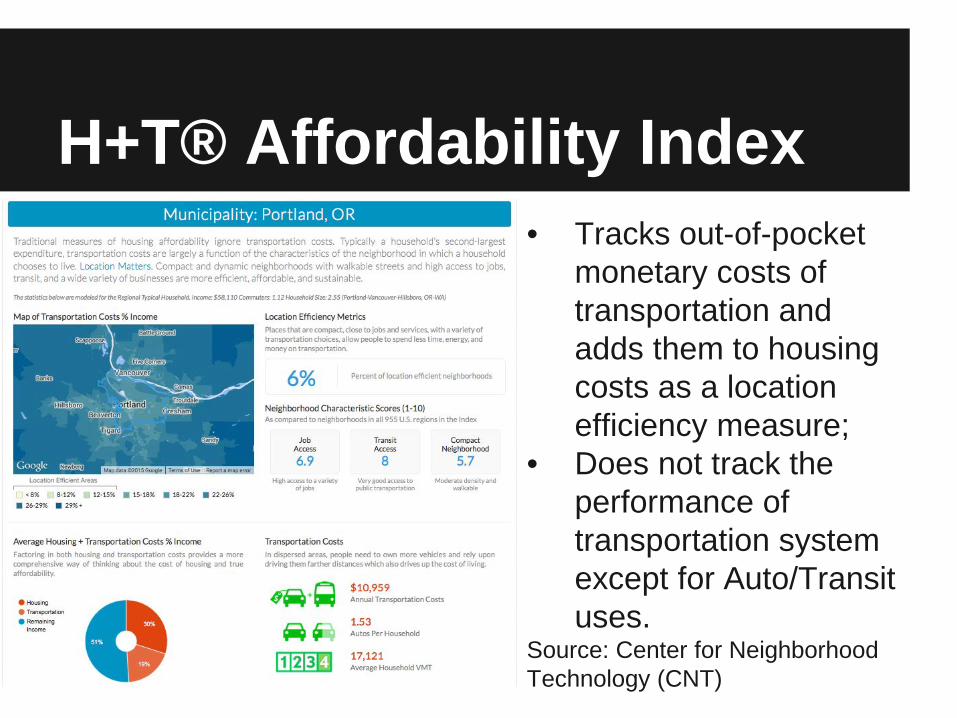
H+T® Affordability Index• Tracks out-of-pocket
monetary costs of transportation and adds them to housing costs as a location efficiency measure;
• Does not track the performance of transportation system except for Auto/Transit uses.
Source: Center for Neighborhood Technology (CNT)
Wish List for YAPM● A comprehensive indicator able to present an
overall picture;● Easy to interpret/understand;● Applicable to both trend monitoring and
scenario comparison;● Able to fill gaps in policy areas not adequately
covered by existing performance measures, e.g. the equity and compatibility aspects (Reiffand Gregor, 2005)
Consumer Price Index (CPI)Measures changes in the price level of a basket of consumer goods and services purchased by households:● Build a basket of goods and services from
pre-defined item groups● Track the prices of goods and services in the
basket
Transportation Cost Index (TCI)● Comprehensive measure of transportation
and land use systems;● Easy to interpret/understand;● If based on widely available data sources,
possible for use in trend monitoring and comparing scenario outcomes;
● Able to serve as an indicator for policy areas including transportation and land use system compatibility and balance.
Transportation Cost Index (TCI)Measures changes in the price level of a market basket of trips/destinations meeting households’ daily needs:● Identify a basket of trips/destinations
based on pre-defined groups (trip purpose categories);
● Track the costs of accessing destinations/trips in the basket.
Implementation A: Travel Survey-based MethodRelies primarily on input from household activity survey, e.g. Oregon Travel & Activity Survey (OTAS)• Construct travel baskets based on activity
diaries or a sample of trips/tours that are representative of regional travel pattern, potentially by trip purpose, household size, income group and geography;
• Easy for trend monitoring.
Implementation B: TDM-based MethodRelies on inputs from travel demand model− Data readily available for regions w/ TDM; − Straightforward for scenario comparison;− Theoretically can calculate the transportation
cost for every income group and for every TAZ.
− But we may not want to track it too closely –patterns from idiosyncrasy or true differences?
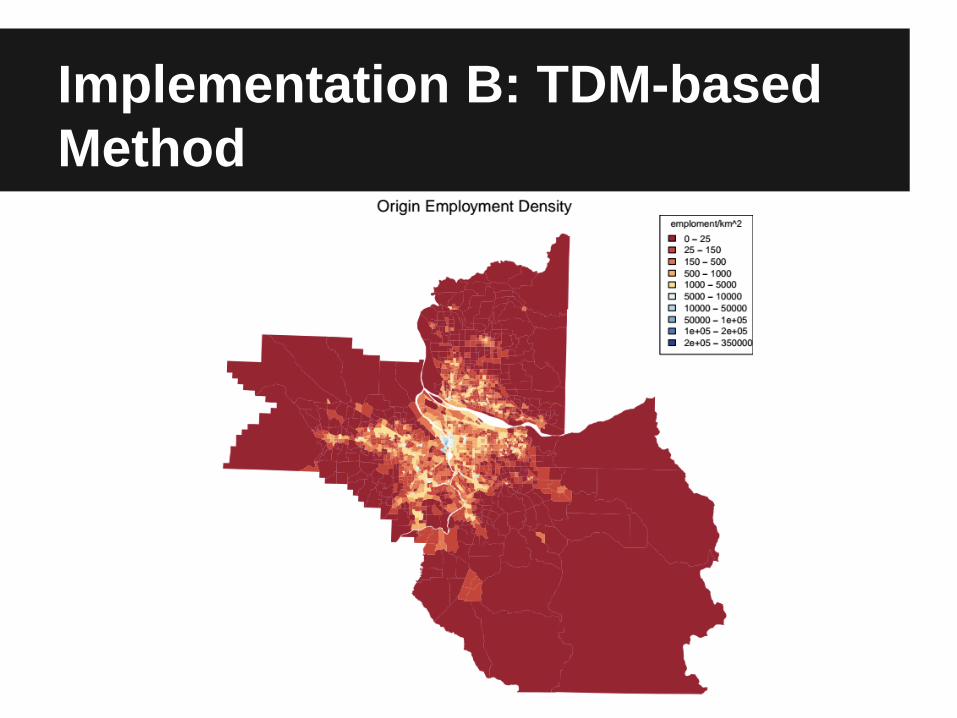
Implementation B: TDM-based Method
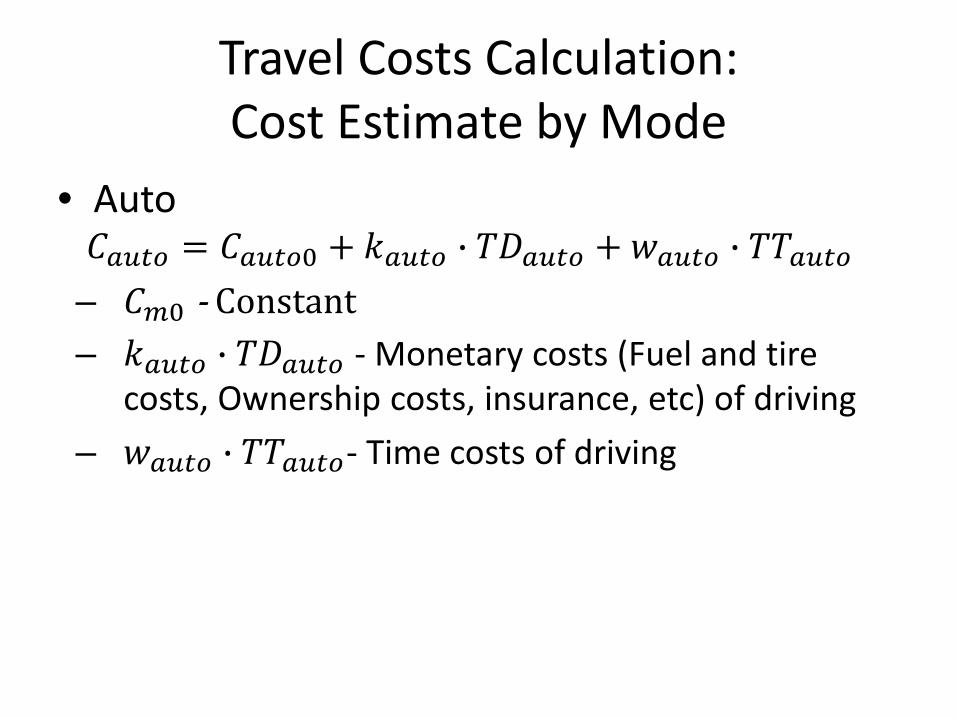
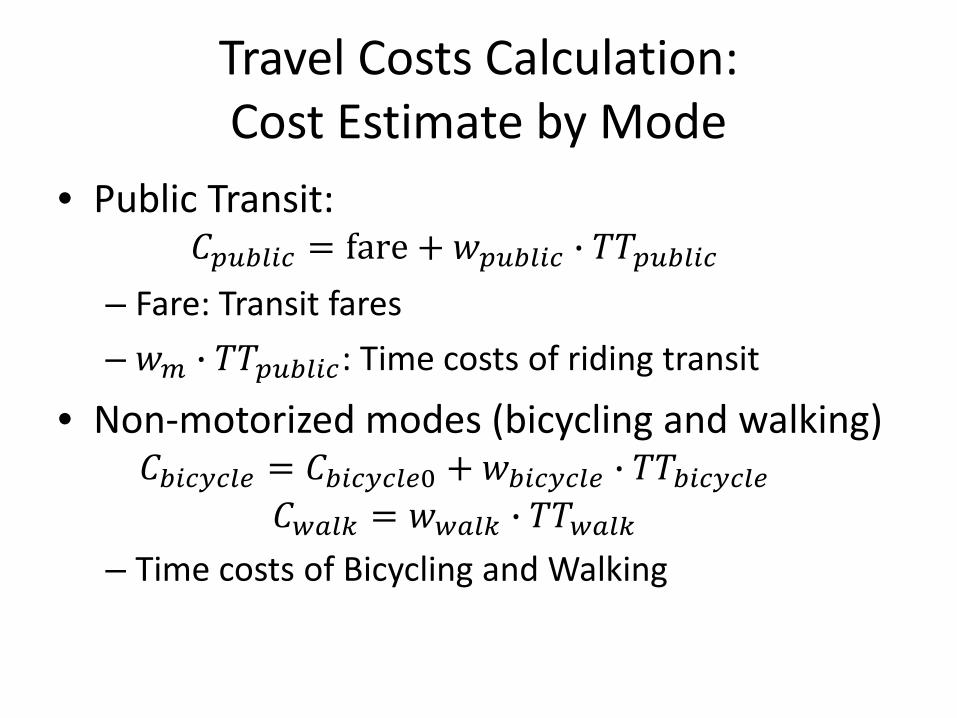
Calculate Travel Costs:Cost Estimate by Mode
𝐶𝐶 = 𝐶𝐶0 + 𝑘𝑘 � 𝑇𝑇𝑇𝑇 + 𝑤𝑤 � 𝑇𝑇𝑇𝑇𝐶𝐶0 - Constant𝑘𝑘 � 𝑇𝑇𝑇𝑇 - Monetary costs (Fuel and tire costs, Ownership costs, insurance, transit fare, etc) of travel𝑤𝑤 � 𝑇𝑇𝑇𝑇 - Time costs of travel
Applications and Demonstration
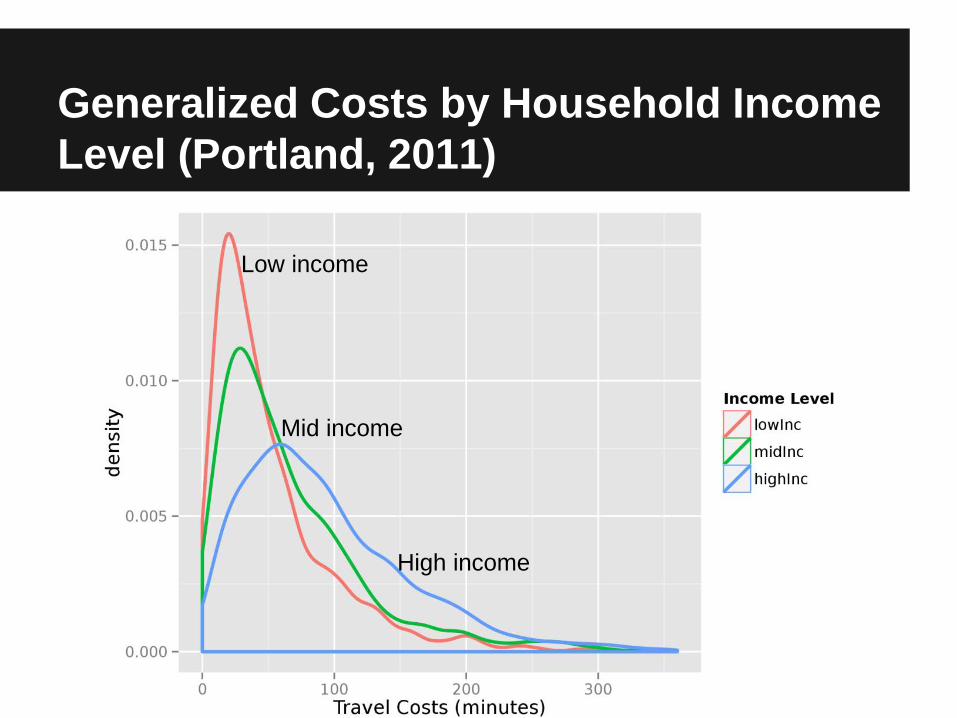
Generalized Costs by Household Income Level (Portland, 2011)
Low income
Mid income
High income
Generalized Costs by Household Size (Portland, 2011)
1
2
4+
3
Generalized Costs by Purpose & Income Level (Portland, 2011)
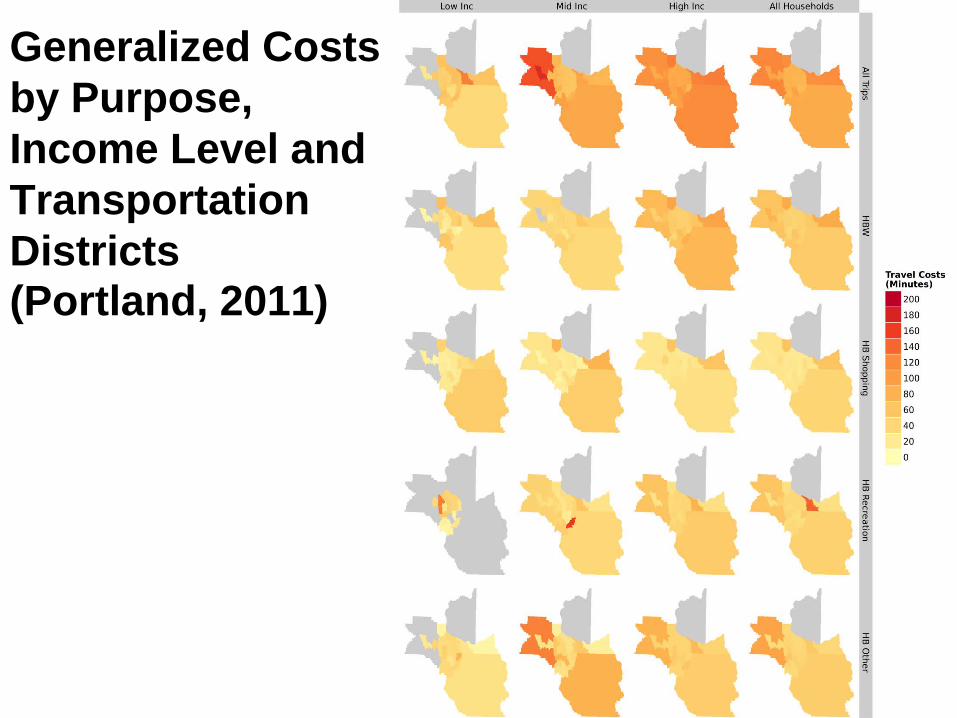
Generalized Costs by Purpose, Income Level and Transportation Districts (Portland, 2011)
Generalized Costs by Household Income Level (Portland)
2011 1994
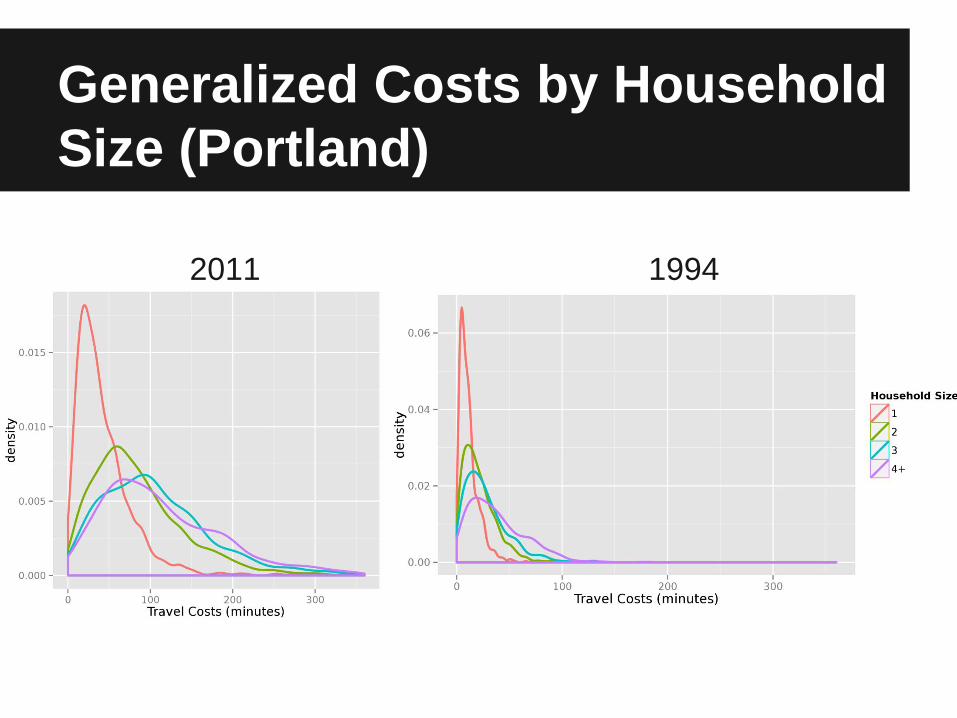
Generalized Costs by Household Size (Portland)
2011 1994
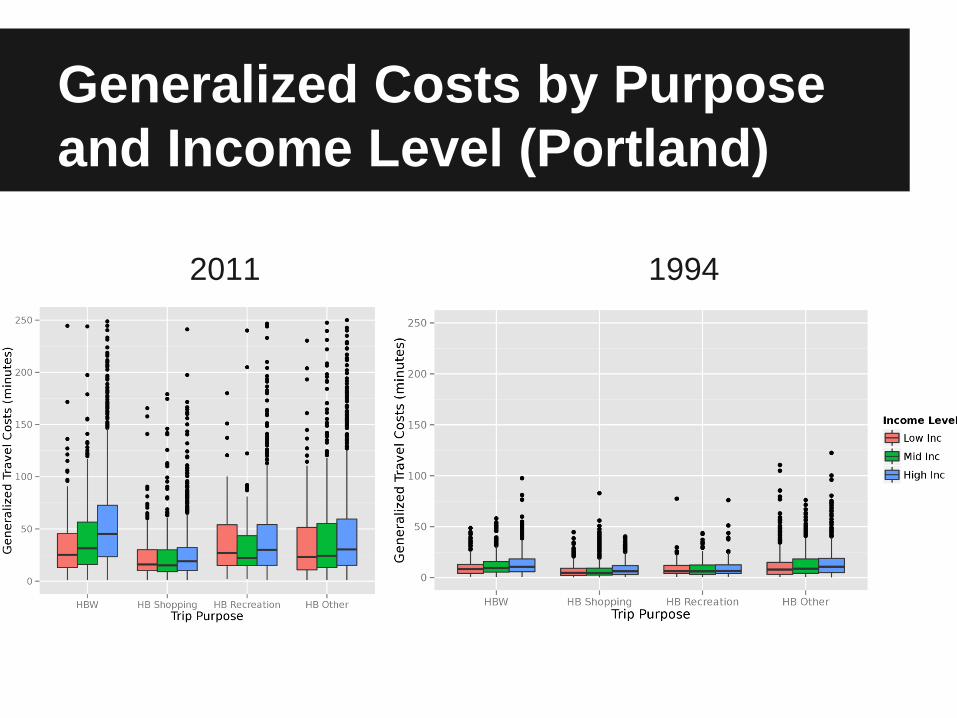
Generalized Costs by Purpose and Income Level (Portland)
2011 1994
Generalized Costs Portland vs Salt Lake City
Df Sum Sq Mean Sq F value Pr(>F) msa 1 75870 75870 4.524 0.0334 *Res 11414 191411731 16770
Portland – Salt Lake CityMean difference: 5.3795% Confidence interval: [0.42, 10.32]
Generalized Costs by Household Income Level
Portland Salt Lake City
Generalized Costs by Purpose and Income Level
Portland Salt Lake City
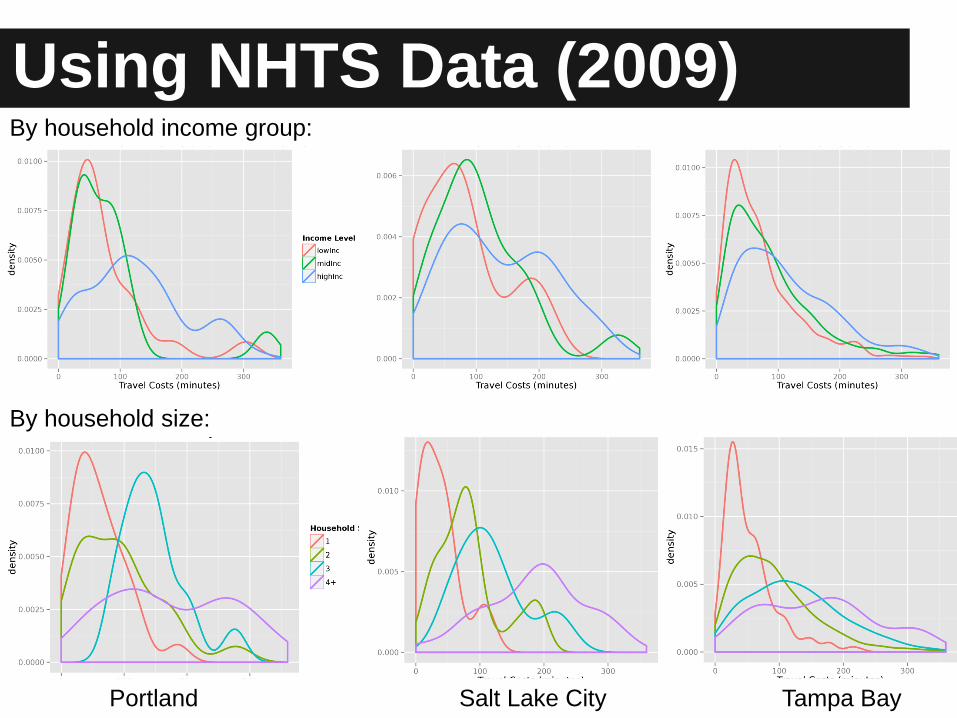
Using NHTS Data (2009)summary(n.tcost.hh.msas.aov)
Df Sum Sq Mean Sq F value Pr(>F) msa 2 129454 64727 7.566 0.000539 ***Residuals 1435 12275919 8555
diff lwr upr p adjTampa Bay-Portland -21.63 -43.30 0.04 0.05Salt Lake City-Portland 12.59 -19.02 44.21 0.62Salt Lake City-Tampa 34.23 9.63 58.83 0.003
Using NHTS Data (2009)By household income group:
By household size:
Portland Salt Lake City Tampa Bay
Ongoing and Future Work● Under development/testing at
http://github.com/cities-lab/tci● Reconcile TCIs from the two methods;● Verify patterns of transportation costs with
information from alternative data sources, such as CES;
Ongoing and Future Work● Adopted by the Accessibility Indicator
Development Team (IDT) as one of indicators for the Oregon Mosaic project mandated by OJTA
● Test TCI usage in public engagement and policy making process
Acknowledgements
National Institute for Transportation and Communities
Oregon DOT
Extra Slides
Income LevelsTo be consistent with the classification used in Metro’s TDM, household income levels are classified with this scale (1994 dollars):• < $25K: Low Income • $25-50K: Mid Income• > $50K: High Income
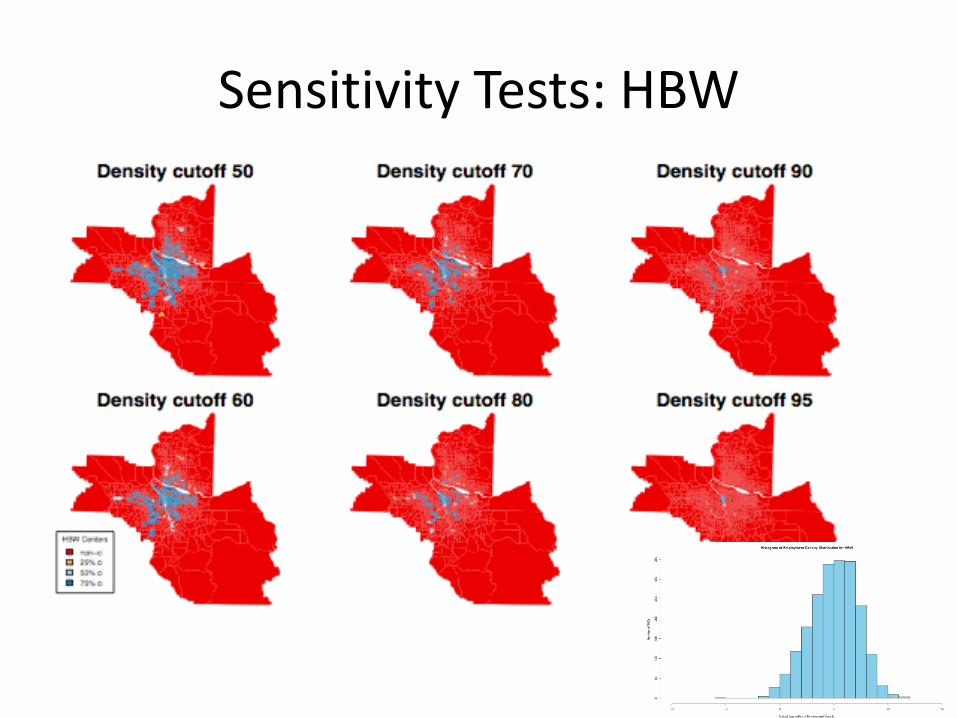
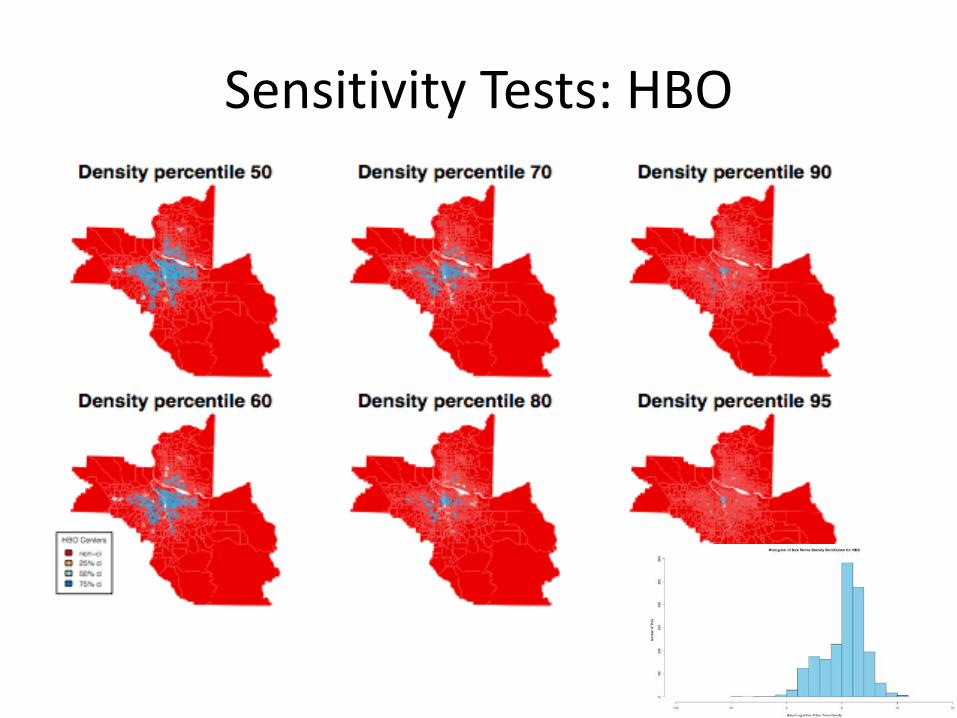
Identify Activity Centers (Travel Market Basket)
Steps (Giulinao, 1991)
1. Calculate employment/size term density;2. Identify TAZs with densities greater than
density cutoff D and group contiguous TAZs identified into preliminary centers;
3. Calculate total employment or size terms for each center identified in step 2 and eliminate centers with total employment or size terms below total cutoff E from centers identified in step 2. The remaining are activity centers.
Determine Cutoffs
• Giulinao (1991) provides no guidance in selecting density cutoff (D) or total cutoff (E). They relied on expert knowledge