Page 1
© Sumpoorna 2012
1
War Horse –Dabur India Ltd. September 28, 2012
Recommendation Buy
Transaction Price Range Rs.116 - Rs.131
Target Rs.150
Time horizon 6 months
1-yr stock price movement (NSE)
Snapshot
CMP 128.10
Date 28-Sep-12
Beta 0.32
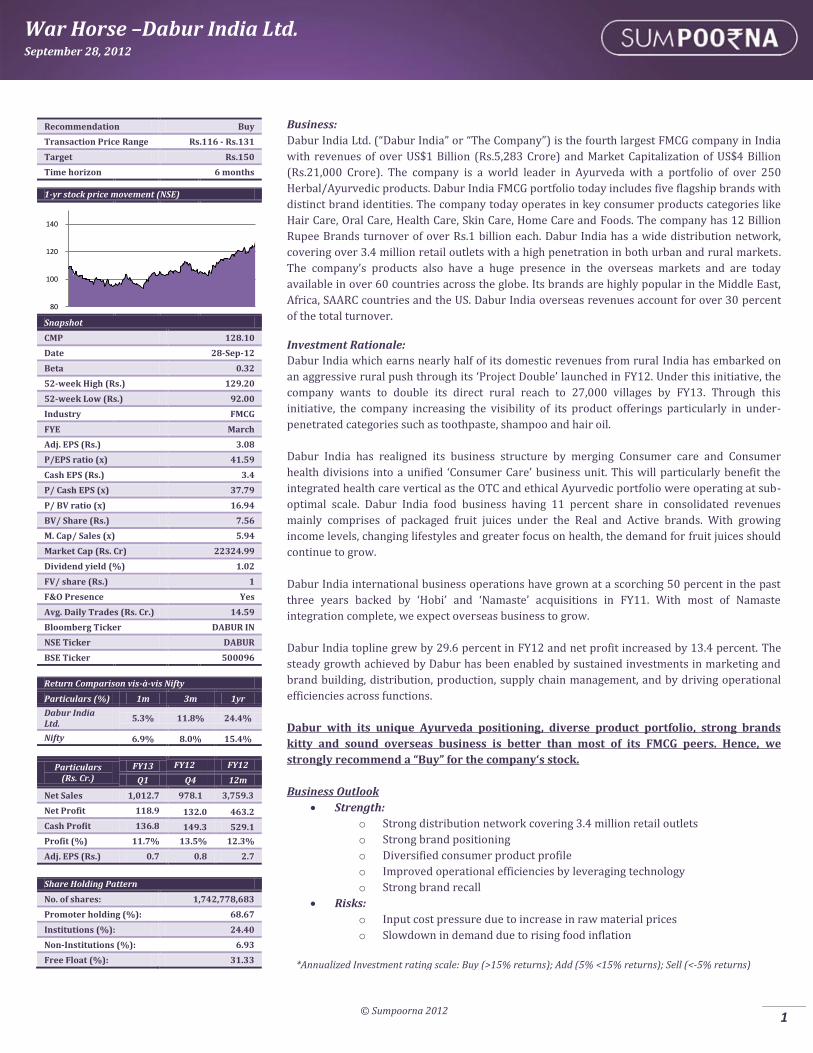
52-week High (Rs.) 129.20
52-week Low (Rs.) 92.00
Industry FMCG
FYE March
Adj. EPS (Rs.) 3.08
P/EPS ratio (x) 41.59
Cash EPS (Rs.) 3.4
P/ Cash EPS (x) 37.79
P/ BV ratio (x) 16.94
BV/ Share (Rs.) 7.56
M. Cap/ Sales (x) 5.94
Market Cap (Rs. Cr) 22324.99
Dividend yield (%) 1.02
FV/ share (Rs.) 1
F&O Presence Yes
Avg. Daily Trades (Rs. Cr.) 14.59
Bloomberg Ticker DABUR IN
NSE Ticker DABUR
BSE Ticker 500096
Return Comparison vis-à-vis Nifty
Particulars (%) 1m 3m 1yr
Dabur India Ltd.
5.3% 11.8% 24.4%
Nifty 6.9% 8.0% 15.4%
Particulars
(Rs. Cr.)
FY13 FY12 FY12
Q1 Q4 12m
Net Sales 1,012.7 978.1 3,759.3
Net Profit 118.9 132.0 463.2
Cash Profit 136.8 149.3 529.1
Profit (%) 11.7% 13.5% 12.3%
Adj. EPS (Rs.) 0.7 0.8 2.7
Share Holding Pattern
No. of shares: 1,742,778,683
Promoter holding (%): 68.67
Institutions (%): 24.40
Non-Institutions (%): 6.93
Free Float (%): 31.33
Business: Dabur India Ltd. (“Dabur India” or “The Company”) is the fourth largest FMCG company in India
with revenues of over US$1 Billion (Rs.5,283 Crore) and Market Capitalization of US$4 Billion
(Rs.21,000 Crore). The company is a world leader in Ayurveda with a portfolio of over 250
Herbal/Ayurvedic products. Dabur India FMCG portfolio today includes five flagship brands with
distinct brand identities. The company today operates in key consumer products categories like
Hair Care, Oral Care, Health Care, Skin Care, Home Care and Foods. The company has 12 Billion
Rupee Brands turnover of over Rs.1 billion each. Dabur India has a wide distribution network,
covering over 3.4 million retail outlets with a high penetration in both urban and rural markets.
The company’s products also have a huge presence in the overseas markets and are today
available in over 60 countries across the globe. Its brands are highly popular in the Middle East,
Africa, SAARC countries and the US. Dabur India overseas revenues account for over 30 percent
of the total turnover.
Investment Rationale:
Dabur India which earns nearly half of its domestic revenues from rural India has embarked on
an aggressive rural push through its ‘Project Double’ launched in FY12. Under this initiative, the
company wants to double its direct rural reach to 27,000 villages by FY13. Through this
initiative, the company increasing the visibility of its product offerings particularly in under-
penetrated categories such as toothpaste, shampoo and hair oil.
Dabur India has realigned its business structure by merging Consumer care and Consumer
health divisions into a unified ‘Consumer Care’ business unit. This will particularly benefit the
integrated health care vertical as the OTC and ethical Ayurvedic portfolio were operating at sub-
optimal scale. Dabur India food business having 11 percent share in consolidated revenues
mainly comprises of packaged fruit juices under the Real and Active brands. With growing
income levels, changing lifestyles and greater focus on health, the demand for fruit juices should
continue to grow.
Dabur India international business operations have grown at a scorching 50 percent in the past
three years backed by ‘Hobi’ and ‘Namaste’ acquisitions in FY11. With most of Namaste
integration complete, we expect overseas business to grow.
Dabur India topline grew by 29.6 percent in FY12 and net profit increased by 13.4 percent. The
steady growth achieved by Dabur has been enabled by sustained investments in marketing and
brand building, distribution, production, supply chain management, and by driving operational
efficiencies across functions.
Dabur with its unique Ayurveda positioning, diverse product portfolio, strong brands
kitty and sound overseas business is better than most of its FMCG peers. Hence, we
strongly recommend a “Buy” for the company‘s stock.
Business Outlook
Strength:
o Strong distribution network covering 3.4 million retail outlets
o Strong brand positioning
o Diversified consumer product profile
o Improved operational efficiencies by leveraging technology
o Strong brand recall
Risks:
o Input cost pressure due to increase in raw material prices
o Slowdown in demand due to rising food inflation
*Annualized Investment rating scale: Buy (>15% returns); Add (5% <15% returns); Sell (<-5% returns)
80
100
120
140
Page 2
© Sumpoorna 2012
2
War Horse –Dabur India Ltd. September 28, 2012
Legal History & Structure:
The 125 year old company, promoted by the Burman family, had started operations in 1884 as an Ayurvedic medicines company. From
its humble beginnings in the by lanes of Calcutta, Dabur India Ltd has come a long way today to become one of the biggest Indian-owned
consumer goods companies with the largest herbal and natural product portfolio in the world.
Subsidiaries:
o Domestic: H & B Stores Ltd.
o Overseas: Dabur Nepal Pvt Ltd, Dabur International Ltd, Weikfied International(UAE) LLC, Asian Consumer Care Pvt
Ltd, African Consumer Care Ltd, Dabur Egypt Ltd Dabur (UK) Ltd, Asian Consumer Care, Pakistan (Pvt) Ltd, Naturelle
LLC, Dermovia Skin Essentials INC, Dabur Egypt Trading Ltd, Hobi Kozmetik, RA Pazarlama, Dabur Lanka (Pvt.) Ltd,
Namaste Laboratories LLC, Urban Laboratories International LLC, Hair Rejuvenation & Revitalization Nigeria Ltd,
Healing Hair Laboratories International LLC
Dabur India acquired ‘Hobi Kozmetik’ Group, a personal care company based in Turkey and USA based ‘Namaste Laboratories’
in FY11.
Management Growth Path:
Expansion Plans:
o During the year, Dabur kicked off a major initiative christened Project Double to significantly increase the rural reach of
its brands. Comprehensive benchmarking was done on rural coverage across 10 key states: Uttar Pradesh, Punjab,
Rajasthan, Bihar, West Bengal, Assam, Orissa, Maharashtra, Madhya Pradesh and Karnataka, which contribute to around
72 percent of the rural FMCG potential.
o The pilot initiatives undertaken in Uttar Pradesh and Maharashtra met action standards consistently on all key aspects of
resource stability, coverage expansion and revenue realization from new markets.
o Substantial investments were made in Information Technology solutions, positively impacting various aspects of S&D.
The stockist transaction software, Drishti covers about 75 percent of business, gathering real-time market information.
o During the year private label products were introduced under the brand ‘New U’ in items such as nail enamels, nail
enamel removers, cotton balls etc. and these will be expanded in months to come.
o The Company also stepped up its joint marketing initiatives and in-store activations with top vendor partners such as
L’Oreal, HUL, Nivea and P&G across stores, which gave the business a strong fillip. Some of the highly successful brand
activations undertaken include Makeover Marathon, Festival of Beauty and Gals in the City.
o The company recently commissioned a new facility in Egypt which has been added to enhance the capacities for
manufacturing hair care and skin care products for Egyptian market.
Manufacturing Facility:
o Dabur India today has manufacturing plants in 12 locations, Baddi (Himachal Pradesh), Pantnagar (Uttaranchal),
Sahibabad (Uttar Pradesh), Jammu, Silvassa, Nasik, Alwar, Katni, Narendrapur, Pithampur, Newai (Rajasthan) and Siliguri
(West Bengal). During 2011-12 the company added a Honey plant in Baddi. Another unit has been established in Baddi
and commissioned in March 2012 to manufacture Chyawanprash, Toothpaste, Glucose and Odonil.
o Initiatives were also taken towards new product and pack introductions, improve safety awareness and quality
improvement. Several existing units were upgraded and manufacturing capacity added for Hajmola, Gulabari and
shampoo to meet the growing demand for these products.
o Dabur announced its entry into Sri Lanka with the setting up of an overseas subsidiary – Dabur Lanka (Pvt.) Ltd. Dabur
Lanka signed an agreement with the Board of Investment of Sri Lanka in September 2011, to establish this venture. As
part of this, a new export oriented manufacturing facility will be set up for producing a range of fruit-based beverages in
Gampaha, north of Colombo.
o A Greenfield facility is also being set up in Bangladesh to keep pace with the growing needs of this market. This facility
which will produce a host of Dabur products, like Shampoo, Honey, Odonil, Hair Oils and Hajmola is expected to be
operational by the end of 2012.
Page 3
© Sumpoorna 2012
3
War Horse –Dabur India Ltd. September 28, 2012
Distribution Overview:
Market Share:
Category Position Market Share Key Brands Hair Care 3 12% Dabur Amla hair Oil, Vatika hair oil & Vatika Shampoos
Oral Care 3 13% Red toothpaste, Babool, Meswak, Red toothpowder
Ayurvedic Tonics 1 67% Dabur Chyawanprash
Digestives 1 56% Hajmola
Fruit Juices 1 52% Real Fruit Juices, Real Active
Honey 1 50% Dabur Honey
Glucose 2 25% Dabur Glucose
Skin Care 1 50% Fem
Air Fresheners 1 40% Odonil
Geographical Revenue FY12:
Africa22%
Middle east30%
Asia16%
USA26%
Others6%
Sub Stockists
Shoppers & Consumers Direct reach 0.7
million outlets
Retail Trade Rural Trade
Wholesalers
Unit Canteens Insti Customers
Factory
Depot
Modern Trade
Stockists
Super Stockists
Military/CSD Stockists Insti Stockists
Page 4
© Sumpoorna 2012
4
War Horse –Dabur India Ltd. September 28, 2012
Segmental Performance:
Segmental Revenue (Rs. crore)
Quarter ended Year Ended
Mar'12 Dec'11 Mar'11 Mar'12 Mar'11
Consumer care business 1140.03 1,266.77 950.75 4489.61 3481.30
Food business 161.32 136.78 126.06 602.20 1,429.51
Retail Business 12.26 12.25 6.70 65.4 72.43
Other Segments 49.97 36.88 24.71 0.18 0.02
Total 1,363.58 1,452.68 1108.22 6,631.16 6,003.17
Segment Results
Consumer care business 259.53 268.88 241.51 975.47 897.48
Food business 30.17 21.45 23.45 111.07 94.10
Retail Business -2.93 -3.33 -2.25 -11.63 -9.14
Other Segments 1.47 3.92 2.11 7.33 3.64
Less
Finance Cost 5.72 18.29 15.91 53.84 30.34
Other Unallocable Items 74.24 67.12 60.48 237.91 247.87
Profit/loss Before Tax 208.28 205.51 188.43 790.49 707.87
Domestic Revenue Breakup:
Consumer Care Revenue Breakup:
o Dabur India is the market leader in health supplements particularly Ayurvedic tonics and honey. The company has overcome
the seasonality of this segment through launch of more variants. But in hair care and oral care, the company is relatively smaller
player with less than 15 percent market share in each. Among the other segments, OTC and ethicals contribute 12 percent sales,
while digestives, skin care and home care have revenue shares of less than 10 percent each. The domestic consumer care
business contribute 56 percent overall sales and being diversified is insulated from demand downturn in any particular
category
o Dabur India has strong brand recall with the help of their celebrity brand ambassadors ‘Priyanka chopra for Dabur Amla Hair oil’, ‘Sonakshi Sinha for Fem’, ‘Preeti Zinta for Vatika Hair oil & Shampoo’, ‘Karshima kapoor for Odonil’ & ‘Amitabachhan for Dabur Chawayanprash’
Consumer Care80%
Food15%
Others5%
Oral Care17%
Skin Care6%
Home Care6%
Hair Care30%
OTC & Ethicals
12%
Digestives8%Health
Supplements21%
Page 5
© Sumpoorna 2012
5
War Horse –Dabur India Ltd. September 28, 2012
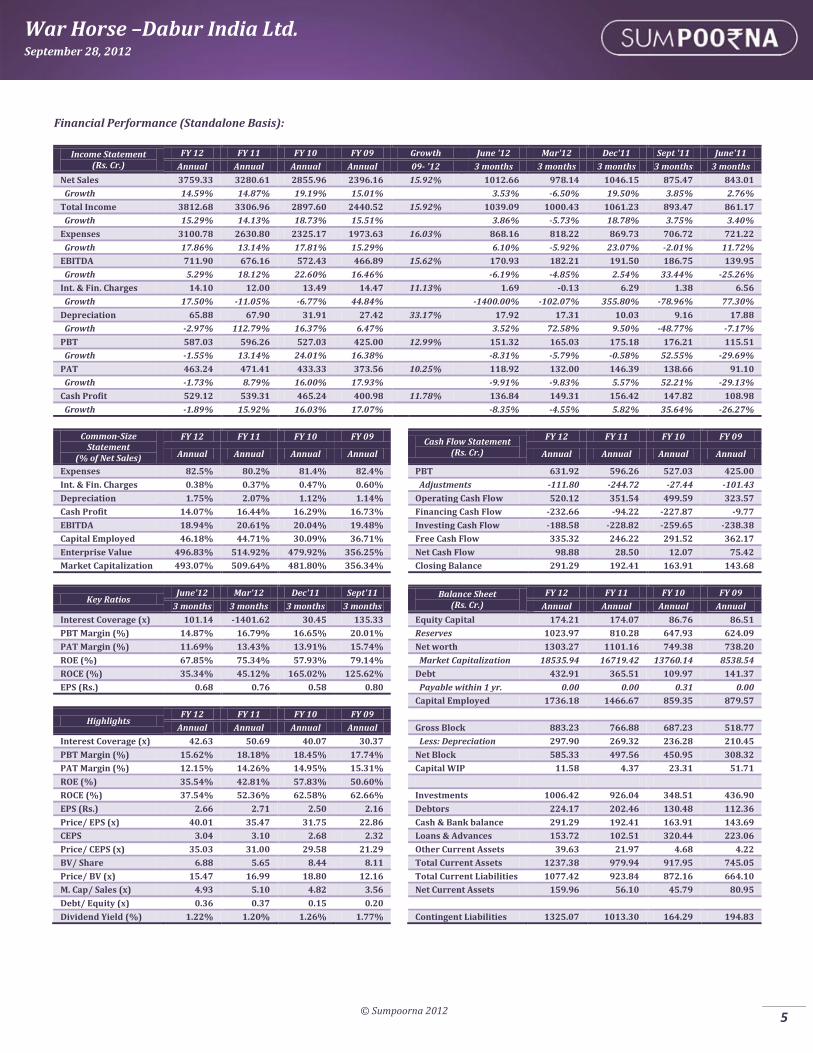
Financial Performance (Standalone Basis):
Income Statement (Rs. Cr.)
FY 12 FY 11 FY 10 FY 09 Growth June '12 Mar'12 Dec'11 Sept '11 June'11
Annual Annual Annual Annual 09- '12 3 months 3 months 3 months 3 months 3 months
Net Sales 3759.33 3280.61 2855.96 2396.16 15.92% 1012.66 978.14 1046.15 875.47 843.01
Growth 14.59% 14.87% 19.19% 15.01% 3.53% -6.50% 19.50% 3.85% 2.76%
Total Income 3812.68 3306.96 2897.60 2440.52 15.92% 1039.09 1000.43 1061.23 893.47 861.17
Growth 15.29% 14.13% 18.73% 15.51% 3.86% -5.73% 18.78% 3.75% 3.40%
Expenses 3100.78 2630.80 2325.17 1973.63 16.03% 868.16 818.22 869.73 706.72 721.22
Growth 17.86% 13.14% 17.81% 15.29% 6.10% -5.92% 23.07% -2.01% 11.72%
EBITDA 711.90 676.16 572.43 466.89 15.62% 170.93 182.21 191.50 186.75 139.95
Growth 5.29% 18.12% 22.60% 16.46% -6.19% -4.85% 2.54% 33.44% -25.26%
Int. & Fin. Charges 14.10 12.00 13.49 14.47 11.13% 1.69 -0.13 6.29 1.38 6.56
Growth 17.50% -11.05% -6.77% 44.84% -1400.00% -102.07% 355.80% -78.96% 77.30%
Depreciation 65.88 67.90 31.91 27.42 33.17% 17.92 17.31 10.03 9.16 17.88
Growth -2.97% 112.79% 16.37% 6.47% 3.52% 72.58% 9.50% -48.77% -7.17%
PBT 587.03 596.26 527.03 425.00 12.99% 151.32 165.03 175.18 176.21 115.51
Growth -1.55% 13.14% 24.01% 16.38% -8.31% -5.79% -0.58% 52.55% -29.69%
PAT 463.24 471.41 433.33 373.56 10.25% 118.92 132.00 146.39 138.66 91.10
Growth -1.73% 8.79% 16.00% 17.93% -9.91% -9.83% 5.57% 52.21% -29.13%
Cash Profit 529.12 539.31 465.24 400.98 11.78% 136.84 149.31 156.42 147.82 108.98
Growth -1.89% 15.92% 16.03% 17.07% -8.35% -4.55% 5.82% 35.64% -26.27%
Common-Size Statement
(% of Net Sales)
FY 12 FY 11 FY 10 FY 09
Cash Flow Statement (Rs. Cr.)
FY 12 FY 11 FY 10 FY 09
Annual Annual Annual Annual
Annual Annual Annual Annual
Expenses 82.5% 80.2% 81.4% 82.4%
PBT 631.92 596.26 527.03 425.00
Int. & Fin. Charges 0.38% 0.37% 0.47% 0.60%
Adjustments -111.80 -244.72 -27.44 -101.43
Depreciation 1.75% 2.07% 1.12% 1.14%
Operating Cash Flow 520.12 351.54 499.59 323.57
Cash Profit 14.07% 16.44% 16.29% 16.73%
Financing Cash Flow -232.66 -94.22 -227.87 -9.77
EBITDA 18.94% 20.61% 20.04% 19.48%
Investing Cash Flow -188.58 -228.82 -259.65 -238.38
Capital Employed 46.18% 44.71% 30.09% 36.71%
Free Cash Flow 335.32 246.22 291.52 362.17
Enterprise Value 496.83% 514.92% 479.92% 356.25%
Net Cash Flow 98.88 28.50 12.07 75.42
Market Capitalization 493.07% 509.64% 481.80% 356.34%
Closing Balance 291.29 192.41 163.91 143.68
Key Ratios
June'12 Mar'12 Dec'11 Sept'11
Balance Sheet (Rs. Cr.)
FY 12 FY 11 FY 10 FY 09
3 months 3 months 3 months 3 months
Annual Annual Annual Annual
Interest Coverage (x) 101.14 -1401.62 30.45 135.33
Equity Capital 174.21 174.07 86.76 86.51
PBT Margin (%) 14.87% 16.79% 16.65% 20.01%
Reserves 1023.97 810.28 647.93 624.09
PAT Margin (%) 11.69% 13.43% 13.91% 15.74%
Net worth 1303.27 1101.16 749.38 738.20
ROE (%) 67.85% 75.34% 57.93% 79.14%
Market Capitalization 18535.94 16719.42 13760.14 8538.54
ROCE (%) 35.34% 45.12% 165.02% 125.62%
Debt 432.91 365.51 109.97 141.37
EPS (Rs.) 0.68 0.76 0.58 0.80
Payable within 1 yr. 0.00 0.00 0.31 0.00
Capital Employed 1736.18 1466.67 859.35 879.57
Highlights FY 12 FY 11 FY 10 FY 09
Annual Annual Annual Annual
Gross Block 883.23 766.88 687.23 518.77
Interest Coverage (x) 42.63 50.69 40.07 30.37
Less: Depreciation 297.90 269.32 236.28 210.45
PBT Margin (%) 15.62% 18.18% 18.45% 17.74%
Net Block 585.33 497.56 450.95 308.32
PAT Margin (%) 12.15% 14.26% 14.95% 15.31%
Capital WIP 11.58 4.37 23.31 51.71
ROE (%) 35.54% 42.81% 57.83% 50.60%
ROCE (%) 37.54% 52.36% 62.58% 62.66%
Investments 1006.42 926.04 348.51 436.90
EPS (Rs.) 2.66 2.71 2.50 2.16
Debtors 224.17 202.46 130.48 112.36
Price/ EPS (x) 40.01 35.47 31.75 22.86
Cash & Bank balance 291.29 192.41 163.91 143.69
CEPS 3.04 3.10 2.68 2.32
Loans & Advances 153.72 102.51 320.44 223.06
Price/ CEPS (x) 35.03 31.00 29.58 21.29
Other Current Assets 39.63 21.97 4.68 4.22
BV/ Share 6.88 5.65 8.44 8.11
Total Current Assets 1237.38 979.94 917.95 745.05
Price/ BV (x) 15.47 16.99 18.80 12.16
Total Current Liabilities 1077.42 923.84 872.16 664.10
M. Cap/ Sales (x) 4.93 5.10 4.82 3.56
Net Current Assets 159.96 56.10 45.79 80.95
Debt/ Equity (x) 0.36 0.37 0.15 0.20
Dividend Yield (%) 1.22% 1.20% 1.26% 1.77%
Contingent Liabilities 1325.07 1013.30 164.29 194.83
Page 6
© Sumpoorna 2012
6
War Horse –Dabur India Ltd. September 28, 2012
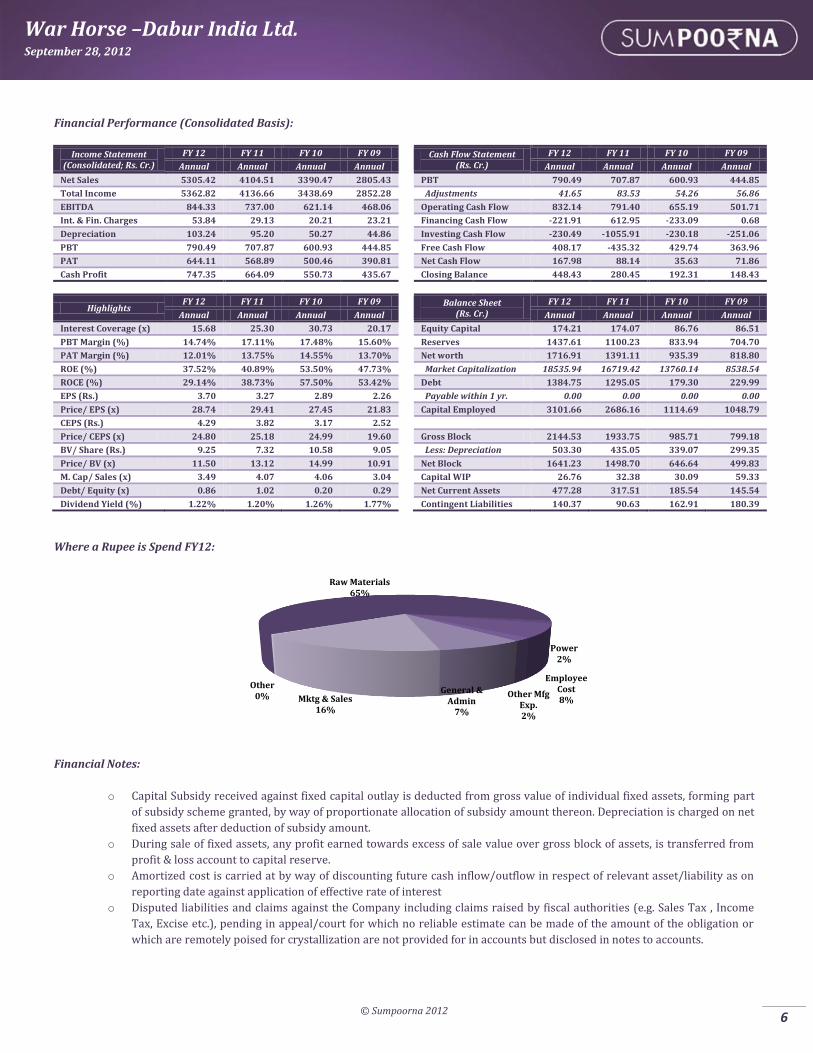
Financial Performance (Consolidated Basis):
Income Statement (Consolidated; Rs. Cr.)
FY 12 FY 11 FY 10 FY 09
Cash Flow Statement (Rs. Cr.)
FY 12 FY 11 FY 10 FY 09
Annual Annual Annual Annual
Annual Annual Annual Annual
Net Sales 5305.42 4104.51 3390.47 2805.43
PBT 790.49 707.87 600.93 444.85
Total Income 5362.82 4136.66 3438.69 2852.28
Adjustments 41.65 83.53 54.26 56.86
EBITDA 844.33 737.00 621.14 468.06
Operating Cash Flow 832.14 791.40 655.19 501.71
Int. & Fin. Charges 53.84 29.13 20.21 23.21
Financing Cash Flow -221.91 612.95 -233.09 0.68
Depreciation 103.24 95.20 50.27 44.86
Investing Cash Flow -230.49 -1055.91 -230.18 -251.06
PBT 790.49 707.87 600.93 444.85
Free Cash Flow 408.17 -435.32 429.74 363.96
PAT 644.11 568.89 500.46 390.81
Net Cash Flow 167.98 88.14 35.63 71.86
Cash Profit 747.35 664.09 550.73 435.67
Closing Balance 448.43 280.45 192.31 148.43
Highlights
FY 12 FY 11 FY 10 FY 09
Balance Sheet (Rs. Cr.)
FY 12 FY 11 FY 10 FY 09
Annual Annual Annual Annual
Annual Annual Annual Annual
Interest Coverage (x) 15.68 25.30 30.73 20.17
Equity Capital 174.21 174.07 86.76 86.51
PBT Margin (%) 14.74% 17.11% 17.48% 15.60%
Reserves 1437.61 1100.23 833.94 704.70
PAT Margin (%) 12.01% 13.75% 14.55% 13.70%
Net worth 1716.91 1391.11 935.39 818.80
ROE (%) 37.52% 40.89% 53.50% 47.73%
Market Capitalization 18535.94 16719.42 13760.14 8538.54
ROCE (%) 29.14% 38.73% 57.50% 53.42%
Debt 1384.75 1295.05 179.30 229.99
EPS (Rs.) 3.70 3.27 2.89 2.26
Payable within 1 yr. 0.00 0.00 0.00 0.00
Price/ EPS (x) 28.74 29.41 27.45 21.83
Capital Employed 3101.66 2686.16 1114.69 1048.79
CEPS (Rs.) 4.29 3.82 3.17 2.52
Price/ CEPS (x) 24.80 25.18 24.99 19.60
Gross Block 2144.53 1933.75 985.71 799.18
BV/ Share (Rs.) 9.25 7.32 10.58 9.05
Less: Depreciation 503.30 435.05 339.07 299.35
Price/ BV (x) 11.50 13.12 14.99 10.91
Net Block 1641.23 1498.70 646.64 499.83
M. Cap/ Sales (x) 3.49 4.07 4.06 3.04
Capital WIP 26.76 32.38 30.09 59.33
Debt/ Equity (x) 0.86 1.02 0.20 0.29
Net Current Assets 477.28 317.51 185.54 145.54
Dividend Yield (%) 1.22% 1.20% 1.26% 1.77%
Contingent Liabilities 140.37 90.63 162.91 180.39
Where a Rupee is Spend FY12:
Financial Notes:
o Capital Subsidy received against fixed capital outlay is deducted from gross value of individual fixed assets, forming part
of subsidy scheme granted, by way of proportionate allocation of subsidy amount thereon. Depreciation is charged on net
fixed assets after deduction of subsidy amount.
o During sale of fixed assets, any profit earned towards excess of sale value over gross block of assets, is transferred from
profit & loss account to capital reserve.
o Amortized cost is carried at by way of discounting future cash inflow/outflow in respect of relevant asset/liability as on
reporting date against application of effective rate of interest
o Disputed liabilities and claims against the Company including claims raised by fiscal authorities (e.g. Sales Tax , Income
Tax, Excise etc.), pending in appeal/court for which no reliable estimate can be made of the amount of the obligation or
which are remotely poised for crystallization are not provided for in accounts but disclosed in notes to accounts.
Raw Materials65%
Power2%
Employee Cost8%
Other Mfg Exp.2%
General & Admin
7%
Mktg & Sales16%
Other0%
Page 7
© Sumpoorna 2012
7
War Horse –Dabur India Ltd. September 28, 2012
Investment rating scale: Buy (>15% returns);
Add (5% <15% returns); Sell (<-5% returns)
Source:
Sumpoorna Research, Company website and other publicly available data
Document prepared by:
Ishu Mann Nitesh Aggarwala
For further information, please contact
Sumpoorna Global Markets & Economics Research
Phone:
+91 120 4505200
Email: [email protected]
url:
www.sumpoornaonline.com
Note: The information and opinions in this report have been prepared by Sumpoorna and are
subject to change without any notice. Please contact Sumpoorna for more
information on investment decisions. Sumpoorna, its affiliates and clients may have
investment positions in the investment vehicles recommended in this report.
Disclosure Sumpoorna Portfolio Limited and its affiliates (collectively referred to as ‘Sumpoorna’) are a full-service, integrated investment banking, investment management and brokerage and financing group. We along with affiliates are underwriter of securities and participate in virtually all securities trading markets in India. Our research professionals provide important input into our investment banking and other business selection processes. Sumpoorna generally prohibits its analysts, persons reporting to analysts and their dependent family members from maintaining a financial interest in the securities or derivatives of any companies that the analysts cover. Disclaimer This document is solely for the personal information of the recipient, and must not be singularly used as the basis of any investment decision. Nothing in this document should be construed as investment or financial advice. Each recipient of this document should make such investigations as they deem necessary to arrive at an independent evaluation of an investment in the security/ instrument referred to in this document (including the merits and risks involved), and should consult their own advisors to determine the merits and risks of such an investment. This document is being supplied to you solely for your information, and its contents, information or data may not be reproduced, redistributed or passed on, directly or indirectly. This report is not directed or intended for distribution to, or use by, any person or entity who is a citizen or resident of or located in any locality, state, country or other jurisdiction, where such distribution, publication, availability or use would be contrary to law, regulation or which would subject Sumpoorna and affiliates to any registration or licensing requirement within such jurisdiction. The securities described herein may or may not be eligible for sale in all jurisdictions or to certain category of investors. Persons in whose possession this document may come are required to inform themselves of and to observe such restriction. Sumpoorna Portfolio Limited, its affiliates, directors, its proprietary trading and investment businesses (collectively referred to as ‘Sumpoorna’) may, from time to time, make investment decisions that are inconsistent with or contradictory to the recommendations expressed herein. The views contained in this document are those of the analyst, and the company may or may not subscribe to all the views expressed within. The information in this document has been printed on the basis of publicly available information, internal data and other reliable sources believed to be true, but we do not represent that it is accurate or complete and it should not be relied on as such, as this document is for general guidance only. Sumpoorna or any of its affiliates/ group companies shall not be in any way responsible for any loss or damage that may arise to any person from any inadvertent error in the information contained in this report. Sumpoorna has not independently verified all the information contained within this document. Accordingly, we cannot testify, nor make any representation or warranty, express or implied, to the accuracy, contents or data contained within this document. While Sumpoorna endeavors to update on a reasonable basis the information discussed in this material, there may be regulatory, compliance, or other reasons that prevent us from doing so. Neither Sumpoorna, its directors, employees nor its affiliates shall be liable for any loss or damage that may arise from or in connection with the use of this information.