Performance & Information Team, FCS March 2013 2011 Census of Population Ward Profile 1 • 59 per cent of all aged 16 and over never married • There are 4,931 households (8 per cent increase) • 34 per cent are single adult households • 38 per cent are owner-occupiers (47 per cent in 2001) and 38.5 per cent rent privately • 53 per cent of households do not have access to a car or van • 58 per cent of residents have a level 4 qualification (degree level) • 79 per cent of adults aged 16-74 are economically active (74 per cent in 2001) • 72 per cent are in employment • 85 per cent work full-time (over 30 hours) • The largest source of employment is the profes- sional, scientific and technical activities sector (20 per cent) • 46 per cent of employed residents are working as managers, directors, senior officials or in profes- sional occupations TOWN Ward Profile Based on data from the 2011 Census produced by the ONS Population 11,201 Households 4,931 Avg. Household Size 2.27 Area (hectares) 65.0 Population Density (pph) 172.3 BME Background 48.7% Non-UK Born 40.4% Non-Christians 41.3% Very Good Health 61.9% Long-term Illness 10.0% Provide Unpaid Care 5.7% Single Adult Household 34.3% Private Renters 38.5% Without a Car 52.7% In Employment 71.9% Degree Qualification 57.9% Map 1: Ward Location INTRODUCTION The Census occurs once every ten years and provides a wealth of data about the population of England and Wales. The most recent Census Day fell on 27 March 2011 and the Office for National Statistics has now released detailed data at ward level. This profile captures the defining characteristics of the population and it is grouped into three sections. Who we are: Population, ethnic group, country of birth, passport held, national identity, household lan- guage, length of residence, religion, health. How we live: Household composition, marital status, living arrangements, accommodation type, tenure, occupancy, car availability. What we do: Economic activity, hours worked, travel to work, employment industry, occupation, qualifica- tions and students, provision of unpaid care. HEADLINE DATA • The population has risen by 1,302 (13 per cent) since 2001 to 11,201 people • It is the fifth most densely populated ward in LBHF (172 people per hectare) • 76 per cent are residents of working age (16-64) • The White British population has fallen from 63 per cent to 51 per cent in the intercensal period • Foreign-born residents made up 40 per cent of total population - up from 32 per cent in 2001 • A high proportion of residents born in France, Aus- tralia and United States • In 12 per cent of households, no resident speaks English as a main language • Christians remained the largest religious group - 59 per cent of residents (68 per cent in 2001) • 89 per cent of residents declared themselves in good or very good health • 6 per cent provide informal care CENSUS KEY STATISTICS FACTS
Transcript
Performance & Information Team, FCS March 2013
2011 Census of Population Ward Profile
1
• 59 per cent of all aged 16 and over never married
• There are 4,931 households (8 per cent increase)
• 34 per cent are single adult households
• 38 per cent are owner-occupiers (47 per cent in
2001) and 38.5 per cent rent privately
• 53 per cent of households do not have access to a
car or van
• 58 per cent of residents have a level 4 qualification
(degree level)
• 79 per cent of adults aged 16-74 are economically
active (74 per cent in 2001)
• 72 per cent are in employment
• 85 per cent work full-time (over 30 hours)
• The largest source of employment is the profes-
sional, scientific and technical activities sector (20
per cent)
• 46 per cent of employed residents are working as
managers, directors, senior officials or in profes-
sional occupations
TOWN Ward Profile
Based on data from the 2011 Census produced by the ONS
Population 11,201
Households 4,931
Avg. Household Size 2.27
Area (hectares) 65.0
Population Density (pph) 172.3
BME Background 48.7%
Non-UK Born 40.4%
Non-Christians 41.3%
Very Good Health 61.9%
Long-term Illness 10.0%
Provide Unpaid Care 5.7%
Single Adult Household 34.3%
Private Renters 38.5%
Without a Car 52.7%
In Employment 71.9%
Degree Qualification 57.9%
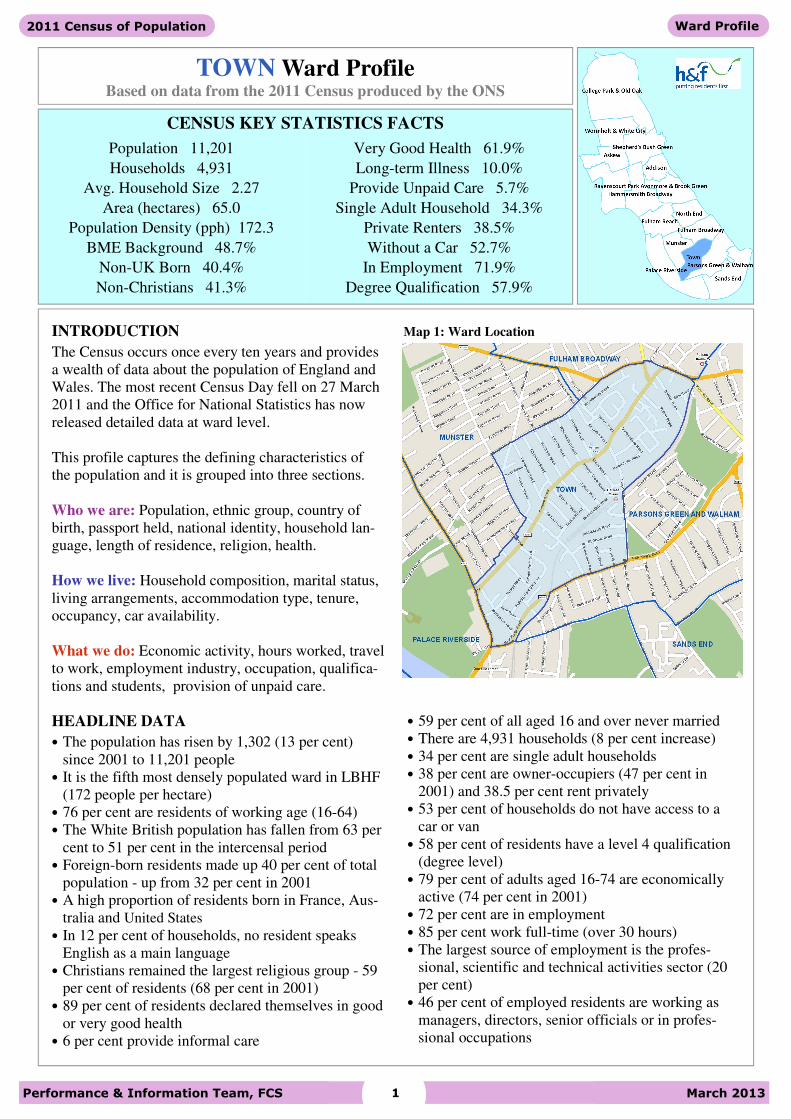
Map 1: Ward Location
INTRODUCTION
The Census occurs once every ten years and provides
a wealth of data about the population of England and
Wales. The most recent Census Day fell on 27 March
2011 and the Office for National Statistics has now
released detailed data at ward level.
This profile captures the defining characteristics of
the population and it is grouped into three sections.
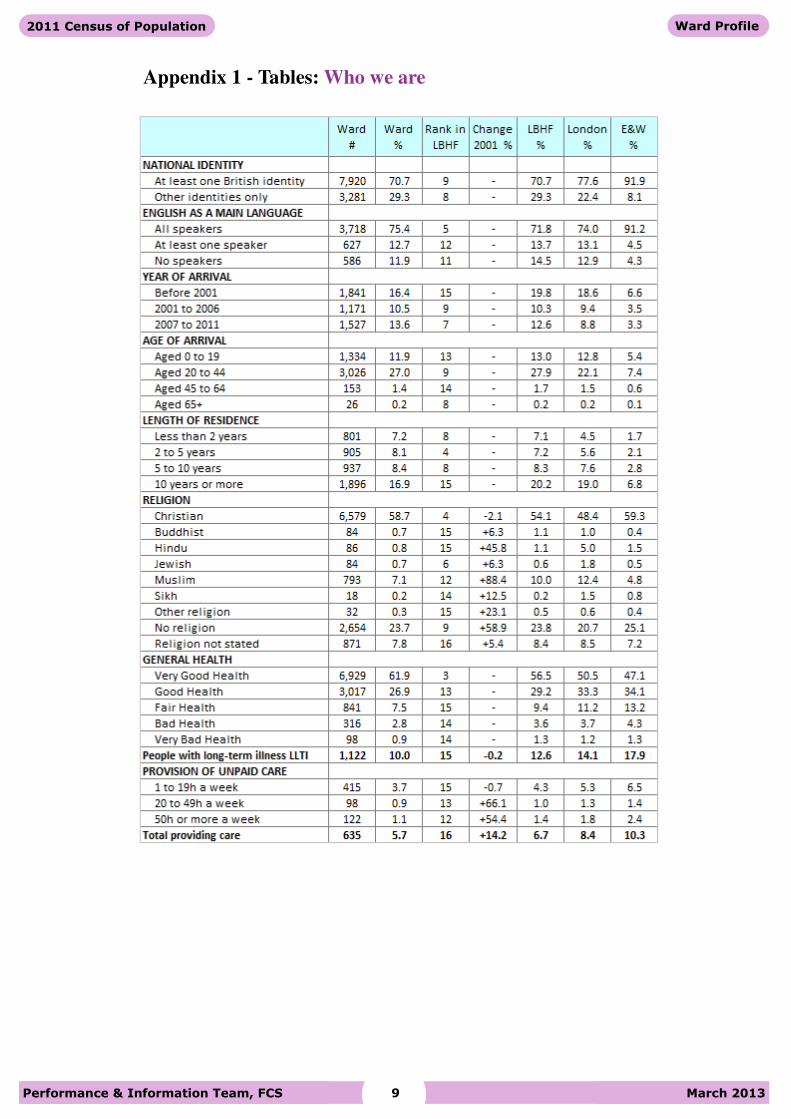
Who we are: Population, ethnic group, country of
birth, passport held, national identity, household lan-
guage, length of residence, religion, health. How we live: Household composition, marital status,
living arrangements, accommodation type, tenure,
occupancy, car availability. What we do: Economic activity, hours worked, travel
to work, employment industry, occupation, qualifica-
tions and students, provision of unpaid care.
HEADLINE DATA
• The population has risen by 1,302 (13 per cent)
since 2001 to 11,201 people
• It is the fifth most densely populated ward in LBHF
(172 people per hectare)
• 76 per cent are residents of working age (16-64)
• The White British population has fallen from 63 per
cent to 51 per cent in the intercensal period
• Foreign-born residents made up 40 per cent of total
population - up from 32 per cent in 2001
• A high proportion of residents born in France, Aus-
tralia and United States
• In 12 per cent of households, no resident speaks
English as a main language
• Christians remained the largest religious group - 59
per cent of residents (68 per cent in 2001)
• 89 per cent of residents declared themselves in good
or very good health
• 6 per cent provide informal care
CENSUS KEY STATISTICS FACTS
Performance & Information Team, FCS March 2013
2011 Census of Population Ward Profile
2
10
.1
2.3
5.6
4.8
3.9
1.1
4.1
14
.9
1.7
5.7
6.5
4.9
2.0
4.7
14.8
2.3
6.9
8.9
4.0
1.8
3.8
10.3
1.9
7.6
11.8
3.0
1.1
1.0
EU countries Rest of Europe Africa Middle Eastand Asia
North AmericaThe Caribbean
SouthAmerica
Australasia
Ward 2001 Ward 2011 LBHF 2011 London 2011
62.9
3.9
17
.6
6.9
4.1
2.9
1.6
51
.3
3.4
22.6
8.0
6.0
4.7
3.9
44.9
3.5
19.7
11.8
9.1
5.5
5.5
44.9
2.2
12.7
13.3
18.5
5.0
3.4
White British White Irish White Other Black/BlackBritish
Asian/AsianBritish
Mixed Other ethnicgroup
Ward 2001 Ward 2011 LBHF 2011 London 2011
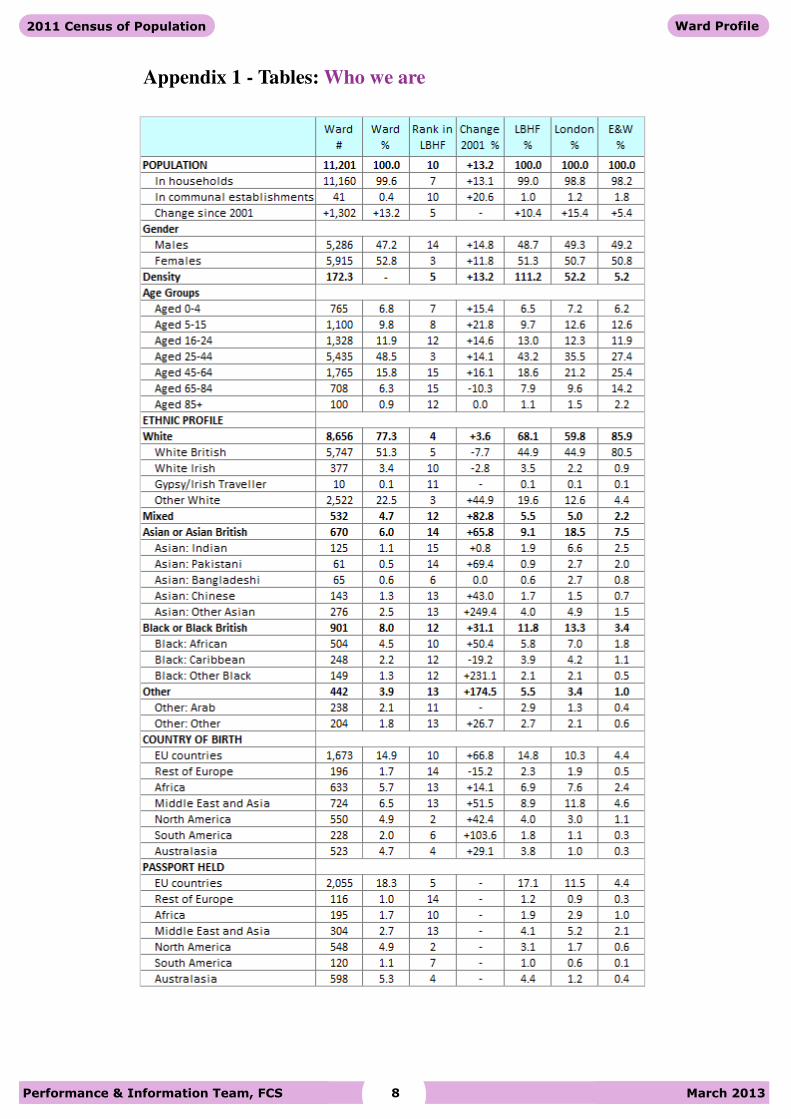
Ethnic group The ward ranks fifth highest on the proportion of the
population describing themselves as White British (51.3
per cent), and third highest on proportion of ‘Other
White’ residents (22.5 per cent).
Since 2001, there has been a 48.5 per cent increase in the
number of residents from black and minority ethnic
(BME) groups to 5,454 in 2011; the fifth lowest number
in LBHF.
Figure 2: Ethnic groups
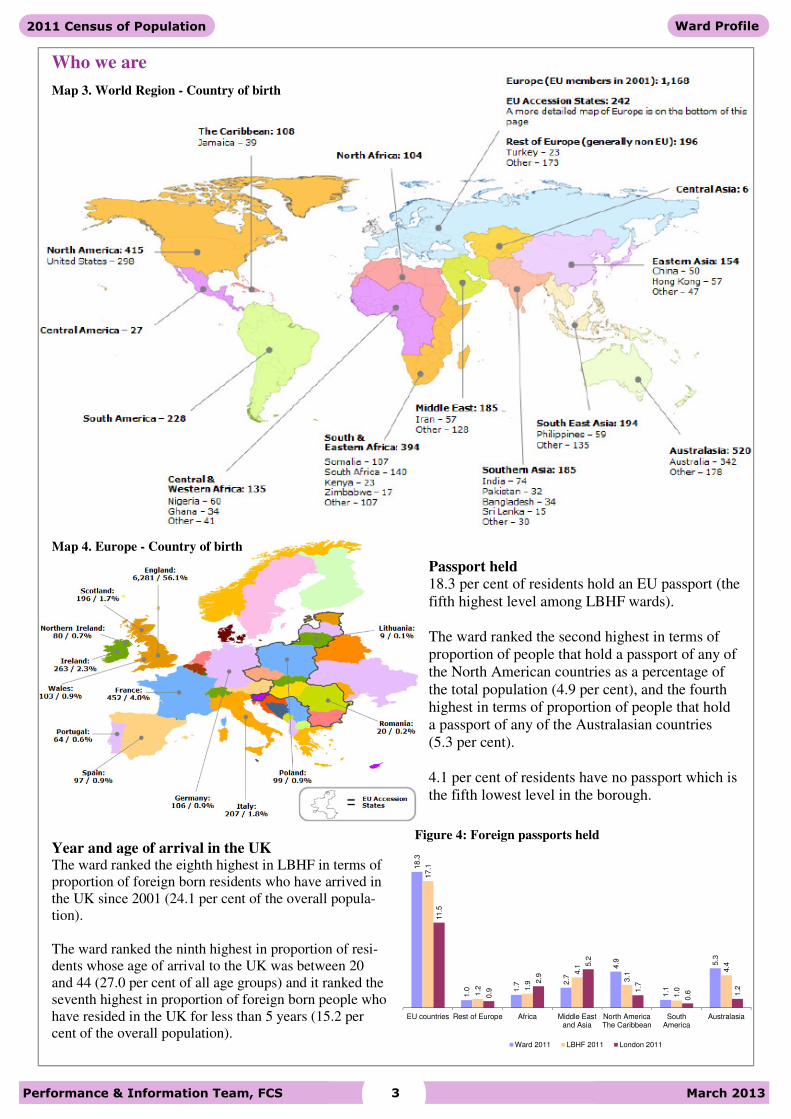
Country of birth
6,281 residents in the ward were born in England (56.1
per cent). The proportion for Scotland, Wales and North-
ern Ireland stands at 3.4 per cent of the total population.
Foreign-born residents made up 40.4 per cent of the
ward’s population; the tenth highest level in LBHF.
France supplied most foreign-born residents (452) fol-
lowed by Australia (342), United States (298), Republic
of Ireland (263) and Italy (207).
14.9 per cent of the ward population were born in an EU
country (the tenth highest among all wards) compared
with 14.8 per cent in LBHF and 10.3 per cent in London
as a whole.
Figure 3: Foreign born residents
Who we are
Population overview The population has risen by 13.2 per cent from 9,899 in
2001 to 11,201 on Census day in 2011; this is the fifth
highest population growth among LBHF wards (see map
2).
There are more females (52.8 per cent) than males (47.2
per cent).
The ward at 65.0 hectares is the fourth smallest in LBHF
and it is the fifth most densely populated with density of
172.3 people per hectare.
Age structure Figure 1 shows a pyramid of five-year age groups by
gender for 2011 and 2001.
16.7 per cent of the population is under 16 (16.2 per cent
in LBHF), 76.1 per cent are working age people (74.8
per cent in LBHF) while 7.2 per cent are elderly popula-
tion (9 per cent in LBHF).
Figure 1: Age / gender pyramid
Note: White Other also includes Gypsy/Irish Traveller group
Performance & Information Team, FCS March 2013
2011 Census of Population Ward Profile
3
18.3
1.0 1
.7 2.7
4.9
1.1
5.3
17
.1
1.2 1
.9
4.1
3.1
1.0
4.4
11.5
0.9
2.9
5.2
1.7
0.6 1
.2
EU countries Rest of Europe Africa Middle Eastand Asia
North AmericaThe Caribbean
SouthAmerica
Australasia
Ward 2011 LBHF 2011 London 2011
Figure 4: Foreign passports held
Year and age of arrival in the UK The ward ranked the eighth highest in LBHF in terms of
proportion of foreign born residents who have arrived in
the UK since 2001 (24.1 per cent of the overall popula-
tion).
The ward ranked the ninth highest in proportion of resi-
dents whose age of arrival to the UK was between 20
and 44 (27.0 per cent of all age groups) and it ranked the
seventh highest in proportion of foreign born people who
have resided in the UK for less than 5 years (15.2 per
cent of the overall population).
Map 3. World Region - Country of birth
Passport held 18.3 per cent of residents hold an EU passport (the
fifth highest level among LBHF wards).
The ward ranked the second highest in terms of
proportion of people that hold a passport of any of
the North American countries as a percentage of
the total population (4.9 per cent), and the fourth
highest in terms of proportion of people that hold
a passport of any of the Australasian countries
(5.3 per cent).
4.1 per cent of residents have no passport which is
the fifth lowest level in the borough.
Map 4. Europe - Country of birth
Who we are
Performance & Information Team, FCS March 2013
2011 Census of Population Ward Profile
4
61.9
26.9
7.5
2.8
0.9
56.5
29
.2
9.4
3.6
1.3
50.5
33.3
11.2
3.7
1.2
Very Good Health Good Health Fair Health Bad Health Very Bad Health
Ward 2011 LBHF 2011 London 2011
67.9
0.8
0.6
0.8 4
.3
0.2
0.3
16
.9
8.3
58.7
0.7
0.8
0.7
7.1
0.2
0.3
23.7
7.8
54
.1
1.1
1.1
0.6
10.0
0.2
0.5
23.8
8.4
48.4
1
5.0
1.8
12
.4
1.5
0.6
20.7
8.5
Christian Buddhist Hindu Jewish Muslim Sikh Otherreligion
No religion Religionnot stated
Ward 2001 Ward 2011 LBHF 2011 London 2011
There has been a 2.8 percentage point increase in the
Muslim population to 793 in 2011; the fifth lowest
number in LBHF.
23.7 per cent of residents stated as having no religion
(ranked ninth highest), while 7.8 per cent did not an-
swer the question related to religion.
Figure 5: Religious groups
Health 88.8 per cent of residents assess their health as ‘good’
or ‘very good’; this is the third highest in LBHF.
3.7 per cent rate their health as ’bad’ or ’very bad’
compared to 4.9 per cent across the borough.
Figure 6: General health
In the 2011 Census, 10.0 per cent (1,122) of residents
reported to have a long-term health problem or disabil-
ity that limits their day-to-day activities. This is the
second lowest level in the borough and a decrease of
0.2 per cent since 2001 (the twelfth highest).
Who we are
National identity
70.7 per cent of residents identify themselves as a
category that refers to a British national identity (e.g.
English, Welsh, Scottish, Northern Irish and other
categories associated with Britain); ranked the ninth
highest in LBHF.
23.1 per cent had a British only national identity
(ranked fourth lowest) while ‘other identities only’
account for 29.3 per cent of all categories (ranked
eighth highest).
Household language
75.4 per cent of households contain people aged 16
and over who all speak English as a main language;
ranked fifth highest.
11.9 per cent of households have no people that speak
English as a main language; this is the sixth lowest
proportion in LBHF.
1.9 per cent (207) of residents cannot speak English
well or at all; this is the fourth lowest proportion in the
borough.
The main languages spoken in the ward are French
(497 people), Spanish (199), Italian (178), Arabic
(140), Portuguese (109), Polish (94) and Somali (82).
Religion
The ward ranks the fourth highest on proportion of
Christians (58.7 per cent), with a decline of 9.2 per-
centage points since 2001.
Performance & Information Team, FCS March 2013
2011 Census of Population Ward Profile
5
20
.9
25.8
0.5
19
.1
6.1
27.5
16.3
19
.5
1.9
17
.6
6.2
38.5
15.9 1
8.1
1.6
15.7
15.4
33
.2
21
.1
27.1
1.3
13.5
10
.6
26.3
Owned outright Owned with amortgage or loan
Sharedownership
Rented fromcouncil (LA)
Other socialrented (HA)
Private rentedand rent free
Ward 2001 Ward 2011 LBHF 2011 London 2011
0.8
3.9
23
.6
32
.6 35
.3
3.9
0.01.2 3
.2
22
.2
38
.6
30
.0
4.9
0.01
.4
4.9
20
.6
42
.7
28
.0
2.3
0.1
6.2
18
.6
22
.9
37
.6
12.7
1.9
0.1
Detachedhouse
Semi-detachedhouse
Terracedhouse
Purpose-builtflat
Converted flat Flat-commercial
building
Other-temporarystructure
Ward 2001 Ward 2011 LBHF 2011 London 2011
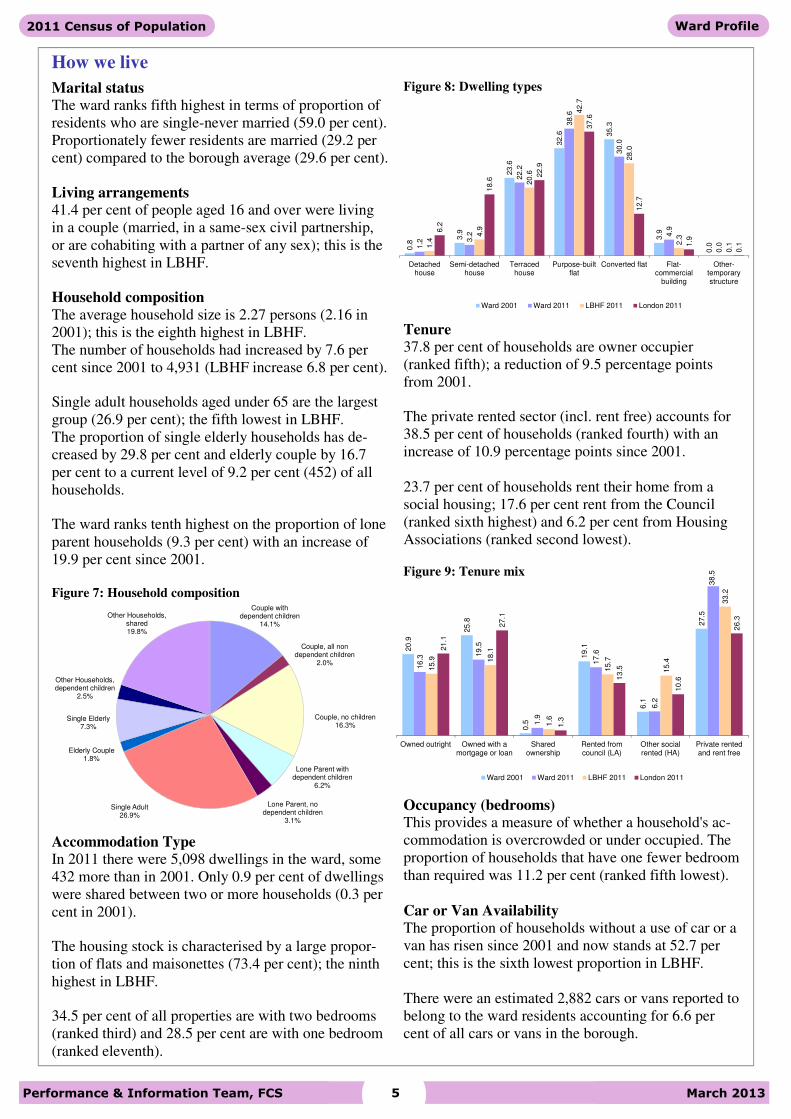
Figure 8: Dwelling types
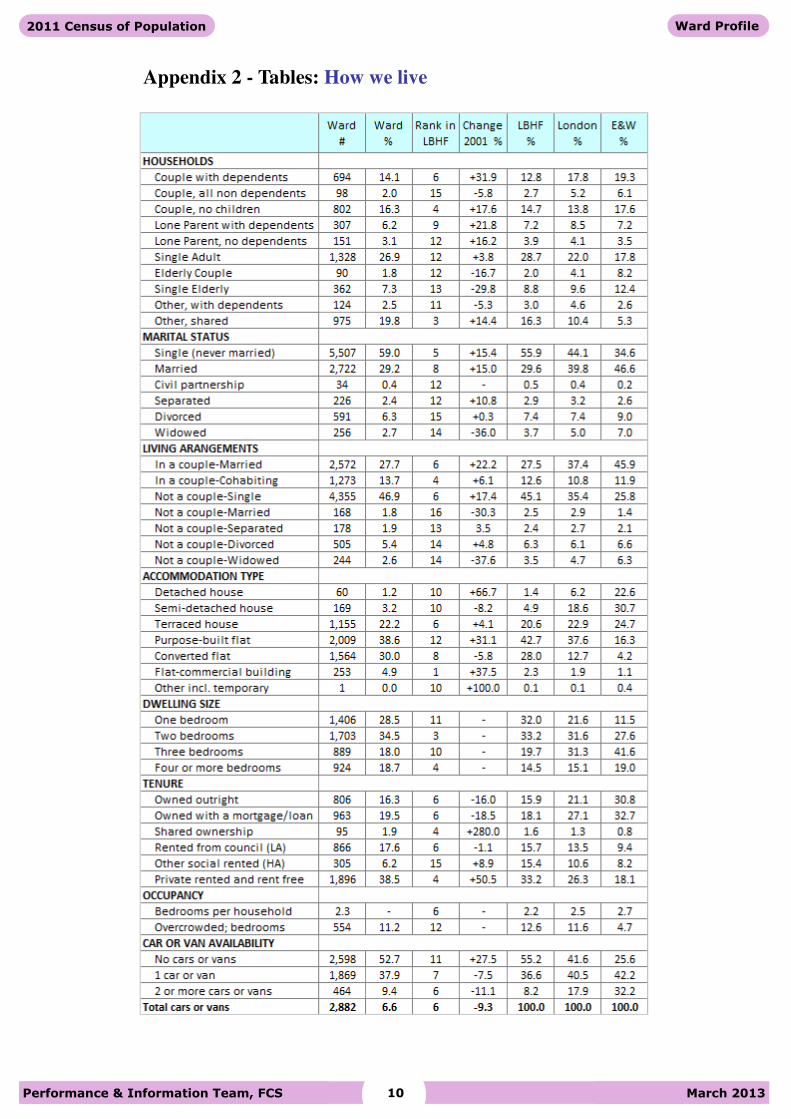
Tenure
37.8 per cent of households are owner occupier
(ranked fifth); a reduction of 9.5 percentage points
from 2001.
The private rented sector (incl. rent free) accounts for
38.5 per cent of households (ranked fourth) with an
increase of 10.9 percentage points since 2001.
23.7 per cent of households rent their home from a
social housing; 17.6 per cent rent from the Council
(ranked sixth highest) and 6.2 per cent from Housing
Associations (ranked second lowest).
Figure 9: Tenure mix
Occupancy (bedrooms) This provides a measure of whether a household's ac-
commodation is overcrowded or under occupied. The
proportion of households that have one fewer bedroom
than required was 11.2 per cent (ranked fifth lowest).
Car or Van Availability The proportion of households without a use of car or a
van has risen since 2001 and now stands at 52.7 per
cent; this is the sixth lowest proportion in LBHF.
There were an estimated 2,882 cars or vans reported to
belong to the ward residents accounting for 6.6 per
cent of all cars or vans in the borough.
How we live
Marital status
The ward ranks fifth highest in terms of proportion of
residents who are single-never married (59.0 per cent).
Proportionately fewer residents are married (29.2 per
cent) compared to the borough average (29.6 per cent).
Living arrangements
41.4 per cent of people aged 16 and over were living
in a couple (married, in a same-sex civil partnership,
or are cohabiting with a partner of any sex); this is the
seventh highest in LBHF.
Household composition
The average household size is 2.27 persons (2.16 in
2001); this is the eighth highest in LBHF.
The number of households had increased by 7.6 per
cent since 2001 to 4,931 (LBHF increase 6.8 per cent).
Single adult households aged under 65 are the largest
group (26.9 per cent); the fifth lowest in LBHF.
The proportion of single elderly households has de-
creased by 29.8 per cent and elderly couple by 16.7
per cent to a current level of 9.2 per cent (452) of all
households.
The ward ranks tenth highest on the proportion of lone
parent households (9.3 per cent) with an increase of
19.9 per cent since 2001. Figure 7: Household composition
Accommodation Type In 2011 there were 5,098 dwellings in the ward, some
432 more than in 2001. Only 0.9 per cent of dwellings
were shared between two or more households (0.3 per
cent in 2001).
The housing stock is characterised by a large propor-
tion of flats and maisonettes (73.4 per cent); the ninth
highest in LBHF.
34.5 per cent of all properties are with two bedrooms
(ranked third) and 28.5 per cent are with one bedroom
(ranked eleventh).
Couple with dependent children
14.1%
Couple, all non dependent children
2.0%
Couple, no children 16.3%
Lone Parent with dependent children
6.2%
Lone Parent, no dependent children
3.1%
Single Adult 26.9%
Elderly Couple 1.8%
Single Elderly 7.3%
Other Households, dependent children
2.5%
Other Households, shared 19.8%
Performance & Information Team, FCS March 2013
2011 Census of Population Ward Profile
6
4.2
9.4
54
.6
31
.9
5.3
10
.1
53
.9
30
.7
7.1
12
.2
57
.4
23
.3
8.7
17
.0
58.5
15
.9
Part-time: 15h or less Part-time: 16 to 30h Full-time: 31 to 48h Full-time: 49h or more
Ward 2001 Ward 2011 LBHF 2011 London 2011
6.6
5.9
6.4
3.2
3.9
4.7
5.8
5.3
3.0
2.3
6.3
8.2
4.6
3.9
3.0
8.4
7.8
5.2
3.7
3.2
Retired Student Looking athome/family
Long-termsick/disabled
Other
Ward 2001 Ward 2011 LBHF 2011 London 2011
5.6
51
.5
10
.6
4.4
1.9
6.2
52
.6
13
.2
4.4
2.6
7.6
45
.8
12
.3
4.9
3.5
10
.9
39
.8
11
.7
5.2
4.1
Employee:Part-time
Employee:Full-time
Self-employed Unemployed Full-time student
Ward 2001 Ward 2011 LBHF 2011 London 2011
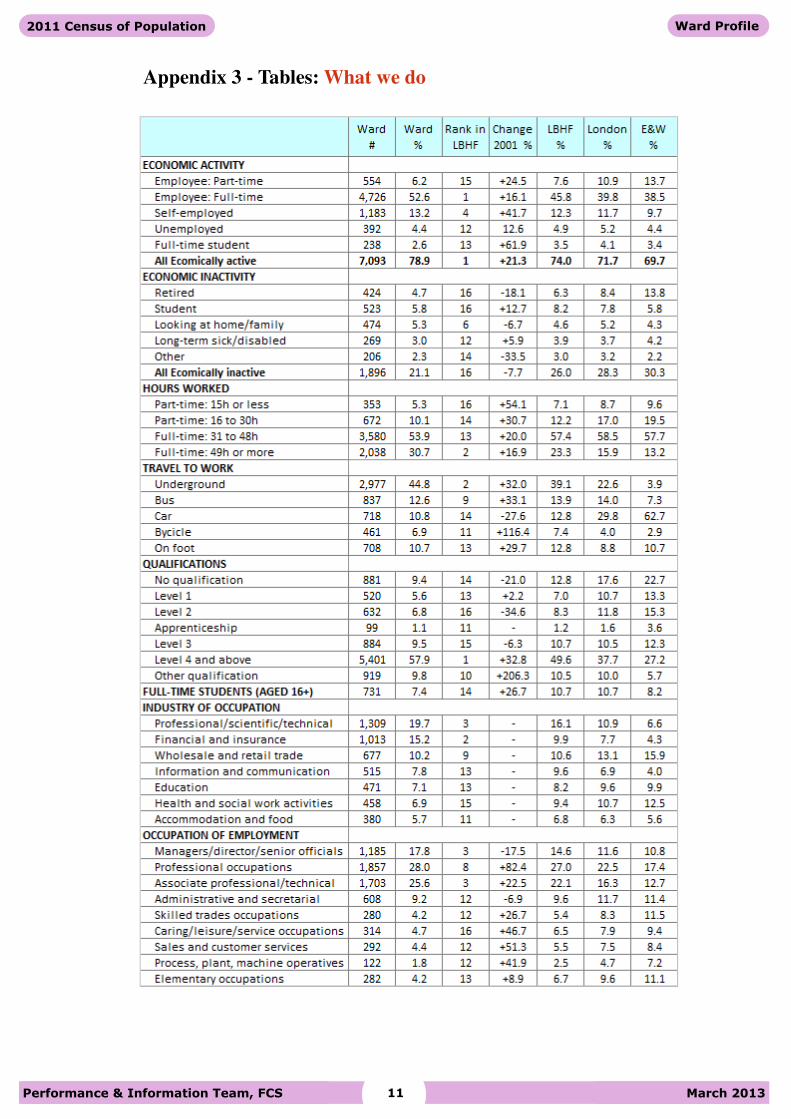
Hours worked The ward ranked second highest in terms of proportion
of full-time workers to the overall workforce at 84.6
per cent compared to 80.7 per cent in LBHF and 74.4
per cent in London.
The proportion of part-time workers has increased by
1.8 percentage points since 2001 to 1,025 people; the
second lowest rise among LBHF wards.
Figure 12: Employed residents by hours worked
Method of travel to work The top three methods of travel to work are under-
ground (45 per cent, ranked second), bus (13 per cent,
ranked ninth) and car (11 per cent, ranked fourteenth).
Provision of unpaid care
5.7 per cent of the population provide informal care
(ranked the lowest); up from 5.6 per cent in 2001.
65.4 per cent were giving less than 20 hours care a
week (ranked ninth), 15.4 per cent provided between
20 to 49 hours (ranked seventh) and 19.2 per cent pro-
vided 50 or more hours (ranked tenth).
What we do
Economic activity
In 2011, there were 78.9 per cent economically active
people (working or looking for work) aged 16-74; that
was the highest rate in LBHF.
The economic activity rate for males was 84.8 per cent
(ranked the highest) and for females was 73.6 per cent
(ranked fourth).
Figure 10: Economic activity
71.9 per cent were in employment (the highest among
all wards) compared to 65.7 per cent in LBHF and
62.4 per cent in London.
52.6 per cent of those were full-time employees
(ranked the highest), 6.2 per cent were part-time em-
ployees (ranked second lowest) and 13.2 per cent were
self-employed (ranked fourth highest).
4.4 per cent of residents aged 16-74 were unemployed
and looking for work (ranked fifth lowest).
Figure 11: Economic inactivity
21.1 per cent were economically inactive residents
(permanently sick or disabled, looking after family/
home, retired and some students); the lowest among
all wards in the borough (LBHF 26 per cent and Lon-