35
WARD REVIEW AND REPRESENTATION DISCUSSION PAPER Town of East Fremantle

WARD REVIEW AND REPRESENTATION
DISCUSSION PAPER
Town of East Fremantle


1
1.0 BACKGROUND
The Town of East Fremantle resolved on 19 July 2016 to undertake a review of its ward system and representation to comply with the Local Government Act 1995. Clause 6 of Schedule 2.2 of the Local Government Act 1995 requires a local government which has wards, to carry out a review of the ward boundaries and the number of councillors for each ward (representation) from time to time so that no more than eight years elapse between successive reviews. The Town of East Fremantle completed its last review of wards and representation in 2006.
2.0 REVIEW PROCESS
The review process involves a number of steps:
The Council resolves to undertake the review;
Public submission period opens;
Information provided to the community for discussion;
Public submission period closes;
The Council considers all submissions and relevant factors and makes a decision;
The Council submits a report to the Local Government Advisory Board (LGAB) for its
consideration; and
If a change is proposed, the LGAB submits a recommendation to the Minister for Local
Government.
Any changes approved by the Minister where possible will be in place for the next local
government election where possible. The next local government election is scheduled for
October 2017.
3.0 FACTORS TO BE CONSIDERED IN REVIEW
When considering changes to wards and representation, Schedule 2.2 of the Local
Government Act specifies factors that must be taken into account by a local government as
part of the review process:
1 Community of interest;
2. Physical and topographic features;
3. Demographic trends;
4. Economic factors; and
5. Ratio of Councillors to Electors in the various wards.

2
3.1 Community of Interest
The term ‘community of interest’ has a number of elements. These include a sense of
community identity and belonging, similarities in the characteristics of the residents of a
community, and similarities in the economic activities. It can also include dependence on the
shared facilities in an area as reflected in catchment areas of local schools and sporting
teams, or the circulation areas of local newspapers.
Neighbourhoods, suburbs and towns are important units in the physical, historical and social
infrastructure, and often generate a feeling of community and belonging.
3.2 Physical and Topographical Features
These may be natural or man-made features that will vary from area to area. Water features
such as rivers and catchment boundaries may be relevant considerations. Coastal plain and
foothills regions, parks and reserves may be relevant, as may other man-made features such
as railway lines and freeways.
3.3 Demographic Trends
Several measurements of the characteristics of human populations, such as population size,
and its distribution by age, sex, occupation and location provide important demographic
information. Current and projected population characteristics will be relevant as well as
similarities and differences between areas within the local government.
3.4 Economic Factors
Economic factors can be broadly interpreted to include any factor that reflects the character of
economic activities and resources in the area. This may include the industries that occur in a
local government area (or the release of land for these), and the distribution of community
assets and infrastructure such as road networks.
3.5 Ratio of Councillor to Electors in the various Wards
It is expected that each local government will have similar ratios of electors to councillors
across the wards of its district.
Several additional factors need to be considered when reviewing Councillor representation
cross wards and the district as a whole. These include:
1. The advantages and disadvantages of reducing the number of Councillors;
2. The advantages and disadvantages of introducing a ‘no-ward’ structure;
3. The implications of any change to the Councillor/elector ratio.
The Local Government Advisory Board outlines the following advantages and disadvantages:
3
3.5.1 Advantages of a reduction in the number of Elected Members
There is currently a State-wide trend for reductions in the number of Elected Members,
and many local governments have found that a Council with fewer Elected Members
works well;
The cost of maintaining Elected Members is likely to be reduced;
The decision-making process may be more effective and efficient if the number of
Elected Members is reduced. It is more timely to ascertain the views of a fewer number
of people, and decision making may be easier. There is also more scope for team spirit
and cooperation amongst a smaller number of people;
A reduction in the number of Elected Members may result in an increased commitment
from those elected, reflected in greater interest and participation in Council’s affairs;
Fewer Elected Members are more readily identifiable to the community;
Fewer positions on Council may lead to greater interest in elections, with contested
elections and those elected obtaining a greater level of support from the community;
3.5.2 Disadvantages of a reduction in the number of Elected Members
A smaller number of Elected Members may result in an increased workload and may
lessen effectiveness. A demanding role may discourage others from nominating for
Council;
There is the potential for dominance of Council by a particular interest group;
A reduction in the number of Elected Members may limit the diversity of interests
around the Council table;
Opportunities for community participation in Council’s affairs may be reduced if there
are fewer Elected Members for the community to contact;
An increase in the ratio of Councillors to electors may place too many demands on
Elected Members.
3.5.3 Advantages of retaining a ward system
Different sectors of the community can be represented, ensuring a good spread of
representation and interests amongst Elected Members;
There is more opportunity for Elected Members to have a greater knowledge and
interest in the issues of their local ward;
It may be easier for a candidate to be elected if they only need to canvass one ward;
Councillors may be more easily accessible to the electors of the ward they represent.
3.5.4 Disadvantages of a ward system
Elected Members can become too focussed on their own wards, and less focussed on
the affairs of other wards and the whole local government;
4
An unhealthy competition for resources can develop where electors in each ward come
to expect the services and facilities provided in other wards, whether they are
appropriate or not;
The community and Elected Members can tend to regard the local government in
terms of wards rather than as a whole community;
Ward boundaries may appear to be placed arbitrarily, and may not reflect the social
interaction and communities of interest of the community;
Balanced representation across the local government may be difficult to achieve,
particularly if a local government has highly populated urban areas and sparsely
populated rural areas.
3.5.5 Advantages of a ‘no ward’ system
Elected Members are elected by the whole community, not just a section of it.
Elected Members under the Act are required to represent the views of all electors of
the Council, and make decisions in the best interest of the district as a whole.
Knowledge and interest in all areas of the Council’s affairs would result, broadening
the views beyond the immediate concerns of those within a ward;
Members of the community who want to approach an Elected Member can speak to
any Elected Member, rather than only an Elected Member who lives locally;
Elected Members can use their specialty skills and knowledge for the benefit of the
whole local government;
There is balanced representation, with each Elected Member representing the whole
community;
The election process is much simpler for the community to understand and for the
Council to administer.
3.5.6 Disadvantages of a ‘no ward’ system
Electors may feel that they are not adequately represented if they do not have an
affinity with any of the Elected Members. Elected Members living in a certain area may
have a greater affinity and understanding of the issues specific to that area;
There is potential for an interest group to dominate Council;
Elected Members may feel overwhelmed by having to represent all electors, and may
not have the time or opportunity to understand and represent all the issues;
It may be more difficult and costly for candidates to be elected if they need to canvass
the entire local government area.

5
4.0 CURRENT SITUATION
4.1 Community of Interest
4.1.1 Location and Boundaries
The Town of East Fremantle is located in the south-western suburbs of Perth, about 16
kilometres from the Perth GPO. The Town is bounded by the Swan River in the north and
west, Petra Street and the City of Melville in the east, and Marmion Street and the City of
Fremantle in the south.
4.1.2 Settlement History
European settlement dates from the 1830s, with land used mainly for farming. Growth took
place during the 1890s and early 1900s, spurred by the gold rush and the development of
neighbouring Fremantle. The population of the Town was about 3,000 in 1911, rising to 4,400
in 1921, and then to 5,200 in 1933. Steady growth took place from the post-war years, with the
population rising from about 6,200 in 1947 to about 7,300 in 1971. The population declined
during the 1970s and early 1980s, falling to about 5,700 in 1986. The population then rose
again to about 6,400 in 1991, before declining marginally during the early 1990s, falling to
6,200 in 1996. The population increased gradually from the late 1990s, rising to nearly 6,900
people in 2011.
4.3 Physical and Topographical Features
4.3.1 Land use
The Town of East Fremantle is an established residential area, with some commercial land
use. The Town includes many heritage homes, gardens and landscapes. The Town of East
Fremantle encompasses a total land area of 3 square kilometres.
4.3.2 Transport
The Town of East Fremantle is served by the Canning Highway and the Stirling Highway
4.3.3 Major Features
Major features of the Town include Leeuwin Barracks, Richmond Quarters, ATOM Stadium
(East Fremantle Oval), Royal George Hotel, East Fremantle River Walk, J Dolan Park,
Raceway Park, Stratford Park, Niergarup Track, Hertiage walk/trail, W Wayman Reserve and
the Swan River.
4.4 Demographics
Census and demographic data for the Town of East Fremantle is broken down into two small
areas based on customised suburbs/localities.
For the 1991, 1996, 2001 and 2006 Census years these small areas are created by
aggregating Census Collection Districts. For the 2011 Census they are created by aggregating
Statistical Area Level 1 units.
6
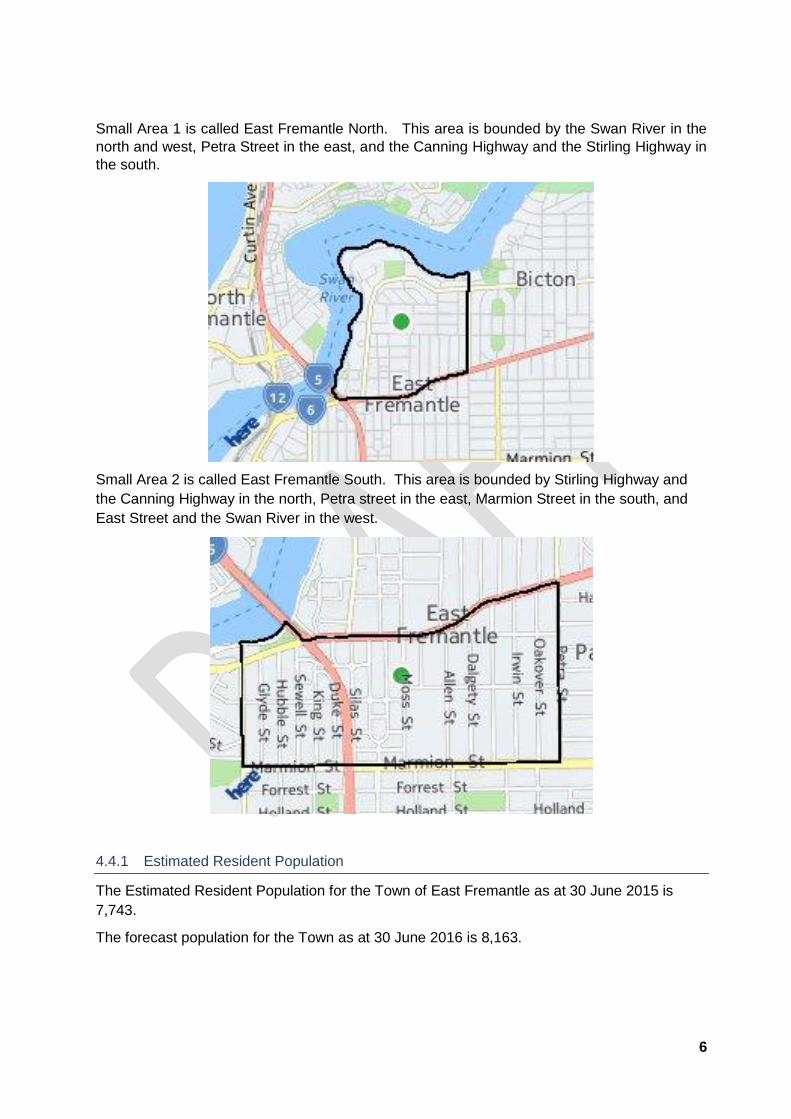
Small Area 1 is called East Fremantle North. This area is bounded by the Swan River in the
north and west, Petra Street in the east, and the Canning Highway and the Stirling Highway in
the south.
Small Area 2 is called East Fremantle South. This area is bounded by Stirling Highway and
the Canning Highway in the north, Petra street in the east, Marmion Street in the south, and
East Street and the Swan River in the west.
4.4.1 Estimated Resident Population
The Estimated Resident Population for the Town of East Fremantle as at 30 June 2015 is
7,743.
The forecast population for the Town as at 30 June 2016 is 8,163.

7
Table 1 - Estimated Resident Population (ERP)
Town of East Fremantle
Year (ending June 30)
Number Change in
number Change in
percent
2005 6,985
2006 7,074 +89 +1.27
2007 7,098 +24 +0.34
2008 7,154 +56 +0.79
2009 7,244 +90 +1.26
2010 7,270 +26 +0.36
2011 7,443 +173 +2.38
2012 7,587 +144 +1.93
2013 7,724 +137 +1.81
2014 7,781 +57 +0.74
2015 7,743 -38 -0.49
4.4.2 Industry Sector of Employment
The Town of East Fremantle’s industry statistics identify the industry sectors in which the
residents work (which may be within the residing area or elsewhere). This will be influenced by
the skill base and socio-economic status of the residents as well as the industries and
employment opportunities present in the region.

8
Table 2 – Industry Sector of Employment
Town of East Fremantle - (Usual residence)
2011 2006
Change
Industry sector Number % Greater Perth %
Number % Greater Perth %
2006 to 2011
Agriculture, Forestry and Fishing
18 0.5 0.6 17 0.5 0.8 +1
Mining 172 4.8 4.8 99 2.9 3.2 +73
Manufacturing 177 5.0 8.5 250 7.4 9.9 -73
Electricity, Gas, Water and Waste Services
26 0.7 1.1 26 0.8 1.0 0
Construction 249 7.0 10.0 203 6.0 9.1 +46
Wholesale trade 119 3.3 3.9 108 3.2 4.3 +11
Retail Trade 294 8.3 10.4 332 9.9 11.4 -38
Accommodation and Food Services
203 5.7 5.8 193 5.7 5.8 +10
Transport, Postal and Warehousing
102 2.9 4.4 87 2.6 4.2 +15
Information Media and Telecommunications
49 1.4 1.2 43 1.3 1.5 +6
Financial and Insurance Services
95 2.7 2.9 90 2.7 3.4 +5
Rental, Hiring and Real Estate Services
78 2.2 1.8 100 3.0 2.0 -22
Professional, Scientific and Technical Services
470 13.2 8.3 353 10.5 7.3 +117
Administrative and Support Services
77 2.2 3.2 86 2.6 3.4 -9
Public Administration and Safety
240 6.7 6.4 260 7.7 6.5 -20
Education and Training 510 14.3 8.1 460 13.7 7.8 +50
Health Care and Social Assistance
454 12.7 10.9 432 12.9 10.6 +22
Arts and Recreation Services
75 2.1 1.5 67 2.0 1.4 +8
Other Services 82 2.3 3.9 73 2.2 3.9 +9
Inadequately described or not stated
72 2.0 2.2 82 2.4 2.7 -10
Total employed persons aged 15+
3,562 100.0 100.0 3,361 100.0 100.0 +201
Source: Australian Bureau of Statistics, Census of Population and Housing 2006 and 2011. Compiled and
presented by .id , the population experts. (Usual residence data)
An analysis of the jobs held by the resident population in Town of East Fremantle in 2011
shows the three most popular industry sectors were:
Education and Training (510 people or 14.3%)
Professional, Scientific and Technical Services (470 people or 13.2%)
Health Care and Social Assistance (454 people or 12.7%)
In combination, these three industries employed 1,434 people in total or 40.3% of the total
employed resident population.
9
In comparison, Greater Perth employed 8.1% in Education and Training; 8.3% in Professional,
Scientific and Technical Services; and 10.9% in Health Care and Social Assistance.
The major differences between the jobs held by the population of the Town of East Fremantle
and Greater Perth were:
A larger percentage of persons employed in education and training (14.3% compared
to 8.1%)
A larger percentage of persons employed in professional, scientific and technical
services (13.2% compared to 8.3%)
A smaller percentage of persons employed in manufacturing (5.0% compared to 8.5%)
A smaller percentage of persons employed in construction (7.0% compared to 10.0%)
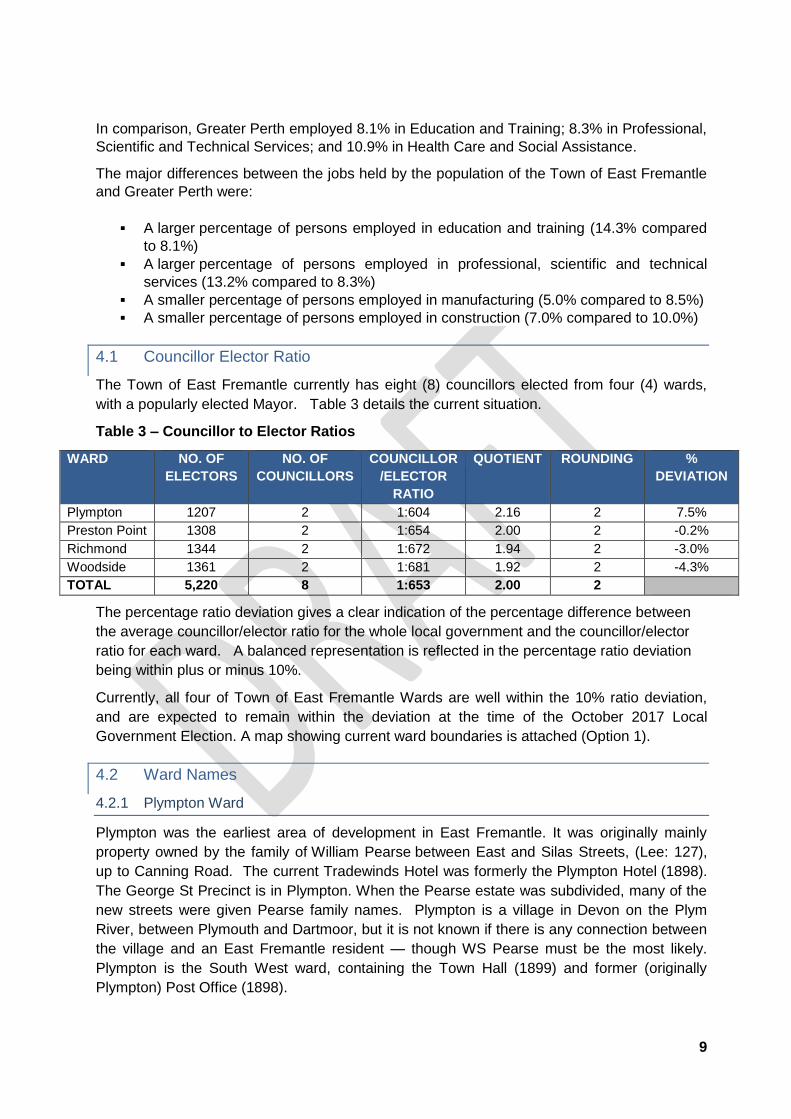
4.1 Councillor Elector Ratio
The Town of East Fremantle currently has eight (8) councillors elected from four (4) wards,
with a popularly elected Mayor. Table 3 details the current situation.
Table 3 – Councillor to Elector Ratios
WARD NO. OF
ELECTORS
NO. OF
COUNCILLORS
COUNCILLOR
/ELECTOR
RATIO
QUOTIENT ROUNDING %
DEVIATION
Plympton 1207 2 1:604 2.16 2 7.5%
Preston Point 1308 2 1:654 2.00 2 -0.2%
Richmond 1344 2 1:672 1.94 2 -3.0%
Woodside 1361 2 1:681 1.92 2 -4.3%
TOTAL 5,220 8 1:653 2.00 2
The percentage ratio deviation gives a clear indication of the percentage difference between
the average councillor/elector ratio for the whole local government and the councillor/elector
ratio for each ward. A balanced representation is reflected in the percentage ratio deviation
being within plus or minus 10%.
Currently, all four of Town of East Fremantle Wards are well within the 10% ratio deviation,
and are expected to remain within the deviation at the time of the October 2017 Local
Government Election. A map showing current ward boundaries is attached (Option 1).
4.2 Ward Names
4.2.1 Plympton Ward
Plympton was the earliest area of development in East Fremantle. It was originally mainly
property owned by the family of William Pearse between East and Silas Streets, (Lee: 127),
up to Canning Road. The current Tradewinds Hotel was formerly the Plympton Hotel (1898).
The George St Precinct is in Plympton. When the Pearse estate was subdivided, many of the
new streets were given Pearse family names. Plympton is a village in Devon on the Plym
River, between Plymouth and Dartmoor, but it is not known if there is any connection between
the village and an East Fremantle resident — though WS Pearse must be the most likely.
Plympton is the South West ward, containing the Town Hall (1899) and former (originally
Plympton) Post Office (1898).

10
4.2.2 Preston Point Ward
Preston Point is the name of the northern ward, and has almost all of the river foreshore and
the yacht clubs etc. It is north of Fraser St and west of Preston Point Rd. William Preston was
2nd lieutenant on Captain Stirling's ship HMS Success (in 1827) and 1st lieutenant on the third
ship to arrive in the Colony, HMS Sulphur, in June 1829.
4.2.3 Richmond Ward
Richmond is the central ward, containing Richmond Primary School (1921), at 37 Windsor Rd,
and the former Kaleeya Hospital, cnr Staton and Wolsely Rds. The ward is bounded by
Canning Highway, Preston Point Rd, Fraser St, and Petra St. The Richmond Hotel (later
Bridge) stood roughly where Stirling Highway now crosses Canning Hwy. Richmond School is
the only primary school in the Town.
4.2.4 Woodside Ward
Woodside was the name of the house and also the estate, which was the property of William
Dalgety Moore, that occupied the land between what are now Allen and Petra Streets.
Woodside is now the name of the SE ward, and contains the site of the former
Woodside Hospital at 18 Dalgety St (which was the Moore house), the East Fremantle
Football Club, and the former 'Richmond' Raceway.
5.0 REVIEW OPTIONS
Council will consider the following Options:
Option 1 – Maintain the current 4 ward system and 8 Elected Members
Option 2 – Introduce No Ward system and maintain number of Elected Members at 8
Option 3 – Introduce No Ward system and reduce number of Elected Members to 7
Option 4 – Introduce No Ward system and reduce number of Elected Members to 6

11
6.0 PUBLIC SUBMISSIONS
Members of the community are invited to make a written submission about any aspect of ward
boundaries and representation, and address it to:
Chief Executive Officer
Town of East Fremantle
PO Box 1097
FREMANTLE WA 6959
Submissions will also be accepted by email: [email protected]
For any enquiries regarding the review of Wards and Elected Member representation, please
contact the Town’s Chief Executive Officer, Gary Tuffin, on (08) 9339 9339.
Written submissions should be lodged at the Town of East Fremantle by 5.00 pm on
Wednesday, 14 September 2016.
Thank you for your interest in the Town of East Fremantle 2016 review of ward boundaries
and Elected Member representation. The Town welcomes your submission.

12
THIS PAGE IS INTENTIONALLY BLANK

13
OPTION 1
MAINTAIN CURRENT WARD
AND
REPRESENTATION SYSTEM
.
14
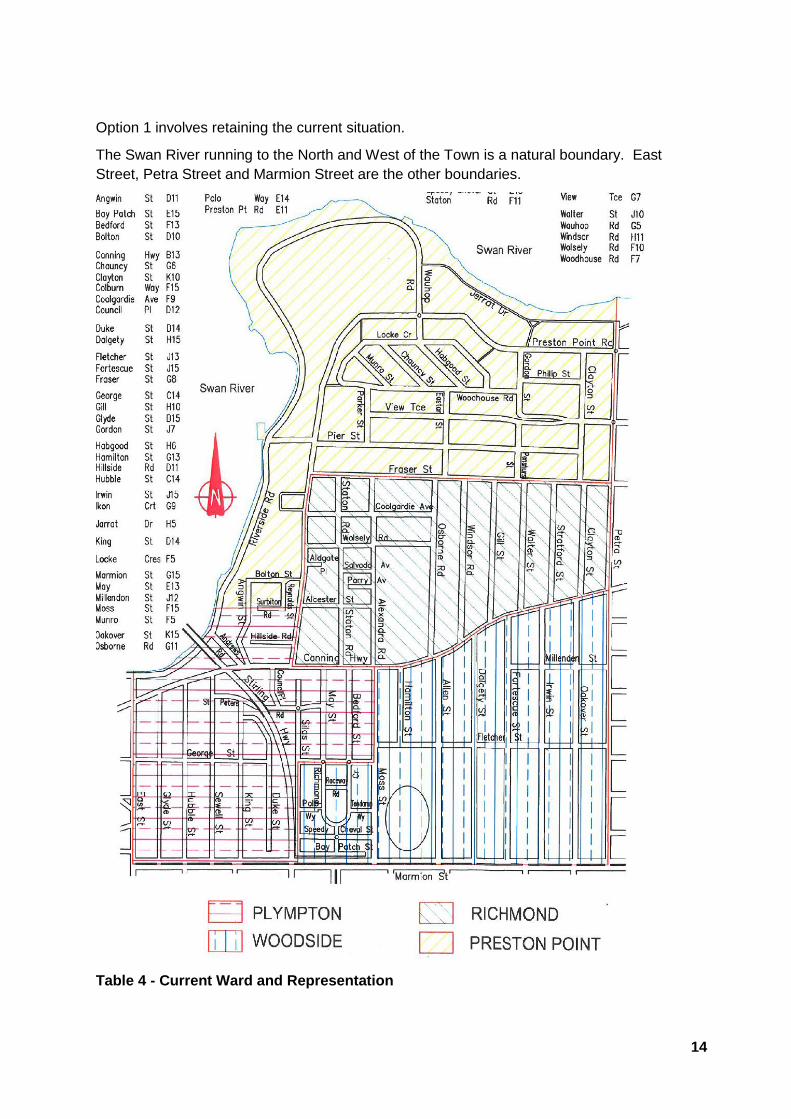
Option 1 involves retaining the current situation.
The Swan River running to the North and West of the Town is a natural boundary. East
Street, Petra Street and Marmion Street are the other boundaries.
Table 4 - Current Ward and Representation

15
WARD NO. OF
ELECTORS
NO. OF
COUNCILLORS
COUNCILLOR
/ELECTOR
RATIO
QUOTIENT ROUNDING %
DEVIATION
Plympton 1207 2 1:604 2.16 2 7.5%
Preston Point 1308 2 1:654 2.00 2 -0.2%
Richmond 1344 2 1:672 1.94 2 -3.0%
Woodside 1361 2 1:681 1.92 2 -4.3%
TOTAL 5,220 8 1:653 8.02 8
The ID community profile for the the Town of East Fremantle between 2011 and 2036 has
forecast an population increase of 3,214 people, (a growth of 43.18% over the period) at a
rate of 1.45% per annum.
Table 5 – Projected Population
AREA 2021 2026 2031 2036 TOTAL
CHANGE
Avg Annual
% Change
East Fremantle 8,505 9,681 10,474 10,657 3,214 1.45%
East Fremantle North 4,234 5,386 6,149 6,252 2,402 1.96%
East Fremantle South 4,271 4,295 4,325 4,405 812 0.82%
The delineation used in the forecast modelling between North and South is Canning Highway.
The avergae annual percentage change forecast for North and South has been utilised in
determining the number of estimated electors in the Tables below.
Table 5 – 2021 Projected Electors
YEAR 2021
WARD NO. OF
ELECTORS
NO. OF
COUNCILLORS
COUNCILLOR
/ELECTOR
RATIO
QUOTIENT ROUNDING %
DEVIATION
Plympton 1,268 2 1:634 2.24 2 10.70%
Preston Point 1,470 2 1:735 1.93 2 -3.52%
Richmond 1,510 2 1:755 1.88 2 -6.34%
Woodside 1,429 2 1:715 1.99 2 -0.70%
TOTAL 5,677 8 1:710 8.04 8
Table 6 – 2026 Projected Electors
YEAR 2026
WARD NO. OF
ELECTORS
NO. OF
COUNCILLORS
COUNCILLOR
/ELECTOR
RATIO
QUOTIENT ROUNDING %
DEVIATION
Plympton 1,320 2 1:660 2.31 2 13.39%
Preston Point 1,619 2 1:810 1.88 2 -6.30%
Richmond 1,664 2 1:832 1.83 2 -9.19%
Woodside 1,489 2 1:745 2.05 2 2.23%
TOTAL 6,092 8 1:762 8.07 8
Table 7 – 2031 Projected Electors
YEAR 2031

16
WARD NO. OF
ELECTORS
NO. OF
COUNCILLORS
COUNCILLOR
/ELECTOR
RATIO
QUOTIENT ROUNDING %
DEVIATION
Plympton 1,375 2 1:688 1.68 2 15.89%
Preston Point 1,784 2 1:892 2.18 2 -9.05%
Richmond 1,833 2 1:917 2.24 2 -12.10%
Woodside 1,551 2 1:776 1.90 2 5.13%
TOTAL 6,543 8 1:818 8.00 8
Table 8 – 2036 Projected Electors
YEAR 2036
WARD NO. OF
ELECTORS
NO. OF
COUNCILLORS
COUNCILLOR
/ELECTOR
RATIO
QUOTIENT ROUNDING %
DEVIATION
Plympton 1,433 2 1:717 1:63 2 18.43%
Preston Point 1,966 2 1:983 2.24 2 -11.83%
Richmond 2,020 2 1:1,010 2.30 2 -14.90%
Woodside 1,616 2 1:808 1.84 2 8.08%
TOTAL 7,035 8 1:879 8.00 8
In the long term the representation deviation for three (3) wards is forecasted to be well in
excess of the acceptable percentage ratio deviation of between plus or minus 10%.

17
OPTION 2
NO WARDS
AND
8 ELECTED MEMBERS

18
THIS PAGE IS INTENTIONALLY BLANK

19
Option 2 involves the removal of wards and replacement with a no-ward system, and
retaining 8 Elected Members (Councillors).
Under this system all Councillors would represent the entire Town of East Fremantle district,
rather than a single ward.
The Mayor would continue to be popularly elected by the people.
The table below details the number of electors and Councillor to Elector ratio under a no
ward system.
Table 9 – No Wards Councillor Elector Ratio
NO WARDS, 8 COUNCILLORS PLUS MAYOR
NO. OF ELECTORS NO. OF COUNCILLORS COUNCILLOR/ELECTOR
RATIO
5,220 8 1:653
Option 2 would eliminate the need for the Town to meet the ratio deviation requirement of
10% under a Ward system.
This option would retain 8 Councillors, with an average number of electors per Councillor of
653.
The other factors Community of Interest, Physical and Topographical features, Demographic
trends and economic factors would no longer be relevant, as each Councillor would
represent the entire Town of East Fremantle district, rather than only one ward.

20
THIS PAGE IS INTENTIONALLY BLANK
21
OPTION 3
NO WARDS
AND
7 ELECTED MEMBERS

22
THIS PAGE IS INTENTIONALLY BLANK

23
Option 3 involves the removal of wards and replacement with a no-ward system, and a
reduction in the number of Elected Members (Councillors) from 8 to 7.
Under this system all Councillors would represent the entire Town of East Fremantle district,
rather than a single ward.
The Mayor would continue to be popularly elected by the people.
The table below details the number of electors and Councillor to Elector ratio under a no
ward system.
Table 10 – No Wards Councillor Elector Ratio
NO WARDS, 7 COUNCILLORS PLUS MAYOR
NO. OF ELECTORS NO. OF COUNCILLORS COUNCILLOR/ELECTOR
RATIO
5,220 7 1:746
Option 3 would eliminate the need for the Town to meet the ratio deviation requirement of
10% under a Ward system.
This option would result in a reduction of Councillor positions by 1. The average number of
electors per Councillor would increase from 653 to 746.
The other factors Community of Interest, Physical and Topographical features, Demographic
trends and economic factors would no longer be relevant, as each Councillor would
represent the entire Town of East Fremantle district, rather than only one ward.

24
THIS PAGE IS INTENTIONALLY BLANK

25
OPTION 4
NO WARDS
AND
6 ELECTED MEMBERS

26
THIS PAGE IS INTENTIONALLY BLANK
27
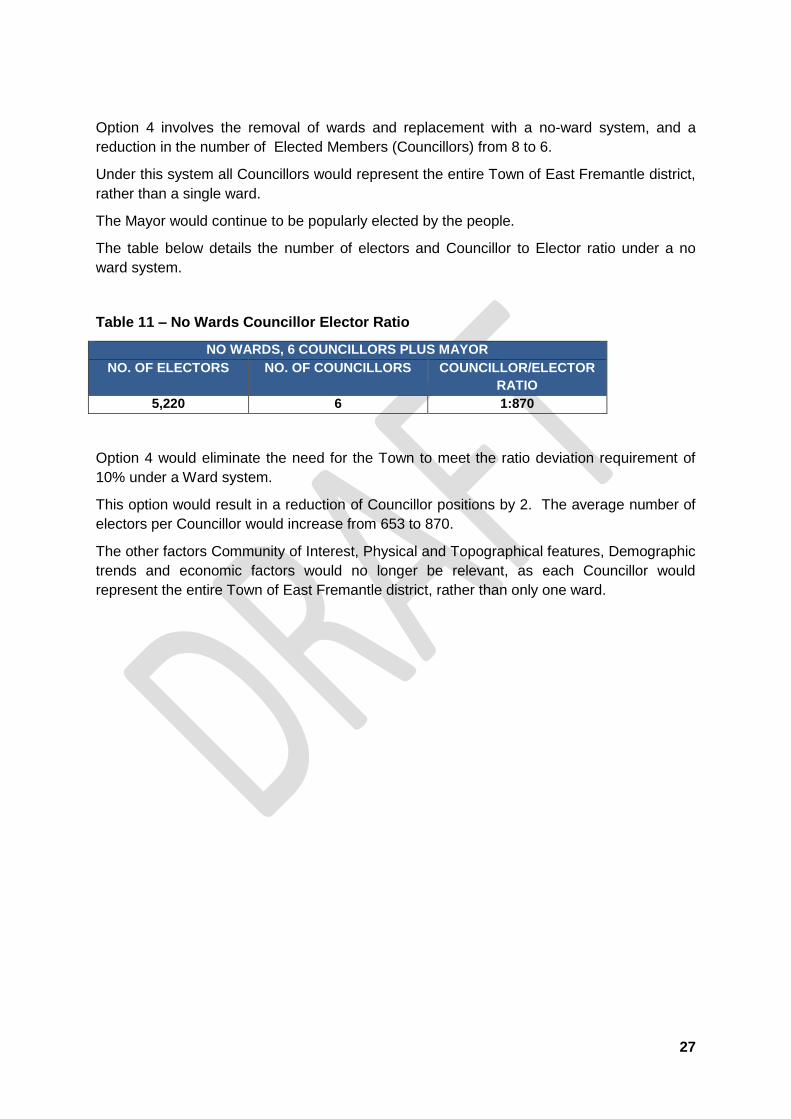
Option 4 involves the removal of wards and replacement with a no-ward system, and a
reduction in the number of Elected Members (Councillors) from 8 to 6.
Under this system all Councillors would represent the entire Town of East Fremantle district,
rather than a single ward.
The Mayor would continue to be popularly elected by the people.
The table below details the number of electors and Councillor to Elector ratio under a no
ward system.
Table 11 – No Wards Councillor Elector Ratio
NO WARDS, 6 COUNCILLORS PLUS MAYOR
NO. OF ELECTORS NO. OF COUNCILLORS COUNCILLOR/ELECTOR
RATIO
5,220 6 1:870
Option 4 would eliminate the need for the Town to meet the ratio deviation requirement of
10% under a Ward system.
This option would result in a reduction of Councillor positions by 2. The average number of
electors per Councillor would increase from 653 to 870.
The other factors Community of Interest, Physical and Topographical features, Demographic
trends and economic factors would no longer be relevant, as each Councillor would
represent the entire Town of East Fremantle district, rather than only one ward.

28
THIS PAGE IS INTENTIONALLY BLANK

29
APPENDIX A
REVIEW OF WARD BOUNDARIES
AND
ELECTED MEMBER REPRESENTATION
SUBMISSION FORM

30
THIS PAGE IS INTENTIONALLY BLANK

31
Note: This form is provided for your convenience. Written public submissions do not have
to be made on this form.
Chief Executive Officer
Town of East Fremantle
Po Box 1097
FREMANTLE WA 6959
Email: [email protected]
Dear Sir,
I support the following option in relation to the Ward Boundary and Representation Review:
(Please tick or circle response to each question)
1. Option 1: Retain existing 4 ward system, and retain 8 Elected Members plus Mayor (9
Elected Members).
Yes No
Comment:
2. Option 2: Introduce no Ward system, and retain 8 Elected Members plus Mayor (9
Elected Members)
Yes No
Comment:

32
3. Option 3: Introduce no Ward system, and 7 Elected Members plus Mayor (8 Elected
Members)
Yes No
Comment:
4. Option 4: Introduce no Ward system, and 6 Elected Members plus Mayor (7 Elected
Members)
Yes No
Comment:
5. Alternative Option:
I proposed the following Ward boundary/Elected Member structure:
The Town of East Fremantle should have Wards and Elected
Members. (minimum of 5 and maximum of 14).
The Town’s Wards should have the following names and numbers of Elected Members:
Name No of Elected Members
Ward 1
Ward 2
Ward 3
Ward 4
Ward 5

33
The Town’s Wards should contain the following localities and/or physical/topographical
features:
Ward 1
Ward 2
Ward 3
Ward 4
Ward 5
6. Comments in support of my preferred option:
Submitted by:
Name:
Address:
Contact Details:


