Warm Up 1. 5x – 2 when x = 4 4. 2 – t 2 when 3. when x = 16 94 18 48 5. Give the domain and range for this relation: {(1, 1), (–1, 1), (2, 4), (–2, 4), (–3, 9), (3, 9)}. D: {–3, –2, –1, 1, 2, 3} R: {1, 4, 9} Evaluate. 2. 3x 2 + 4x – 1 when x = 5
Transcript
Warm Up
1. 5x – 2 when x = 4
4. 2 – t2 when
3. when x = 16
94
18
48
5. Give the domain and range for this relation: {(1, 1), (–1, 1), (2, 4), (–2, 4), (–3, 9), (3, 9)}.
D: {–3, –2, –1, 1, 2, 3} R: {1, 4, 9}
Evaluate.
2. 3x2 + 4x – 1 when x = 5
Write functions using function notation.
Evaluate and graph functions.
Objectives
function notationdependent variableindependent variable
Vocabulary
Some sets of ordered pairs can be described by using an equation. When the set of ordered pairs described by an equation satisfies the definition of a function, the equation can be written in function notation.
ƒ(x) = 5x + 3 ƒ(1) = 5(1) + 3
Output value Output value Input valueInput value
ƒ of x equals 5 times x plus 3. ƒ of 1 equals 5 times 1 plus 3.
The function described by ƒ(x) = 5x + 3 is the same as the function described by y = 5x + 3. And both of these functions are the same as the set of ordered pairs (x, 5x+ 3).
y = 5x + 3 (x, y) (x, 5x + 3)
ƒ(x) = 5x + 3 (x, ƒ(x)) (x, 5x + 3)
Notice that y = ƒ(x) for each x.
The graph of a function is a picture of the function’s ordered pairs.
f(x) is not “f times x” or “f multiplied by x.” f(x) means “the value of f at x.” So f(1) represents the value of f at x =1
Caution
Example 1A: Evaluating Functions
ƒ(x) = 8 + 4x Substitute each value for x and evaluate.
For each function, evaluate ƒ(0), ƒ , and ƒ(–2).
ƒ(0) = 8 + 4(0) = 8
ƒ(–2) = 8 + 4(–2) = 0
ƒ = 8 + 4 = 10
For each function, evaluate ƒ(0), ƒ , and ƒ(–2).
Example 1B: Evaluating Functions
Use the graph to find the corresponding y-value for each x-value.
ƒ(0) = 3
ƒ = 0
ƒ(–2) = 4
Check It Out! Example 1a
For each function, evaluate ƒ(0), ƒ , and ƒ(–2).
ƒ(x) = x2 – 4x
Check It Out! Example 1b
For each function, evaluate ƒ(0), ƒ , and ƒ(–2).
ƒ(x) = –2x + 1
In the notation ƒ(x), ƒ is the name of the function. The output ƒ(x) of a function is called the dependent variable because it depends on the input value of the function. The input x is called the independent variable. When a function is graphed, the independent variable is graphed on the horizontal axis and the dependent variable is graphed on the vertical axis.
Graph the function.
Example 2A: Graphing Functions
{(0, 4), (1, 5), (2, 6), (3, 7), (4, 8)}
Graph the points.
Do not connect the points because the values between the given points have not been defined.
A function whose graph is made up of unconnected points is called a discrete function.
Reading Math
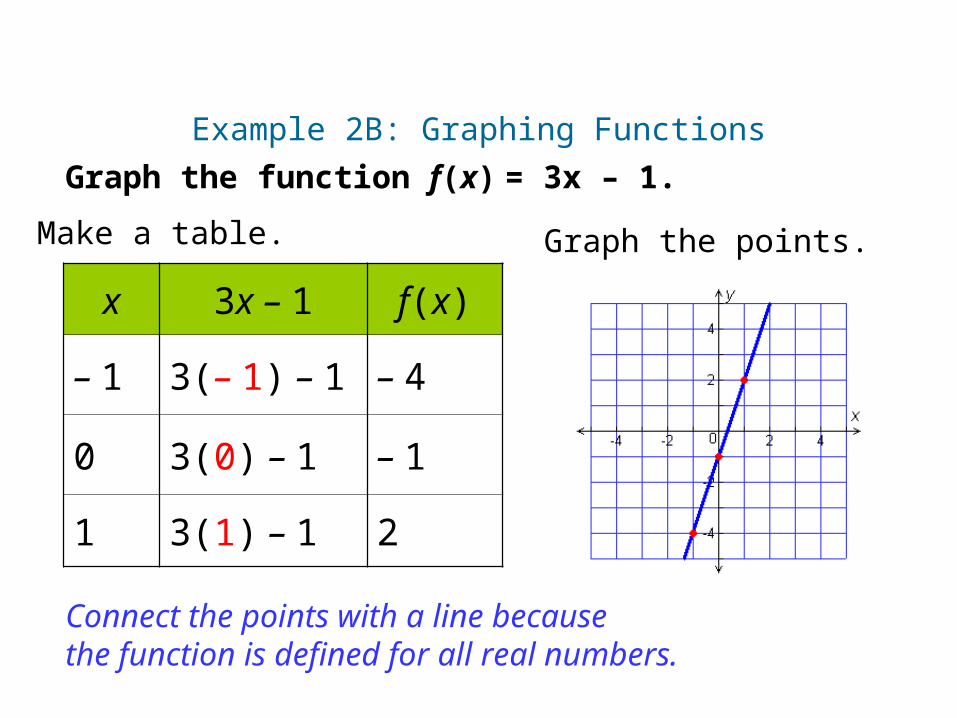
Graph the function f(x) = 3x – 1.
Example 2B: Graphing Functions
x 3x – 1 f(x)
– 1 3(– 1) – 1 – 4
0 3(0) – 1 – 1
1 3(1) – 1 2
Make a table. Graph the points.
Connect the points with a line because the function is defined for all real numbers.
Check It Out! Example 2a
Graph the function.
Graph the points.
Do not connect the points because the values between the given points have not been defined.
3 5 7 9
2 6 10
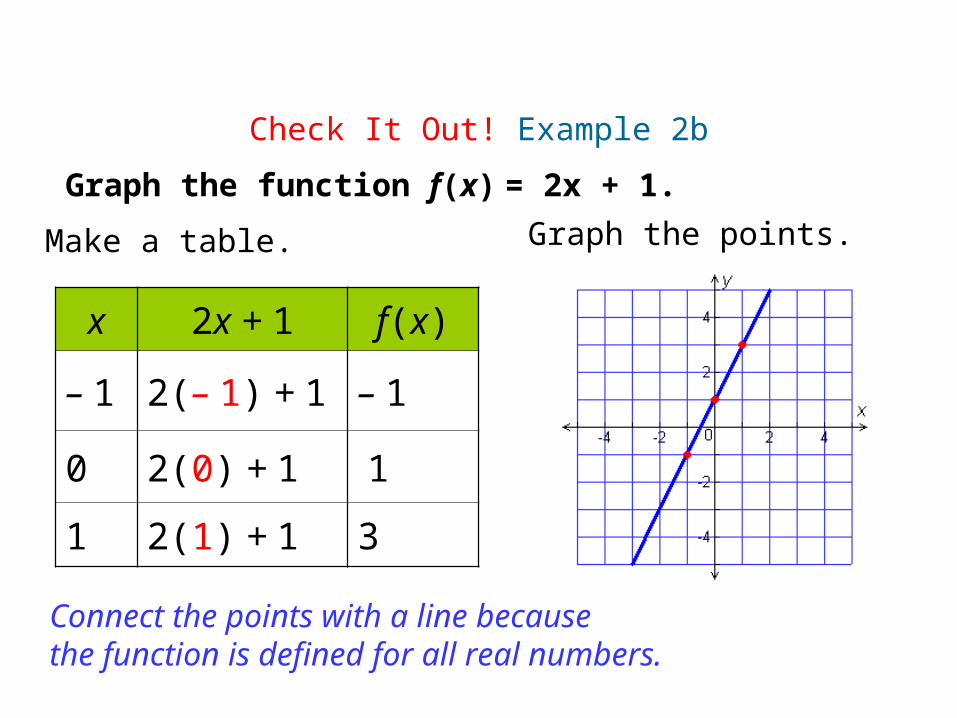
Check It Out! Example 2b
Graph the function f(x) = 2x + 1.
x 2x + 1 f(x)
– 1 2(– 1) + 1 – 1
0 2(0) + 1 1
1 2(1) + 1 3
Make a table. Graph the points.
Connect the points with a line because the function is defined for all real numbers.
The algebraic expression used to define a function is called the function rule. The function described by f(x) = 5x + 3 is defined by the function rule 5x + 3. To write a function rule, first identify the independent and dependent variables.