Ch. 26 Notes chi squared.notebook 1 March 16, 2020 Mar 248:09 AM A manufacturer claims that a particular automobile model will get 50 miles per gallon on the highway. The researchers at a consumeroriented magazine believe that this claim is high and plan a test with a simple random sample of 30 cars. Assuming the standard deviation between individual cars is 2.3 miles per gallon, what should the researchers conclude if the sample mean is 49 miles per gallon? A) There is not sufficient evidence to reject the manufacturer's claim; 49 miles per gallon is too close to the claimed 50 miles per gallon. B) The manufacturer's claim should not be rejected because the Pvalue of .0087 is too small. C) The manufacturer's claim should be rejected because the sample mean is less than the claimed mean. D) The Pvalue of .0087 is sufficient evidence to reject the manufacturer's claim. E) The Pvalue of .0087 is sufficient evidence to prove that the manufacturer's claim is false. Warm-up D Apr 108:12 PM Chi-square test or χ 2 test Apr 108:16 PM • Used to test the counts of categorical data • The chi-square statistic measures the distance between observed and expected counts relative to expected counts. • Three types -Goodness of fit (distribution of 1 variable in a population) wants to see if the observed counts fit what we expect to see -Independence (one population- multiple variables) used to see if there is an association between 2 variables (are they independent?) -Homogeneity (one variable - multiple populations) - used to see if 2 samples are the same across populations Chi Square Tests Apr 108:18 PM What shape does the chi square graph have? As the degrees of freedom increase what happens to the graph's shape?
Transcript
Ch. 26 Notes chi squared.notebook
1
March 16, 2020
Mar 248:09 AM
A manufacturer claims that a particular automobile model will get 50 miles per gallon on the highway. The researchers at a consumeroriented magazine believe that this claim is high and plan a test with a simple random sample of 30 cars. Assuming the standard deviation between individual cars is 2.3 miles per gallon, what should the researchers conclude if the sample mean is 49 miles per gallon?
A) There is not sufficient evidence to reject the manufacturer's claim; 49 miles per gallon is too close to the claimed 50 miles per gallon.
B) The manufacturer's claim should not be rejected because the Pvalue of .0087 is too small.
C) The manufacturer's claim should be rejected because the sample mean is less than the claimed mean.
D) The Pvalue of .0087 is sufficient evidence to reject the manufacturer's claim.
E) The Pvalue of .0087 is sufficient evidence to prove that the manufacturer's claim is false.
Warm-up
D
Apr 108:12 PM
Chi-square testor
χ2 test
Apr 108:16 PM
• Used to test the counts of categorical data• The chi-square statistic measures the distance between observed and expected counts relative to expected counts.• Three types-Goodness of fit (distribution of 1 variable in a population) wants to see if the observed counts fit what we expect to see-Independence (one population- multiple variables) used to see if there is an association between 2 variables (are they independent?)-Homogeneity (one variable - multiple populations) - used to see if 2 samples are the same across populations
Chi Square Tests
Apr 108:18 PM
What shape does the chi square graph have?
As the degrees of freedom increase what happens to the graph's shape?
Ch. 26 Notes chi squared.notebook
2
March 16, 2020
Mar 2210:14 PM
• Different df have different curves• Skewed right, positive values!• As df increases, curve shifts toward right & becomes more like a normal curve
ChiSquared Distribution
Apr 108:24 PM
Assumptions and Conditions1. Independence Assumption: met by checking randomization!Randomization Condition: should be a random sample from the population of interest.
2. Large Counts- met by Expected Cell Frequency Condition: expected count should be at least 5 in every cell. Expected counts of categorical data are counts consistent with the null hypothesis. In general, an expected count is a sample size times a probability.
Formula
(observed count expected count)2
expected count
Apr 108:28 PM
Goodness of Fit - used with one set of data
1. Hypothesis statements:H0: specifies null proportions for each categoryHa: at least one of these proportions is not as specified in
the null. Be sure to write in context! (must be in sentences)
2. Conditions Check Randomization and Expected Counts (sample size times the null proportion)
**We want to see how well the observed counts fits the expected counts.
3. Calculations: chisquared calculation Degrees of freedom: number of categories 1 4. Conclusion: Same as before! Reject or fail to reject based on a pvalue.
Apr 116:49 AM
Example 1: Does your zodiac sign determine how successful you will be? Fortune magazine collected the zodiac signs of 256 heads of the largest 400 companies. Is there sufficient evidence to claim that successful people are more likely to be born under some signs than others?Aries 23 Libra 18 Leo 20Taurus 20 Scorpio 21 Virgo 19Gemini 18 Sagittarius 19 Aquarius 24Cancer 23 Capricorn 22 Pisces 29
If there was no difference in the categories how many people would you believe to see in each?
What is the degrees of freedom?
Ch. 26 Notes chi squared.notebook
3
March 16, 2020
Apr 116:54 AM
State the Hypotheses and Conditions
Hypotheses' for ChiSquared Tests must be in sentence form.
H0: Births of CEOs are uniformly distributed over zodiac signs.HA: Births of CEOs are not uniformly distributed over zodiac signs.
*Making a bar chart is also a good idea to check the variation.
The bar charts shows some variation in signs, but it's hard to say whether this is more than just random variation.
Counted Data : I have counts of the number of executives in 12 categories.
Independence Assumption /Randomization Condition : The birth dates of executives should be independent of each other. This is a convenience sample of executives, but there's no reason to suspect bias.
Expected Cell Frequency Condition: The null hypothesis expects that 1/12 of the 256 births, or 21.333, should occur in each sign. These expected values are all at least 5, so the condition is satisfied.
α = .05
Apr 117:01 AM
Calculation:Expected counts: 21.33 *found by taking the total number of people and multiplying it by the percentage of that category
Degrees of Freedom: 11
Conclusion:Since p-value of 0.9265 is > α of 0.05, I fail to reject H0. According to our p-value, if the zodiac signs of executives were uniformly distributed, an observed chi-square value of 5.09 or higher would occur about 93% of the time. There is not sufficient evidence to suggest that the number of CEO's born with a certain sign are different.
P-value = χ2cdf(5.094, 10^99, 11) = .9265*Since the data is skewed, the values can get pretty big, and it may be a long way to find where the curve's tail is meaningless.
α = .05
**Remember that a pvalue is interpreted as: If the null hypothesis is true, we would expect to see results like our or more extreme pvalue % of the time
Apr 117:01 AM
Example 2: A company says its premium mixture of nuts contains 10% Brazil nuts, 20% cashews, 20% almonds, 10% hazelnuts and 40% peanuts. You buy a large can and separate the nuts. Upon weighing them, you find there are 112 g Brazil nuts, 183 g of cashews, 207 g of almonds, 71 g or hazelnuts, and 446 g of peanuts. You wonder whether your mix is significantly different from what the company advertises?
Why would this not be a good fit for a Chisquared test?
What could we do to make it a good fit?
not counts
make it counts!
Mar 264:14 PM
YOUR TURN! After getting trounced by your little brother in a children's game, you suspect the die he gave you to roll may be unfair. To check, you roll it 60 times, recording the number of times each face appears. Do these results cast doubt on the die's fairness?(a) If the die is fair, how many times would you expect each face to show?(b) To see if these results are unusual, what test would you use?(c) State your hypotheses.(d) Check the conditions.(e) How many degrees of freedom are there?(f) Find χ2 and the Pvalue.(g) State your conclusion.
Face Count1 112 73 94 155 126 6
Ch. 26 Notes chi squared.notebook
4
March 16, 2020
Apr 49:21 PM
Exit slip Review: (a) 10(b) goodness of fit(c) H0: The die is fair (all faces have a probability of 1/6)
HA: The die is not fair.(d) Data is the counts for each face
Rolls are random and independent Expected frequencies are all 10, so are larger than 5
(e) 5 (f) χ2 = 5.6; pvalue = 0.3471(g) Since our pvalue of 0.3471 is high (far above an alpha level of .05), we fail to reject the null. If the die is fair, there is a 34.71% chance of getting a chisquare statistic of 5.6 or higher. This is not unusual, so there is not evidence that the die is unfair.
Mar 161:17 PM
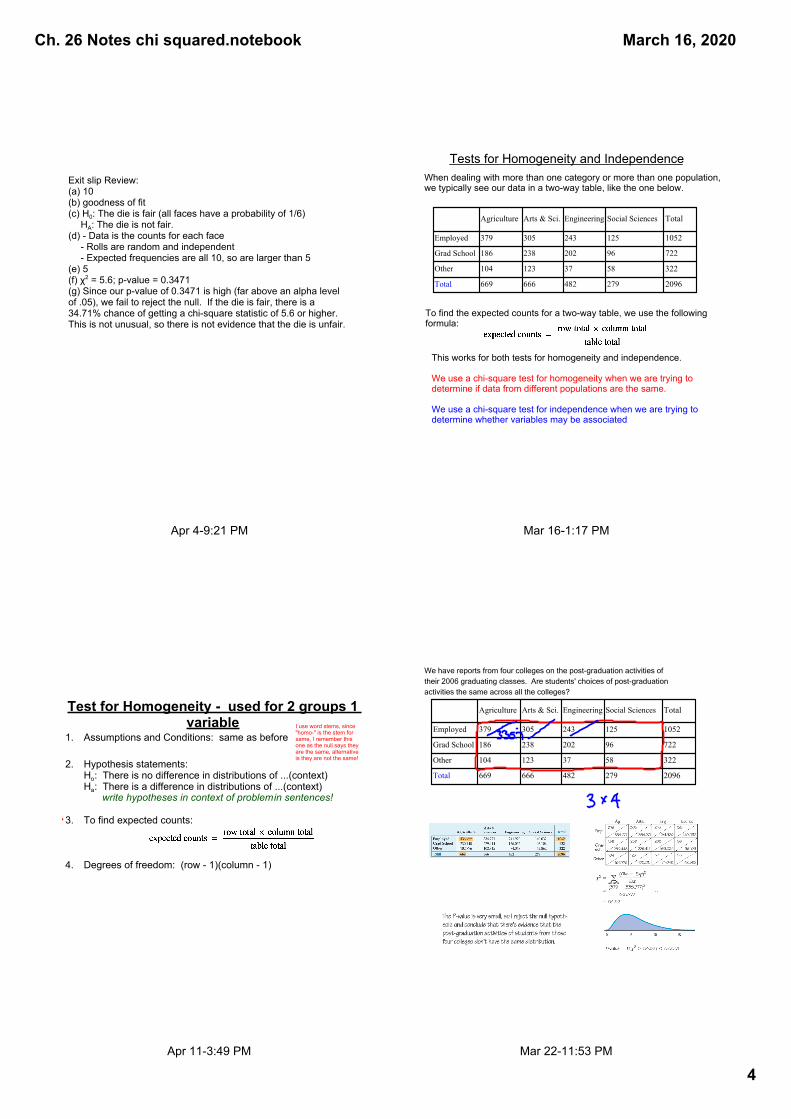
Agriculture Arts & Sci. Engineering Social Sciences Total
Employed 379 305 243 125 1052
Grad School 186 238 202 96 722
Other 104 123 37 58 322
Total 669 666 482 279 2096
Tests for Homogeneity and Independence When dealing with more than one category or more than one population, we typically see our data in a twoway table, like the one below.
To find the expected counts for a twoway table, we use the following formula:
This works for both tests for homogeneity and independence.
We use a chisquare test for homogeneity when we are trying to determine if data from different populations are the same.
We use a chisquare test for independence when we are trying to determine whether variables may be associated
Apr 113:49 PM
Test for Homogeneity used for 2 groups 1 variable
1. Assumptions and Conditions: same as before
2. Hypothesis statements:Ho: There is no difference in distributions of ...(context)Ha: There is a difference in distributions of ...(context)
write hypotheses in context of problem in sentences!
3. To find expected counts:
4. Degrees of freedom: (row 1)(column 1)
I use word stems, since "homo" is the stem for same, I remember this one as the null says they are the same, alternative is they are not the same!
Mar 2211:53 PM
We have reports from four colleges on the postgraduation activities of their 2006 graduating classes. Are students' choices of postgraduation activities the same across all the colleges?
Agriculture Arts & Sci. Engineering Social Sciences Total
Employed 379 305 243 125 1052
Grad School 186 238 202 96 722
Other 104 123 37 58 322
Total 669 666 482 279 2096
Ch. 26 Notes chi squared.notebook
5
March 16, 2020
Apr 511:04 AM
Hypotheses
H0=
HA=
Student's post grad choices are distributed the same across all 4 colleges
Students' post grad choices are not distributed the same across the 4 colleges.
Mechanics:X2 =
df =
P(X2> ) =
Conditions:
Counted data:
Independence:
Randomization: don't want to draw inferences for other colleges or classes so we no need to check this.
Expected cell count:
Conclusion:
Mar 233:05 PM
ResidualsAnytime we reject a null hypothesis for Chisquared tests of independence or homogeniety, we should check the residuals.
To get the residuals, follow this formula:
This gives us a chance to think about the underlying patterns that occur. For example let's look back at our student survey results.
Apr 117:08 AM
Test of Independence used when one group 2 variables
1. Assumptions: the same2. Hypothesis statements:
Ho: There is no association between...(context) Independent Ha: There is an association between...(context) Not Indep.
Be sure to write in context!3. To find expected counts:
4. Degrees of freedom: (r 1)(c 1)
Mar 285:56 PM
PDNA research firm wants to determine whether there‛s a difference in married couples between what the husband earns and what the wife earns. The firm takes a random sample of married couples and measures the annual salary of each husband and wife. What procedure should the firm use to analyze the data for the mean difference in salary within married couples?a) One-sample t procedureb) Two-sample t procedurec) One-sample z procedured) Two-sample z proceduree) Not enough information to determine which procedure should be used.
A
Ch. 26 Notes chi squared.notebook
6
March 16, 2020
Apr 119:37 AM
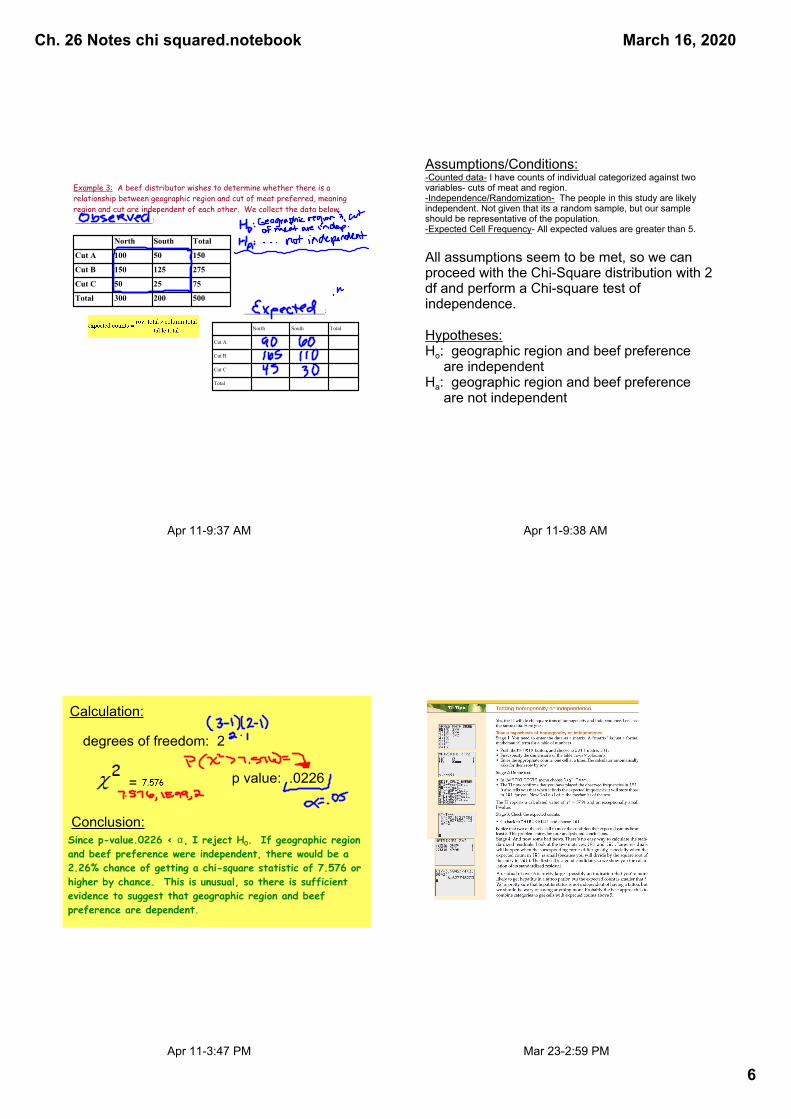
Example 3: A beef distributor wishes to determine whether there is a relationship between geographic region and cut of meat preferred, meaning region and cut are independent of each other. We collect the data below.______________________:
North South Total
Cut A 100 50 150
Cut B 150 125 275
Cut C 50 25 75
Total 300 200 500
North South Total
Cut A
Cut B
Cut C
Total
________________________:
Apr 119:38 AM
Assumptions/Conditions:Counted data I have counts of individual categorized against two variables cuts of meat and region.Independence/Randomization The people in this study are likely independent. Not given that its a random sample, but our sample should be representative of the population.Expected Cell Frequency All expected values are greater than 5.
All assumptions seem to be met, so we can proceed with the ChiSquare distribution with 2 df and perform a Chisquare test of independence.
Hypotheses:Ho: geographic region and beef preference
are independentHa: geographic region and beef preference
are not independent
Apr 113:47 PM
Calculation:
=
degrees of freedom: 2
p value: .0226
Conclusion:Since p-value.0226 < α, I reject H0. If geographic region and beef preference were independent, there would be a 2.26% chance of getting a chi-square statistic of 7.576 or higher by chance. This is unusual, so there is sufficient evidence to suggest that geographic region and beef preference are dependent.
Mar 232:59 PM
Ch. 26 Notes chi squared.notebook
7
March 16, 2020
Jan 132:34 PM
Decide which Chi Square test is being used in each of the situations. . . .
1. A brokerage firm wants to see whether the type of account a customer has (Silver, Gold, Platinum) affects the type of trades that a customer makes (in person, by phone, or on the Internet). It collects a random sample of trades made for its customers over the past year and performs a test.
2. The academic research office at a large community college wants to see whether the distribution of courses chosen (Humanities, Social Science, or Science) is different for its residential and nonresidential students. It assembles last semester‛s data and performs a test.
Independence
Homogeneity
Jan 132:34 PM
Decide which Chi Square test is being used in each of the situations. . . .
3. Is the quality of a car affected by what day it was built? A car manufacturer examines a random sample of the warranty claims filed over the past two years to test whether defects are randomly distributed across days of the work week.
4. A student wants to find out whether political leaning (liberal, moderate, or conservative) is related to choice of major. He surveys 500 randomly chosen students and performs a test.
GOF
Independence
Jan 132:44 PM
Closing
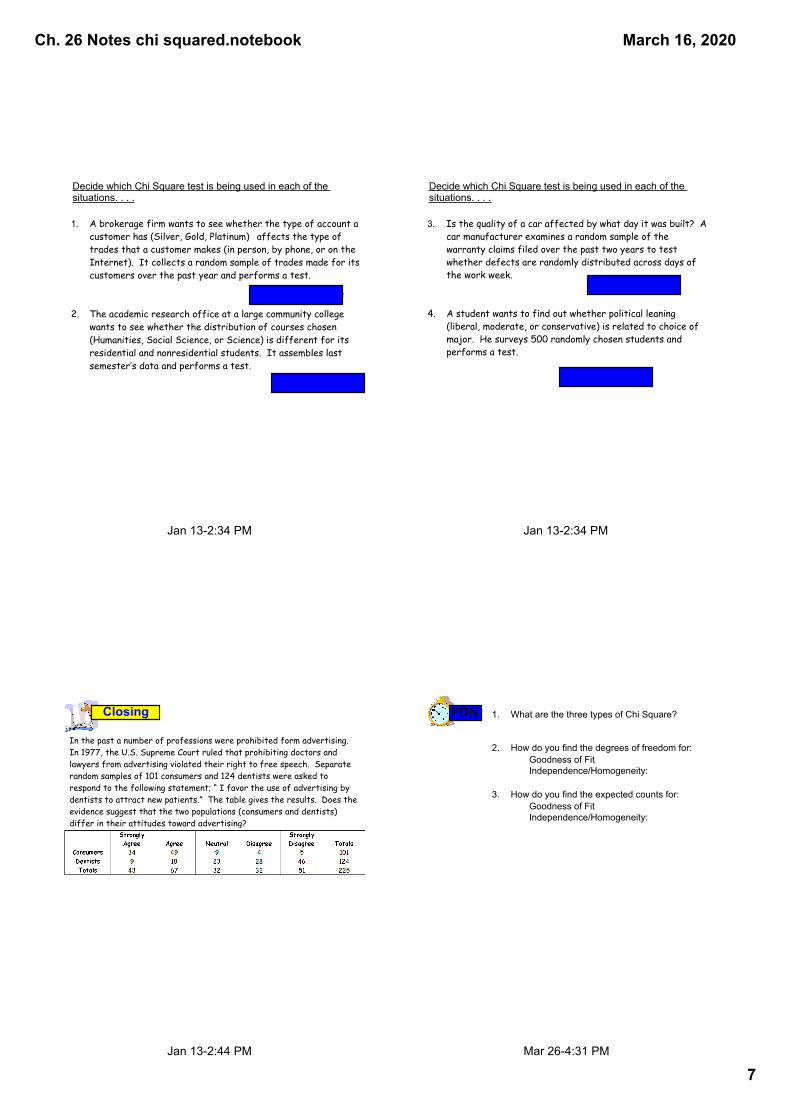
In the past a number of professions were prohibited form advertising. In 1977, the U.S. Supreme Court ruled that prohibiting doctors and lawyers from advertising violated their right to free speech. Separate random samples of 101 consumers and 124 dentists were asked to respond to the following statement; “ I favor the use of advertising by dentists to attract new patients.” The table gives the results. Does the evidence suggest that the two populations (consumers and dentists) differ in their attitudes toward advertising?
Mar 264:31 PM
1. What are the three types of Chi Square?
2. How do you find the degrees of freedom for:Goodness of FitIndependence/Homogeneity:
3. How do you find the expected counts for:Goodness of FitIndependence/Homogeneity: