WARPAGE PREDICTION IN PLASTIC INJECTION MOLDED PART USING ARTIFICIAL NEURAL NETWORK*
S. TAGHIZADEH1,** A. ÖZDEMIR2 AND O. ULUER3 1Dept. of Manufacturing Engineering, Faculty of Technology, Gazi University, Ankara, Turkey
Email: [email protected] 2, 3Dept. of Manufacturing Engineering, Faculty of Technology, Gazi University, Ankara, Turkey
Abstract– The main objective of this paper is to predict the warpage of a circular injection molded part based on different processing parameters. The selected part is used as spacers in automotive, transmission, and industrial power generation industries. The second goal is facilitating the setup of injection molding machine without (any) need for trial and error and reducing the setup time. To meet these objectives, an artificial neural network (ANN) model was presented. This model is capable of warpage prediction of injection molded plastic parts based on variable process parameters. Under different settings, the process was simulated by Moldflow and the warpage of the part was obtained. Initially, the effects of the melt temperature, holding pressure and the mold temperature on warpage were numerically analyzed. In the second step, a group of data that had been obtained from analysis results was used for training the ANN model. Also, another group of data was applied for testing the amount of ANN model prediction error. Finally, maximum error of ANN prediction was determined. The results show that the R-Squared value for data used for training of ANN is 0.997 and for the test data, is 0.995.
It would be difficult to imagine the modern world without plastics. Today, plastics are an integral part of
everyone’s life. Properties of the plastic materials such as high strength to weight ratio, the volume to
price ratio, corrosion resistance, ease and speed of production have resulted in an ever-increasing use of
them. Nowadays, in new part designs, plastics are used not only as a material for producing parts but also
as alternative material for the metal alloys [1].
Injection molding with its excellent dimensional tolerance is one of the most common methods in mass production of plastic parts. Generally, injection molded plastic parts do not need any
finishing or secondary operations [2]. This process consists of four stages that include melting, injection,
holding and cooling [3]. Process parameters, plastic material properties and product design criteria are the
basic factors in determining the final product quality. Warpage of the molded plastic parts is one of the most important problems in injection molding
process. Warped parts may not be functional or visually acceptable. Different shear rate profiles along the cross-section of part cause differences in orientation and these phenomena affect the shrinkage. Therefore, there will be variation in shrinkage in the part. Warpage occurs due to the non-uniform shear rate and temperature distribution in part material. Imbalance of shrinkage in any section of a part will produce a net force that could warp it. The stiffness of the part and the shrinkage imbalance level determine the warpage
Received by the editors February 20, 2013; Accepted May 7, 2013. Corresponding author
S. Taghizadeh et al.
IJST, Transactions of Mechanical Engineering, Volume 37, Number M2 October 2013
150
amount. If the part is too stiff to allow deflection, residual stresses will be created in the part that may cause problems later in its life [4]. If the shrinkage of a material is completely isotropic with respect to thickness, flow direction and distance, and packing pressure plastic parts will not warp. Asymmetric shrinkage and unequal contraction in the different directions cause warpage. Moreover, process parameters such as melt temperature and holding pressure have an effect on the rate of shrinkage in the different directions [5, 6]. Thus, different melt temperature and holding pressure will affect the warpage amount of the part. Non-uniform shrinkage in different directions could be determined using the material pressure-volume-temperature (PVT) relation diagrams [7].
Temperature-based warpage is caused by anisotropic cooling distribution in the cavity [8]. Low thermal conductivity of the plastic materials is one of the major factors in anisotropic cooling across the part thickness. Moreover, the lower thermal conductivity means that the plastic inside the barrel is melted over a long period. In addition, the molten plastic will require more time to solidify inside the mold cavity. Low thermal conductivity makes it hard to provide a uniform cooling profile across the part thickness and anywhere in the part body. In practice, variations in the melt temperature and melt pressure from one point to another in other cavity do not allow a steady-state condition to be established to produce parts with repeatable quality [9]. For the polymers, the thermal conductivity varies with temperature, degree of crystallinity and level of orientation.
Many researches have been carried out to analyze the relationships between process parameters and warpage of the plastic parts and decreasing the warpage [10-13]. In addition to the studies which focus on the relationship between the processing parameters and warpage, many researchers have proposed optimization methods for minimizing the warpage of the injection molded parts [10, 14]. Simplex algorithm [14], artificial neural network (ANN) [3, 15-19], genetic algorithm [9, 16, 20], Taguchi experimental design method [21] and fuzzy [22, 23] are the most preferred optimization methods found in the literature.
In two different studies, Min and Postawa presented models for creating a relationship between the melt pressure and part dimensions [24, 25]. In injection molding process, several processing parameters and setting conditions have a non-linear influence on the quality of the final part. Due to the nonlinear relationship between the processing parameters and the part quality indicators, it is difficult to estimate the quality parameters accurately using mathematical models [26-28].
ANN is a very useful method for prediction of linear and nonlinear systems. It has been widely used in many areas, such as control, data compression, forecasting, optimization, pattern recognition, classification, speech, vision, etc. The use of the ANNs for modeling and prediction purposes has become increasingly popular during the last decades [29]. In various studies, the neural network algorithm was used to establish a more accurate model for processing parameters and product quality that could estimate the product quality parameters more accurately. To determine the optimum values of process parameters, an ANN model was presented [16, 29, 30]. Sheleshnejhad and Taghizadeh presented a neural network model with 3-3-1 architecture. The model was designed to predict the fine length of the molded parts based on the cavity pressure profile [15]. Changyu et al. in 2007 used a combination of artificial neural networks and genetic algorithms to optimize the injection molding process parameters [16]. Ning and Lau have proposed neural network model for dimensional control of the molded parts based on the inverse process model [29].
To ensure the quality of plastic parts, the importance of part design and mold design in the initial stage of product development and process conditions during the final production process should be considered. However, the most economical one, is changing the process parameters systematically for the optimal process conditions [31]. The presence of an ANN model will facilitate the injection molding
October2013
machine priwasting of p
Other sare the pacprocess, comsoftware(s) this softwar
In thissimulation warpage weneural netw
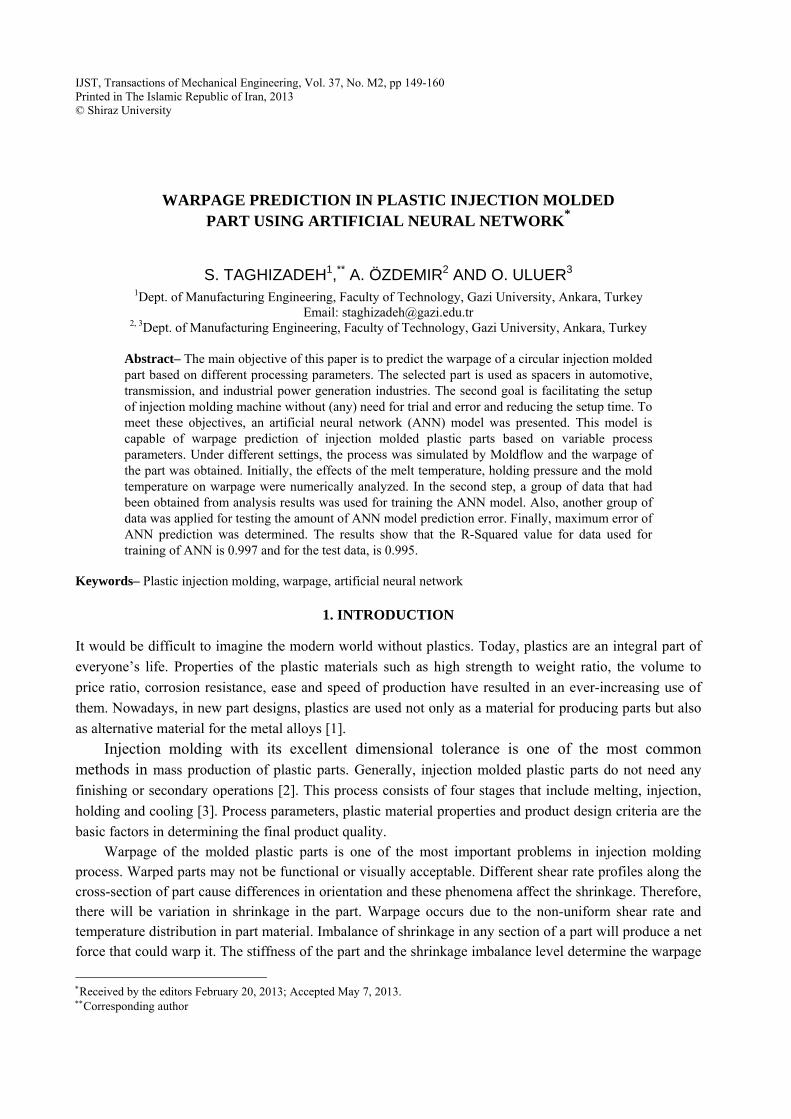
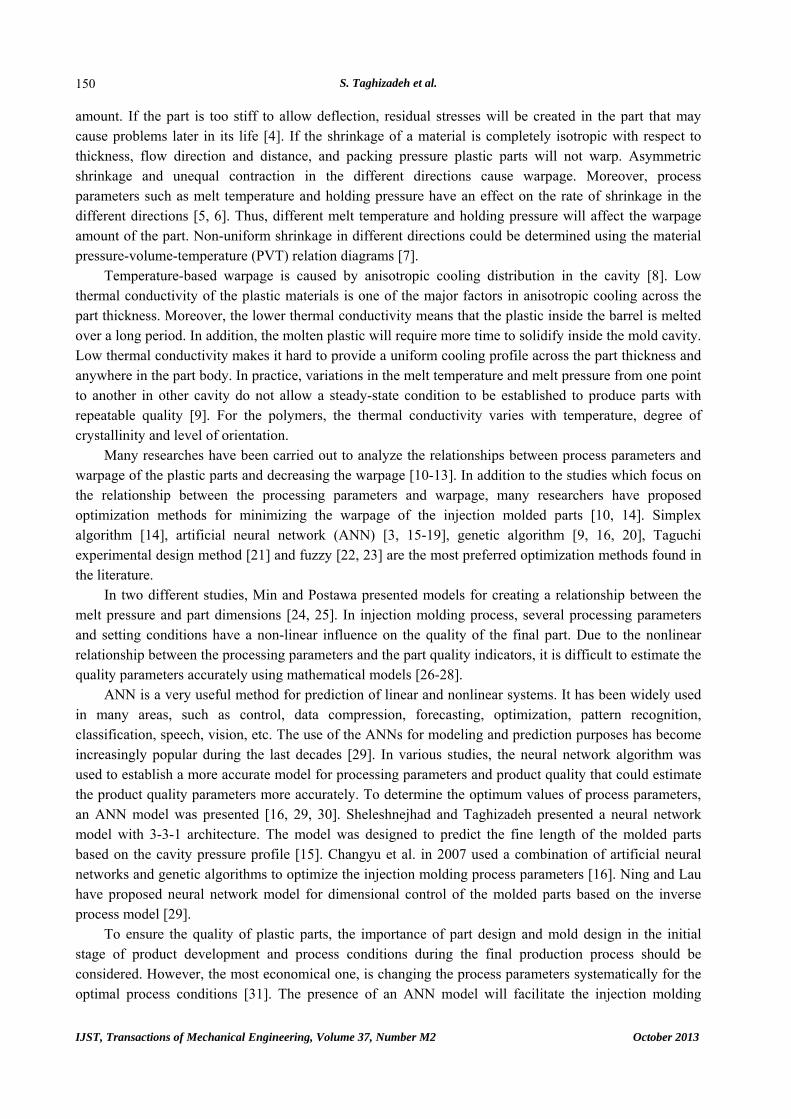
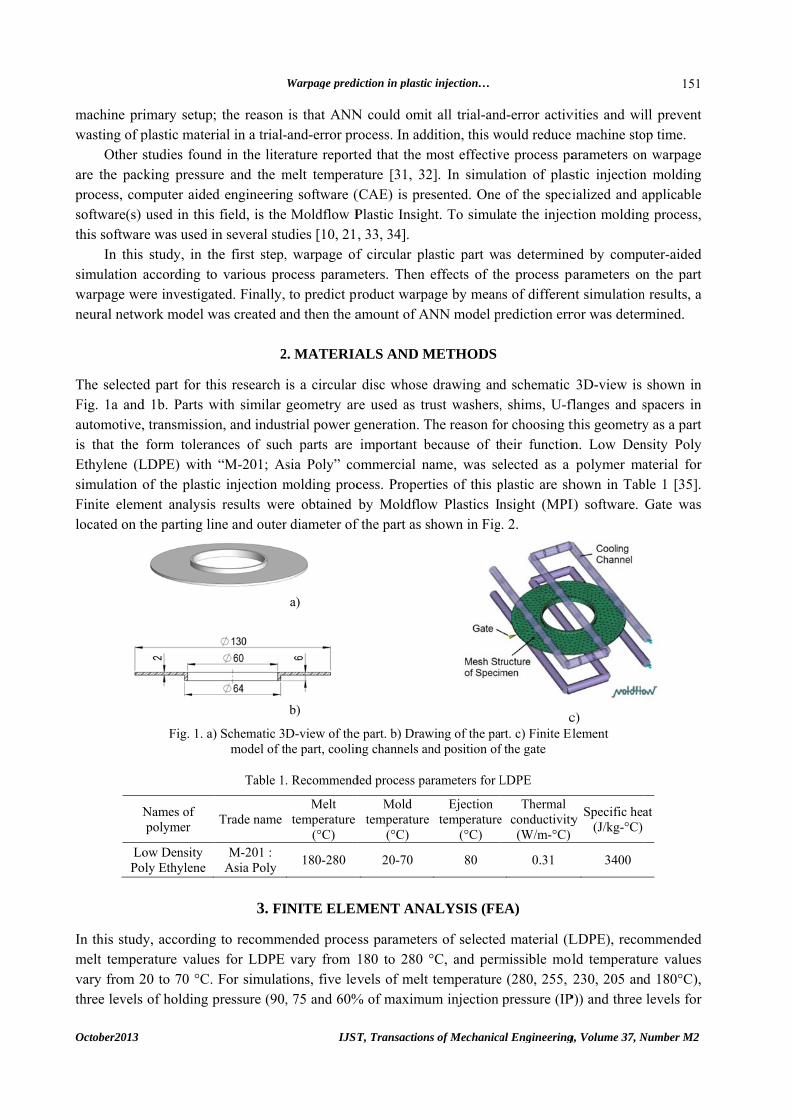
The selecteFig. 1a andautomotive,is that the Ethylene (Lsimulation oFinite elemlocated on t
N
LoPo
In this studymelt tempervary from 2three levels
imary setup;plastic materstudies founking pressurmputer aidedused in this
re was used i study, in thaccording toere investiga
work model w
d part for thd 1b. Parts w, transmissioform toleran
LDPE) with of the plasti
ment analysisthe parting li
Fig. 1. a)
Names of polymer
ow Density oly Ethylene
y, accordingrature value20 to 70 °C.
of holding p
; the reason rial in a trial-d in the literre and the md engineerin field, is thein several stuhe first step,o various proted. Finally,
was created a
2
his research iwith similar on, and indusnces of such“M-201; Asc injection m
s results werne and outer
) Schematic 3Dmodel of th
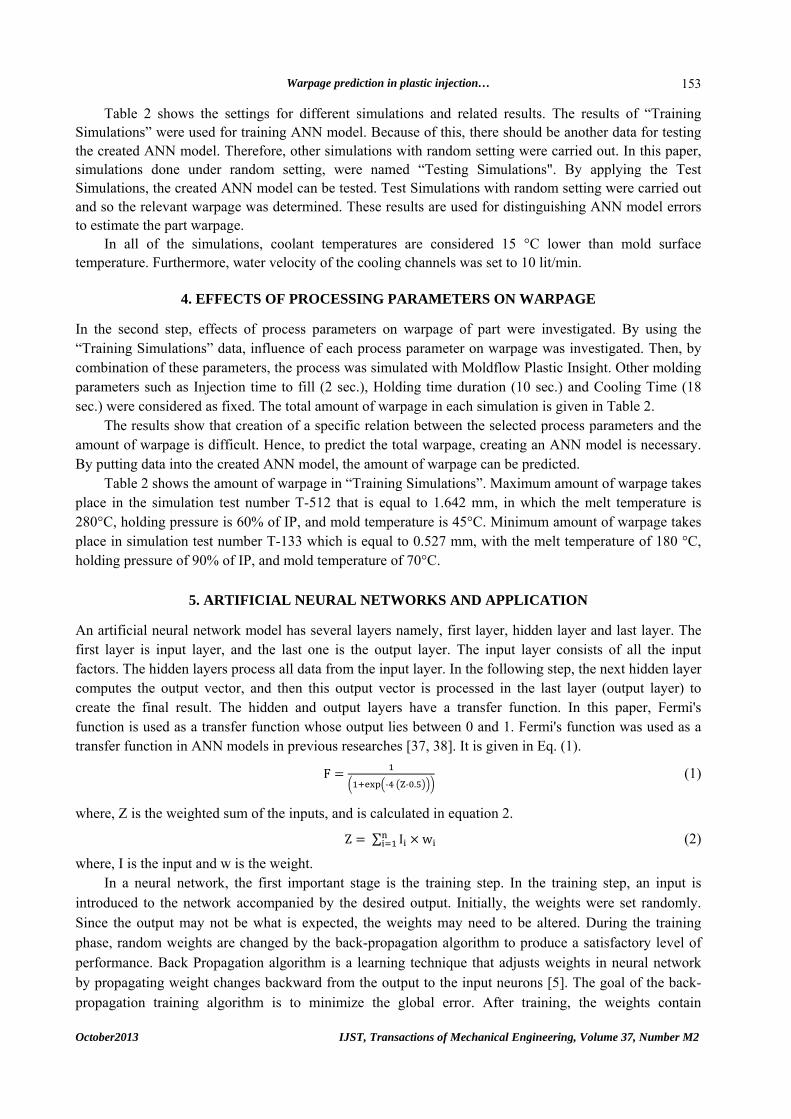
Table 1
Trade name
M-201 : Asia Poly
3. FI
g to recommes for LDPE For simulat
pressure (90,
Warpage predi
IJST
is that ANN-and-error prrature reportmelt temperag software ( Moldflow P
udies [10, 21, warpage ofocess paramto predict prnd then the a
2. MATERIA
is a circular geometry artrial power gh parts are sia Poly” comolding procre obtained r diameter of
a)
b)
D-view of thehe part, coolin
. Recommend
Melt temperature
(°C)
180-280
INITE ELEM
ended procevary from 1
ions, five lev, 75 and 60%
iction in plastic
T, Transaction
N could omitrocess. In addted that the mature [31, 32(CAE) is prePlastic Insigh, 33, 34]. f circular pla
meters. Then roduct warpaamount of AN
ALS AND M
disc whose re used as trgeneration. Timportant b
ommercial ncess. Propertby Moldflow
f the part as s
e part. b) Drawng channels an
ded process pa
Mold temperature
(°C)
20-70
MENT ANA
ss parameter180 to 280 vels of melt
% of maximu
c injection…
ns of Mechanica
t all trial-anddition, this wmost effectiv2]. In simulaesented. Oneht. To simul
astic part waeffects of thage by meanNN model p
METHODS
drawing andrust washers,The reason fobecause of thame, was seties of this pw Plastics Inshown in Fig
wing of the pand position of
arameters for L
Ejection
temperature(°C)
80
ALYSIS (FE
rs of selected°C, and permtemperature
um injection
al Engineering
d-error activwould reduce ve process paation of plas
of the speciate the injec
as determinehe process pns of differenrediction err
d schematic , shims, U-flor choosing their functionelected as a plastic are shnsight (MPI. 2.
crt. c) Finite El
f the gate
LDPE
e Thermal
conductivity(W/m-°C)
0.31
EA)
d material (Lmissible mole (280, 255, pressure (IP
g, Volume 37, N
vities and wi machine stoarameters onstic injectionialized and a
ction molding
ed by compuparameters onnt simulationror was deter
3D-view is flanges and sthis geometryn. Low Denpolymer ma
hown in TabI) software.
c) lement
y Specific hea
(J/kg-°C)
3400
LDPE), recold temperatu230, 205 an
P)) and three
Number M2
151
ill prevent op time. n warpage n molding applicable g process,
uter-aided n the part
n results, a rmined.
shown in spacers in y as a part nsity Poly aterial for
ble 1 [35]. Gate was
at
mmended ure values d 180°C), levels for
S. Taghizadeh et al.
IJST, Transactions of Mechanical Engineering, Volume 37, Number M2 October 2013
152
mold temperature (70, 45 and 20°C) were considered. As mentioned above, holding pressure (HP) was considered as a percentage of the maximum injection pressure (IP).
For simulation, the CAD model was imported to MPI and meshed before analyzing. A three-node element was selected for meshing the part. The mesh type is a fusion surface mesh. The numbers of nodes are 1174, the numbers of triangular elements are 2204, average aspect ratio of triangle elements is 1.6801 and maximum aspect ratio of triangle elements is 3.5959. The percentage of matched elements in the Fusion mesh is a key factor in determining the quality of the mesh, and that should be at least 85 [36]. In this research, the Match ratio is equal to 97%, which shows that the quality of mesh is acceptable. As shown in Fig. 1c, in order to cool the mold, there are three cooling channels with diameters of 10mm in each side of the mold. The distance of cooling channels from mold surface is 15 mm and centre distance between adjacent cooling channels is 55 mm.
By using full factorial experiment design method, combinations of mentioned levels were created. The total number of possible combinations or settings is 45. In this paper, simulations, which were done under the mentioned setting (45 setting), were named “Training Simulations”. By applying this setting, the simulated results were used for training ANN. Numbering of each test was performed based on the levels of each parameter. These values dictate the level of each factor: conventionally, 1 for the lowest level, 2 for the second and 3 for the third and 4 for the fourth level. For example, in test T-423, digit 4 indicates fourth level of melt temperature (280 ºC), digit 2 indicates the second level of Holding pressure (75% of IP), and digit 3 indicates the third level of mold temperature (70 ºC).
Table 2. Settings for Training Simulation and related results
October2013 IJST, Transactions of Mechanical Engineering, Volume 37, Number M2
153
Table 2 shows the settings for different simulations and related results. The results of “Training Simulations” were used for training ANN model. Because of this, there should be another data for testing the created ANN model. Therefore, other simulations with random setting were carried out. In this paper, simulations done under random setting, were named “Testing Simulations". By applying the Test Simulations, the created ANN model can be tested. Test Simulations with random setting were carried out and so the relevant warpage was determined. These results are used for distinguishing ANN model errors to estimate the part warpage.
In all of the simulations, coolant temperatures are considered 15 °C lower than mold surface temperature. Furthermore, water velocity of the cooling channels was set to 10 lit/min.
4. EFFECTS OF PROCESSING PARAMETERS ON WARPAGE In the second step, effects of process parameters on warpage of part were investigated. By using the “Training Simulations” data, influence of each process parameter on warpage was investigated. Then, by combination of these parameters, the process was simulated with Moldflow Plastic Insight. Other molding parameters such as Injection time to fill (2 sec.), Holding time duration (10 sec.) and Cooling Time (18 sec.) were considered as fixed. The total amount of warpage in each simulation is given in Table 2.
The results show that creation of a specific relation between the selected process parameters and the amount of warpage is difficult. Hence, to predict the total warpage, creating an ANN model is necessary. By putting data into the created ANN model, the amount of warpage can be predicted.
Table 2 shows the amount of warpage in “Training Simulations”. Maximum amount of warpage takes place in the simulation test number T-512 that is equal to 1.642 mm, in which the melt temperature is 280°C, holding pressure is 60% of IP, and mold temperature is 45°C. Minimum amount of warpage takes place in simulation test number T-133 which is equal to 0.527 mm, with the melt temperature of 180 °C, holding pressure of 90% of IP, and mold temperature of 70°C.
5. ARTIFICIAL NEURAL NETWORKS AND APPLICATION An artificial neural network model has several layers namely, first layer, hidden layer and last layer. The first layer is input layer, and the last one is the output layer. The input layer consists of all the input factors. The hidden layers process all data from the input layer. In the following step, the next hidden layer computes the output vector, and then this output vector is processed in the last layer (output layer) to create the final result. The hidden and output layers have a transfer function. In this paper, Fermi's function is used as a transfer function whose output lies between 0 and 1. Fermi's function was used as a transfer function in ANN models in previous researches [37, 38]. It is given in Eq. (1).
F ‐ ‐ .
(1)
where, Z is the weighted sum of the inputs, and is calculated in equation 2.
Z ∑ I w (2)
where, I is the input and w is the weight. In a neural network, the first important stage is the training step. In the training step, an input is
introduced to the network accompanied by the desired output. Initially, the weights were set randomly. Since the output may not be what is expected, the weights may need to be altered. During the training phase, random weights are changed by the back-propagation algorithm to produce a satisfactory level of performance. Back Propagation algorithm is a learning technique that adjusts weights in neural network by propagating weight changes backward from the output to the input neurons [5]. The goal of the back-propagation training algorithm is to minimize the global error. After training, the weights contain
S. Taghizadeh et al.
IJST, Transactions of Mechanical Engineering, Volume 37, Number M2 October 2013
154
meaningful information, whereas before training, they were random and had no meaning. When a satisfactory level of the performance is reached, the training will stop. Then the network uses these weights to make decisions.
In this paper, to evaluate model performance, absolute fraction of variance (R-Squared (R2)) was computed from the results produced by the ANN model. R-Squared measures the proportion of the variation around the mean. R-square is 1 if the model fits perfectly. In addition, R-square of 0 indicates that the fit is no better than the simple mean model. R-Squared (R2) defined by Eq. (3):
R 1‐ ∑ ‐
∑ (3)
where, T is target value, O is output value.
To ensure that the statistical distribution of values for each net input and output are roughly uniform, the inputs and output data should be normalized. The input and output data are normalized in the (0, 1) range with the Eq. (4). To train ANN model, all the Training Simulation data were normalized. Normalized data of “Training Simulations” are listed in Table 3.
V 0.1 0.8 (4)
where, Vmin, and Vmax are the minimum and maximum of related data respectively. VR is real data obtained from simulation tests, and VN is normalized value of VR.
Table 3. Normalized data of “Training Simulations” and resulted warpage
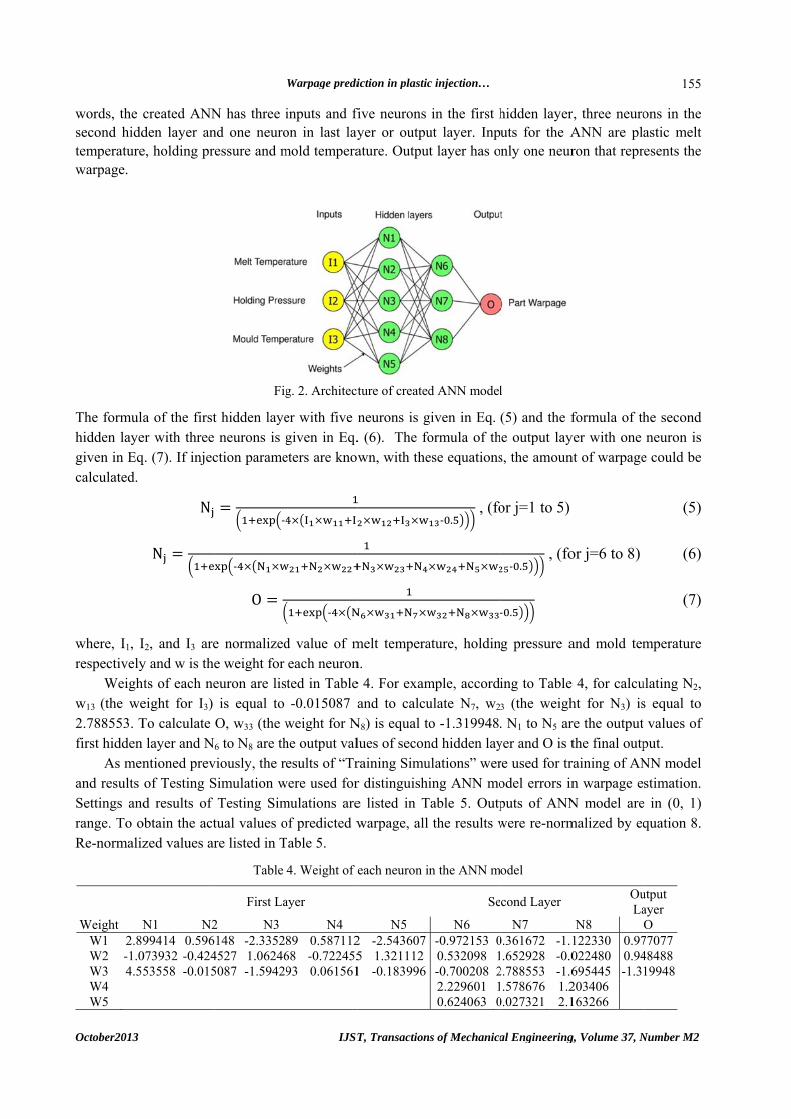
Several different architectures of ANN model were created in Pythia software in order to reach best performance. Finally, ANN model with a 3-5-3-1 architecture was selected and is shown in Fig. 2. In other
October2013
words, the second hiddtemperaturewarpage.
The formulahidden layegiven in Eqcalculated.
where, I1, Irespectively
Weighw13 (the we2.788553. Tfirst hidden
As menand results Settings andrange. To oRe-normaliz
Weight NW1 2.89W2 -1.0W3 4.55W4 W5
created ANNden layer ane, holding pr
a of the firster with three q. (7). If injec
N
N
I2, and I3 arey and w is thehts of each neeight for I3) To calculate
layer and Nntioned prevof Testing Sd results of
obtain the actzed values ar
N1 N299414 0.596
073932 -0.42453558 -0.015
N has three ind one neuroessure and m
Fig
t hidden layeneurons is g
ction parame
‐
‐
O
e normalizede weight for euron are lisis equal to
O, w33 (the w
6 to N8 are thviously, the rSimulation w
Testing Simtual values ore listed in T
Table
First La
2 N3 148 -2.3352
4527 1.062465087 -1.59429
Warpage predi
IJST
inputs and fion in last laymold tempera
g. 2. Architect
er with five ngiven in Eq.eters are know
‐
d value of meach neuronted in Table-0.015087 a
weight for Nhe output valesults of “Tr
were used formulations areof predicted wTable 5.
4. Weight of e
ayer
N4 89 0.58711268 -0.72245593 0.061561
iction in plastic
T, Transaction
five neuronsyer or outpuature. Output
ture of created
neurons is g. (6). The fown, with the
melt temperan. e 4. For examand to calcu
N8) is equal tolues of seconraining Simur distinguishie listed in Twarpage, all
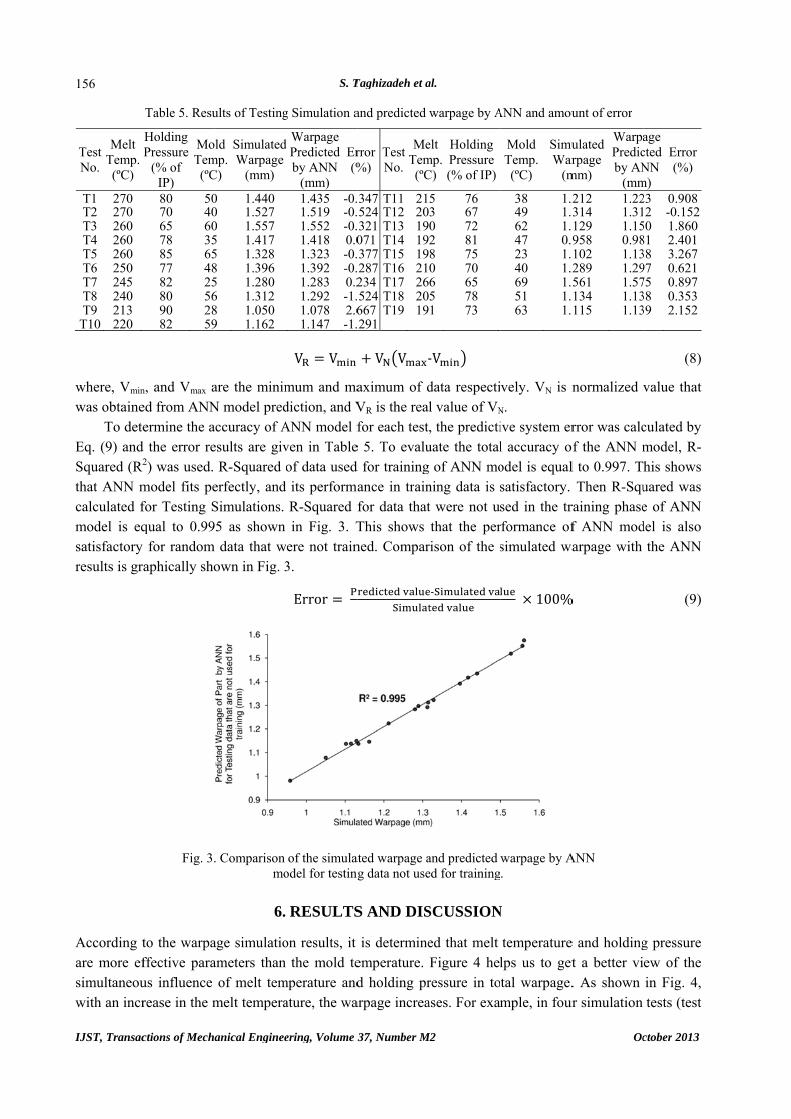
culated by model, R-his shows uared was e of ANN del is also
the ANN
(9)
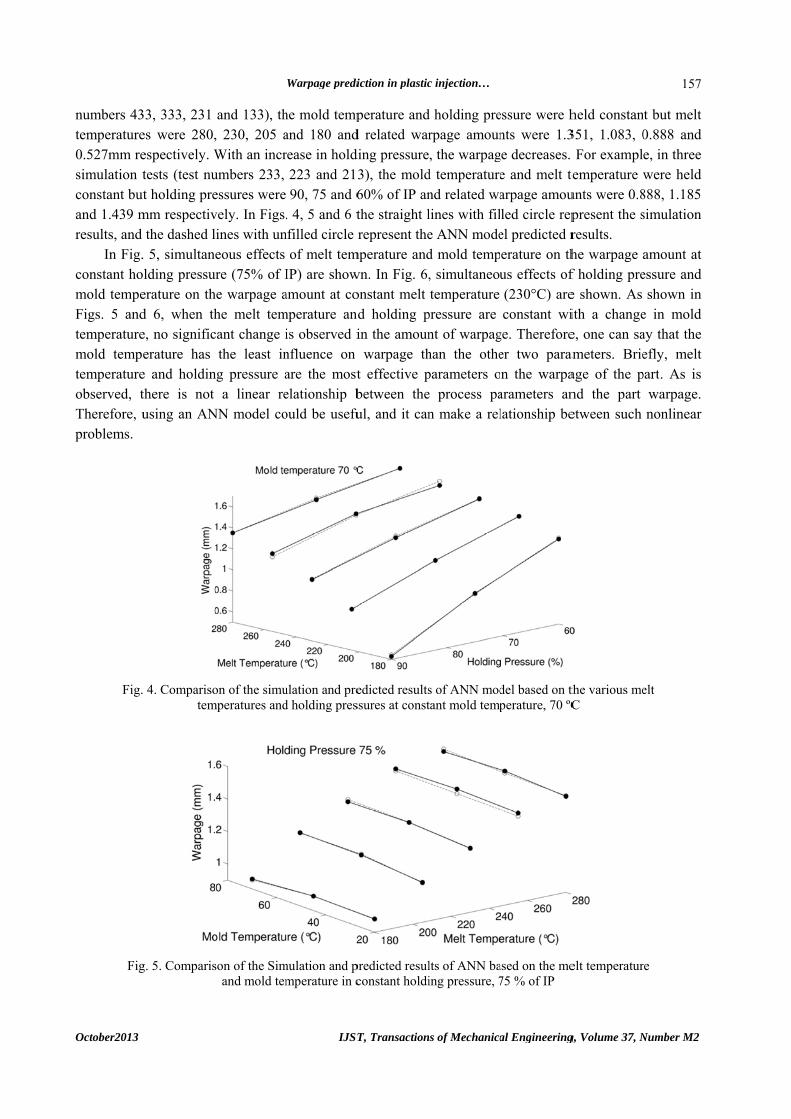
g pressure ew of the in Fig. 4, tests (test
October2013
numbers 43temperature0.527mm resimulation tconstant butand 1.439 mresults, and
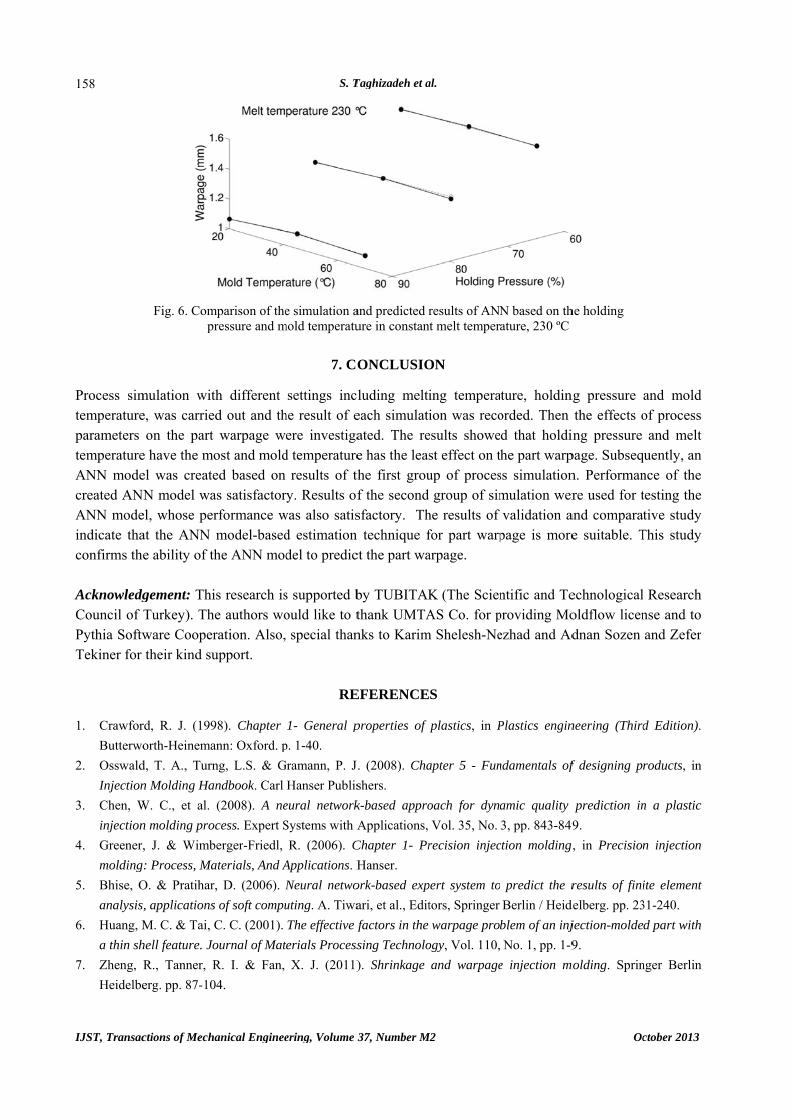
In Fig.constant homold tempeFigs. 5 andtemperaturemold tempetemperatureobserved, tTherefore, uproblems.
Fig.
Fig
33, 333, 231 es were 280,espectively. Wtests (test nut holding pre
mm respectivthe dashed l
. 5, simultanlding pressu
erature on thd 6, when the, no significerature has
e and holdinthere is not using an AN
4. Comparisotem
g. 5. Comparis
and 133), th, 230, 205 aWith an incrumbers 233, essures werevely. In Figs.lines with un
neous effects ure (75% of Ihe warpage ahe melt temcant change i
the least inng pressure a
a linear reNN model co
on of the simumperatures and
son of the Simand mold tem
Warpage predi
IJST
he mold tempand 180 andrease in hold223 and 21390, 75 and 6
. 4, 5 and 6 tnfilled circle
of melt temIP) are showamount at co
mperature anis observed influence on are the mostelationship bould be usefu
ulation and pred holding pres
mulation and pmperature in c
iction in plastic
T, Transaction
perature andd related warding pressure3), the mold60% of IP anthe straight lrepresent the
mperature andwn. In Fig. 6,onstant melt d holding pin the amounwarpage th
t effective pbetween theul, and it can
edicted resultsssures at const
predicted resulconstant holdi
c injection…
ns of Mechanica
d holding prerpage amoun, the warpag
d temperaturend related walines with file ANN moded mold temp, simultaneoutemperature
pressure are nt of warpaghan the otheparameters oe process pan make a rel
s of ANN modtant mold temp
lts of ANN baing pressure, 7
al Engineering
essure were hnts were 1.3
ge decreases. e and melt tearpage amouled circle repel predicted rerature on thus effects of(230°C) areconstant wi
ge. Thereforeer two paramn the warpa
arameters anlationship be
del based on thperature, 70 ºC
ased on the me75 % of IP
g, Volume 37, N
held constan351, 1.083, 0
For exampltemperature wunts were 0.8present the sresults. he warpage af holding pree shown. As ith a changee, one can saameters. Brieage of the pnd the part etween such
the various meC
elt temperatur
Number M2
157
nt but melt 0.888 and e, in three were held
888, 1.185 simulation
amount at essure and
shown in e in mold ay that the efly, melt
part. As is warpage. nonlinear
elt
re
IJST, Transac
158
Process simtemperatureparameters temperatureANN modecreated ANNANN modeindicate thaconfirms the AcknowledgCouncil of Pythia SoftwTekiner for
1. Crawfor
Butterwo
2. Osswald
Injection
3. Chen, W
injection
4. Greener,
molding
5. Bhise, O
analysis,
6. Huang, M
a thin sh
7. Zheng,
Heidelbe
ctions of Mech
Fig. 6. Compr
mulation wite, was carrieon the part
e have the moel was createN model wa
el, whose perat the ANN e ability of th
gement: ThiTurkey). Thware Coopertheir kind su
rd, R. J. (199
orth-Heinema
d, T. A., Turn
n Molding Ha
W. C., et al.
n molding pro
, J. & Wimb
g: Process, Ma
O. & Pratihar
, applications
M. C. & Tai, C
hell feature. Jo
R., Tanner, R
erg. pp. 87-10
anical Enginee
mparison of theressure and m
th different d out and thwarpage w
ost and molded based on as satisfactorrformance wmodel-basedhe ANN mod
is research ise authors woration. Also,upport.
98). Chapter
ann: Oxford. p
ng, L.S. & G
ndbook. Carl
(2008). A ne
cess. Expert S
berger-Friedl,
aterials, And A
r, D. (2006). N
s of soft compu
C. C. (2001).
ournal of Mat
R. I. & Fan,
04.
S. T
ering, Volume 3
e simulation amold temperatu
7. CO
settings inclhe result of eere investiga
d temperatureresults of th
ry. Results ofwas also satisd estimation del to predic
s supported bould like to t
special than
RE
1- General p
p. 1-40.
Gramann, P. J
Hanser Publis
eural network
Systems with A
R. (2006). C
Applications. H
Neural netwo
uting. A. Tiwa
The effective f
erials Process
X. J. (2011)
Taghizadeh et a
37, Number M
and predicted rure in constan
ONCLUSIO
luding meltieach simulatiated. The ree has the leasthe first grouf the secondsfactory. Th technique f
ct the part wa
by TUBITAKthank UMTAnks to Karim
EFERENCE
properties of
. (2008). Cha
shers.
k-based appro
Applications,
Chapter 1- Pr
Hanser.
ork-based exp
ari, et al., Edit
factors in the
sing Technolo
). Shrinkage
al.
M2
results of ANNnt melt temper
ON
ing temperaion was reco
esults showest effect on tup of proces
group of simhe results of for part warparpage.
K (The ScienAS Co. for p
m Shelesh-Ne
S
plastics, in P
apter 5 - Fun
oach for dyna
Vol. 35, No.
recision injec
pert system to
tors, Springer
warpage prob
ogy, Vol. 110,
and warpage
N based on thature, 230 ºC
ture, holdinorded. Then d that holdihe part warp
ss simulationmulation wervalidation a
page is more
ntific and Teproviding Moezhad and Ad
Plastics engin
ndamentals of
amic quality
3, pp. 843-849
ction molding
predict the r
Berlin / Heid
blem of an inj
No. 1, pp. 1-9
e injection m
Oc
he holding
ng pressure the effects o
ing pressure page. Subseqn. Performanre used for t
and comparate suitable. T
echnologicaloldflow licendnan Sozen
neering (Third
f designing pr
prediction in
9.
g, in Precision
results of fini
delberg. pp. 23
jection-molde
9.
molding. Sprin
ctober 2013
and mold of process
and melt quently, an nce of the testing the tive study
This study
Research nse and to and Zefer
d Edition).
roducts, in
n a plastic
n injection
ite element
31-240.
d part with
nger Berlin
Warpage prediction in plastic injection…
October2013 IJST, Transactions of Mechanical Engineering, Volume 37, Number M2
159
8. Zheng, R., et al. (1999). Thermoviscoelastic simulation of thermally and pressure-induced stresses in injection
moulding for the prediction of shrinkage and warpage for fibre-reinforced thermoplastics. Journal of Non-
Newtonian Fluid Mechanics, Vol. 84, No. 2-3, pp. 159-190.
9. Kurtaran, H., Ozcelik, B. & Erzurumlu, T. (2005). Warpage optimization of a bus ceiling lamp base using
neural network model and genetic algorithm. Journal of Materials Processing Technology, Vol. 169, No. 2, pp.
314-319.
10. Yin, F., et al. (2011). Back Propagation neural network modeling for warpage prediction and optimization of
plastic products during injection molding. Materials & Design, Vol. 32, No. 4, pp. 1844-1850.
11. Jansen, K. M. B., Van Dijk, D. J. & Husselman, M. H. (1998). Effect of processing conditions on shrinkage in
injection molding. Polymer Engineering and Science, Vol. 38, No. 5, pp. 838-846.
12. Chiang, Y. C., et al. (2011). Warpage phenomenon of thin-wall injection molding. The International Journal of
Advanced Manufacturing Technology, Vol. 55, No. 5, pp. 517-526.
13. Kurt, M., et al. (2010). Influence of molding conditions on the shrinkage and roundness of injection molded
parts. The International Journal of Advanced Manufacturing Technology, Vol. 46, No. 5, pp. 571-578.
14. Fassett, J. & Soc Plast, E. (1995). Thin wall molding: Differences in processing over standard injection molding.
Antec 95-the Plastics Challenger: A Revolution in Education, Conference Proceedings, Vols I-Iii: Vol I:
Processing; Vol Ii: Materials; Vol Iii: Special Areas. Brookfield Center: Soc Plastics Engineers. pp. 430-433.
15. Shelshnezhad, K. & Taghizadeh, S. (2008). Dimensional prediction of injection molded parts using melt
pressure trace and neural network. Iranian Journal of Polymer Science and Technology (Persian), Vol. 3, ISSUE
NO. 95, pp. 191-199.
16. Shen, C., Wang, L. & Li, Q. (2007). Optimization of injection molding process parameters using combination of
artificial neural network and genetic algorithm method. Journal of Materials Processing Technology, Vol. 183,
Nos. 2–3, pp. 412-418.
17. Mahdavinejhad, R. A. (2011). Prediction of angular errors on a vertical CNC milling machine. Iranian Journal
of Science and Technology, Transaction B: Engineering, Vol. 35, No. 2, pp. 181-195.
18. Taghizadeh, S., et al. (2013). Developing a model for hardness prediction in water-quenched and tempered AISI
1045 steel through an artificial neural network. Materials & Design.
19. Esme, U., Sagbas, A. & Kahraman, F. (2009). prediction of surface roughness in wire electrical discharge
machining using design of experiments and neural networks. Iranian Journal of Science and Technology,
Transaction B: Engineering, Vol. 33, No. B3, pp. 231-240.
20. Kurtaran, H. & Erzurumlu, T. (2006). Efficient warpage optimization of thin shell plastic parts using response
surface methodology and genetic algorithm. International Journal of Advanced Manufacturing Technology, Vol.
27, No. 5-6, pp. 468-472.
21. Erzurumlu, T. & Ozcelik, B. (2006). Minimization of warpage and sink index in injection-molded thermoplastic
parts using Taguchi optimization method. Materials & Design, Vol. 27, No. 10, pp. 853-861.
22. Vagelatos, G. A., Rigatos, G. G. & Tzafestas, S. G. (2001). Incremental fuzzy supervisory controller design for
optimizing the injection molding process. Expert Systems with Applications, Vol. 20, No. 2, pp. 207-216.
23. Mousavi, S. A., et al. (2010). A fuzzy logic control system for the rotary dental instruments. Iranian Journal of
Science and Technology, Transaction B: Engineering, Vol. 34, No. B5, pp. 539-551.
24. Postawa, P. & Koszkul, J. (2005). Change in injection moulded parts shrinkage and weight as a function of
processing conditions. Journal of Materials Processing Technology, Vols. 162–163(0), pp. 109-115.
25. Min, B. H. (2003). A study on quality monitoring of injection-molded parts. Journal of Materials Processing
Technology, Vol. 136, Nos. 1–3, pp. 1-6.
26. M, J.G., Jr. (2002). Chapter 8 - Six Sigma Keys to Success are Control, Capability and Repeatability, in Six
Sigma Quality for Business and Manufacture. Elsevier Science B.V., Amsterdam. pp. 333-392.
S. Taghizadeh et al.
IJST, Transactions of Mechanical Engineering, Volume 37, Number M2 October 2013
160
27. Shi, H., Xie, S. & Wang, X. (2012). A warpage optimization method for injection molding using artificial neural
network with parametric sampling evaluation strategy. The International Journal of Advanced Manufacturing
Technology, pp. 1-11.
28. Beaumont, J. P., Nagel, R. & Sherman, R. (2002). Chapter 15- shrinkage and warpage analysis, in successful
injection molding: process, design, and simulation. Hanser Publishers.
29. Lau, H.C.W., et al. (2001). Neural networks for the dimensional control of molded parts based on a reverse
process model. Journal of Materials Processing Technology, Vol. 117, Nos. 1-2, pp. 89-96.
30. Petrova, T. & Kazmer, D. (1999). Incorporation of phenomenological models in a hybrid neural network for
quality control of injection molding. Polymer-Plastics Technology and Engineering, Vol. 38, No. 1, pp. 1-18.
31. Liao, S. J., et al. (2004). Shrinkage and warpage prediction of injection-molded thin-wall parts using artificial