91
May 5, 2017 Washington Area Economy: Performance and Outlook Center for Regional Analysis Schar School of Policy and Government George Mason University

May 5, 2017
Washington Area Economy: Performance and Outlook
Center for Regional AnalysisSchar School of Policy and Government
George Mason University

U.S. Gross Domestic Product
Source: Bureau of Economic Analysis (Seasonally Adjusted, Chained 2009 Dollars )
2010 2011 2012 2013 2014 2015 2016
$13,000
$13,500
$14,000
$14,500
$15,000
$15,500
$16,000
$16,500
$17,000
$17,500
-2.0
-1.0
0.0
1.0
2.0
3.0
4.0
5.0
6.0Quarterly Change Real GDP (Billions)
%
1Q17 +0.7%

U.S. Leading IndexMonth-Over-Year Percent Change
-25
-20
-15
-10
-5
0
5
10
15
Source: The Conference Board, GMU Center for Regional Analysis
March = 126.7
(2010 = 100.0)

U.S. Coincident IndexMonth-Over-The-Year Percent Change
-10
-8
-6
-4
-2
0
2
4
6
Dec-0
6
Dec-0
7
Dec-0
8
Dec-0
9
Dec-10
Dec-11
Dec-12
Dec-13
Dec-14
Dec-15
Dec-16
Source: The Conference Board, GMU Center for Regional Analysis

40
45
50
55
60
65
Mfg
N-Mfg
ISM Manufacturing and Non-Manufacturing Indices
Source: Institute for Supply Management
Dec 2016Mfg = 54.7N-Mfg = 57.2

-8000
-6000
-4000
-2000
0
2000
4000(000s)
April =+2.2M
Annual Change in Payroll Jobs – USMonth-Over-Year
Source: Bureau of Labor Statistics (Not Seasonally Adjusted), GMU Center for Regional Analysis

-900
-700
-500
-300
-100
100
300
500
7002
00
7
20
08
20
09
20
10
20
11
20
12
20
13
20
14
20
15
20
16
20
17
(000s)
US Payroll Job ChangeMonth-to-Month
April=+211K
Source: Bureau of Labor Statistics (Seasonally Adjusted), GMU Center for Regional Analysis

125
130
135
140
145
150
0
50
100
150
200
250
300
350
400
2012 2013 2014 2015 2016 2017
Month-to-Month Change (000s) Total (Millions)
US Payroll Jobs
Source: Bureau of Labor Statistics (Seasonally Adjusted), GMU Center for Regional Analysis
2016+2.2
M
Apr+211,000
Since 2010 +16M

-8000
-6000
-4000
-2000
0
2000
4000
6000
Annual Change in US Employed Workers* (000s)
Apr =+2.2M
*employed workers include full-time, part-time, self-employed and contract workersSource: Bureau of Labor Statistics (Not Seasonally Adjusted)

U.S. Payroll Job Change by SectorApril 2016 –April 2017
-46
37
84
56
54
173
173
40
304
75
142
612
512
-100 0 100 200 300 400 500 600 700
Information
Federal Govt.
Transp. & Util.
Other Services
Wlse Trade
Construction
Financial
Manufacturing
Leisure & Hosp.
Retail Trade
State & Local Govt
Prof. & Bus. Svcs
Educ & Health Svcs
(000s)Total = 2,237,000
Ranked by Size in 2016
Source: Bureau of Labor Statistics (Seasonally Adjusted), GMU Center for Regional Analysis

U.S. Payroll Job Change by SectorMar 2017 –April 2017
-7
-6
4
1
7
5
19
6
55
6
23
39
41
-20 -10 0 10 20 30 40 50 60
Information
Federal Govt.
Transp. & Util.
Other Services
Wlse Trade
Construction
Financial
Manufacturing
Leisure & Hosp.
Retail Trade
State & Local Govt
Prof. & Bus. Svcs
Educ & Health Svcs
(000s)
Total =211K
Ranked by Size in 2016
Source: Bureau of Labor Statistics (Seasonally Adjusted), GMU Center for Regional Analysis

4
5
6
7
8
9
10
11
U.S. Unemployment Rate
Source: Bureau of Labor Statistics (Seasonally Adjusted), IHS Economics October 2016
April= 4.4
%
IHS Forecast16 – 4.917 – 4.818 – 4.619 – 4.620 – 4.7

0
5
10
15
20
Apr-12 Apr-13 Apr-14 Apr-15 Apr-16 Apr-17
U.S. Unemployment
Source: Bureau of Labor Statistics (Seasonally Adjusted)
60
65
70
Apr8.6%
U-6
UR
LFPR
Apr4.4%
Apr62.9%
Mar-Apr
U-6 -0.3%
UR.-0.1%

200
250
300
350
400
450
500
550
600
650
700
Initial Claims for Unemployment4-Week Moving Average
Jan 7: 249K
Source: Department of Labor
(000s)

250
300
350
400
450
500
Jan 7:249K
Source: Department of Labor
(000s)
Initial Claims for Unemployment4-Week Moving Average

Average Weekly WagesAcross all Industries
-$30
-$20
-$10
$0
$10
$20
$30
$40
$50
$60
$0
$200
$400
$600
$800
$1,000
$1,200
2010 2011 2012 2013 2014 2015 2016
QOTYC Average Weekly Wage 4 per. Mov. Avg. (Average Weekly Wage)
Source: Bureau of Labor Statistics, GMU Center for Regional Analysis

Labor ProductivityNonfarm business, seasonally adjusted
Source: U.S. Bureau of Labor Statistics
0
20
40
60
80
100
120
-1
0
1
2
3
4
5
6 QOTYC Productivity Index
Base year (100) = 2009

0
20
40
60
80
100
120
140
160
Apr-12 Apr-13 Apr-14 Apr-15 Apr-16 Apr-17
Consumer Confidence
Source: The Conference Board, GMU Center for Regional Analysis
Expectations
Current Situation
April 2017Cur. = 140.6 Exp. = 106.7(1985 = 100)

(1.0)
-
1.0
2.0
3.0
4.0
5.0
20
01
20
02
20
03
20
04
20
05
20
06
20
07
20
08
20
09
20
10
20
11
20
12
20
13
20
14
20
15
20
16
20
17
20
18
20
19
20
20
Consumer Prices2001 - 2020
Forecast > > >
Source: Bureau of Labor Statistics, IHS Economics October 2016

0.0
1.0
2.0
3.0
4.0
5.0
6.0
7.0
8.0
2001 2003 2005 2007 2009 2011 2013 2015
30-Yr
10-YrTreas
Fed
Interest Rates2001 - 2016
Source: Federal Reserve Bank of St. Louis
%

Only false signal
-4
-3
-2
-1
0
1
2
3
4
5
'59 '62 '65 '68 '71 '74 '77 '80 '83 '86 '89 '92 '95 '98 '01 '04 '07
Percentage points
10-yr./1-yr. yield spread
Source: FRB Dallas

0.00
0.50
1.00
1.50
2.00
2.50
3.00
3.50
4.00
4.50
5.00
04 05 06 07 08 09 10 11 12 13 14 15 16
10-yr./1-yr. yield spread
Source: Internal Revenue Service

200
250
300
350
400
450
500
550
600
650
700
2,000
2,500
3,000
3,500
4,000
4,500
5,000
5,500
6,000
6,500
7,000
Existing (Left Axis)
New (Right Axis)
U.S. New and Existing Home Sales(000s) (000s)
Source: U.S. Census (New)(Seasonally Adjusted Annual Rate), National Association of Realtors (Existing)
Jan 16-Jan 17
+5.4%280K
Jan 16-Jan 17
+13% 67K

Growth in Total Consumption Outlays
3.1
3.83.5
3
2.2
-0.3
-1.6
1.92.3
1.5 1.5
2.93.2
2.7 2.5 2.3 2.5 2.3
-2
-1
0
1
2
3
4
5
6
Source: Bureau of Economic Analysis, IHS Economics October 2016
Forecast > > > >

-25
-20
-15
-10
-5
0
5
10
15
20
GDP
Non-Res: Structures
Bus. Inv.-Eq & Sfwr
Residential Fixed
State & Local
Federal
U.S. Economic PerformancePercent Annual Change
Source: Bureau of Economic Analysis, IHS Economics October 2016
Forecast > > > > > >%

Oil Prices$ per barrel
0
20
40
60
80
100
120
2004
2005
2006
2007
2008
2009
2010
2011
2012
2013
2014
2015
2016
2017
2018
2019
2020
$/barrel
Source: IHS Economics October 2016
Forecast > > > > >

80.0
85.0
90.0
95.0
100.0
105.0
110.0
115.0
120.0
125.0
130.0
Dec-09 Dec-10 Dec-11 Dec-12 Dec-13 Dec-14 Dec-15 Dec-16
U.S. Coincident and Leading IndicesDec 2009 – Dec 2016
Source: The Conference Board
C.I.
L.I.

1.8
-0.3
-2.8
2.51.6
2.21.7
2.4 2.6
1.6 1.82.2
2.8
1.2
-4
-2
0
2
4
2007 2008 2009 2010 2011 2012 2013 2014 2015 2016 2017 2018 2019 2020
%
Source: Bureau of Economic Analysis , GMU Center for Regional Analysis, Forecast: January, 2017
U.S. GDP2007 – 2016 – 2020
(Annual % Change)
%

The Washington Economy

Elements of Population Change Washington MSA
49,005 49,178 47,773 48,669 46,424 43,886
37,714 38,895 36,749 40,119 42,240 40,581
22,979 5,5253,827
-26,362 -29,417 -31,010
-40,000
-20,000
0
20,000
40,000
60,000
80,000
100,000
120,000
2010-2011 2011-2012 2012-2013 2013-2014 2014-2015 2015-2016
Po
pu
lati
on
Ch
an
ge
Net Domestic Migration Net Int'l Migration Natural Increase
Source: US Census Bureau, Population Estimates Program, V2016
1.9% 1.6% 1.5% 1.1% +1.0% +0.9%

-15.0%
-10.0%
-5.0%
0.0%
5.0%
10.0%
Washington MSA Leading Economic IndexMonth-Over-Year Percent Change
12-MonthMoving Average
Source: GMU Center for Regional Analysis

-15.0%
-10.0%
-5.0%
0.0%
5.0%
10.0%
Washington MSA Coincident Economic IndexMonth-Over-Year Percent Change
12-MonthMoving Average
Source: GMU Center for Regional Analysis

-100
-50
0
50
100
150
199
1
199
2
199
3
199
4
199
5
199
6
199
7
199
8
199
9
20
00
20
01
20
02
20
03
20
04
20
05
20
06
20
07
20
08
20
09
20
10
20
11
20
12
20
13
20
14
20
15
20
16
20
17
(000s)
Annual Job Change – MOTYCWashington MSA
Source: Bureau of Labor Statistics (Not Seasonally Adjusted), GMU Center for Regional Analysis

Annual Job Change - Washington MSA
2,850
2,900
2,950
3,000
3,050
3,100
3,150
3,200
3,250
3,300
-10
10
30
50
70
90
110
2012 2013 2014 2015 2016 2017
MOTYC Non-Farm Jobs
Source: Bureau of Labor Statistics (Not Seasonally Adjusted), GMU Center for Regional Analysis
Mar-17 Total: 3,245 K
000’s 000’s
Mar 16-Mar 17
+50.4 K

-30
-20
-10
0
10
20
30
40
199
1
199
2
199
3
199
4
199
5
199
6
199
7
199
8
199
9
20
00
20
01
20
02
20
03
20
04
20
05
20
06
20
07
20
08
20
09
20
10
20
11
20
12
20
13
20
14
20
15
20
16
20
17
(000s)
Annual Job Change – MOTYCDistrict of Columbia
Source: Bureau of Labor Statistics (Not Seasonally Adjusted), GMU Center for Regional Analysis

Annual Job Change – District of Columbia
680
700
720
740
760
780
800
0
5
10
15
20
25
2012 2013 2014 2015 2016 2017
MOTYC Non-Farm Jobs
Source: Bureau of Labor Statistics (Not Seasonally Adjusted), GMU Center for Regional Analysis
Mar-17 Total: 786 K
000’s 000’s
Mar 16-Mar 17
+6.2 K

-40
-30
-20
-10
0
10
20
30
40
199
1
199
2
199
3
199
4
199
5
199
6
199
7
199
8
199
9
20
00
20
01
20
02
20
03
20
04
20
05
20
06
20
07
20
08
20
09
20
10
20
11
20
12
20
13
20
14
20
15
20
16
20
17
(000s)
Annual Job Change – MOTYCSuburban Maryland
Source: Bureau of Labor Statistics (Not Seasonally Adjusted), GMU Center for Regional Analysis

Annual Job Change – Suburban MD
860
880
900
920
940
960
980
1,000
1,020
-5
0
5
10
15
20
25
30
35
2012 2013 2014 2015 2016 2017
MOTYC Non-Farm Jobs
Source: Bureau of Labor Statistics (Not Seasonally Adjusted), GMU Center for Regional Analysis
Mar-17 Total: 1007 K
000’s 000’s
Mar 16-Mar 17
+26.6K

-40
-20
0
20
40
60
80
199
1
199
2
199
3
199
4
199
5
199
6
199
7
199
8
199
9
20
00
20
01
20
02
20
03
20
04
20
05
20
06
20
07
20
08
20
09
20
10
20
11
20
12
20
13
20
14
20
15
20
16
20
17
(000s)
Annual Job Change – MOTYCNorthern Virginia
Source: Bureau of Labor Statistics (Not Seasonally Adjusted), GMU Center for Regional Analysis

Annual Job Change – Northern VA
1,280
1,300
1,320
1,340
1,360
1,380
1,400
1,420
1,440
1,460
1,480
-20
-10
0
10
20
30
40
50
2012 2013 2014 2015 2016 2017
MOTYC Non-Farm Jobs
Source: Bureau of Labor Statistics (Not Seasonally Adjusted), GMU Center for Regional Analysis
Mar-17 Total: 1,446 K
000’s 000’s
Mar 16-Mar 17
+28.1K

41
Employment Composition by SectorMar 2017
Washington MSA
1.6%
1.9%
2.0%
2.2%
4.6%
4.8%
6.0%
8.5%
9.9%
10.4%
11.3%
13.7%
23.0%
0% 5% 10% 15% 20% 25%
Manufacturing
Wholesale Trade
Transportation & Utilities
Information
Construction
Financial Activites
Other Services
Retail Trade
Leisure & Hospitality
State & Local Government
Federal Government
Education & Health Services
Professional & Business…
Source: US Bureau of Labor Statistics, Current Employment Statistics

Job Change by SectorMar 2016 – Mar 2017
Washington MSA
-0.3
0.8
1.3
-2.8
-0.2
-3.5
1.0
3.6
14.3
5.1
1.9
9.8
19.5
-5 0 5 10 15 20 25
Manufacturing
Wlse Trade
Transp. & Util.
Information
Financial
Construction
Other Services
Retail Trade
Leisure & Hosp.
State & Local Govt
Federal Govt.
Educ & Health Svcs
Prof. & Bus. Svcs
(000s) Total = 50,500
Source: Bureau of Labor Statistics (Not Seasonally Adjusted), GMU Center for Regional Analysis
(Ranked by Size in 2016)

Job Change by SectorFeb 2017 – Mar 2017
Washington MSA (000s) Total = 5,000
Source: Bureau of Labor Statistics (Not Seasonally Adjusted), GMU Center for Regional Analysis
0.4
0.4
0.8
-0.7
-1.0
-1.0
-0.9
-0.5
3.6
3.6
-0.4
-1.1
1.8
-2 -1 0 1 2 3 4
Manufacturing
Wlse Trade
Transp. & Util.
Information
Financial
Construction
Other Services
Retail Trade
Leisure & Hosp.
State & Local Govt
Federal Govt.
Educ & Health Svcs
Prof. & Bus. Svcs
(Ranked by Size in 2016)

Professional & Business ServicesWashington MSA
620
640
660
680
700
720
740
760
-15
-10
-5
0
5
10
15
20
25
2010 2011 2012 2013 2014 2015 2016 2017
MOTYC
Total Jobs
(000s)
Source: Bureau of Labor Statistics (Not Seasonally Adjusted), GMU Center for Regional Analysis Mar-17 Total: 744.9K
Mar 16-Mar 17
+19.5K

Professional & Business ServicesWashington MSA
Month Over the Year Change
-15
-10
-5
0
5
10
15
20
25
30
Jan-10 Jan-11 Jan-12 Jan-13 Jan-14 Jan-15 Jan-16
Prof., Sci. & Tech. Svcs & Mgt. Admin. & Waste Mgt.
Source: Bureau of Labor Statistics (Not Seasonally Adjusted), GMU Center for Regional Analysis
(000s)

Federal GovernmentWashington MSA
345
350
355
360
365
370
375
380
385
390
-20
-15
-10
-5
0
5
10
15
20
25
30
2010 2011 2012 2013 2014 2015 2016 2017
MOTYC
TotalJobs
(000s)
Source: Bureau of Labor Statistics (Not Seasonally Adjusted), GMU Center for Regional Analysis Mar-17 Total: 367K
(000s)
Mar 16-Mar 17
+1,900

Federal Procurement in the Washington MSA1980-2016 (Fiscal Years)
0
10
20
30
40
50
60
70
80
90
73.8
$ Billions
TOTAL = $1,409.7 Billion 79.976.3
69.1 71.1
Source: US Census, Consolidated Federal Funds Report and USAspending.gov
71.2
82.4

Job Change by SectorMar 2016 – Mar 2017District of Columbia
0.0
-0.3
0.4
-1.4
-0.3
-0.1
-0.7
1.1
-1.3
3.7
3.2
2.8
-0.9
-2 -1 0 1 2 3 4
Manufacturing
Wlse Trade
Transp. & Util.
Construction
Information
Retail Trade
Financial
State & Local Govt
Other Services
Leisure & Hosp.
Educ & Health Svcs
Prof. & Bus. Svcs
Federal Govt.
(000s) Total 6,200
Source: Bureau of Labor Statistics (Not Seasonally Adjusted), GMU Center for Regional Analysis
(Ranked by Size in 2016)

Job Change by SectorFeb 2017 – Mar 2017District of Columbia
0.0
-0.1
0.2
0.1
-0.1
0.1
-0.4
0.1
-0.2
1.3
0.1
-0.8
0.3
-1 -0.5 0 0.5 1 1.5
Manufacturing
Wlse Trade
Transp. & Util.
Construction
Information
Retail Trade
Financial
State & Local Govt
Other Services
Leisure & Hosp.
Educ & Health Svcs
Prof. & Bus. Svcs
Federal Govt.
(000s) Total 600
Source: Bureau of Labor Statistics (Not Seasonally Adjusted), GMU Center for Regional Analysis
(Ranked by Size in 2016)

Job Change by SectorMar 2016 – Mar 2017Suburban Maryland
-0.4
0.3
0.5
0.1
0.6
0.4
0.0
2.5
5.0
1.6
6.7
3.7
5.6
-2 0 2 4 6 8
Information
Transp. & Util.
Wlse Trade
Manufacturing
Other Services
Financial
Construction
Federal Govt.
Leisure & Hosp.
Retail Trade
State & Local Govt
Educ & Health Svcs
Prof. & Bus. Svcs
(000s) Total 26,600
Source: Bureau of Labor Statistics (Not Seasonally Adjusted), GMU Center for Regional Analysis
(Ranked by Size in 2016)

Job Change by SectorFeb 2017 – Mar 2017Suburban Maryland
0.1
0.3
0.1
0.0
0.4
-0.3
0.1
-0.1
1.6
-1.1
1.7
0.0
1.6
-1.5 -1 -0.5 0 0.5 1 1.5 2
Information
Transp. & Util.
Wlse Trade
Manufacturing
Other Services
Financial
Construction
Federal Govt.
Leisure & Hosp.
Retail Trade
State & Local Govt
Educ & Health Svcs
Prof. & Bus. Svcs
(000s) Total: 4,400
Source: Bureau of Labor Statistics (Not Seasonally Adjusted), GMU Center for Regional Analysis
(Ranked by Size in 2016)

Job Change by SectorMar 2016 – Mar 2017
Northern Virginia
0.5
1.2
-2.8
-0.2
2.3
1.7
0.1
0.0
3.7
0.6
1.8
6.0
13.2
-4 -2 0 2 4 6 8 10 12 14
Manufacturing
Wlse Trade
Information
Transp. & Util.
Construction
Financial
Other Services
Federal Govt.
Leisure & Hosp.
Retail Trade
State & Local Govt
Educ & Health Svcs
Prof. & Bus. Svcs
(000s) Total 28,100
Source: Bureau of Labor Statistics (Not Seasonally Adjusted), GMU Center for Regional Analysis
(Ranked by Size in 2016)

Job Change by SectorFeb 2017 – Mar 2017
Northern Virginia
0.3
0.3
-0.2
-0.2
1.6
0.2
-0.2
-0.9
1.8
0.3
0.1
-0.8
-0.6
-1.5 -1 -0.5 0 0.5 1 1.5 2
Manufacturing
Wlse Trade
Information
Transp. & Util.
Construction
Financial
Other Services
Federal Govt.
Leisure & Hosp.
Retail Trade
State & Local Govt
Educ & Health Svcs
Prof. & Bus. Svcs
(000s) Total 1,700
Source: Bureau of Labor Statistics (Not Seasonally Adjusted), GMU Center for Regional Analysis
(Ranked by Size in 2016)

0
2
4
6
8
10
12
5.7 – DC4.5 –U.S.3.8– SMD
3.7 – MSA3.1 – NVA
Unemployment Rates in the WMSABy Sub-State Area
Source: Bureau of Labor Statistics (Region - Not Seasonally Adjusted, US – Seasonally Adjusted)

5
2
1
9
23
31
84
40
72
80
WMSA Payroll Job Change: Private SectorThe Great Recession and Recovery
-5
-7
-10
-12
-10
-8
-49
-34
-23
0
-24
-100 -75 -50 -25 0
Transp. & Util.
Wlse Trade
Manufacturing
Information
Financial
Other Services
Construction
Leisure & Hosp.
Retail Trade
Educ & Health Svcs
Prof. & Bus. Svcs
(000s)
Source: Bureau of Labor Statistics (Not Seasonally Adjusted), GMU Center for Regional Analysis
Total -181 Total 345
Aug 2008-Feb 2010 Feb 2010-Sep 2016

15 Largest Job MarketsRanked by Unemployment Rate
March 2017
3.7
0.0
1.0
2.0
3.0
4.0
5.0
6.0
US: 4.5
Source: Bureau of Labor Statistics (Region - Not Seasonally Adjusted, US – Seasonally Adjusted)
Feb17-Mar
17
WSH
-0.2%

15 Largest Job MarketsJob Change: March 2016 – March 2017
0
20
40
60
80
100
120
140(000s)
Washington +50,500
Source: Bureau of Labor Statistics (Not Seasonally Adjusted), GMU Center for Regional Analysis

15 Largest Job MarketsJob Change: March 2016 – March 2017
0.0%
0.5%
1.0%
1.5%
2.0%
2.5%
3.0%
3.5%
4.0%
4.5%
Washington +1.6%
Source: Bureau of Labor Statistics (Not Seasonally Adjusted), GMU Center for Regional AnalysisSource: Bureau of Labor Statistics (Not Seasonally Adjusted), GMU Center for Regional Analysis

15 Largest Job MarketsJob Change: 2014 – 2015
0.0%
0.5%
1.0%
1.5%
2.0%
2.5%
3.0%
3.5%
4.0%
4.5%(000s)
Washington + 1.9%
Source: Bureau of Labor Statistics (Not Seasonally Adjusted), GMU Center for Regional Analysis

15 Largest Job MarketsJob Change: 2015 – 2016
0.0%
0.5%
1.0%
1.5%
2.0%
2.5%
3.0%
3.5%
4.0%(000s)
Washington + 1.8%
Source: Bureau of Labor Statistics (Not Seasonally Adjusted), GMU Center for Regional Analysis

-4
-2
0
2
4
2007 2008 2009 2010 2011 2012 2013 2014 2015 2016 2017 2018 2019 2020
%
U.S. GDP and Washington Area GRP 2007 – 2016 – 2020
(Annual % Change)
Washington
U.S.
%
Source: Bureau of Economic Analysis , GMU Center for Regional Analysis, Forecast: January, 2017

-2
-1
0
1
2
3
4
5
6
2007 2008 2009 2010 2011 2012 2013 2014 2015 2016 2017 2018 2019 2020
%
Source: GMU Center for Regional Analysis, Forecast: April 2016
Economic Outlook (GRP), 2007-2020Washington Area and Sub-State Areas
(Annual % Change)
DC
SM
MSA
NV
%

Employment Change in the Washington MSA(Thousands of Jobs)
Average Annual Change 1990-2016 = 37,300Source: BLS, GMU Center for Regional Analysis (January 2016)NOTE: The regional totals do not include Jefferson, WV.
28.1
18.6
57.7 55.651.0
36.0 38.1 40.2
0
10
20
30
40
50
60
70
2013 2014 2015 2016 2017 2018 2019 2020

Employment Change in the WMSAby Sub-State Area (000s)
2013 2014 2015 2016 2017 2018 2019 2020
D.C. 13.4 5.2 15.9 13.0 9.7 10.6 8.9 8.2
Sub. MD 7.2 10.2 12.5 14.4 17.7 14.1 12.0 11.0
No. VA 9.2 0.8 29.8 31.0 23.6 15.9 13.7 12.6
REGION 28.1 18.6 57.7 55.6 51.0 40.6 34.6 31.8
Average Annual Change 1990-2016 = 37,300Source: BLS, IHS Economics, GMU Center for Regional Analysis (December 2016)NOTE: The regional totals do not include Jefferson, WV.

Long commutes diminish quality of lifeProportion of workers with travel time to work of 60 or more minutes
65
5.5%6.8%6.8%
8.7%9.0%
10.0%11.4%
11.8%11.9%
12.5%13.3%
14.4%14.8%
17.0%17.3%
21.4%
0% 5% 10% 15% 20% 25%
MinneapolisPhoenixDetroit
DallasUnited States
MiamiPhiladelphia
SeattleHouston
Los AngelesAtlanta
ChicagoBoston
SF-OaklandWashington
New York
Source: US Census Bureau, 2015 American Community Survey, Table S0802

Metrorail ridership is in decline
-15.0%
-10.0%
-5.0%
0.0%
5.0%
10.0%
15.0%
2010-11 2011-12 2012-13 2013-14 2014-15 2015-16*
Annu
al ch
ange
in M
etro
rail
Aver
age
Wee
kday
Pas
seng
er B
oard
ings DC
Maryland
All Metro
Alexandria
Arlington
Fairfax
Source: Washington Metropolitan Area Transit Authority (WMATA)

67


Housing Market Trends

0
5
10
15
20
25
30
35
40
-40
-30
-20
-10
0
10
20
30
Th
ou
san
ds
% Chg Inv Inventory
Inventories of Existing HomesMonth-Over-Year 2000 – 2017, MSA
Source: Metropolitan Regional Information Systems (MRIS), GMU Center for Regional Analysis. Total monthly inventory includes listings active at the end of the month plus sales during the month.
APR
-11%

(60.0)
(40.0)
(20.0)
-
20.0
40.0
60.0
80.0
100.0
120.0
140.0
Percent Change in Inventories of Existing Homes
Month-Over-Year 2000 – 2017, MSA
Source: Metropolitan Regional Information Systems (MRIS), GMU Center for Regional Analysis. Total monthly inventory includes listings active at the end of the month plus sales during the month.
MAR
-11%

0
2,000
4,000
6,000
8,000
10,000
12,000
14,000
16,000
199
9
20
00
20
01
20
02
20
03
20
04
20
05
20
06
20
07
20
08
20
09
20
10
20
11
20
12
20
13
20
14
20
15
20
16
20
17
Existing Home SalesWashington MSA
Through April 2017
12-Month Moving Average
Source: Metropolitan Regional Information Systems (MRIS), GMU Center for Regional Analysis
7,459 Apr 2017

-2,000
-1,500
-1,000
-500
0
500
1,000
1,500
2,000
Existing Home SalesWashington MSA
Month-Over-Year Change
Source: Metropolitan Regional Information Systems (MRIS), GMU Center for Regional Analysis
+ 1,007Apr 2017

0
500
1,000
1,500
2,000
2,500
3,000
Washington MSABuilding Permits
2011 – 2017, 3-Month Moving Avg
Source: Census Bureau, GMU Center for Regional Analysis
March 1,690

-2,500
-2,000
-1,500
-1,000
-500
0
500
1,000
1,500
2,000
2,500
Building Permit Change (MOTYC)Washington MSA
Source: Census Bureau, GMU Center for Regional Analysis
Mar -629
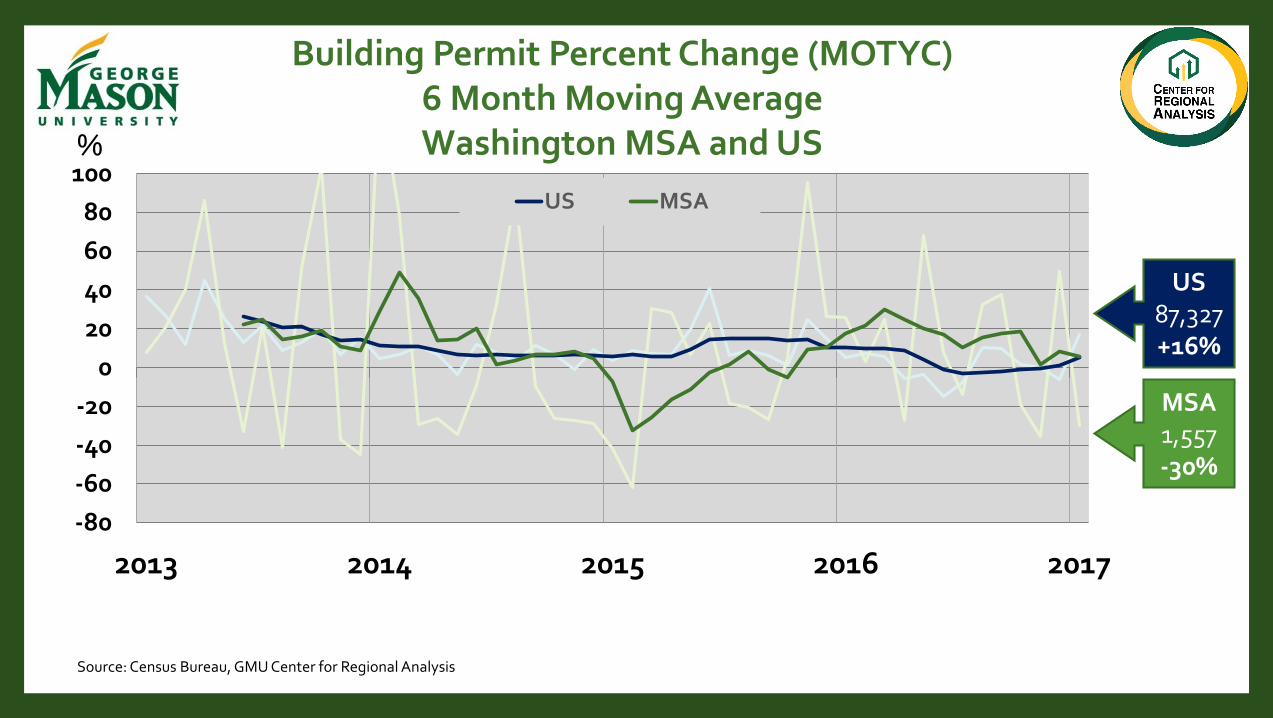
Building Permit Percent Change (MOTYC)6 Month Moving AverageWashington MSA and US
Source: Census Bureau, GMU Center for Regional Analysis
MSA1,557-30%
-80
-60
-40
-20
0
20
40
60
80
100
2013 2014 2015 2016 2017
US MSA
US 87,327+16%
%

U.S. Construction

0
0.5
1
1.5
2
2.5
3
3.5
4
4.5
5
2012 2013 2014 2015 2016 2017
Building PermitsWashington MSA as a Percent of US
w/ 12 Month moving average%

0
500
1,000
1,500
2,000
2,500
3,000
3,500
4,000
0
5,000
10,000
15,000
20,000
25,000
30,000
35,000
40,000Inventory Permits
Inventory and PermitsWashington MSA
Source: Metropolitan Regional Information Systems (MRIS), GMU Center for Regional Analysis
(000s)
100
150
200
250
300
350
400
450
500
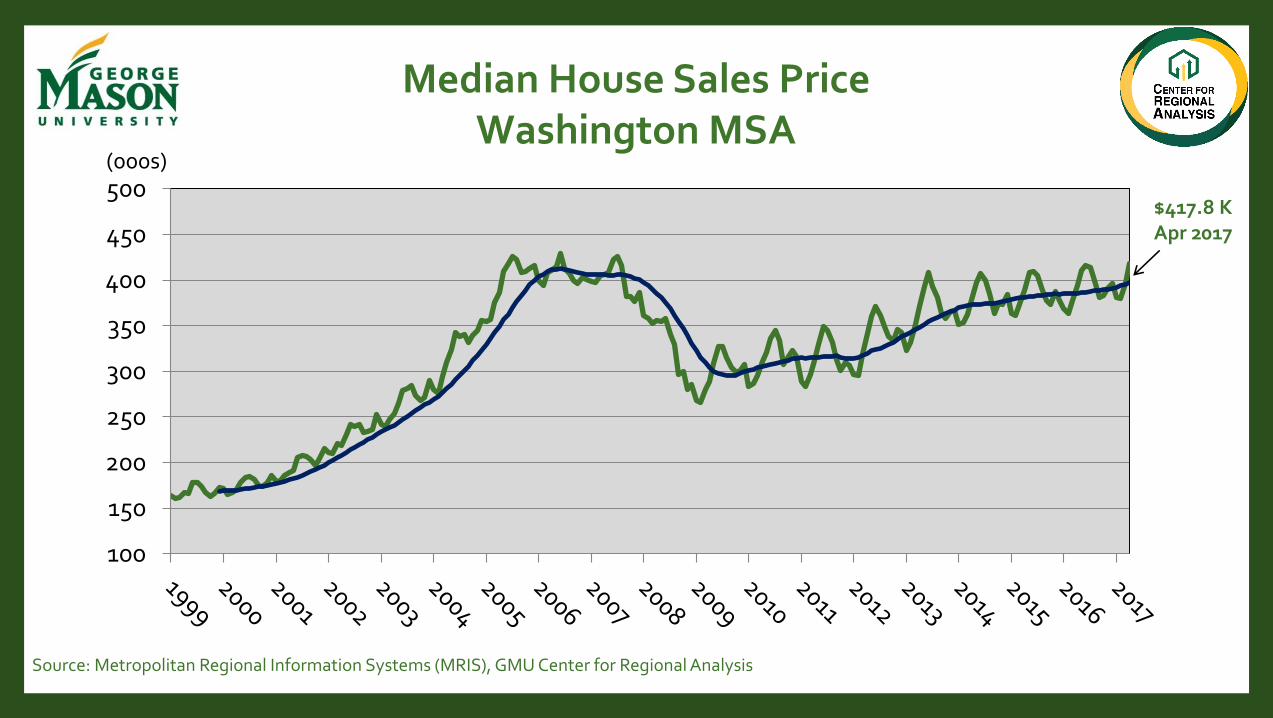
Median House Sales PriceWashington MSA
$417.8 KApr 2017
Source: Metropolitan Regional Information Systems (MRIS), GMU Center for Regional Analysis
(000s)(000s)

Median House Sales Price
100
200
300
400
500
600
700
12 per. Mov. Avg. (Washington MSA) 12 per. Mov. Avg. (Arlington)
12 per. Mov. Avg. (Alexandria City)(000s)
Source: Metropolitan Regional Information Systems (MRIS), GMU Center for Regional Analysis

Median Sales Price Percent Change (MOTYC)Washington MSA
-4
-2
0
2
4
6
8
10
12
14
2012 2013 2014 2015 2016 2017
Source: Metropolitan Regional Information Systems (MRIS), GMU Center for Regional Analysis

Average Sales Price Percent Change (MOTYC)Washington MSA
32
66
9
34 4
7
8
10
14
6
11
98 8
9
8
7
89
45
8
9
3
5
2 21
2
-1
5
1
45
1
2
0
0
-1
10
3
0
4
-3
-2
0
0
1
-1
2
0
2
0
1
-1
3
6
7
6
4
-6
-4
-2
0
2
4
6
8
10
12
14
16
2012 2013 2014 2015 2016 2017
Source: Metropolitan Regional Information Systems (MRIS), GMU Center for Regional Analysis
%
Apr = $467K

Average Sales Price Percent Change (MOTYC)District of Columbia
10
8 8
0
14
-3-4
4
13
7
1314
1
8
4
6
2
15
11
5
17
45
-5
1011
-1
1211
6
4
-1
-6
12
0
10
7
5 5
1 1
-2
3
8
9
6
10
-1
-3-2
5
1 1
4
-2
11
2
-1
-3
4
11
14
9
-1
-10
-5
0
5
10
15
20
2012 2013 2014 2015 2016 2017
Source: Metropolitan Regional Information Systems (MRIS), GMU Center for Regional Analysis
%
Apr = $628K

Average Sales Price Percent Change (MOTYC)Suburban Maryland
-4
-2-1
10
11
54
0
911
6
14
4
1111
8
1011
1212
6
910
5
12
13
5 4
1
0
-2
2
4 4
-3
21
-3
1 1
-1-1
3
-1
3
-4
5
-1
0
5
-2
2
0
4
0
2
-4
7
1
3
6
8 8
6
-10
-5
0
5
10
15
20
2012 2013 2014 2015 2016 2017
Source: Metropolitan Regional Information Systems (MRIS), GMU Center for Regional Analysis
%
Apr = $400K

Average Sales Price Percent Change (MOTYC)Northern Virginia
4
2
9
5
7
3
5 5
3
6
10
13
9
10
9 9
8 7
6
4
8
10
2
6
45
1
3
12
2
4
-1
2
45
8
4 4
0
2
0
0-1
2
32
-4
-2
0 0
2
-1
10 0 1
0-1
4
3
43
4
-6
-4
-2
0
2
4
6
8
10
12
14
16
2012 2013 2014 2015 2016 2017
Source: Metropolitan Regional Information Systems (MRIS), GMU Center for Regional Analysis
%
Apr = $486K

Total Listings Per SaleSep Each Year
-
5
10
15
20
25
LDN
PG
FFXARL
DC
MONT
PW
Source: Metropolitan Regional Information Systems (MRIS), GMU Center for Regional Analysis

Total Active Listings Per Sale February Each Year – Metro Area
0
2
4
6
8
10
12
14
Source: Metropolitan Regional Information Systems (MRIS), GMU Center for Regional Analysis

Where are we?
• We are growing:
• Some diversification• Some catch-up• Recent job growth across all
wage levels• Growth will continue in
2017, but at a moderating pace
• Advantages• Government Center• International Institutions• Connectivity to the World• Concentration of Leaders• Access to capital• High Quality-of-Life• Diverse Population• Higher Education• Educated Work Force• Advanced Occupational
Specializations
• Challenges• Drain the swamp/Sequester
• Further market shifts needed
• Cost of living/doing business
• Mobility
• Access to capital
• Regional branding / cooperation
• Globally competitive?
• Understanding changing nature of jobs
• Productivity

Thank You
Questions
cra.gmu.edu


