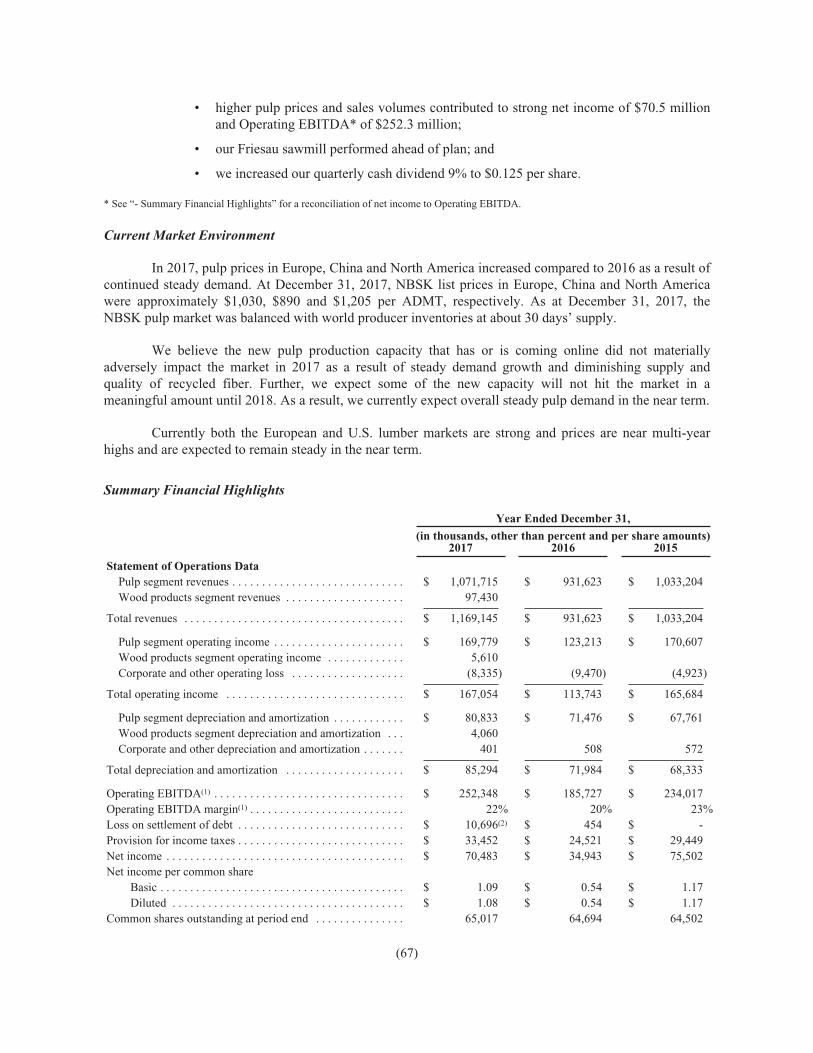
UNITED STATES SECURITIES AND EXCHANGE COMMISSION Washington, D.C. 20549 FORM 10-K È ANNUAL REPORT PURSUANT TO SECTION 13 OR 15(d) OF THE SECURITIES EXCHANGE ACT OF 1934 For the fiscal year ended December 31, 2017 OR ‘ TRANSITION REPORT PURSUANT TO SECTION 13 OR 15(d) OF THE SECURITIES EXCHANGE ACT OF 1934 For the transition period from to Commission File No.: 000-51826 MERCER INTERNATIONAL INC. (Exact name of Registrant as specified in its charter) Washington 47-0956945 (State or other jurisdiction of incorporation or organization) (IRS Employer Identification No.) Suite 1120, 700 West Pender Street, Vancouver, British Columbia, Canada V6C 1G8 (Address of Principal Executive Office) (Zip Code) Registrant’s telephone number including area code: (604) 684-1099 Securities registered pursuant to Section 12(b) of the Act: Title of each class Name of each exchange on which registered Common Stock, par value $1.00 per share NASDAQ Global Select Market Securities registered pursuant to Section 12(g) of the Act: None Indicate by check mark if the Registrant is a well-known seasoned issuer, as defined in Rule 405 of the Securities Act. Yes È No ‘ Indicate by check mark if the Registrant is not required to file reports pursuant to Section 13 or Section 15(d) of the Act. ‘ Yes È No Indicate by check mark whether the Registrant (1) has filed all reports required to be filed by Section 13 or 15(d) of the Securities Exchange Act of 1934 during the preceding 12 months (or for such shorter period that the Registrant was required to file such reports), and (2) has been subject to such filing requirements for the past 90 days. Yes È No ‘ Indicate by check mark whether the Registrant has submitted electronically and posted on its corporate Web site, if any, every Interactive Data File required to be submitted and posted pursuant to Rule 405 of Regulation S-T (§ 232.405 of this chapter) during the preceding 12 months (or for such shorter period that the Registrant was required to submit and post such files). Yes È No ‘ Indicate by check mark if disclosure of delinquent filers pursuant to Item 405 of Regulation S-K is not contained herein, and will not be contained, to the best of the Registrant’s knowledge, in definitive proxy or information statements incorporated by reference in Part III of this Form 10-K or any amendment to this Form 10-K. È Indicate by check mark whether the Registrant is a large accelerated filer, an accelerated filer, a non-accelerated filer, a smaller reporting company or emerging growth company. See the definitions of “large accelerated filer,” “accelerated filer”, “smaller reporting company” and “emerging growth company” in Rule 12b-2 of the Exchange Act. Large accelerated filer È Accelerated filer ‘ Non-accelerated filer ‘ (Do not check if a smaller reporting company) Smaller reporting company ‘ Emerging growth company ‘ If an emerging growth company, indicate by check mark if the registrant has elected not to use the extended transition period for complying with any new or revised financial accounting standards provided pursuant to Section 13(a) of the Exchange Act. ‘ Indicate by check mark whether the Registrant is a shell company (as defined in Rule 12b-2 of the Act). ‘ Yes È No The aggregate market value of the Registrant’s voting and non-voting common equity held by non-affiliates of the Registrant as of June 30, 2017, the last business day of the Registrant’s most recently completed second fiscal quarter, based on the closing price of the voting stock on the NASDAQ Global Select Market on such date, was approximately $714.2 million. As of February 14, 2018, the Registrant had 65,017,288 shares of common stock, $1.00 par value per share, outstanding. DOCUMENTS INCORPORATED BY REFERENCE Certain information that will be contained in the definitive proxy statement for the Registrant’s annual meeting to be held in 2018 is incorporated by reference into Part III of this Form 10-K.
Transcript
UNITED STATESSECURITIES AND EXCHANGE COMMISSION
Washington, D.C. 20549
FORM 10-KÈ ANNUAL REPORT PURSUANT TO SECTION 13 OR 15(d) OF THE
SECURITIES EXCHANGE ACT OF 1934For the fiscal year ended December 31, 2017
OR‘ TRANSITION REPORT PURSUANT TO SECTION 13 OR 15(d) OF THE
SECURITIES EXCHANGE ACT OF 1934For the transition period from to
Commission File No.: 000-51826
MERCER INTERNATIONAL INC.(Exact name of Registrant as specified in its charter)
Washington 47-0956945(State or other jurisdiction
of incorporation or organization)(IRS Employer Identification No.)
Suite 1120, 700 West Pender Street,Vancouver, British Columbia, Canada V6C 1G8
(Address of Principal Executive Office) (Zip Code)
Registrant’s telephone number including area code: (604) 684-1099Securities registered pursuant to Section 12(b) of the Act:
Title of each class Name of each exchange on which registeredCommon Stock, par value $1.00 per share NASDAQ Global Select Market
Securities registered pursuant to Section 12(g) of the Act: NoneIndicate by check mark if the Registrant is a well-known seasoned issuer, as defined in Rule 405 of the Securities Act. Yes È No ‘
Indicate by check mark if the Registrant is not required to file reports pursuant to Section 13 or Section 15(d) of the Act. ‘ Yes È NoIndicate by check mark whether the Registrant (1) has filed all reports required to be filed by Section 13 or 15(d) of the Securities Exchange Act
of 1934 during the preceding 12 months (or for such shorter period that the Registrant was required to file such reports), and (2) has been subject to suchfiling requirements for the past 90 days. Yes È No ‘
Indicate by check mark whether the Registrant has submitted electronically and posted on its corporate Web site, if any, every Interactive Data Filerequired to be submitted and posted pursuant to Rule 405 of Regulation S-T (§ 232.405 of this chapter) during the preceding 12 months (or for such shorterperiod that the Registrant was required to submit and post such files). Yes È No ‘
Indicate by check mark if disclosure of delinquent filers pursuant to Item 405 of Regulation S-K is not contained herein, and will not becontained, to the best of the Registrant’s knowledge, in definitive proxy or information statements incorporated by reference in Part III of this Form 10-K orany amendment to this Form 10-K. È
Indicate by check mark whether the Registrant is a large accelerated filer, an accelerated filer, a non-accelerated filer, a smaller reportingcompany or emerging growth company. See the definitions of “large accelerated filer,” “accelerated filer”, “smaller reporting company” and “emerginggrowth company” in Rule 12b-2 of the Exchange Act.
Large accelerated filer È Accelerated filer ‘
Non-accelerated filer ‘ (Do not check if a smaller reporting company) Smaller reporting company ‘
Emerging growth company ‘
If an emerging growth company, indicate by check mark if the registrant has elected not to use the extended transition period for complying withany new or revised financial accounting standards provided pursuant to Section 13(a) of the Exchange Act. ‘
Indicate by check mark whether the Registrant is a shell company (as defined in Rule 12b-2 of the Act). ‘ Yes È NoThe aggregate market value of the Registrant’s voting and non-voting common equity held by non-affiliates of the Registrant as of June 30, 2017,
the last business day of the Registrant’s most recently completed second fiscal quarter, based on the closing price of the voting stock on the NASDAQGlobal Select Market on such date, was approximately $714.2 million.
As of February 14, 2018, the Registrant had 65,017,288 shares of common stock, $1.00 par value per share, outstanding.
DOCUMENTS INCORPORATED BY REFERENCECertain information that will be contained in the definitive proxy statement for the Registrant’s annual meeting to be held in 2018 is incorporated
This annual report on Form 10-K includes “forward-looking” statements within the meaning of thePrivate Securities Litigation Reform Act of 1995. Forward-looking statements can be identified by the factthat they do not relate strictly to historical or current facts. They often include words such as “believes”,“expects”, “anticipates”, “estimates”, “intends”, “plans”, “seeks” or words of similar meaning, or future orconditional verbs, such as “will”, “should”, “could”, “may”, “aims”, “intends” or “projects”. A forward-looking statement is neither a prediction nor a guarantee of future events or circumstances, and those futureevents or circumstances may not occur. You should not place undue reliance on forward-lookingstatements, which speak only as of the date of this annual report on Form 10-K. These forward-lookingstatements are all based on currently available operating, financial and competitive information and aresubject to various risks and uncertainties. Our actual future results and trends may differ materiallydepending on a variety of factors, including, but not limited to, the risks and uncertainties discussed underItem 1. “Business”, Item 1A. “Risk Factors” and Item 7. “Management’s Discussion and Analysis ofFinancial Condition and Results of Operations”. Given these risks and uncertainties, you should not rely onforward-looking statements as a prediction of actual results. Any or all of the forward-looking statementscontained in this annual report on Form 10-K and any other public statement made by us, including by ourmanagement, may turn out to be incorrect. We are including this cautionary note to make applicable andtake advantage of the safe harbor provisions of the Private Securities Litigation Reform Act of 1995 forforward-looking statements. We expressly disclaim any obligation to update or revise any forward-lookingstatements, whether as a result of new information, future events or otherwise.
INDUSTRY AND MARKET DATA
In this annual report on Form 10-K, we rely on and refer to information and statistics regarding ourmarket share and the markets in which we compete. We have obtained some of this market shareinformation and industry data from internal surveys, market research, publicly available information andindustry publications. Such reports generally state that the information contained therein has been obtainedfrom sources believed to be reliable, but the accuracy or completeness of such information is notguaranteed. Although we believe this information is reliable, we have not independently verified, nor canwe guarantee, the accuracy or completeness of that information.
Statements in this annual report on Form 10-K concerning the production capacity of our mills aremanagement estimates based primarily on historically achieved levels of production and assumptionsregarding maintenance downtime. Statements concerning electrical generating capacity at our mills are alsomanagement estimates based primarily on our expected production (which largely determines the amount ofelectricity we can generate) and assumptions regarding maintenance downtime, in each case withinmanufacturers’ specifications of capacity.
(1)
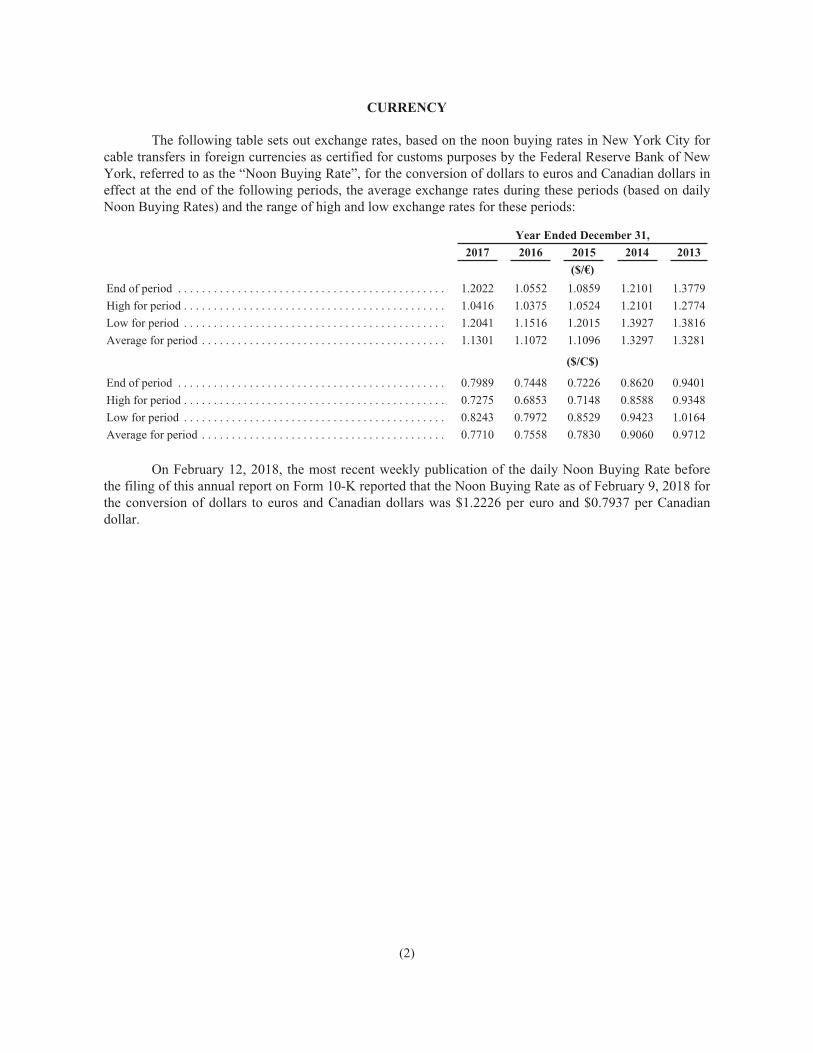
CURRENCY
The following table sets out exchange rates, based on the noon buying rates in New York City forcable transfers in foreign currencies as certified for customs purposes by the Federal Reserve Bank of NewYork, referred to as the “Noon Buying Rate”, for the conversion of dollars to euros and Canadian dollars ineffect at the end of the following periods, the average exchange rates during these periods (based on dailyNoon Buying Rates) and the range of high and low exchange rates for these periods:
On February 12, 2018, the most recent weekly publication of the daily Noon Buying Rate beforethe filing of this annual report on Form 10-K reported that the Noon Buying Rate as of February 9, 2018 forthe conversion of dollars to euros and Canadian dollars was $1.2226 per euro and $0.7937 per Canadiandollar.
(2)
PART I
ITEM 1. BUSINESS
In this document, please note the following:
• references to “we”, “our”, “us”, the “Company” or “Mercer” mean Mercer InternationalInc. and its subsidiaries, unless the context clearly suggests otherwise, and references to“Mercer Inc.” mean Mercer International Inc. excluding its subsidiaries;
• all references to “$” or “dollars” shall mean U.S. dollars, which is our reporting currency,unless otherwise stated; “€” refers to euros; and “C$” refers to Canadian dollars;
• references to “NBSK” mean northern bleached softwood kraft;
• references to “ADMTs” mean air-dried metric tonnes;
• references to “MW” mean megawatts and “MWh” mean megawatt hours;
• references to “Mfbm” mean thousand board feet of lumber;
• references to “MMfbm” mean million board feet of lumber;
• our lumber metrics are converted from cubic meters to Mfbm using a conversion ratio of1.6 cubic metres of lumber equaling one Mfbm, which is the ratio commonly used in theindustry; and
• references to “net income (loss)” mean net income (loss) attributable to commonshareholders.
Due to rounding, numbers presented throughout this report may not add up precisely to totals weprovide and percentages may not precisely reflect the absolute figures.
Mercer
General
Mercer Inc. is a corporation organized under the laws of the State of Washington. Its common stockis quoted and listed for trading on the NASDAQ Global Select Market (MERC) and the Toronto StockExchange (MERC.U).
We are one of the world’s largest producers of “market” NBSK pulp, which is pulp that is sold onthe open market. Our size provides us increased presence, better industry information in our markets andclose customer relationships with many large pulp consumers. We operate two modern and highly efficientmills in Eastern Germany and one mill in Western Canada and have our headquarters in Vancouver,Canada. We are the sole NBSK producer, and the only significant market pulp producer in Germany, whichis the largest pulp import market in Europe. We are able to supply the growing pulp demand in China boththrough our Canadian mill’s ready access to the Port of Vancouver and through our Stendal mill’s existinglogistics arrangements. In addition, as a result of the significant investments we have made in co-generationequipment, all of our mills generate and sell a significant amount of surplus “green” energy to regionalutilities. We also produce and sell “tall oil”, a by-product of our production process, which is used as both achemical additive and as a green energy source.
On April 12, 2017, through our wholly owned subsidiary, Mercer Timber Products GmbH, referredto as “MTP”, we acquired substantially all of the assets of one of Germany’s largest sawmills and abio-mass power plant, referred to as the “Friesau Facility”.
(3)
Since acquiring the Friesau Facility, we have two reportable operating segments, being Pulp andWood Products.
We have consolidated annual production capacity of approximately 1.5 million ADMTs of NBSKpulp, 550 million board feet of lumber and 318 MW of electricity. Key operating details for each of ourmills are as follows:
• Rosenthal mill. Our Rosenthal mill is a modern, efficient ISO 9001, 14001 and 50001certified NBSK pulp mill that has an annual production capacity of approximately 360,000ADMTs and 57 MW of electrical generation. The Rosenthal mill generated and exported166,093 MWh of electricity in 2017, resulting in approximately $17.1 million in revenues.The Rosenthal mill is located in the town of Blankenstein, Germany, approximately 300kilometers south of Berlin.
• Stendal mill. Our Stendal mill is a state-of-the-art, single line, ISO 9001, 14001 and 50001certified NBSK pulp mill that has an annual production capacity of approximately 660,000ADMTs and 148 MW of electrical generation. The Stendal mill generated and exported508,733 MWh of electricity in 2017, resulting in approximately $48.3 million in revenues.The Stendal mill is located near the town of Stendal, Germany, approximately 130kilometers west of Berlin.
• Celgar mill. Our Celgar mill is a modern, efficient ISO 9001 and 14001 certified NBSKpulp mill with an annual production capacity of approximately 520,000 ADMTs and 100MW of electrical generation. The Celgar mill generated and exported 147,294 MWh ofelectricity in 2017, resulting in approximately $12.4 million in revenues. The Celgar mill islocated near the city of Castlegar, British Columbia, Canada, approximately 600kilometers east of Vancouver.
• Friesau Facility. Our Friesau Facility is one of Germany’s largest sawmills with an annualproduction capacity of approximately 550 million board feet of lumber and 13 MW ofelectrical generation from a modern bio-mass fueled cogeneration power plant built in2009. From the date of its acquisition in April 2017, the Friesau Facility generated andexported 73,698 MWh of electricity during the period ended December 31, 2017, resultingin approximately $8.9 million in revenues. The Friesau Facility is located approximately16 kilometers west of our Rosenthal mill and has historically been one of the Rosenthalmill’s largest fiber suppliers.
We currently employ approximately 1,840 people.
Pulp Segment
Our pulp mills are some of the newest and most modern NBSK pulp mills in Europe and NorthAmerica. We believe the relative age, production capacity and electrical generation capacity of our millsprovide us with certain manufacturing cost and other advantages over many of our competitors. We believeour competitors’ older mills do not have the equipment or capacity to produce or sell surplus power orchemicals in a meaningful amount. In addition, since our mills are relatively new, they benefit from lowermaintenance capital requirements and higher efficiency relative to many of our competitors’ mills.
(4)
The following table sets out our pulp production and pulp revenues for the periods indicated:
Our modern pulp mills generate electricity, which is surplus to their operating requirements,providing our mills with a stable revenue source unrelated to pulp prices. Additionally, our German pulpmills generate tall oil from black liquor, which is sold to third parties for use in numerous applicationsincluding bio-fuels. Since our energy and chemical production are by-products of our pulp productionprocess, there are minimal incremental costs and our surplus energy and chemical sales are highlyprofitable. All of our mills generate and sell surplus energy to regional utilities. Our German mills benefitfrom special tariffs under Germany’s Renewable Energy Sources Act, referred to as the “Renewable EnergyAct”, which provides for premium pricing on green energy. Our Celgar mill is party to a fixed electricitypurchase agreement with the regional public utility provider for the sale of surplus power through 2020.
The following table sets out the amount of surplus energy we produced and sold and revenues fromthe sale of such surplus energy and chemicals in our pulp segment for the periods indicated:
Our strategic pulp mill locations position us well to serve customers in Europe, Asia and NorthAmerica. We primarily work directly with customers to capitalize on our geographic diversity, coordinatesales and enhance customer relationships. We believe our ability to deliver high-quality pulp on a timelybasis and our customer service make us a preferred supplier for many customers.
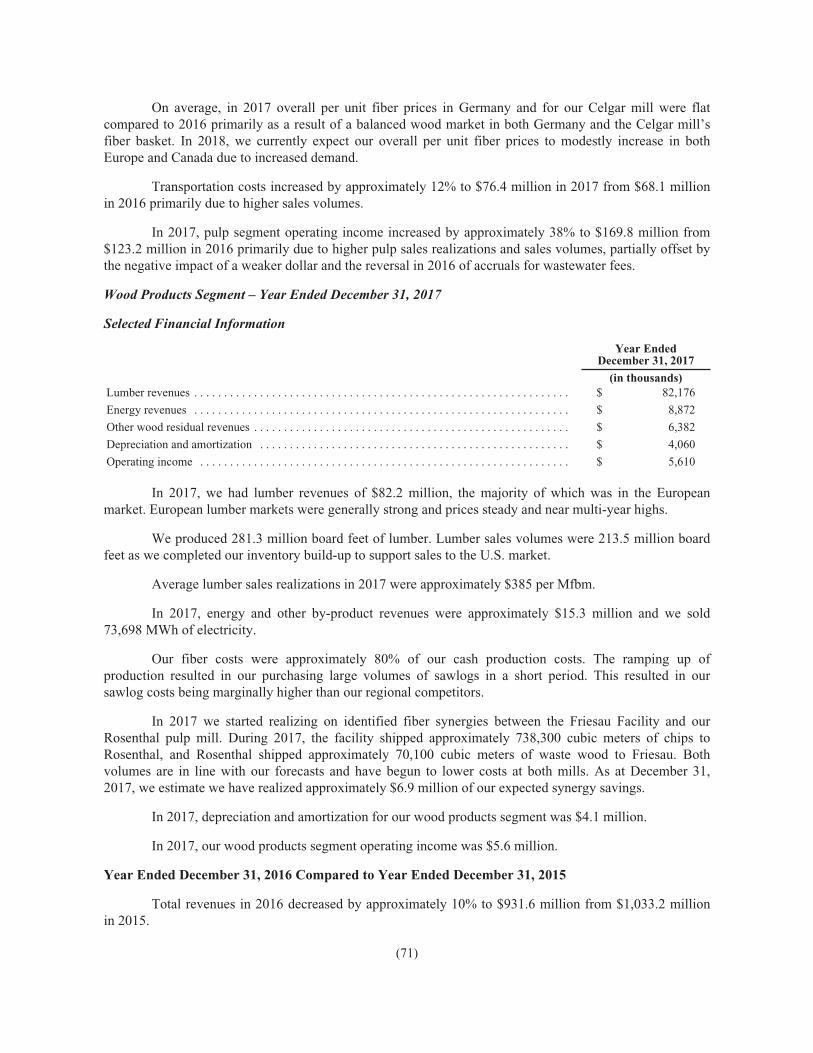
Wood Products Segment
We entered into the wood products business with the acquisition of the Friesau Facility. As a result,we manufacture, sell and distribute lumber, electricity and other wood residuals. The Friesau Facility canproduce lumber for European, U.S. and other lumber export markets.
During the two years prior to our acquisition of the Friesau Facility, it was being operated on arestricted basis and well below its production capacity. Since our acquisition, we have been ramping up themill’s lumber production and capitalizing on synergies. In the Friesau Facility’s fiber region, major sawlogcontracts are generally awarded on a yearly basis. As a result, we initially expected our ramp up tomaterially increase at the start of 2018 when new contracts are awarded.
However, due to the successful procurement of wood, the mill’s ramp up proceeded faster than weinitially budgeted and began generating positive operating income in the second quarter of 2017. The rampup of production steadily improved our operating efficiency and costs. In the third quarter of 2017, we
(5)
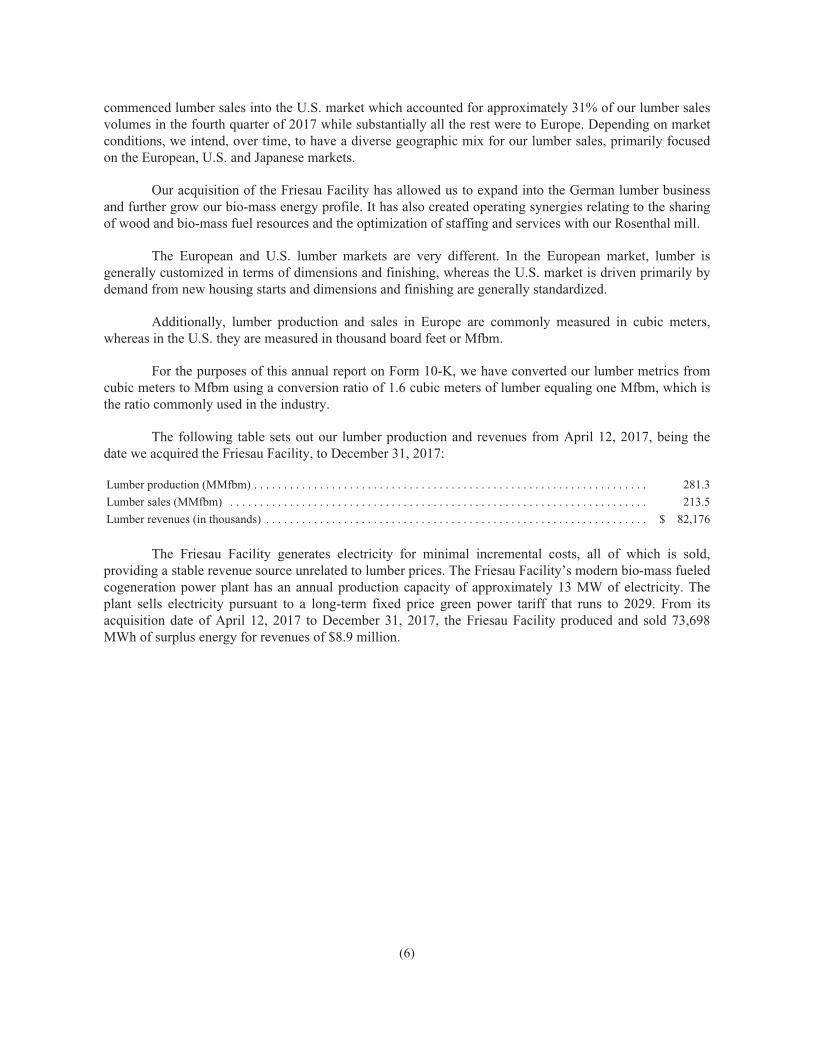
commenced lumber sales into the U.S. market which accounted for approximately 31% of our lumber salesvolumes in the fourth quarter of 2017 while substantially all the rest were to Europe. Depending on marketconditions, we intend, over time, to have a diverse geographic mix for our lumber sales, primarily focusedon the European, U.S. and Japanese markets.
Our acquisition of the Friesau Facility has allowed us to expand into the German lumber businessand further grow our bio-mass energy profile. It has also created operating synergies relating to the sharingof wood and bio-mass fuel resources and the optimization of staffing and services with our Rosenthal mill.
The European and U.S. lumber markets are very different. In the European market, lumber isgenerally customized in terms of dimensions and finishing, whereas the U.S. market is driven primarily bydemand from new housing starts and dimensions and finishing are generally standardized.
Additionally, lumber production and sales in Europe are commonly measured in cubic meters,whereas in the U.S. they are measured in thousand board feet or Mfbm.
For the purposes of this annual report on Form 10-K, we have converted our lumber metrics fromcubic meters to Mfbm using a conversion ratio of 1.6 cubic meters of lumber equaling one Mfbm, which isthe ratio commonly used in the industry.
The following table sets out our lumber production and revenues from April 12, 2017, being thedate we acquired the Friesau Facility, to December 31, 2017:
The Friesau Facility generates electricity for minimal incremental costs, all of which is sold,providing a stable revenue source unrelated to lumber prices. The Friesau Facility’s modern bio-mass fueledcogeneration power plant has an annual production capacity of approximately 13 MW of electricity. Theplant sells electricity pursuant to a long-term fixed price green power tariff that runs to 2029. From itsacquisition date of April 12, 2017 to December 31, 2017, the Friesau Facility produced and sold 73,698MWh of surplus energy for revenues of $8.9 million.
(6)
Corporate Structure, History and Development of Business
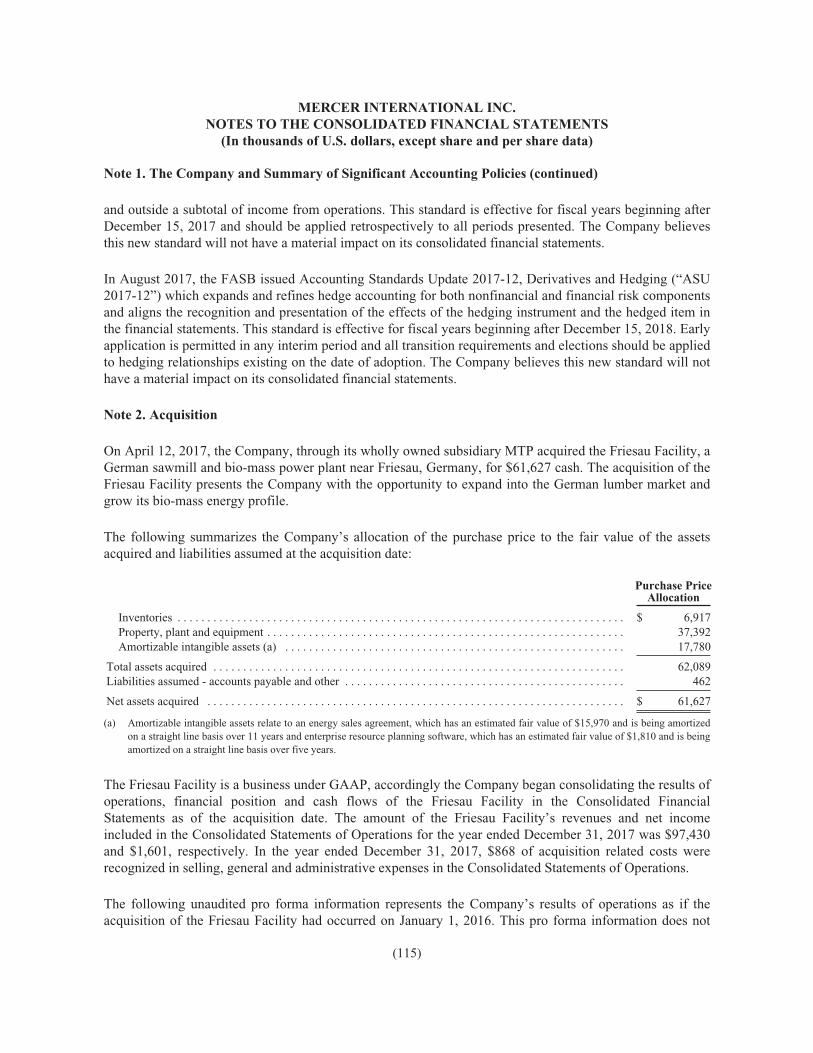
The following simplified chart sets out our principal operating subsidiaries, their jurisdictions oforganization, their principal activities and their annual pulp and lumber production and electrical generationcapacity:
MERCER INTERNATIONAL INC.Washington, U.S.A.
Zellstoff CelgarLimited Partnership
Pulp production and salesBritish Columbia, Canada
520,000 ADMTs100 MW
Zellstoff-und PapierfabrikRosenthal GmbH
Pulp production and salesGermany
360,000 ADMTs57 MW
Zellstoff StendalGmbH
Pulp production and salesGermany
660,000 ADMTs148 MW
100% 100%100%
Mercer Timber ProductsGmbH
Lumber production and salesGermany
550 MMfbm13 MW
100%
We acquired our Rosenthal mill in 1994. In 1999, we completed a major capital project to convertit to the production of kraft pulp, increase production and improve efficiencies at a cost of approximately$385.7 million, of which approximately $100.8 million was financed through government grants.Subsequent capital investments and efficiency improvements have reduced emissions and energy costs,increased the mill’s annual production capacity and enabled the production of tall oil.
In September 2004, we completed construction of the Stendal mill at a cost of approximately$1.1 billion, which was financed through a combination of government grants of approximately$332.0 million, low-cost, long-term project debt, which was largely severally guaranteed by governments inGermany, and equity. Subsequent capital investments and efficiency improvements have increased themill’s annual production capacity and its generation of green energy. We initially had a 63.6% interest inStendal which increased over time through acquisitions and/or further investments until September 2014,when we acquired all of the economic interest in Stendal.
In February 2005, we acquired the Celgar mill for $210.0 million plus defined working capital.Since its acquisition, we have effected several capital projects and other initiatives at the Celgar mill toincrease its annual production capacity and its generation of green energy.
In April 2017, we acquired the Friesau Facility for $61.6 million in cash.
Corporate Strategy
Our corporate strategy is to expand our asset and earnings base through organic growth andacquisitions, primarily in Europe and North America. We pursue organic growth through activemanagement and targeted capital expenditures to generate a high return by improving efficiency, reducingcosts and increasing production of pulp, lumber, energy and by-products such as chemicals. We are alsoleveraging our fiber and process expertise to develop innovative new products based on other derivatives ofthe kraft pulping process. We seek to acquire interests in companies and assets primarily in the forest
(7)
products business and related wood extractive businesses where we can leverage our experience andexpertise in adding value through a focused management approach. Key elements of our strategy include:
• Focus on Premium Grade Market NBSK Pulp. We produce market NBSK pulp becauseit is a premium grade kraft pulp and generally obtains the highest price relative to otherkraft pulps. Although demand is cyclical, between 2008 and 2017 overall worldwidedemand for bleached softwood kraft market pulp grew at an average of approximately 2%per annum. We focus on customers that produce tissue, specialty papers and high-qualityprinting and writing paper grades. We believe the growth in demand from tissue andspecialty paper customers, which utilize a significant proportion of NBSK pulp, has morethan offset the secular decline in demand from printing and writing paper customers. Thisallows us to benefit from our long-term relationships with tissue and specialty papermanufacturers in Europe and participate in higher growth markets in emerging countriessuch as China where there has been strong growth in tissue demand.
• Increasing Stable Revenues from Renewable Energy and Chemical Sales andLeveraging our Fiber and Process Expertise to Expand Growth. We focus on enhancingour generation and sales of surplus renewable energy and chemicals and, because there areminimal associated incremental costs, such sales are highly profitable. The acquisition ofthe Friesau Facility has allowed us to expand into the German lumber market and grow ourbio-mass energy profile. Sales of surplus renewable energy and chemicals provide us witha stable income source unrelated to cyclical changes in pulp and lumber prices.Additionally, we seek to capitalize on our fiber and process expertise to expand ourcommercialization and sales of new products and into new growth areas.
• Targeted Capital Expenditures to Enhance Production Capacity and Efficiency. Weoperate three large modern pulp mills and the Friesau Facility which provide us with aplatform to be an efficient and competitive producer of high-quality NBSK pulp andlumber without the need for significant sustaining capital. We seek to make targetedcapital expenditures to increase production and operational efficiency, reduce costs andincrease electricity and chemical sales. Between 2013 and 2017, we investedapproximately $160.0 million (including $19.7 million in associated government grants) ingrowth capital expenditures for capacity expansions, operational efficiencies andrenewable energy and chemical production.
• Achieving Operational Excellence. Operating our pulp mills and the Friesau Facilityreliably and at a competitive cost is important for our financial performance. In addition tocapital expenditures, we continuously strive to develop maintenance systems andprocedures that will improve the throughput of our products by increasing the reliability ofour manufacturing processes. We also seek to reduce operating costs by better managingcertain operating activities such as fiber procurement, sales, marketing and logisticsactivities. We believe that our continued focus on operational excellence should allow usto achieve improved profitability and cash flows.
• Strategic Opportunities. We believe there will be continuing change and consolidation inthe forest products business, including pulp and lumber, and related wood harvesting,processing and extractive businesses as industry participants continually seek to lowercosts, refocus their product lines and react to ever changing global market conditions. Wetake an opportunistic approach to potential investments or acquisitions that can grow ourbusiness and expand our earnings.
(8)
The Pulp Industry
General
Pulp is used in the production of paper, tissues and paper-related products. Pulp is generallyclassified according to fiber type, the process used in its production and the degree to which it is bleached.Kraft pulp, a type of chemical pulp, is produced through a sulphate chemical process in which lignin, thecomponent of wood which binds individual fibers, is dissolved in a chemical reaction. Chemically preparedpulp allows the wood’s fiber to retain its length and flexibility, resulting in stronger paper products. Kraftpulp can be bleached to increase its brightness. Softwood kraft pulp is noted for its strength, brightness andabsorption properties and is used to produce a variety of products, including lightweight publication gradesof paper, tissues and other paper-related products.
There are two main types of bleached kraft pulp, being softwood kraft made from coniferous treesand hardwood kraft made from deciduous trees. Softwood species generally have long, flexible fibers whichadd strength to paper while fibers from species of hardwood contain shorter fibers which lend bulk andopacity.
We produce and sell NBSK pulp, which is a bleached kraft pulp manufactured using northernsoftwood and is considered a premium grade because of its strength. It generally obtains the highest pricerelative to other kraft pulps. Southern bleached softwood kraft pulp is kraft pulp manufactured usingsouthern softwood and does not possess the strength found in NBSK pulp. NBSK pulp is the sole pulpproduct of our mills.
Most paper users of market kraft pulp use a mix of softwood and hardwood grades to optimizeproduction and product qualities. In 2017, market kraft pulp consumption was approximately 55%hardwood bleached kraft and 42% softwood bleached kraft, with the remainder comprised of unbleachedpulp. Over the last several years, production of hardwood pulp, based on fast growing plantation fiberprimarily from Asia and South America, has increased much more rapidly than that of softwood grades,based on fiber that has longer growth cycles. Hardwood kraft generally has a cost advantage over softwoodkraft as a result of lower fiber costs, higher wood yields and, for newer hardwood mills, economies of scale.As a result of this growth in supply and lower costs, kraft pulp customers have substituted some of the pulpcontent in their products to hardwood pulp.
Counteracting customers’ ability to substitute lower priced hardwood pulp for NBSK pulp is therequirement for strength and formation characteristics in finished goods. Paper and tissue makers focus onlarger paper machines with higher speeds and lower basis weights for certain papers which require thestrength characteristics of softwood pulp. Additionally, where paper products are lightweight or specialized,like direct mail, magazine paper or premium tissue, or where strength or absorbency are important,softwood kraft forms a significant proportion of the fiber used. As a result, we believe that the ability ofkraft pulp users to further substitute hardwood for softwood pulp is limited by such requirements.
Kraft pulp can be made in different grades, with varying technical specifications, for different enduses. Softwood kraft pulp is valued for its reinforcing role in mechanical printing papers and is sought afterby producers of paper for the publishing industry, primarily for magazines and advertising materials.Softwood kraft pulp is also an important ingredient for tissue manufacturing and tissue demand tends toincrease with living standards in developing countries. NBSK pulp produced for reinforcement fibers isconsidered the highest grade of kraft pulp and generally obtains the highest price.
(9)
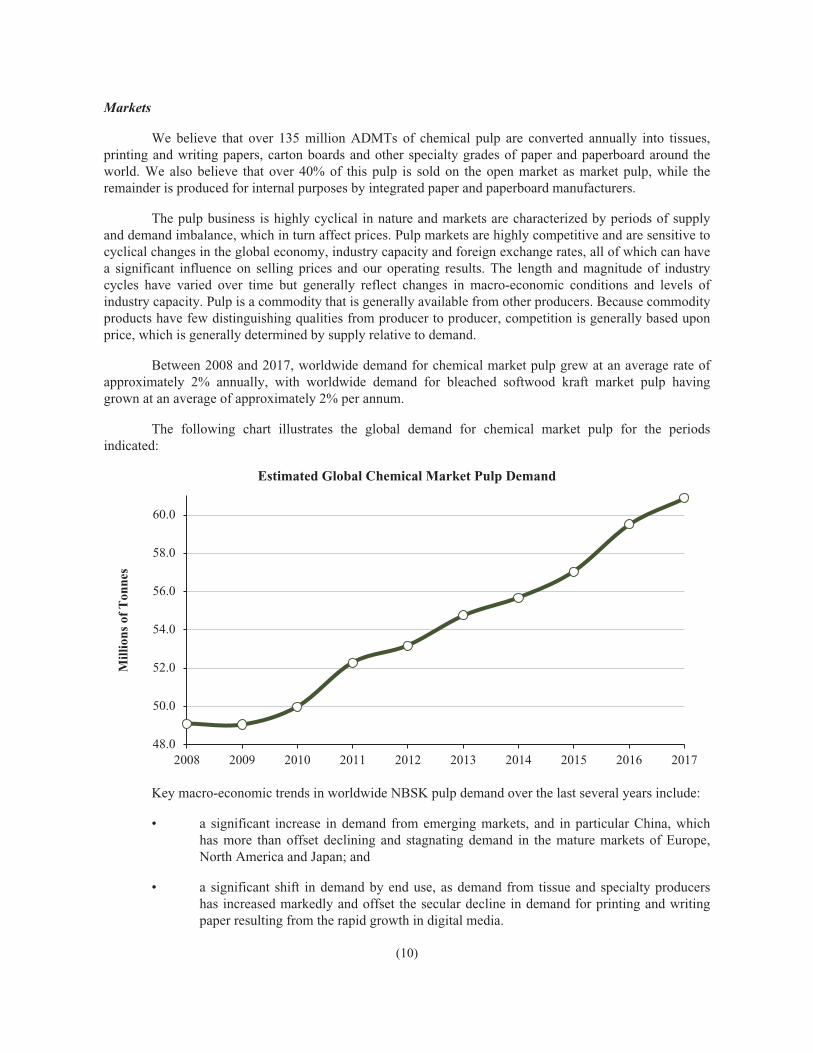
Markets
We believe that over 135 million ADMTs of chemical pulp are converted annually into tissues,printing and writing papers, carton boards and other specialty grades of paper and paperboard around theworld. We also believe that over 40% of this pulp is sold on the open market as market pulp, while theremainder is produced for internal purposes by integrated paper and paperboard manufacturers.
The pulp business is highly cyclical in nature and markets are characterized by periods of supplyand demand imbalance, which in turn affect prices. Pulp markets are highly competitive and are sensitive tocyclical changes in the global economy, industry capacity and foreign exchange rates, all of which can havea significant influence on selling prices and our operating results. The length and magnitude of industrycycles have varied over time but generally reflect changes in macro-economic conditions and levels ofindustry capacity. Pulp is a commodity that is generally available from other producers. Because commodityproducts have few distinguishing qualities from producer to producer, competition is generally based uponprice, which is generally determined by supply relative to demand.
Between 2008 and 2017, worldwide demand for chemical market pulp grew at an average rate ofapproximately 2% annually, with worldwide demand for bleached softwood kraft market pulp havinggrown at an average of approximately 2% per annum.
The following chart illustrates the global demand for chemical market pulp for the periodsindicated:
Estimated Global Chemical Market Pulp Demand
48.0
50.0
52.0
54.0
56.0
58.0
60.0
2008 2009 2010 2011 2012 2013 2014 2015 2016 2017
Mill
ions
of
Ton
nes
Key macro-economic trends in worldwide NBSK pulp demand over the last several years include:
• a significant increase in demand from emerging markets, and in particular China, whichhas more than offset declining and stagnating demand in the mature markets of Europe,North America and Japan; and
• a significant shift in demand by end use, as demand from tissue and specialty producershas increased markedly and offset the secular decline in demand for printing and writingpaper resulting from the rapid growth in digital media.
(10)
In late 2017, demand for NBSK pulp tightened primarily as a result of steady demand and areduction in China’s imports of recovered or waste paper which resulted from a major policy shiftannounced by China in the third quarter of 2017 to reduce and phase out imports of solid waste and scraps,including those within recovered or waste paper. In late 2017, China also announced goals to stop importsof unsorted paper, solid waste and scrap imports over the next two years.
Since 2008, demand for chemical softwood market pulp has grown in the emerging markets ofAsia, Eastern Europe and Latin America. China in particular has experienced substantial growth and itsimports of chemical softwood market pulp grew by approximately 12% per annum between 2008 and 2017.We believe the emerging markets now account for approximately 54% of total world demand for bleachedsoftwood kraft market pulp. China now accounts for approximately 32% of global bleached softwood kraftmarket pulp demand, compared to only 17% in 2008. Western Europe currently accounts for approximately24% of global bleached softwood kraft market pulp demand, compared to approximately 34% in 2008. Thedemand in the mature markets of Europe, North America and Japan in 2017 declined by approximately1.5 million ADMTs from 2008.
The following chart sets forth industry-wide bleached softwood kraft deliveries to China for theperiods indicated:
12 Month Rolling Bleached Softwood Kraft Pulp Deliveries to China
1.0
2.0
3.0
4.0
5.0
6.0
7.0
8.0
2008 2009 2010 2011 2013 2014 2015 2016 20172012
Mill
ions
of
Ton
nes
Growth in NBSK pulp demand in China and other emerging markets has, to a large extent, beendriven by increased demand from tissue and specialty paper producers, as a result of economic growth andrising income levels and living standards in such markets. These factors generally contribute to a greaterdemand for personal hygiene products in such regions. In China alone, tissue production capacity hasincreased by approximately 4.7 million ADMTs over the last five years. Additional tissue capacity increasesof 0.5 million ADMTs have been announced for 2018. At this time there can be no assurance as to whenand how much of such capacity expansion will be implemented.
This has also led to an overall shift in demand for NBSK pulp, as demand from tissue producershas increased, while demand from printing and writing end uses has decreased. Between 2003 and 2015,NBSK pulp demand for tissue production increased by approximately 206%, an approximate 10%compound annual growth rate. From 2003 to 2015, a period very affected by “digital substitution” oftraditional paper grades, total NBSK demand grew by 15%.
(11)
The following chart compares NBSK pulp demand by end use in each of 2003 and 2015 (the latestyear for which figures are currently available):
NBSK Pulp Demand by End Use
Specialties &Others30%
-
3.0
6.0
9.0
12.0
15.0
2003 2015
Mill
ions
of
Ton
nes
Printing & Writing25%
Tissue45%
Specialties &Others22%
Tissue17%
Printing & Writing61%
We believe 2017 NBSK demand by end use was generally consistent with the trend in the chartabove.
A measure of demand for kraft pulp is the ratio obtained by dividing the worldwide demand ofkraft pulp by the worldwide capacity for the production of kraft pulp, or the “demand/capacity ratio”. Anincrease in this ratio generally occurs when there is an increase in global and regional levels of economicactivity. An increase in this ratio also generally indicates greater demand as consumption increases, whichoften results in rising kraft pulp prices and a reduction of inventories by producers and buyers. As pricescontinue to rise, producers continue to run at higher operating rates. However, an adverse change in globaland regional levels of economic activity generally negatively affects demand for kraft pulp, often leadingbuyers to reduce their purchases and rely on existing pulp inventories. As a result, producers run at loweroperating rates by taking downtime to limit the build-up of their own inventories. The demand/capacity ratiofor bleached softwood kraft pulp was approximately 93%, 92% and 92% in 2017, 2016 and 2015,respectively.
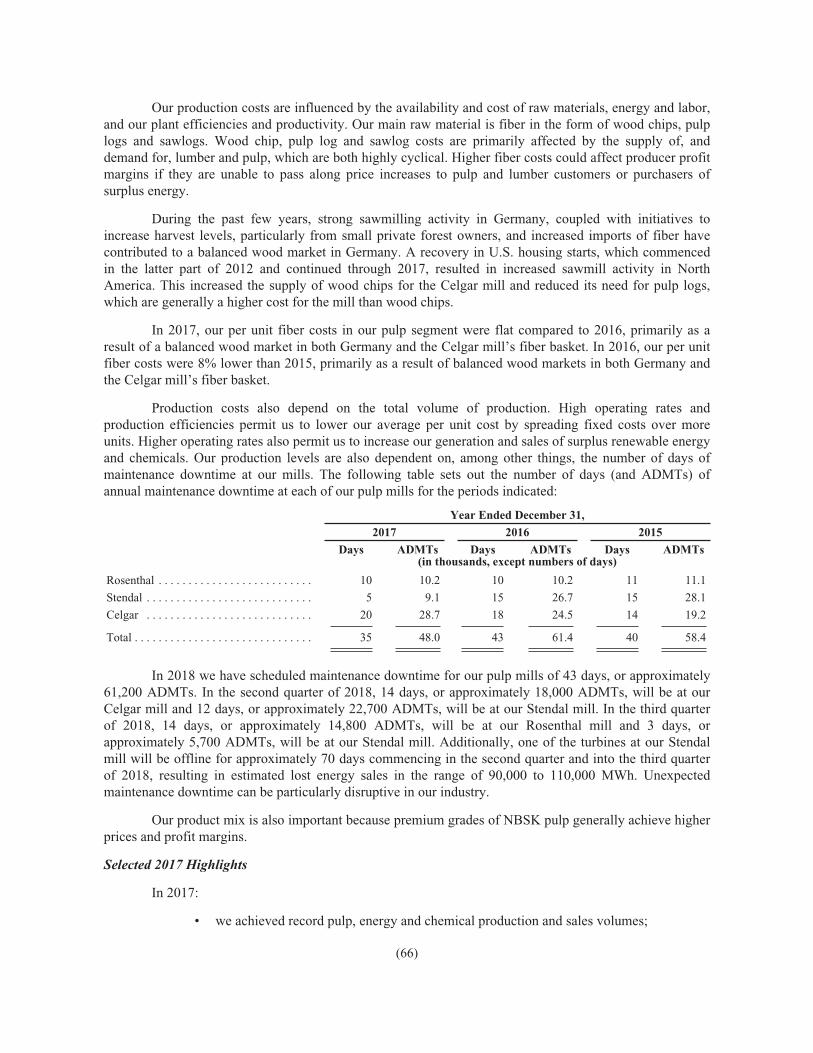
Between 2013 and 2017, we believe approximately 0.5 million ADMTs of pulp capacity was idledor shut down through mill closures or curtailments. Further, in efforts to improve environmental and safetystandards, China closed “old” mills and removed about 15.6 million ADMTs.
In 2017, chemical pulp capacity increased by approximately 2.3 million ADMTs, consisting ofincreases of 1.1 million ADMTs and 1.2 million ADMTs of softwood and hardwood kraft pulp,respectively. Further bleached hardwood kraft pulp capacity increases of about 2.0 million ADMTs havebeen announced for 2018. The increase in bleached hardwood kraft pulp is largely targeted at the growingdemand for pulp in developing markets, particularly in China, by producers of tissues, specialty papers andpackaging. Although not a direct competitor to NBSK pulp, if such additional bleached hardwood kraft pulpsupply is not absorbed by such demand growth, as a result of generally lower prices for bleached hardwood
(12)
kraft pulp, this supply increase could put downward pressure on NBSK pulp prices. However, we believecustomers’ ability to further substitute lower priced bleached hardwood kraft pulp for NBSK pulp is limitedby the strength characteristic of NBSK pulp which is required by large modern paper machines to run lowerbasis-weight paper products efficiently.
Producers have publicly announced an additional 1.0 million ADMTs of NBSK pulp capacity tocome online in Europe in mid-2018 pursuant to modernization and expansion projects. However, at thistime, we cannot predict which of the publicly announced expansion projects will be completed or how muchadditional NBSK pulp production capacity may come online and when. As pulp prices are highly cyclical,there can be no assurance that NBSK pulp prices will not decline in the future as a result of increases to thesupply of kraft pulp.
In addition, certain integrated pulp and paper producers have the ability to discontinue paperproduction by idling their paper machines and selling their NBSK pulp production on the market, if marketconditions, prices and trends warrant such actions.
NBSK Pulp Pricing
Kraft pulp is a globally traded commodity and prices are highly cyclical and volatile. Kraft pulpprices are generally quoted in dollars. Pricing is primarily influenced by the balance between supply anddemand, as affected by global macro-economic conditions, changes in consumption and capacity, the levelof customer and producer inventories and fluctuations in exchange rates. Generally, we and other producersconsider global NBSK pulp supply and demand to be evenly balanced when world inventory levels are atabout 30 days’ supply.
General macro-economic conditions are closely tied to overall global business activity, which helpsdetermine pulp demand and, in turn, impacts pricing.
As the majority of market NBSK pulp is produced and sold by Canadian and Northern Europeanproducers, while the price of NBSK pulp is generally quoted in dollars, pricing is often affected byfluctuations in the currency exchange rates for the dollar versus the euro and the Canadian dollar. As NBSKpulp producers generally incur costs in their local currency, while pulp is quoted in dollars, a dollarstrengthening generally benefits producers’ businesses and operating margins. Conversely, a weakening ofthe dollar versus the local currency of producers generally adversely affects producers’ businesses andoperating margins.
As a corollary to changes in exchange rates between the dollar and the euro and Canadian dollar, astronger dollar generally increases costs to customers of NBSK pulp producers and results in downwardpressure on prices. Conversely, a weakening dollar generally supports higher pulp pricing. However, thereis invariably a time lag between changes in currency exchange rates and pulp prices. This lag can vary andis not predictable with any certainty.
As Northern Europe has historically been the world’s largest market and NBSK pulp is thepremium grade, the European market NBSK price is generally used as a benchmark price by the industry.The average European list prices for NBSK pulp since 2008 have fluctuated between a low ofapproximately $575 per ADMT in 2009 and a high of $1,030 per ADMT in late 2017.
(13)
The following chart sets out the changes in list prices for NBSK pulp in Europe, as stated indollars, Canadian dollars and euros for the periods indicated:
NBSK Pulp Price History (European Delivery)
-
200
400
600
800
1,000
1,200
1,400
2008 2009 2010 2011 2012 2013 2014 2015 2016 2017
Ave
rage
NB
SK P
rice
(p
er t
onn
e)
USD
EURO
CAD
The following table sets out list prices for NBSK pulp in the regions indicated at the datesindicated:
A producer’s net sales realizations are list prices, net of customer discounts, rebates and otherselling concessions. Over the last three years, these have increased as producers compete for customers andsales. The nature of the pricing structure in Asia is different in that, while quoted list prices tend to be lowerthan Europe, customer discounts and rebates are much lower, resulting in net sales realizations that aregenerally similar to other markets.
(14)
The following chart sets forth changes in FOEX PIX Pulp Index prices for NBSK pulp in Europeand global bleached softwood kraft inventory levels between 2004 and 2017:
We are exposed to fluctuations in quarterly sales volumes and expenses due to seasonal factors.These factors are common in the NBSK pulp industry. We generally have weaker pulp demand in Europeduring the summer holiday months and in China in the period relating to its lunar new year. We typicallyhave a seasonal build-up in raw material inventories in the early winter months as our mills build up theirfiber supply for the winter when there is reduced availability.
Competition
Pulp markets are large and highly competitive. Producers ranging from small independentmanufacturers to large integrated companies produce pulp worldwide. Our pulp and customer servicescompete with similar products manufactured and distributed by others. While many factors influence ourcompetitive position, particularly in weak economic times, a key factor is price. Other factors includeservice, quality and convenience of location. Some of our competitors are larger than we are in certainmarkets and have substantially greater financial resources. These resources may afford those competitorsmore purchasing power, increased financial flexibility, more capital resources for expansion andimprovement and enable them to compete more effectively. Our key NBSK pulp competitors are principallylocated in Northern Europe and Canada and include Canfor Pulp, Stora Enso, Metsä Fibre, Ilim, Södra Celland Asia Pulp and Paper.
(15)
Pulp Production
Our pulp production capacity and actual production by mill for the periods indicated is set outbelow:
(1) Capacity is the rated capacity of the plants for the year ended December 31, 2017.
Softwood kraft pulp is valued for its reinforcing role in mechanical printing papers and is soughtafter by producers of paper for the publishing industry, primarily for magazines and advertising materials.Softwood kraft pulp is also an important ingredient for tissue manufacturing, and tissue demand tends toincrease with living standards in developing countries. NBSK pulp produced for reinforcement fibers isconsidered the highest grade of kraft pulp and generally obtains the highest price.
The NBSK pulp produced at the Rosenthal mill is a long-fibered softwood pulp produced by asulphate cooking process and manufactured primarily from wood chips and pulp logs. A number of factorsbeyond economic supply and demand have an impact on the market for NBSK pulp, including requirementsfor pulp bleached without any chlorine compounds or without the use of chlorine gas. The Rosenthal millhas the capability of producing both “totally chlorine free” and “elemental chlorine free” pulp. Totallychlorine free pulp is bleached to a high brightness using oxygen, ozone and hydrogen peroxide as bleachingagents, whereas elemental chlorine free pulp is produced by substituting chlorine dioxide for chlorine gas inthe bleaching process. This substitution virtually eliminates complex chloro-organic compounds from themill’s effluent. The Rosenthal mill produces pulp for reinforcement fibers to the specifications of certain ofour customers. We believe that a number of our customers consider us their supplier of choice.
The NBSK pulp produced at the Stendal mill is of a slightly different grade than the pulp producedat the Rosenthal mill as the mix of softwood fiber used is slightly different. This results in a complementaryproduct more suitable for different end uses. The Stendal mill is capable of producing both totally chlorinefree and elemental chlorine free pulp.
The Celgar mill produces high-quality NBSK pulp that is made from a unique blend of slowgrowing/long-fiber Western Canadian tree species. It is used in the manufacture of high-quality paper andtissue products. We believe the Celgar mill’s pulp is known for its excellent product characteristics,including tensile strength, wet strength and brightness. The Celgar mill is a long-established supplier topaper and tissue producers in Asia.
Generation and Sales of Green Energy and Chemicals at Our Mills
Our pulp mills are large scale bio-refineries that, in addition to pulp, also produce surplus “carbonneutral” or green energy. As part of the pulp production process our mills generate green energy usingcarbon-neutral bio-fuels such as black liquor and wood waste. Through the incineration of bio-fuels in therecovery and power boilers, our mills produce sufficient steam to cover all of our steam requirements and
(16)
allow us to produce surplus electricity which we sell to third party utilities. As a result, we have benefitedfrom green energy legislation, incentives and commercialization that have developed over the last decade inEurope and Canada. In addition, in recent years we have applied considerable resources to increasing ourcapacity to produce and sell chemicals, primarily tall oil for use in numerous applications includingbio-fuels.
Our Friesau Facility also generates and sells green energy produced from its bio-mass cogenerationpower plant.
Our surplus energy and chemical sales provide us with a stable revenue source unrelated to pulp orlumber prices. Since our energy and chemical production are by-products of our production processes, thereare minimal incremental costs and our surplus energy and chemical sales are highly profitable. We believethat this revenue source gives our mills a competitive advantage over other older mills which do not havethe equipment or capacity to produce and/or sell surplus power and/or chemicals in a meaningful amount.
The following table sets out our electricity generation and surplus electricity sales for the five yearsended December 31, 2017:
Electricity Generation and Exports
-
500,000
1,000,000
1,500,000
2,000,000
Ele
ctri
city
(M
Wh)
Generation Exports
20151.5 million tonnesPulp Production
20141.5 million tonnesPulp Production
20131.4 million tonnesPulp Production
20161.4 million tonnesPulp Production
20171.5 million tonnesPulp Production &
281.3 MMfbmLumber Production
895,
818
785,
845
814,
966
807,
758
699,
051
1,96
1,97
5
1,81
2,64
6
1,84
6,84
2
1,85
3,50
9
1,71
0,22
4
(17)
The following chart sets forth our consolidated revenues from electricity and chemical sales for thefive years ended December 31, 2017:
Energy and Chemical Revenue
$100.9
$84.3 $87.0
$101.5
$92.2
-
$20.0
$40.0
$60.0
$80.0
$100.0
$120.0
2017 2016 2015 2014 2013
Rev
enue
($
mil
lion
s)
Chemical
Energy
German Pulp Mills and Friesau Facility
Our German pulp mills and the Friesau Facility participate in a program established pursuant to theRenewable Energy Act, which requires that public electric utilities give priority to electricity produced fromrenewable energy sources by independent power producers and pay a fixed tariff for such electricity for aperiod of 20 years. Such tariff expires December 31, 2019 for our Rosenthal mill, December 31, 2024 forour Stendal mill and in 2029 for the Friesau Facility. Recent amendments to the Renewable Energy Act willextend the initial terms for our pulp mills for a further 10-year period, based upon the price received in thelast year prior to renewal regressing at a rate of 8% per annum. Such amendments are subject to compliancewith EU state aid rules. While we expect them to be effective, we can provide no assurance of the same.
Since 2005, our German mills have received emission allowances under the European UnionCarbon Emissions Trading Scheme, referred to as the “EU ETS”. However, our eligibility for special tariffsunder the Renewable Energy Act has reduced the amount of emissions allowances granted to our Germanmills under the EU ETS.
In 2017, energy sales for our German pulp mills and the Friesau Facility were as follows:
In 2017, our Rosenthal and Stendal mills generated $2.3 million and $11.2 million, respectively,from the sale of tall oil, a by-product of our production process.
(18)
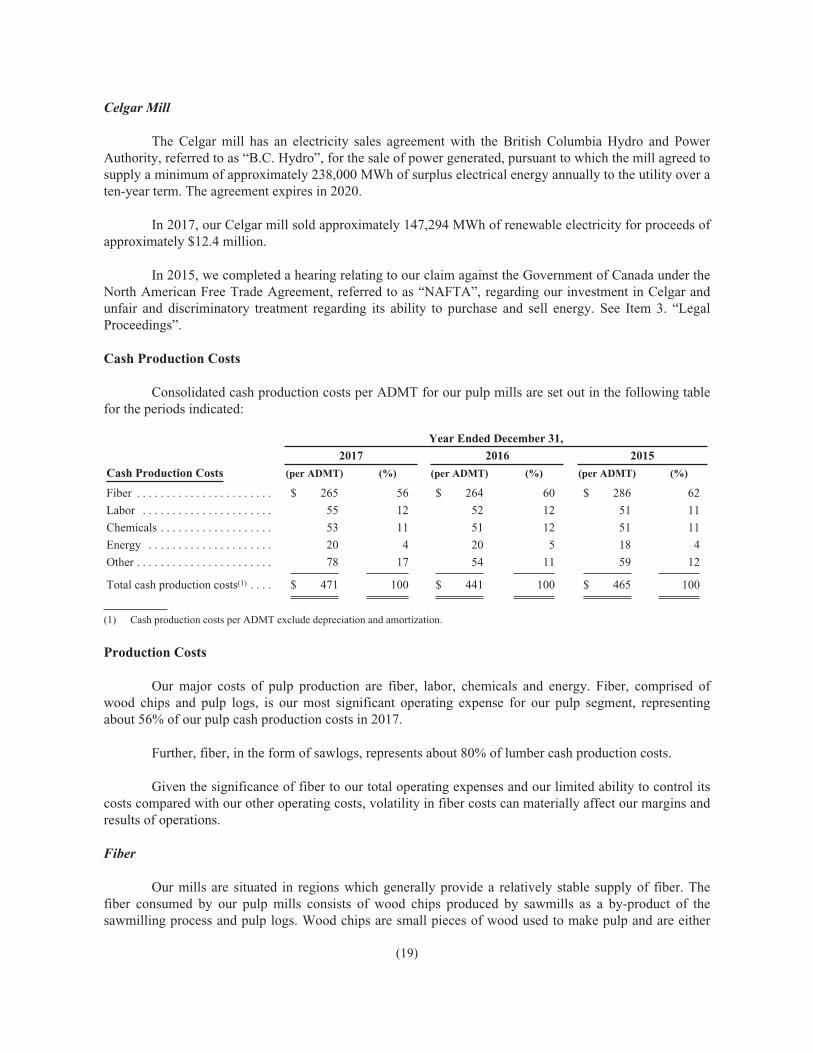
Celgar Mill
The Celgar mill has an electricity sales agreement with the British Columbia Hydro and PowerAuthority, referred to as “B.C. Hydro”, for the sale of power generated, pursuant to which the mill agreed tosupply a minimum of approximately 238,000 MWh of surplus electrical energy annually to the utility over aten-year term. The agreement expires in 2020.
In 2017, our Celgar mill sold approximately 147,294 MWh of renewable electricity for proceeds ofapproximately $12.4 million.
In 2015, we completed a hearing relating to our claim against the Government of Canada under theNorth American Free Trade Agreement, referred to as “NAFTA”, regarding our investment in Celgar andunfair and discriminatory treatment regarding its ability to purchase and sell energy. See Item 3. “LegalProceedings”.
Cash Production Costs
Consolidated cash production costs per ADMT for our pulp mills are set out in the following tablefor the periods indicated:
Total cash production costs(1) . . . . $ 471 100 $ 441 100 $ 465 100
(1) Cash production costs per ADMT exclude depreciation and amortization.
Production Costs
Our major costs of pulp production are fiber, labor, chemicals and energy. Fiber, comprised ofwood chips and pulp logs, is our most significant operating expense for our pulp segment, representingabout 56% of our pulp cash production costs in 2017.
Further, fiber, in the form of sawlogs, represents about 80% of lumber cash production costs.
Given the significance of fiber to our total operating expenses and our limited ability to control itscosts compared with our other operating costs, volatility in fiber costs can materially affect our margins andresults of operations.
Fiber
Our mills are situated in regions which generally provide a relatively stable supply of fiber. Thefiber consumed by our pulp mills consists of wood chips produced by sawmills as a by-product of thesawmilling process and pulp logs. Wood chips are small pieces of wood used to make pulp and are either
(19)
wood residuals from the sawmilling process or pulp logs chipped especially for this purpose. Pulp logsconsist of lower quality logs not used in the production of lumber. The Friesau Facility consumes sawlogsand waste wood, which are cyclical in both price and supply.
Generally, the cost of wood chips, pulp logs and sawlogs is primarily affected by the supply anddemand for lumber. Additionally, regional factors such as harvesting levels and weather conditions can alsohave a material effect on the supply, demand and price for fiber.
In Germany, the price and supply of wood chips has been affected by increasing demand fromalternative or renewable energy producers and government initiatives for carbon neutral energy. Decliningenergy prices, weaker economies or warm winters such as in 2014, 2015 and 2016 tempered the demand forwood chips resulting from initiatives by European governments to promote the use of wood as a carbonneutral energy. Over the long-term, we expect this non-traditional demand for fiber is likely to continue toremain strong.
During the past few years, certain customers have endeavored to purchase pulp that is producedusing fiber that meets certain recognized wood certification requirements from forest certification agencieslike FSC, PEFC and SFI-CSA. If the fiber we purchase does not meet certain wood certifications requiredby customers, it may make it more difficult or prevent us from selling our pulp to such customers. The chainof custody wood certification process is a voluntary process which allows a company to demonstrate thatthey use forest resources in accordance with strict principles and standards in the areas of sustainable forestmanagement practices and environmental management. In an effort to procure wood only from sustainablymanaged sources, we employ an FSC Chain of Custody protocol for controlled wood and PEFCcertification, which requires tracking of fiber origins and preparing risk based assessments regarding theregion and operator. In the areas where we operate, we are actively engaged in the further development ofcertification processes. However, there is competition among private certification systems along with effortsby supporters to further these systems by having customers of forest products to require products to becertified to their preferred system. Such wood certification standards continue to evolve and are notconsistent from jurisdiction to jurisdiction or how they are interpreted and applied. We currently do notexpect certification requirements to have a material adverse impact on our fiber procurement and sales.However, if sufficient marketplace demand requires wood raw materials to be sourced from standards thatare inconsistent with those in our fiber supply regions, it could increase our operating costs and availableharvest levels.
Offsetting some of the increases in demand for wood fiber have been initiatives to increase harvestlevels in Germany, particularly from small private forest owners. We believe that Germany has the highestavailability of softwood forests in Europe suitable for harvesting and manufacturing. We believe privateownership of such forests is approximately 48%. Many of these forest ownership stakes are very small andhave been harvested at rates much lower than their rate of growth.
In 2017, our per unit pulp fiber costs in Germany were flat compared to 2016, primarily as a resultof a balanced wood market in Germany. In 2016, our per unit fiber costs in Germany were 9% lower than in2015, primarily as a result of a balanced wood market in Germany. In 2015, our per unit fiber costs inGermany decreased by approximately 17% due to the strength of the dollar and as a result of a generallybalanced wood market.
We believe we are the largest consumer of wood chips and pulp logs in Germany and often providethe best long-term economic outlet for the sale of wood chips in Eastern Germany. We coordinate the woodprocurement activities for our German mills to reduce overall personnel and administrative costs, providegreater purchasing power and coordinate buying and trading activities. This coordination and integration of
(20)
fiber flows also allows us to optimize transportation costs, and the species and fiber mix for both mills. Inaddition, in 2016, we entered into a joint wood purchasing arrangement with another significant woodconsumer in Europe, being the Mondi Group.
In 2017, the Rosenthal mill consumed approximately 1.9 million cubic meters of fiber.Approximately 63% of such consumption was in the form of sawmill wood chips and approximately 37%was in the form of pulp logs. The wood chips for the Rosenthal mill are sourced from approximately 46sawmills located primarily in the states of Bavaria, Baden-Württemberg and Thüringia and primarily withina 300 kilometer radius of the Rosenthal mill. Within this radius, the Rosenthal mill is the largest consumerof wood chips. Given its location and size, the Rosenthal mill is often the best economic outlet for the saleof wood chips in the area. In 2017, approximately 73% of the fiber consumed by the Rosenthal mill wasspruce and the remainder was pine. While fiber costs and supply are subject to cyclical changes largely inthe sawmill industry, we expect that we will be able to continue to obtain an adequate supply of fiber onreasonably satisfactory terms for the Rosenthal mill due to its location and our long-term relationships withsuppliers. We have not historically experienced any significant fiber supply interruptions at the Rosenthalmill.
Wood chips for the Rosenthal mill are normally sourced from sawmills under one-year contractswith quarterly adjustments for market pricing. Substantially all of our chip supply is sourced from supplierswith which we have long-standing relationships. Pulp logs are sourced from the state forest agencies inThüringia, Saxony and Bavaria and from private and municipal forest owners. In addition, the Rosenthalmill buys relevant volumes from traders and via imports from the Czech Republic and Poland.
In 2017, the Stendal mill consumed approximately 3.4 million cubic meters of fiber. Approximately26% of such fiber was in the form of sawmill wood chips and approximately 74% was in the form of pulplogs. The core wood supply region for the Stendal mill includes most of the Northern and Western part ofGermany primarily within an approximate 300 kilometer radius of the mill. We also purchase wood chipsfrom Southwestern and Southern Germany as well as the Baltic Sea region. The fiber consumed by theStendal mill consisted of approximately 49% pine, 49% spruce and 2% other species in 2017. The Stendalmill has sufficient chipping capacity to fully operate solely using pulp logs, if required. We source pulp logsfrom private forest holders, municipal forest owners and from state forest agencies in Saxony-Anhalt,Mecklenburg-Western Pomerania, Saxony, Lower Saxony, North Rhine-Westphalia, Hesse, Brandenburg,Schleswig-Holstein, Rhineland Palatinate and the City of Berlin. The volumes are distributed at optimalcosts between the mills. In addition, over the last three years, the Stendal mill also imported fiber fromPoland and the Baltic Sea region.
The availability of fiber for the Celgar mill is in large part influenced by the strength of the lumbermarket. Lumber markets are primarily driven by U.S. housing starts and, to a lesser degree, demand fromChina.
In 2017, our Celgar mill’s per unit fiber costs were flat compared to 2016, due to a balanced woodmarket in the Celgar mill’s fiber basket. In 2016, our Celgar mill’s per unit fiber costs were 6% lower thanin 2015, due to strong sawmilling activity in the Celgar mill’s fiber basket. In 2015, our Celgar mill’s perunit fiber costs were flat compared to 2014, as the strengthening of the dollar largely offset higher prices inlocal currency terms.
In 2017, the Celgar mill consumed approximately 2.5 million cubic meters of fiber. Approximately72% of such fiber was in the form of sawmill wood chips and the remaining 28% came from pulp logsprocessed through its woodroom or chipped by a third party. Celgar’s woodroom is able to process about40% of the mill’s fiber needs. The source of fiber at the mill is characterized by a mixture of species (pine,
(21)
douglas fir, hemlock, cedar and spruce) and the mill sources fiber from a number of Canadian and U.S.suppliers.
In 2017, the Celgar mill had access to approximately 27 different chip suppliers from Canada andthe United States. Chips are purchased in Canada and the United States in accordance with chip purchaseagreements. Generally, pricing is reviewed and adjusted periodically to reflect market prices. One of thelonger-term contracts is a so-called “evergreen” agreement, where the contract remains in effect until one ofthe parties elects to terminate after providing the stipulated notice. All other contracts are generally for oneyear with quarterly adjustments or on three-month terms.
To secure the volume of pulp logs required by its woodroom and field chippers, the Celgar mill hasentered into pulp log supply agreements, which can range from three-month to one-year terms, with anumber of different suppliers, many of whom are also contract chip suppliers to the mill. All of the pulp logagreements can be terminated by either party for any reason, upon seven days’ written notice. The Celgarmill also purchased two non-renewable licenses at a cost of $1.3 million, which will provide saw logs tosawmills in the area and pulp logs for the Celgar mill to use. The Celgar mill also bids on British Columbiatimber sales from time to time. The Celgar mill has also commenced second pass harvesting in certainlocales to increase harvesting of pulp logs that have traditionally been left as waste after harvestingoperations.
Our Friesau Facility is dependent on the consistent supply of sawlog fiber. Wood fiber is the singlelargest input cost and accounts for about 80% of its cash costs of producing lumber. Our Friesau Facility islocated in an area where there is a significant amount of high quality fiber within economic reach. Thewood fiber requirements of the Friesau Facility are met primarily through open market purchases andcontract purchases from state forestry agencies and private timberland owners.
Labor
Our labor costs are generally steady, with small overall increases due to inflation in wages andhealth care costs. Over the last three years, we have been able to largely offset such increases by increasingour efficiencies and production and streamlining operations.
Energy
Our energy is primarily generated from renewable carbon neutral sources, such as black liquor andwood waste. Our mills produce all of our energy requirements and generate excess energy which we sell tothird party utilities. In 2017, we generated 1,961,975 MWh and sold 895,818 MWh of surplus energy. Seealso “– Generation and Sales of Green Energy and Chemicals at our Mills”. We utilize fossil fuels, such asnatural gas, primarily in our lime kilns and we use a limited amount for start-up and shut-down operations.Additionally, from time to time, mill process disruptions occur and we consume small quantities ofpurchased electricity and fossil fuels to maintain operations. As a result, all of our mills are subject tofluctuations in the prices for fossil fuels.
Chemicals
Our pulp mills use certain chemicals which are generally available from several suppliers andsourcing is primarily based upon pricing and location. Our chemical costs have remained stable over the lastthree years.
In connection with our focus on the growing bio-energy market, we sell tall oil, a by-product of ourpulp production process which is used as both a chemical additive and as a green energy source. In 2017,we generated $14.2 million from the sale of tall oil and other chemicals.
(22)
Sales, Marketing and Distribution
Our pulp revenues by geographic area are set out in the following table for the periods indicated:
In 2017, our wood products segment revenues were: (i) 39% from Germany; (ii) 29% from otherEuropean Union countries; (iii) 24% from the United States; and (iv) 8% from other countries.
(23)
Our global sales and marketing group is responsible for conducting all sales and marketing of thepulp produced at our mills and currently has approximately 15 employees. This group largely handles allEuropean and North American sales directly. Sales to Asia are made directly or through commission agentsoverseen by our sales group. The global sales and marketing group handles sales to approximately 200customers. We coordinate and integrate the sales and marketing activities of our German mills to realize ona number of synergies between them. These include reduced overall administrative and personnel costs andcoordinated selling, marketing and transportation activities. We also coordinate sales from the Celgar millwith our German mills on a global basis, thereby providing our larger customers with seamless serviceacross all major geographies. In marketing our pulp, we seek to establish long-term relationships byproviding a competitively priced, high-quality, consistent product and excellent service. In accordance withcustomary practice, we maintain long-standing relationships with our customers, pursuant to which weperiodically reach agreements on specific volumes and prices.
Our lumber sales are handled by our sales team in Germany and Vancouver. We also sell lumberthrough commissioned agents in certain markets.
Our pulp and lumber sales are on customary industry terms. At December 31, 2017, we had nomaterial payment delinquencies. In 2017, one customer of our pulp segment through several of itsoperations accounted for 13% of our revenues. In 2016, two customers through several of their operationsaccounted for 19% and 10%, respectively, of our pulp sales. In 2015, one customer through several of itsoperations accounted for 16% of our pulp sales. We do not believe our pulp sales are dependent upon theactivities of any single customer and the loss of any single customer would not have a material adverseeffect on us.
Our sales to tissue and specialty paper product manufacturers were approximately 50% of our pulpsales in 2017, 2016 and 2015. Generally tissue producer customers are not as sensitive to cyclical declinesin demand caused by downturns in economic activity. The balance of our sales was to other paper productmanufacturers.
Transportation
We transport our NBSK pulp and lumber generally by truck, rail and ocean carriers through third-party carriers. We have a small fleet of trucks in Germany that deliver some of our German mills’ pulp.
Our German pulp mills are currently the only market kraft pulp producers in Germany, which is thelargest import market for kraft pulp in Europe. We therefore have a competitive transportation costadvantage compared to Canadian and Northern European pulp producers when shipping to customers inEurope. Due to the location of our German mills, we are able to deliver pulp to many of our customersprimarily by truck and rail. Most trucks that deliver goods into Eastern Germany generally do not havesignificant backhaul opportunities as the region is primarily an importer of goods. We are thereforefrequently able to obtain relatively low backhaul freight rates for the delivery of our products to many of ourcustomers.
The Celgar mill’s pulp is transported to customers by rail, truck and ocean carrier to ensure timelydelivery. The majority of Celgar’s pulp for overseas markets is initially delivered primarily by rail to thePort of Vancouver for shipment overseas by ocean carrier. Based in Western Canada, the Celgar mill is wellpositioned to service Asian customers. The majority of the Celgar mill’s pulp for domestic markets isshipped by rail directly to the customer or to third party warehouses in the United States. In 2015, weestablished a logistics and reload center near Trail, British Columbia. The center provides us with additionalwarehouse space for our Celgar mill and greater transportation flexibility in terms of access to rail andtrucking options.
(24)
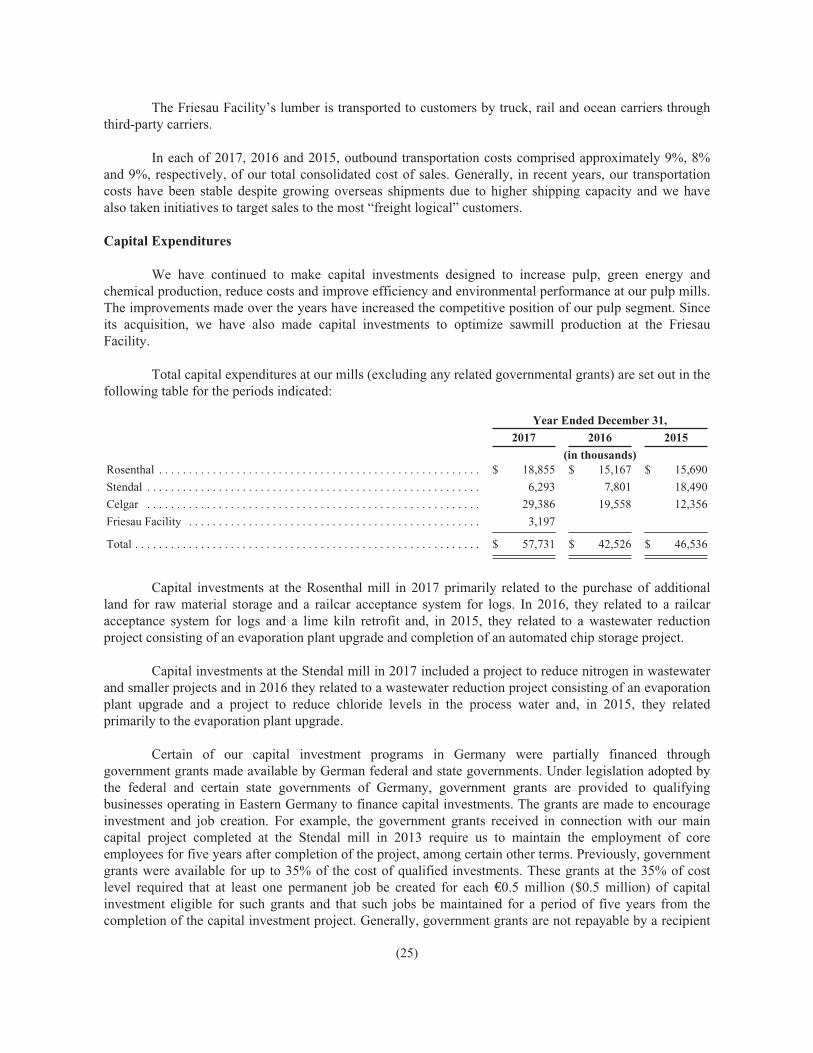
The Friesau Facility’s lumber is transported to customers by truck, rail and ocean carriers throughthird-party carriers.
In each of 2017, 2016 and 2015, outbound transportation costs comprised approximately 9%, 8%and 9%, respectively, of our total consolidated cost of sales. Generally, in recent years, our transportationcosts have been stable despite growing overseas shipments due to higher shipping capacity and we havealso taken initiatives to target sales to the most “freight logical” customers.
Capital Expenditures
We have continued to make capital investments designed to increase pulp, green energy andchemical production, reduce costs and improve efficiency and environmental performance at our pulp mills.The improvements made over the years have increased the competitive position of our pulp segment. Sinceits acquisition, we have also made capital investments to optimize sawmill production at the FriesauFacility.
Total capital expenditures at our mills (excluding any related governmental grants) are set out in thefollowing table for the periods indicated:
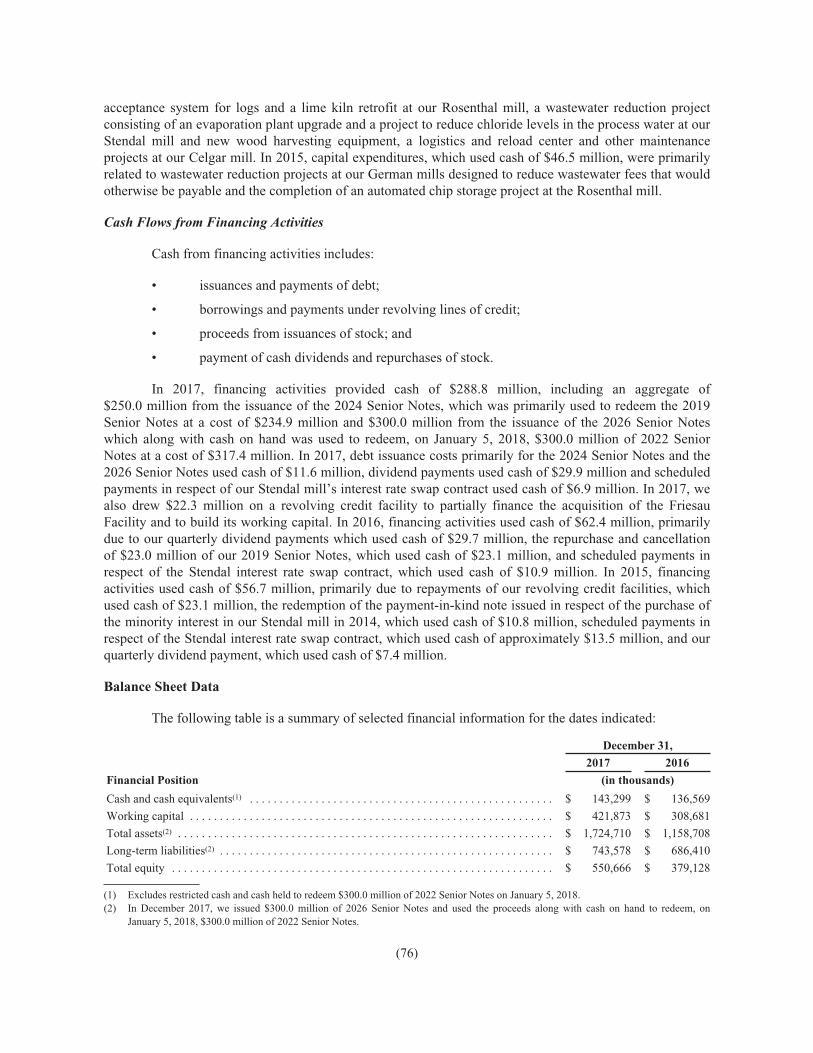
Capital investments at the Rosenthal mill in 2017 primarily related to the purchase of additionalland for raw material storage and a railcar acceptance system for logs. In 2016, they related to a railcaracceptance system for logs and a lime kiln retrofit and, in 2015, they related to a wastewater reductionproject consisting of an evaporation plant upgrade and completion of an automated chip storage project.
Capital investments at the Stendal mill in 2017 included a project to reduce nitrogen in wastewaterand smaller projects and in 2016 they related to a wastewater reduction project consisting of an evaporationplant upgrade and a project to reduce chloride levels in the process water and, in 2015, they relatedprimarily to the evaporation plant upgrade.
Certain of our capital investment programs in Germany were partially financed throughgovernment grants made available by German federal and state governments. Under legislation adopted bythe federal and certain state governments of Germany, government grants are provided to qualifyingbusinesses operating in Eastern Germany to finance capital investments. The grants are made to encourageinvestment and job creation. For example, the government grants received in connection with our maincapital project completed at the Stendal mill in 2013 require us to maintain the employment of coreemployees for five years after completion of the project, among certain other terms. Previously, governmentgrants were available for up to 35% of the cost of qualified investments. These grants at the 35% of costlevel required that at least one permanent job be created for each €0.5 million ($0.5 million) of capitalinvestment eligible for such grants and that such jobs be maintained for a period of five years from thecompletion of the capital investment project. Generally, government grants are not repayable by a recipient
(25)
unless such recipient fails to complete the proposed capital investment or, if applicable, fails to create ormaintain the requisite amount of jobs or comply with other applicable terms. In the case of such failure, thegovernment is entitled to revoke the grants and seek repayment unless such failure resulted from materialunforeseen market developments beyond the control of the recipient, in which case the government mayrefrain from reclaiming previous grants. Pursuant to legislation in effect at the time, the Stendal millrecorded approximately $350.0 million of government grants. We believe that we are currently incompliance in all material respects with all of the terms and conditions governing the government grants wehave received in Germany.
The following table sets out, as at the dates indicated, the effect of government grants on therecorded value of such assets in our Consolidated Balance Sheets:
The following table sets forth, as at the dates indicated, the gross amount of all government grantswe have received and capitalized in our balance sheet, the associated amortization and the resulting netbalance we include in our property, plant and equipment:
(1) Grants were received in euros and Canadian dollars and amounts change when translated into dollars as a result of changes in currencyexchange rates.
Qualifying capital investments at industrial facilities in Germany that reduce effluent dischargesoffset wastewater fees that would otherwise be required to be paid. For more information about ourenvironmental capital expenditures, see “– Environmental”.
In 2017, capital investments at the Celgar mill included a pre-bleach press system upgrade andlarge maintenance projects. In 2016, they included new wood harvesting equipment, a logistics and reloadcenter and other maintenance projects and, in 2015, they included the logistics and reload center and othermaintenance projects.
Capital investments at the Friesau Facility in 2017 primarily related to a saw line improvementproject.
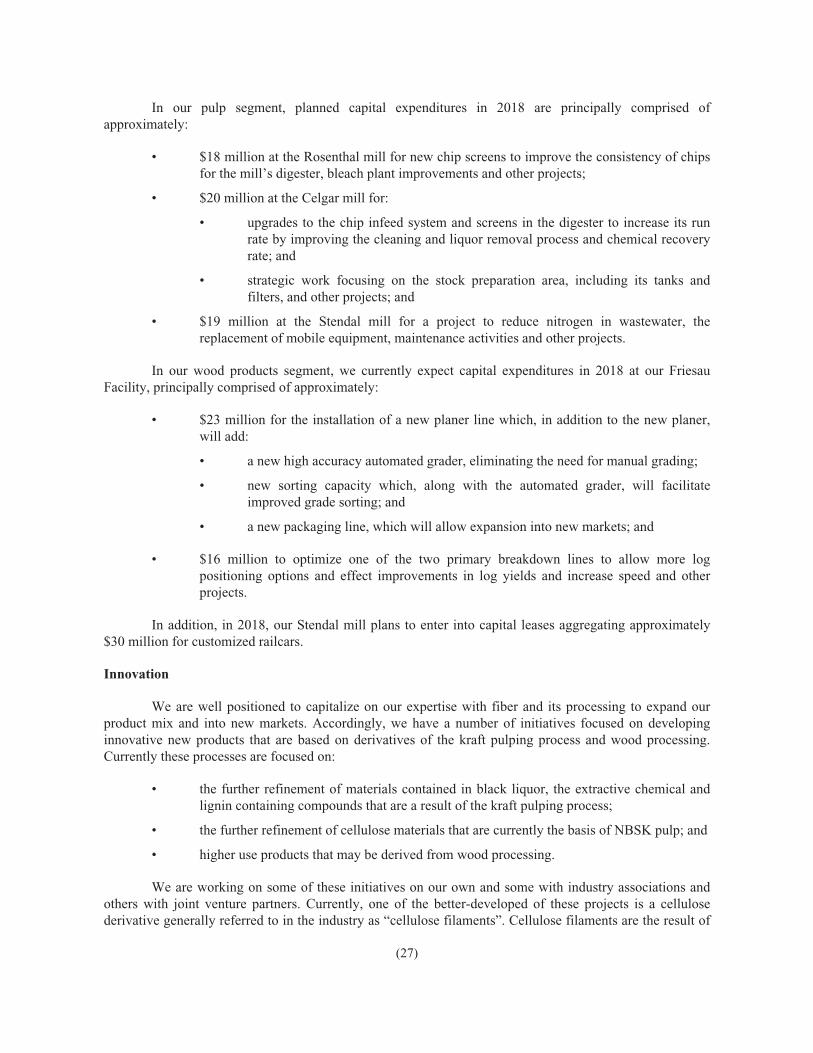
In 2018, excluding amounts being financed through government grants, we expect our total capitalexpenditures to be approximately $85 million to $95 million.
(26)
In our pulp segment, planned capital expenditures in 2018 are principally comprised ofapproximately:
• $18 million at the Rosenthal mill for new chip screens to improve the consistency of chipsfor the mill’s digester, bleach plant improvements and other projects;
• $20 million at the Celgar mill for:
• upgrades to the chip infeed system and screens in the digester to increase its runrate by improving the cleaning and liquor removal process and chemical recoveryrate; and
• strategic work focusing on the stock preparation area, including its tanks andfilters, and other projects; and
• $19 million at the Stendal mill for a project to reduce nitrogen in wastewater, thereplacement of mobile equipment, maintenance activities and other projects.
In our wood products segment, we currently expect capital expenditures in 2018 at our FriesauFacility, principally comprised of approximately:
• $23 million for the installation of a new planer line which, in addition to the new planer,will add:
• a new high accuracy automated grader, eliminating the need for manual grading;
• new sorting capacity which, along with the automated grader, will facilitateimproved grade sorting; and
• a new packaging line, which will allow expansion into new markets; and
• $16 million to optimize one of the two primary breakdown lines to allow more logpositioning options and effect improvements in log yields and increase speed and otherprojects.
In addition, in 2018, our Stendal mill plans to enter into capital leases aggregating approximately$30 million for customized railcars.
Innovation
We are well positioned to capitalize on our expertise with fiber and its processing to expand ourproduct mix and into new markets. Accordingly, we have a number of initiatives focused on developinginnovative new products that are based on derivatives of the kraft pulping process and wood processing.Currently these processes are focused on:
• the further refinement of materials contained in black liquor, the extractive chemical andlignin containing compounds that are a result of the kraft pulping process;
• the further refinement of cellulose materials that are currently the basis of NBSK pulp; and
• higher use products that may be derived from wood processing.
We are working on some of these initiatives on our own and some with industry associations andothers with joint venture partners. Currently, one of the better-developed of these projects is a cellulosederivative generally referred to in the industry as “cellulose filaments”. Cellulose filaments are the result of
(27)
a new process that unbinds the individual filaments that make up a cellulose fiber. In northern softwoods,there are approximately 1,000 filaments making up a single fiber. The filaments resulting from this patentedprocess are long, ribbon-like structures that have unique strength characteristics similar to other chemicalderivatives, such as aramids. We believe that this material may have commercial potential in manyapplications, including strength enhancers, solution stabilizers and specialty solutions for numerous otherproducts and applications.
Through an industry association, we are developing a proven manufacturing process able to supplycommercial quantities of cellulose filaments. We, along with other member companies, including certainother NBSK producers, have license rights to further develop and market existing intellectual propertyregistered under patent to our industry association. Through joint development arrangements with potentialend customers, we have been developing numerous applications and end uses for cellulose filaments. Whilethere remains much work to be done, we continue to be encouraged with the results to date and intend tocontinue to expend resources to develop this technology, both individually and in joint developmentarrangements with third parties. We currently estimate expenditures totaling approximately $1.0 million in2018.
We are also researching potential higher use products that may be derived from processing differentspecies of trees.
Such research and development of various end use applications are at different levels ofdevelopment with one such application being tested at pre-commercial stages. However, there has been nocommercialization of any products to date. We currently estimate it may take about two years before we candetermine if the first product applications in the development pipeline can be commercialized. However,there can be no assurance that such research and development will ever result in commercialization or theproduction or sales of any products by us at a profit or at all.
Environmental
Our operations are subject to a wide range of environmental laws and regulations, dealing primarilywith:
• air, water and land;
• solid and hazardous waste management;
• waste disposal;
• remediation; and
• chemical usage.
We devote significant management and financial resources to comply with all applicableenvironmental laws and regulations. In particular, the operation of our plants is subject to permits,authorizations and approvals and we have to comply with prescribed emission limits. Compliance withthese requirements is monitored by local authorities and non-compliance may result in administrativeorders, fines or closures of the non-compliant mill. Our total capital expenditures on environmental projectsat our mills were approximately $4.6 million in 2017, approximately $2.9 million in 2016 andapproximately $19.4 million in 2015. In 2018, capital expenditures for environmental projects, principallycomprised of projects to reduce wastewater fees and upgrade the effluent system at our German pulp mills,are expected to be approximately $19.8 million.
Environmental compliance is a priority for our operations. To ensure compliance withenvironmental laws and regulations, we regularly monitor emissions at our mills and periodically perform
(28)
environmental audits of operational sites and procedures both with our internal personnel and outsideconsultants. These audits identify opportunities for improvement and allow us to take proactive measures atthe mills as considered appropriate.
We believe we have obtained all required environmental permits, authorizations and approvals forour operations. We believe our operations are currently in material compliance with the requirements of allapplicable environmental laws and regulations and our respective operating permits.
Under German state environmental rules relating to effluent discharges, industrial users arerequired to pay wastewater fees based upon the amount of their effluent discharge. These rules also providethat an industrial user which undertakes environmental capital expenditures and lowers certain effluentdischarges to prescribed levels may offset the amount of these expenditures against the wastewater fees thatthey would otherwise be required to pay. We expect capital investment programs and other environmentalinitiatives at our German mills will continue to offset the wastewater fees that are payable and we believethey will ensure that our operations continue in substantial compliance with prescribed standards.
Future regulations or permits may place lower limits on allowable types of emissions, including air,water, waste and hazardous materials, and may increase the financial consequences of maintainingcompliance with environmental laws and regulations or conducting remediation. Our ongoing monitoringand policies have enabled us to develop and implement effective measures to maintain emissions insubstantial compliance with environmental laws and regulations to date in a cost-effective manner.However, there can be no assurances that this will be the case in the future.
Climate Change
Over the past several years, changing weather patterns and climatic conditions due to natural andman-made causes have added to the unpredictability and frequency of natural disasters, such as hurricanes,earthquakes, hail storms, wildfires and wind, snow and ice storms. Such changes and resulting conditionscan adversely affect our operations, including variations in the cost and availability of raw materials, such asfiber, unplanned downtime and operating rates. As there are differing scientific studies relating to theseverity, extent and speed at which climate change is occurring, we cannot identify and predict all of theconsequences of climate change on our business and operations.
The effects and perceived effects of climate change and social and governmental responses havecreated both opportunities and negative consequences for our business.
The focus on climate change has generated a substantial increase in demand and in legislativerequirements for “carbon neutral” or green energy. Pulp mills consume wood residuals, being wood chipsand pulp logs, as the base raw material for their production process. Wood chips are residuals left over fromlumber production and pulp logs are generally lower quality logs left over from logging that are unsuitablefor the production of lumber. Sawmills consume sawlogs and residuals like wood chips that are generallysold to other industrial consumers like pulp and pellet producers.
As part of their production process, our pulp mills take wood residuals and process them through adigester where cellulose is separated from the wood to be used in pulp production and the remainingresiduals, called “black liquor”, are used for green energy production. As a result of their use of woodresiduals and because our mills generate combined heat and power in a process known as cogeneration, theyare efficient producers of energy. Our Friesau Facility utilizes residual bark and shavings from consumedlogs to produce energy. This energy is carbon neutral and produced from a renewable source. Our relativelymodern mills generate a substantial amount of energy that is surplus to their operational requirements.
(29)
These factors, along with governmental initiatives in respect of renewable or green energylegislation, have provided business opportunities for us to enhance our generation and sales of green energyto regional utilities.
We are constantly exploring other initiatives to enhance our generation and sales of surplus greenenergy and chemical by-products. Other potential opportunities that may result from climate changeinclude:
• the expansion of softwood forests and increased growth rates for such forests;
• more intensive forestry practices and timber salvaging versus harvesting standing timber;
• greater demand for sustainable energy and cellulosic biomass fuels; and
At this time, we cannot predict which, if any, of these potential opportunities will be realized by usor their economic effect on our business.
While all of the specific consequences to our business from climate change are not predictable, themost visible adverse consequence to date is that the focus on renewable energy has created greater demandand competition for wood residuals or fiber from renewable energy producers like the pellet industry inGermany.
In Germany, the price and supply of wood residuals have been affected by an increasing demandfrom alternative or renewable energy producers and governmental initiatives for carbon neutral energy.Declining energy prices, weaker economies or warm winters temper the demand for wood chips resultingfrom initiatives by European governments to promote the use of wood as a carbon neutral energy. Over thelong term, this non-traditional demand for fiber is expected to remain strong in Europe. Additionally, thegrowing interest and focus in British Columbia for renewable green energy has created additionalcompetition for such fiber. Such additional demand for wood residuals may increase the competition andprices for wood residuals over time.
In response to climate change risks, there have been governmental initiatives and legislation on theinternational, national, state and local levels. Such governmental action or legislation can have an importanteffect on the demand and prices for fiber. As governments pursue green energy initiatives, they risk creatingincentives and demand for wood residuals from renewable energy producers that “cannibalizes” oradversely affects traditional users, such as lumber and pulp and paper producers. We are continuallyengaged in dialogue with governments to educate and try to ensure potential initiatives recognize thetraditional and continuing role of our mills in the overall usage of forestry resources and the economies oflocal communities.
Other potential negative consequences from climate change that over time may affect our businessinclude:
• a greater susceptibility of northern softwood forests to disease, fire and insect infestation;
• the disruption of transportation systems and power supply lines due to more severe storms;
• the loss of fresh water transportation for logs and pulp due to lower water levels;
• decreases in the quantity and quality of processed water for our mill operations;
(30)
• the loss of northern softwood forests in areas in sufficient proximity to our mills tocompetitively acquire fiber; and
• lower harvest levels decreasing the supply of harvestable timber and, as a consequence,wood residuals.
Human Resources
We currently employ approximately 1,840 people. We have approximately 1,390 employeesworking in our German operations, including our wood procurement, transportation and sales subsidiaries.In Canada, we have approximately 450 employees, of which approximately 25 are employed at ourVancouver, British Columbia, office.
Rosenthal employs approximately 380 people, the majority of whom are bound by a collectiveagreement. In the third quarter of 2017, we entered into a new collective agreement with employees at ourRosenthal mill which expires in February 2019 and provides for a 2.4% annual wage increase on July 1,2017 and a further 1.2% increase on August 1, 2018.
Stendal employs approximately 475 people, the majority of which are bound by a collectiveagreement. In 2011, Stendal entered into a seven-year collective agreement expiring in 2018. In 2017,Stendal restructured its wood procurement and logistics activities to a new subsidiary, Mercer Holz GmbH,referred to as “Mercer Holz”, which employs approximately 170 people and is not party to a collectiveagreement.
Celgar employs approximately 430 people, the majority of which are bound by a collectiveagreement. In October 2017, Celgar entered into a new four-year collective agreement with its hourlyworkers which expires in April 2021. The agreement provided for annual wage increases of 2.0% in each of2017, 2018, 2019 and 2020.
The Friesau Facility employs approximately 360 people, the majority of which are bound by acollective agreement which, with a notice period, became cancellable by either party at the end of 2017. It iscontinuing to operate under the collective agreement and, while we currently expect the Friesau Facility torenew its collective agreement or enter into a new agreement, there can be no assurance that we will be ableto renew or enter into a new agreement on satisfactory terms.
We consider the relationships with our employees to be good. Although no assurances can beprovided, we have not had any significant work stoppages at any of our operations and we would thereforeexpect to enter into new labor agreements with our workers when the current labor agreements expirewithout any significant work stoppages.
Our directors and senior managers have extensive experience in the pulp, lumber and forestryindustries, along with experienced managers at all of our mills. Our management has a proven track recordof implementing new initiatives and capital projects in order to reduce costs throughout our operations aswell as identifying and harnessing new revenue opportunities.
Wood Products Industry
General
With approximately 3.7 billion cubic meters, Germany has the largest timber reserves in Europe.The principal trees are spruce, pine, beech and oak. Approximately 70 to 80 million cubic meters areharvested annually. Many of the German forest areas have been certified according to PEFC or FSCstandards. Modern solid wood products include sawn and planed lumber which are used in different areas.
(31)
Demand for softwood lumber is cyclical and influenced by transportation costs, exchange rates,government tariffs and competitiveness of substitute products, as well as factors that affect consumerconfidence and drive demand for residential construction, such as interest rates, disposable income,unemployment rates, perceived job security and other indicators of general economic conditions. Demandcan vary from region to region within a country and seasonal factors that determine optimal buildingconditions can also affect demand.
Lumber Products and Markets
Our Friesau Facility’s sawmill, which was built in 1992 and has two high-volume Linck sawlines,has the ability to produce both rough and planed products. The sawmill principally manufactures finishedsaw wood lumber milled from spruce and pine, including European metric and specialty lumber, U.S.dimensional lumber and J-grade lumber, in various sizes and grades.
The process for manufacturing lumber results in a significant percentage of each sawlog ending upas by-products or residuals such as wood chips, trim blocks, sawdust shavings and bark. By-products aretypically sold to a wide variety of customers. In addition, we utilize a significant portion of the chips fromthe Friesau Facility at our Rosenthal pulp mill.
The main markets for our lumber products are in Europe, the United States and the Far East.
Our Friesau Facility fosters a diverse customer base in each of its key markets. Customers includenational and regional distributors, large construction firms, secondary manufacturers, retail yards and homecenters.
Competition
The markets for our lumber products are highly competitive on a global basis and producerscompete generally on price, quality and service. Factors influencing our competitive position include,among others, the availability, quality and cost of raw materials, including fiber, energy and labor and theefficiency and productivity of the Friesau mill in relation to its competitors. The Friesau Facility competesin international markets subject to currency fluctuations and global business conditions.
Our Friesau Facility competes against many producers, a number of whom own and operate moremills than we do and some of our competitors have greater financial resources or lower production coststhan us.
Description of Certain Indebtedness
The following summarizes certain material provisions of our senior notes and revolving workingcapital facilities. The summaries are not complete and are qualified by reference to the applicabledocuments and the applicable amendments to such documents on file with the SEC and incorporated byreference herein.
Senior Notes
We currently have outstanding the following issues of senior notes, collectively referred to as the“Senior Notes”:
• $100.0 million in aggregate principal amount of 7.750% senior notes due 2022, referred to asthe “2022 Senior Notes”;
(32)
• $250.0 million in aggregate principal amount of 6.500% senior notes due 2024, referred to asthe “2024 Senior Notes”; and
• $300.0 million in aggregate principal amount of 5.500% senior notes due 2026, referred to asthe “2026 Senior Notes”.
The 2026 Senior Notes were issued in December 2017 and the net proceeds, along with cash onhand, were used on January 5, 2018 to redeem $300.0 million of 2022 Senior Notes at a redemption price of$1,058.13 per $1,000 of principal amount redeemed plus accrued and unpaid interest.
The 2022 Senior Notes mature on December 1, 2022 and interest is payable semi-annually inarrears on each June 1 and December 1. Interest is payable to holders of record of the 2022 Senior Notes onthe immediately preceding May 15 and November 15 and is computed on the basis of a 360-day yearconsisting of twelve 30-day months. Commencing December 1, 2017, the 2022 Senior Notes becameredeemable at our option at a price equal to 105.813% of the principal amount redeemed and decliningratably on December 1 of each year thereafter to 100.000% on or after December 1, 2020.
The 2024 Senior Notes mature on February 1, 2024 and interest on the 2024 Senior Notes ispayable semi-annually in arrears on each February 1 and August 1. Interest is payable to holders of recordof the 2024 Senior Notes on the immediately preceding January 15 and July 15 and is computed on the basisof a 360-day year consisting of twelve 30-day months. Commencing February 1, 2020, the 2024 SeniorNotes will become redeemable at our option at a price equal to 103.250% of the principal amount redeemedand declining ratably on February 1 of each year thereafter to 100.000% on or after February 1, 2022.
The 2026 Senior Notes mature on January 15, 2026 and interest on the 2026 Senior Notes ispayable semi-annually in arrears on each January 15 and July 15. Commencing July 15, 2018, interest ispayable to holders of record of the 2026 Senior Notes on the immediately preceding January 1 and July 1and is computed on the basis of a 360-day year consisting of twelve 30-day months. CommencingJanuary 15, 2021, the 2026 Senior Notes will become redeemable at our option at a price equal to 102.750%of the principal amount redeemed and declining ratably on January 15 of each year thereafter to 100.000%on or after January 15, 2023.
The indentures governing the Senior Notes contain covenants limiting, among other things, ourability and the ability of our restricted subsidiaries to: incur additional indebtedness or issue preferred stock;pay dividends or make other distributions to our shareholders; purchase or redeem capital stock orsubordinated indebtedness; make investments; create liens; incur restrictions on the ability of our restrictedsubsidiaries to pay dividends or make other payments to us; sell assets; consolidate or merge with or intoother companies or transfer all or substantially all of our assets; and engage in transactions with affiliates.As of December 31, 2017, all of our subsidiaries were restricted subsidiaries.
The Senior Notes are unsecured and are not guaranteed by any of our operating subsidiaries, all ofwhich are located outside the United States. Our obligations under the Senior Notes rank: effectively juniorin right of payment to all of our existing and future secured indebtedness, to the extent of the assets securingsuch indebtedness, and all indebtedness and liabilities of our subsidiaries; equal in right of payment with allof our existing and future unsecured senior indebtedness; and senior in right of payment to any of our futuresubordinated indebtedness.
(33)
Stendal Revolving Credit Facility
Our Stendal mill has a €75.0 million revolving credit facility, referred to as the “Stendal RevolvingCredit Facility”, with a syndicate of four banks as original lenders. The principal terms of the StendalRevolving Credit Facility include:
• The total availability under the facility is €75.0 million.
• The facility matures on October 31, 2019.
• The facility may be utilized in the form of cash advances or advances by letters of credit orbank guarantees of up to €5.0 million. Borrowings accrue interest at a rate of Euribor plusa 3.50% margin. Fees of 2.25% per annum are payable on issued but undrawn letters ofcredit and bank guarantees. There is a commitment fee of 1.10% per annum payable onunused availability.
• The facility is secured by a first ranking registered security interest on the inventories andreceivables of Stendal. All shareholder loans made by Mercer Inc. to Stendal aresubordinated to the indebtedness under the facility.
• The facility contains financial maintenance covenants which are tested semi-annually onJune 30 and December 31, which require Stendal to maintain (i) a leverage ratio of “netdebt” (excluding shareholder loans) to EBITDA of not greater than 2.50:1.00, (ii) aninterest coverage ratio (EBITDA to interest expense) of not less than 1.20:1.00 and (iii) acurrent ratio (current assets to current liabilities) of at least 1.10:1.00.
• Stendal is permitted under the facility to make (i) distributions for regularly scheduledinterest payments on its shareholder loans from Mercer Inc. in an amount of up to$23.0 million per year, provided it maintains pro forma liquidity (availability under thefacility plus unencumbered cash) of at least €20.0 million and no event of default isoccurring and (ii) other distributions to Mercer Inc. semi-annually, provided it maintainspro forma liquidity of at least €20.0 million, no event of default is occurring and it has(A) a leverage ratio (excluding shareholder loans) of not greater than 2.50:1.00, (B) atrailing six-month interest coverage ratio of at least 1.40:1.00 and (C) a current ratio of atleast 1.25:1.00.
• The facility contains other customary restrictive covenants which, among other things,govern the ability of Stendal to incur liens, sell assets, incur indebtedness, makeinvestments, enter into joint ventures, change its business and issue, repurchase or redeemshares. The facility also contains customary events of default.
As at December 31, 2017, the total amount of funds available under the Stendal Revolving CreditFacility was €75.0 million.
Rosenthal Credit Facilities
In connection with the acquisition of the Friesau Facility in April 2017, we replaced Rosenthal’sprior €25.0 million revolving credit facility with a joint revolving facility for our Rosenthal mill and theFriesau Facility, referred to as the “Rosenthal Joint Revolving Facility”, in the principal amount of€70.0 million. The principal terms of the Rosenthal Joint Revolving Facility include:
• The total availability under the facility is €70.0 million.
(34)
• The facility matures in April 2022.
• The Rosenthal mill has full access to the whole available amount under the facility andMTP has access to a maximum of €45.0 million.
• Borrowings under the facility are collateralized by the borrowers’ inventory and accountsreceivable and bear interest at Euribor plus 2.95%.
• The facility is secured by a first ranking registered security interest on the inventories andreceivables of the borrower. All shareholder loans made by Mercer Inc. to the borrower aresubordinated to the indebtedness under the facility.
• The facility contains financial maintenance covenants which are tested semi-annually onJune 30 and December 31, which require: (i) Rosenthal to maintain until June 30, 2018 aleverage ratio of “net debt” (excluding shareholder loans) to EBITDA of not greater than3.00:1.00; (ii) a current ratio (current assets to current liabilities) of at least 1.10:1.00; and(iii) thereafter the borrowers to maintain a net debt to EBITDA of not greater than3:50:1.00 and the same current ratio.
• The facility contains other customary restrictive covenants which, among other things,govern the ability of the Borrowers to incur liens, sell assets, incur indebtedness, makeinvestments, enter into joint ventures, change its business and issue, repurchase or redeemshares. The facility also contains customary events of default.
As at December 31, 2017, approximately €21.0 million ($25.2 million) of this facility was drawnand approximately €9.0 million ($10.8 million) of this facility was supporting bank guarantees leavingapproximately €40.0 million ($47.9 million) available.
Our Rosenthal mill also has a €5.0 million revolving credit facility which bears interest at the rateof the three-month Euribor plus 2.5%. Borrowings under this agreement are secured by certain land at theRosenthal mill. The facility matures in December 2018. As at December 31, 2017, €3.1 million ($3.7million) was supporting bank guarantees and €1.9 million ($2.3 million) was available under this facility.
Celgar Working Capital Facility
Our Celgar mill has a C$40.0 million revolving credit facility with a Canadian bank, referred to asthe “Celgar Working Capital Facility”. The principal terms of the facility include:
• The total availability under the facility is C$40.0 million.
• The facility matures in May 2019.
• The facility is available by way of: (i) Canadian and U.S. denominated advances, whichbear interest at a designated prime rate per annum; (ii) banker’s acceptance equivalentloans, which bear interest at the applicable Canadian dollar banker’s acceptance plus1.50% per annum; and (iii) dollar LIBOR advances, which bear interest at LIBOR plus1.50% per annum.
• The facility includes a C$3.0 million sub-limit for letters of credit. Celgar is required topay 0.25% per annum on unused availability under the facility and 1.25% per annum onissued but undrawn letters of credit.
(35)
• The availability of the facility is subject to a borrowing base limit that is based on theCelgar mill’s eligible receivable and inventory levels from time to time.
• The Celgar Working Capital Facility is secured by, among other things, a first prioritycharge on the inventories and receivables of Celgar.
• The facility includes a springing financial covenant, which is measured when excessavailability under the facility is less than C$5.0 million and which requires Celgar tocomply with a 1.10:1.00 fixed charge coverage ratio.
• The facility also contains restrictive covenants which, among other things, restrict theability of Celgar to declare and pay dividends, incur indebtedness, incur liens and makepayments on subordinated debt. The facility contains customary events of default.
As at December 31, 2017, the total amount of funds available under the Celgar Working CapitalFacility was C$38.3 million ($30.5 million).
Mercer Holz
In 2018, our subsidiary, Mercer Holz, entered into a new €25.0 million revolving borrowing basecredit facility agreement with a German bank, referred to as the “Holz Facility”. The principal terms of theHolz Facility include:
• The total availability under the Facility is €25.0 million.
• The facility matures in February 2020 and, with the consent of the lender, may be extendedfor a further one-year period.
• The facility is available through: (i) cash advances in a minimum amount of €1.0 million;and (ii) letters of credit/bank guarantees in the maximum amount of the issuing bank’savailable commitment under the facility, each of which bear interest at 3.3% per annumplus EURIBOR.
• The availability of the facility is subject to a borrowing base limit that is based on the cashcollateral, eligible receivables and eligible inventory levels of Mercer Holz from time totime, less eligible payables.
• The facility is secured by, among other things, a first ranking security on the receivables ofMercer Holz and a pledge of its inventories.
• The facility also contains restrictive covenants which, among other things, restrict theability of Mercer Holz to declare and pay dividends, incur indebtedness, incur liens andmake payments on subordinated debt. The facility contains customary events of default.
Internet Availability and Additional Information
We make available free of charge, on or through our website at www.mercerint.com, annual reportson Form 10-K, quarterly reports on Form 10-Q and current reports on Form 8-K, and all amendments tothese reports, as soon as reasonably practicable after we file these materials with, or furnish these materialsto, the SEC. The public may read and copy any material we file with the SEC at the SEC’s Public Reference
(36)
Room at 100 F Street, NE, Washington, DC 20549. The public may also obtain information on theoperation of the Public Reference Room by calling the SEC at 1-800-SEC-0330. The SEC maintains aninternet site at www.sec.gov that also contains our current and periodic reports, including our proxy andinformation statements.
All websites referred to herein are inactive textual references only, meaning that the informationcontained on such websites is not incorporated by reference herein and you should not consider informationcontained on such websites as part of this document unless expressly specified.
(37)
ITEM 1A. RISK FACTORS
The statements in this “Risk Factors” section describe material risks to our business and should beconsidered carefully. You should review carefully the risk factors listed below, as well as those factorslisted in other documents we file with the SEC. In addition, these statements constitute our cautionarystatements under the Private Securities Litigation Reform Act of 1995. Our disclosure and analysis in thisannual report on Form 10-K and in our annual report to shareholders contain some forward-lookingstatements that set forth anticipated results based on management’s current plans and assumptions.
There are a number of important factors, many of which are beyond our control that could causeactual conditions, events or results to differ significantly from those described in the forward-lookingstatements. These factors include, but are not limited to, the following:
• our business is highly cyclical in nature;
• a weakening of the global economy, including capital and credit markets, could adverselyaffect our business and financial results and have a material adverse effect on our liquidityand capital resources;
• our level of indebtedness could negatively impact our financial condition, results ofoperations and liquidity;
• cyclical fluctuations in the price and supply of our raw materials, particularly fiber, couldadversely affect our business;
• we face intense competition in our markets;
• we are exposed to currency exchange rate fluctuations;
• we are subject to extensive environmental regulation and we could incur substantial costsas a result of compliance with, violations of or liabilities under applicable environmentallaws and regulations;
• our business is subject to risks associated with climate change and social and governmentresponses thereto;
• our operations require substantial capital and we may be unable to maintain adequatecapital resources to provide for such capital requirements;
• our acquisition of the Friesau Facility and other future acquisitions may result in additionalrisks and uncertainties in our business;
• fluctuations in prices and demand for lumber could adversely affect our business;
• adverse housing market conditions may increase the credit risk from customers of ourFriesau Facility;
• our Friesau Facility’s lumber products are vulnerable to declines in demand due tocompeting technologies or materials;
• changes in credit ratings issued by nationally recognized statistical rating organizationscould adversely affect our cost of financing and have an adverse effect on the market priceof our securities;
• we rely on government grants and participate in German statutory energy programs;
• we are subject to risks related to our employees;
• we are dependent on key personnel;
(38)
• we may experience material disruptions to our production;
• if our long-lived assets become impaired, we may be required to record non-cashimpairment charges that could have a material impact on our results of operations;
• we may incur losses as a result of unforeseen or catastrophic events, including theemergence of a pandemic, terrorist attacks or natural disasters;
• our insurance coverage may not be adequate;
• we rely on third parties for transportation services;
• we periodically use derivatives to manage certain risks which has caused significantfluctuations in our operating results;
• failures or security breaches of our information technology systems could disrupt ouroperations and negatively impact our business;
• the price of our common stock may be volatile;
• a small number of our shareholders could significantly influence our business;
• our international sales and operations are subject to applicable laws relating to trade,export controls and foreign corrupt practices, the violation of which could adversely affectour operations; and
• we are exposed to interest rate fluctuations.
From time to time, we also provide forward-looking statements in other materials we release aswell as oral forward-looking statements. Such statements give our current expectations or forecasts of futureevents; they do not relate strictly to historical or current facts.
Statements in the future tense, and all statements accompanied by terms such as “may”, “will”,“believe”, “project”, “expect”, “estimate”, “assume”, “intend”, “design”, “anticipate”, “plan”, “should” andvariations thereof and similar terms are intended to be forward-looking statements as defined by federalsecurities law. You can find examples of these statements throughout this annual report on Form 10-K,including in the description of business in Item 1. “Business” and Item 7. “Management’s Discussion andAnalysis of Financial Condition and Results of Operations”. While these forward-looking statements reflectour best estimates when made, the following risk factors could cause actual results to differ materially fromestimates or projections.
We intend that all forward-looking statements we make will be subject to safe harbor protection ofthe federal securities laws pursuant to Section 27A of the Securities Act of 1933, as amended andSection 21E of the Securities Exchange Act of 1934, as amended.
You should consider the limitations on, and risks associated with, forward-looking statements andnot unduly rely on the accuracy of predictions contained in such forward-looking statements. As notedabove, these forward-looking statements speak only as of the date when they are made. We do notundertake any obligation to update forward-looking statements to reflect events, circumstances, changes inexpectations, or the occurrence of unanticipated events after the date of those statements. Moreover, in thefuture, we may make forward-looking statements that involve the risk factors and other matters described inthis document as well as other risk factors subsequently identified.
Our business is highly cyclical in nature.
The pulp and lumber businesses are highly cyclical in nature and markets are characterized byperiods of supply and demand imbalance, which in turn can materially affect prices. Pulp and lumber
(39)
markets are sensitive to cyclical changes in the global economy, industry capacity and foreign exchangerates, all of which can have a significant influence on selling prices and our operating results. The lengthand magnitude of industry cycles have varied over time but generally reflect changes in macro-economicconditions and levels of industry capacity. Pulp and lumber are commodities that are generally availablefrom other producers. Because commodity products have few distinguishing qualities from producer toproducer, competition is generally based upon price, which is generally determined by supply relative todemand.
Industry capacity can fluctuate as changing industry conditions can influence producers to idleproduction capacity or permanently close mills. In addition, to avoid substantial cash costs in idling orclosing a mill, some producers will choose to operate at a loss, sometimes even a cash loss, which canprolong weak pricing environments due to oversupply. Oversupply of our products can also result fromproducers introducing new capacity in response to favorable pricing trends. Certain integrated pulp andpaper producers have the ability to discontinue paper production by idling their paper machines and sellingtheir NBSK pulp production on the market, if market conditions, prices and trends warrant such actions.
Producers have announced projects to increase hardwood kraft pulp capacity by an aggregate ofabout 2.0 million ADMTs in 2018. This increase in bleached hardwood kraft pulp is largely targeted at thegrowing demand for pulp in developing markets, particularly in China, by producers of tissues, specialtypapers and packaging. If such additional bleached hardwood kraft pulp supply is not absorbed by suchdemand growth, as a result of generally lower prices for bleached hardwood kraft pulp, this supply increasecould put downward pressure on NBSK pulp prices.
Producers have also publicly announced an additional 1.0 million ADMTs of NBSK pulp capacityto come online in Europe in mid-2018. At this time, we cannot predict how much of the publicly announcedcapacity will come on line and when. If such new capacity, particularly for NBSK pulp, is not absorbed inthe market or offset by curtailments or closures of older, high-cost NBSK pulp mills, the increase could putdownward pressure on NBSK pulp prices and materially adversely affect our results of operations, margin,and profitability.
Demand for each of pulp and lumber has historically been determined primarily by general globalmacro-economic conditions and has been closely tied to overall business activity. NBSK pulp prices havebeen and are likely to continue to be volatile and can fluctuate widely over time. Between 2008 and 2017,European list prices for NBSK pulp have fluctuated between a low of approximately $575 per ADMT in2009 to a high of $1,030 per ADMT in late 2017.
Our mills and operations voluntarily subject themselves to third-party certification as to compliancewith internationally recognized, sustainable management standards because end use paper and lumbercustomers have shown an increased interest in understanding the origin of products they purchase. Demandfor our products could be adversely affected if we, or our suppliers, are unable to achieve compliance, or areperceived by the public as failing to comply, with these standards or if our customers require compliancewith alternate standards for which our operations are not certified.
A producer’s actual sales price realizations are list prices net of customer discounts, rebates andother selling concessions. Over the last three years, these have increased for pulp sales as pulp producerscompete for customers and sales. Our pulp sales price realizations may also be affected by NBSK pricemovements between the order and shipment dates.
Accordingly, prices for pulp and lumber are driven by many factors outside our control, and wehave little influence over the timing and extent of price changes, which are often volatile. Because market
(40)
conditions beyond our control determine the prices for pulp and lumber, prices may fall below our cashproduction costs, requiring us to either incur short-term losses on product sales or cease production at one ormore of our mills. Therefore, our profitability depends on managing our cost structure, particularly rawmaterials which represent a significant component of our operating costs and can fluctuate based uponfactors beyond our control. If the prices of our products decline, or if prices for our raw materials increase,or both, our results of operations and cash flows could be materially adversely affected.
A weakening of the global economy, including capital and credit markets, could adversely affect ourbusiness and financial results and have a material adverse effect on our liquidity and capital resources.
As demand for our products has principally historically been determined by general global macro-economic activities, demand and prices for our products have historically decreased substantially duringeconomic slowdowns. A significant economic downturn may affect our sales and profitability. Further, oursuppliers and customers may also be adversely affected by an economic downturn. Additionally, restrictedcredit and capital availability restrains our customers’ ability or willingness to purchase our productsresulting in lower revenues. Depending on their severity and duration, the effects and consequences of aglobal economic downturn could have a material adverse effect on our liquidity and capital resources,including our ability to raise capital, if needed, and otherwise negatively impact our business and financialresults.
Our level of indebtedness could negatively impact our financial condition, results of operations andliquidity.
As of December 31, 2017, as adjusted for the redemption, on January 5, 2018, of $300.0 million of2022 Senior Notes, we have approximately $663.0 million of indebtedness outstanding. We may also incuradditional indebtedness in the future. Our high debt levels may have important consequences for us,including, but not limited to the following:
• our ability to obtain additional financing for working capital, capital expenditures, generalcorporate and other purposes or to fund future operations may not be available on termsfavorable to us or at all;
• a significant amount of our operating cash flow is dedicated to the payment of interest andprincipal on our indebtedness, thereby diminishing funds that would otherwise be availablefor our operations and for other purposes;
• increasing our vulnerability to current and future adverse economic and industryconditions;
• a substantial decrease in net operating cash flows or increase in our expenses could make itmore difficult for us to meet our debt service requirements, which could force us to modifyour operations;
• our leveraged capital structure may place us at a competitive disadvantage by hinderingour ability to adjust rapidly to changing market conditions or by making us vulnerable to adownturn in our business or the economy in general;
• causing us to offer debt or equity securities on terms that may not be favorable to us or ourshareholders;
• limiting our flexibility in planning for, or reacting to, changes and opportunities in ourbusiness and our industry; and
• our level of indebtedness increases the possibility that we may be unable to generate cashsufficient to pay the principal or interest due in respect of our indebtedness.
(41)
The indentures that govern our Senior Notes and our bank credit facilities contain restrictivecovenants which impose operating and other restrictions on us and our subsidiaries. These restrictions willaffect, and in many respects will limit or prohibit, our ability to, among other things, incur or guaranteeadditional indebtedness, pay dividends or make distributions on capital stock or redeem or repurchasecapital stock, make investments or acquisitions, create liens and enter into mergers, consolidations ortransactions with affiliates. The terms of our indebtedness also restrict our ability to sell certain assets, applythe proceeds of such sales and reinvest in our business.
Certain of the agreements governing our indebtedness have covenants that require us to maintainprescribed financial ratios and tests. Failure to comply with such covenants could result in events of defaultand could have a material adverse effect on our liquidity, results of operations and financial condition.
Our ability to repay or refinance our indebtedness will depend on our future financial and operatingperformance. Our performance, in turn, will be subject to prevailing economic and competitive conditions,as well as financial, business, legislative, regulatory, industry and other factors, many of which are beyondour control. Our ability to meet our future debt service and other obligations may depend in significant parton the extent to which we can successfully implement our business strategy. We cannot assure you that wewill be able to implement our strategy fully or that the anticipated results of our strategy will be realized.Over the next several years, we will require financing to refinance maturing debt obligations (unlessextended), and such refinancing may not be available on favorable terms or at all.
Cyclical fluctuations in the price and supply of our raw materials, particularly fiber, could adverselyaffect our business.
Our main raw material is fiber in the form of wood chips, pulp logs and sawlogs. Fiber representedapproximately 56% of our pulp cash production costs and approximately 80% of our lumber cashproduction costs in 2017. Fiber is a commodity and both prices and supply are cyclical. Fiber pricing issubject to regional market influences and our costs of fiber may increase in a region as a result of localmarket shifts. The cost of wood chips, pulp logs and sawlogs is primarily affected by the supply anddemand for lumber. Demand for these raw materials is generally determined by the volume of pulp andpaper products and wood products produced globally and regionally. Governmental regulations related tothe environment, forest stewardship and green or renewable energy can also affect the supply of fiber. InGermany, governmental initiatives to increase the supply of renewable energy have led to more renewableenergy projects in Europe, including Germany. Demand for wood residuals from such energy producers,combined with lower harvesting rates, has generally put upward pressure on prices for wood residuals, suchas wood chips, in Germany and its neighboring countries. This has resulted in higher fiber costs for ourGerman pulp mills and such trend could continue to put further upward pressure on wood chip prices. Woodchip supply in Germany was stable during the last three years due to stable sawmill production and lowerdemand from pellet producers and board manufacturers; however, there is no assurance that wood chipsupply will continue to be stable or that supply will not be reduced or that fiber costs will not increase in thefuture.
Similarly, North American sawmill activity declined significantly during the recession, reducingthe supply of chips and availability of pulp logs to our Celgar mill. Additionally, North American energyproducers are exploring the viability of renewable energy initiatives and governmental initiatives in thisfield are increasing, all of which could lead to higher demand for sawmill residual fiber, including chips. Arecovery in U.S. housing starts, which commenced in the latter part of 2012 and has continued through2017, resulted in increased sawmill activity. This increased the supply of wood chips for the Celgar mill andreduced its need for pulp logs, which are generally a higher cost for the mill than wood chips. Sawmillactivity was stable in Canada during 2016 and 2017; however, there is no assurance that sawmill activitywill continue to remain stable or that fiber prices will not increase in the future.
(42)
The 2006 Softwood Lumber Agreement, which governed softwood lumber exports from Canada tothe United States, expired in 2015, and a one-year post-expiration period during which the United Statesagreed not to impose trade sanctions expired in October 2016. In November 2016, a petition was filed by acoalition of U.S. lumber producers to the U.S. Department of Commerce and the U.S. International TradeCommission requesting an investigation into alleged subsidies provided to Canadian lumber producers. InDecember 2017, the U.S. International Trade Commission published its final injury determination. In late2017, the U.S. Department of Commerce announced its final countervailing and anti-dumping duty rates,which set out a countervailing duty of 14.19% and an anti-dumping rate of 6.04% for “all other” Canadianlumber producers. The U.S. Department of Commerce also concluded that critical circumstances did notexist for countervailing duties, but did exist for anti-dumping duties. The Canadian forest products industryand Canadian Federal and Provincial governments have denied the U.S. Department of Commerce’sallegations. Canada has announced an appeal of the duties to the NAFTA appeal panel and the World TradeOrganization. It is uncertain when or if the United States and Canada may settle a new agreement and whatterms or restrictions it may contain. Any duties or other restrictions imposed on Canadian softwood lumberexports by the United States could negatively impact Canadian sawmill production in our Celgar mill’ssupply area and result in reduced availability and increased costs for wood chips for the mill. While webelieve this may be partially offset by increased wood chip supply from U.S. sawmills and pulp logavailability, we cannot currently predict the overall effect on our Celgar mill’s overall fiber costs.
Availability of fiber may be further limited by adverse responses to and prevention of wildfires,weather, insect infestation, disease, ice storms, wind storms, flooding and other natural causes. In addition,the quantity, quality and price of fiber we receive could be affected by man-made causes such as thoseresulting from industrial disputes, material curtailments or shut-down of operations by suppliers,government orders and legislation (including new taxes or tariffs). Any or a combination of these can affectfiber prices in a region.
The cyclical nature of pricing for fiber represents a potential risk to our profit margins if pulp andlumber producers are unable to pass along price increases to their customers or we cannot offset such coststhrough higher prices for our surplus energy.
We do not own any timberlands or have any material long-term governmental timber concessionsand we currently have few long-term fiber contracts at our German operations. Fiber is available from anumber of suppliers and we have not historically experienced material supply interruptions or substantialsustained price increases. However, our requirements have increased and may continue to do so as weexpand capacity through capital projects or other efficiency measures at our mills. As a result, we may notbe able to purchase sufficient quantities of these raw materials to meet our production requirements at pricesacceptable to us during times of tight supply. An insufficient supply of fiber or reduction in the quality offiber we receive would materially adversely affect our business, financial condition, results of operationsand cash flow.
In addition to the supply of fiber, we are, to a lesser extent, dependent on the supply of certainchemicals and other inputs used in our production facilities. Any disruption in the supply of these chemicalsor other inputs could affect our ability to meet customer demand in a timely manner and could harm ourreputation. Any material increase in the cost of these chemicals or other inputs could have a materialadverse effect on our business, results of operations, financial condition and cash flows.
We face intense competition in our markets.
We sell our pulp and lumber globally, with a large percentage sold in Europe, Asia and NorthAmerica. The markets for pulp and lumber are highly competitive. A number of other global companies
(43)
compete in each of these markets and no company holds a dominant position. Our pulp and lumber areconsidered commodities because many companies produce similar and largely standardized products. As aresult, the primary basis for competition in our markets has been price. Many of our competitors havegreater resources and lower leverage than we do and may be able to adapt more quickly to industry ormarket changes or devote greater resources to the sale of products than we can. There can be no assurancethat we will continue to be competitive in the future. Prices for our products are affected by many factorsoutside of our control and we have no influence over the timing and extent of price changes, which are oftenvolatile. Our ability to maintain satisfactory margins depends, in large part, on managing our costs,particularly raw material and energy costs which represent significant components of our operating costsand can fluctuate based upon factors beyond our control.
Global pulp and lumber markets have historically been characterized by considerable swings inprices which have and will result in variability in our earnings.
We are exposed to currency exchange rate fluctuations.
We have manufacturing operations in Germany and Canada. Most of the operating costs andexpenses of our German mills are incurred in euros and those of our Celgar mill in Canadian dollars.However, the majority of our sales are in products quoted in dollars. Our results of operations and financialcondition are reported in dollars. As a result, our costs generally benefit from a strengthening dollar but areadversely affected by a decrease in the value of the dollar relative to the euro and to the Canadian dollar.Such declines in the dollar relative to the euro and the Canadian dollar reduce our operating margins and thecash flow available to fund our operations and to service our debt. This could have a material adverse effecton our business, financial condition, results of operations and cash flows.
Further, while a strengthening dollar generally lowers our costs and expenses, it increases the costof NBSK pulp to our customers and generally puts downward pressure on pulp prices and reduces ourEuropean lumber, energy and chemical sales revenues as they are sold in euros and Canadian dollars.
Although we report in dollars, we hold certain assets and liabilities, including our mills, in eurosand Canadian dollars. We translate foreign denominated assets and liabilities into dollars at the rate ofexchange on the balance sheet date. Equity accounts are translated using historical exchange rates.Unrealized gains or losses from these translations are recorded in our other comprehensive income (loss)and do not affect our net earnings, operating income or Operating EBITDA.
Certain intercompany dollar advances between Mercer Inc. and its foreign subsidiaries are held ineuros and Canadian dollars and certain foreign subsidiaries hold some cash and other balances in dollars.When such advances and cash and other balances are translated by these subsidiaries into the applicablelocal currency at the end of each reporting period, the gains or losses thereon are reflected in net earnings.
We are subject to extensive environmental regulation and we could incur substantial costs as a result ofcompliance with, violations of or liabilities under applicable environmental laws and regulations.
Our operations are subject to numerous environmental laws and regulations as well as permits,guidelines and policies relating to the protection of the environment. These laws, regulations, permits,guidelines and policies govern, among other things:
• unlawful discharges to land, air, water and sewers;
• waste collection, storage, transportation and disposal;
• hazardous waste;
(44)
• dangerous goods and hazardous materials and the collection, storage, transportation anddisposal of such substances;
• the clean-up of unlawful discharges;
• land use planning;
• municipal zoning; and
• employee health and safety.
In addition, as a result of our operations, we may be subject to remediation, clean-up or otheradministrative orders or amendments to our operating permits, and we may be involved from time to time inadministrative and judicial proceedings or inquiries. Future orders, proceedings or inquiries could have amaterial adverse effect on our business, financial condition and results of operations. Environmental lawsand land use laws and regulations are constantly changing. New regulations or the increased enforcement ofexisting laws could have a material adverse effect on our business and financial condition. In addition,compliance with regulatory requirements is expensive, at times requiring the replacement, enhancement ormodification of equipment, facilities or operations. There can be no assurance that we will be able tomaintain our profitability by offsetting any increased costs of complying with future regulatoryrequirements.
We are subject to liability for environmental damage at the facilities that we own or operate,including damage to neighboring landowners, residents or employees, particularly as a result of thecontamination of soil, groundwater or surface water and especially drinking water. The costs of suchliabilities can be substantial. Our potential liability may include damages resulting from conditions existingbefore we purchased or operated these facilities. We may also be subject to liability for any offsiteenvironmental contamination caused by pollutants or hazardous substances that we or our predecessorsarranged to transport, treat or dispose of at other locations. In addition, we may be held legally responsiblefor liabilities as a successor owner of businesses that we acquire or have acquired. Except for Stendal, ourfacilities have been operating for decades and we have not done invasive testing to determine whether or towhat extent any such environmental contamination exists. As a result, these businesses may have liabilitiesfor conditions that we discover or that become apparent, including liabilities arising from non-compliancewith environmental laws by prior owners. Because of the limited availability of insurance coverage forenvironmental liability, any substantial liability for environmental damage could materially adversely affectour results of operations and financial condition.
We have incurred, and we expect to continue to incur, significant capital, operating and otherexpenditures as a result of complying with applicable environmental laws and regulations.
Further, enactment of new environmental laws or regulations, changes in existing laws orregulations or the interpretation of these laws and regulations might require significant capital expenditures.We may be unable to generate sufficient funds or access other sources of capital to fund unforeseenenvironmental liabilities or expenditures.
Our business is subject to risks associated with climate change and social and government responsesthereto.
Our operations and those of our suppliers are subject to climate change variations which can impactthe productivity of forests, the abundance of species, harvest levels and lumber. Further, over the last fewyears, changing weather patterns and climate conditions due to natural and man-made causes have added tothe frequency and unpredictability of natural disasters like earthquakes, storms, wildfires and wind, snow
(45)
and ice storms. One or a combination of these factors could adversely affect our fiber supply which is ourlargest cash production cost. There are differing scientific studies and opinions relating to the severity,extent and speed at which climate change is or may be occurring around the world. As a result, we arecurrently unable to identify and predict all of the specific consequences of climate change on our businessand operations.
Further, governmental initiatives in response to climate change also have an impact on operations.There continue to be numerous international, country-level and regional initiatives to address global andcountry specific climate issues.
In Germany, government and social focus on and demand for “carbon neutral” or green energy hascreated greater demand and competition for the wood residuals or fiber that is consumed by our pulp millsas part of their production processes. This has helped drive up the cost of fiber for German mills. Inaddition, further or new governmental initiatives or legislation may also increase both the demand andprices for wood residuals. As governments pursue green energy initiatives, they may implement financial,tax, pricing or other legislated incentives for renewable energy producers that “cannibalize” or materiallyadversely affect fiber supplies for existing traditional users, such as lumber and pulp and paper producers.
Such additional demand for wood residuals and/or governmental initiatives may materially increasethe competition and prices for wood residuals over time. This could increase our fiber costs and/or restrictour ability to acquire fiber at competitive prices or at all during times of shortages. If our fiber costs increaseand we cannot pass on these costs to our customers or offset them through higher prices for our sales ofsurplus energy, it will negatively affect our operating margins, results of operations and financial position.If we cannot obtain the fiber required to operate our mills, we may have to curtail and/or shut downproduction. This could have a material adverse effect on operations, financial results and financial position.
Other potential risks to our business from climate change include:
• a greater susceptibility of northern softwood forests to disease, fire and insect infestation,which could diminish fiber availability;
• the disruption of transportation systems and power supply lines due to more severe storms;
• the loss of fresh water transportation for logs and pulp due to lower water levels;
• decreases in the quantity and quality of processed water for our mill operations;
• the loss of northern softwood forests in areas in sufficient proximity to our mills tocompetitively acquire fiber; and
• lower harvest levels decreasing the supply of harvestable timber and, as a consequence,wood residuals.
The occurrence of any or a combination of these events could have a material adverse effect on ouroperations and/or financial results.
Our operations require substantial capital and we may be unable to maintain adequate capital resourcesto provide for such capital requirements.
Our business is capital intensive and requires that we regularly incur capital expenditures tomaintain our equipment, improve efficiencies and, as a result of changes to environmental regulations thatrequire capital expenditures, bring our operations into compliance with such regulations. In addition, wemay approve projects in the future that will require significant capital expenditures. Increased capital
(46)
expenditures could have a material adverse effect on our cash flow and our ability to satisfy our debtobligations. If our available cash resources and cash generated from operations are not sufficient to fund ouroperating needs and capital expenditures, we would have to obtain additional funds from borrowings orother available sources or reduce or delay our capital expenditures. Our indebtedness could adversely affectour financial health, limit our operations or impair our ability to raise additional capital. If this occurs, wemay not be able to obtain additional funds on favorable terms or at all. If we cannot maintain or upgrade ourequipment as may be required from time to time, we may become unable to manufacture products thatcompete effectively. An inability to make required capital expenditures in a timely fashion could have amaterial adverse effect on our growth, business, financial condition or results of operations.
Our acquisition of the Friesau Facility and other future acquisitions may result in additional risks anduncertainties in our business.
In order to grow our business, we may seek to acquire additional assets or companies, including ourrecently completed acquisition of the Friesau Facility. Our ability to pursue selective and accretiveacquisitions will be dependent on management’s ability to identify, acquire and develop suitable acquisitiontargets in both new and existing markets. In pursuing acquisition and investment opportunities, we facecompetition from other companies having similar growth strategies, many of which may have substantiallygreater resources than us. Competition for these acquisitions or investment targets could result in increasedacquisition or investment prices, higher risks and a diminished pool of businesses or assets available foracquisition.
Acquisitions also frequently result in recording of goodwill and other intangible assets, which aresubject to potential impairments in the future that could have a material adverse effect on our operatingresults. Furthermore, the costs of integrating acquired businesses (including restructuring charges associatedwith the acquisitions, as well as other acquisition costs, such as accounting fees, legal fees and investmentbanking fees) could significantly impact our operating results.
Although we perform diligence on the businesses we purchase, in light of the circumstances of eachtransaction, an unavoidable level of risk remains regarding the actual condition of these businesses. We maynot be able to ascertain the value or understand the potential liabilities of the acquired businesses and theiroperations until we assume operating control of the assets and operations of these businesses.
Furthermore, our recently completed acquisition of the Friesau Facility and other futureacquisitions could entail a number of risks, including:
• problems with the effective integration of operations;
• inability to maintain key pre-acquisition business relationships;
• increased operating costs;
• exposure to substantial unanticipated liabilities; and
• difficulties in realizing projected efficiencies, synergies and cost savings.
In addition, geographic and other expansions, acquisitions or joint ventures may require significantmanagerial attention, which may be diverted from our other operations. If we are unsuccessful inovercoming these risks, our business, financial condition or results of operations could be materially andadversely affected.
Fluctuations in prices and demand for lumber could adversely affect our business.
The financial performance of the Friesau Facility depends on the demand for and selling price oflumber, which is subject to significant fluctuations. The markets for lumber are highly volatile and are
(47)
affected by economic conditions in Europe, Asia and the United States, the strength of housing markets insuch regions, the growing importance of the Asian market, changes in industry production capacity, changesin inventory levels and other factors beyond our control. Additionally, interest rates have a significantimpact on residential construction and renovation activity, which in turn influence the demand for and priceof lumber.
Adverse housing market conditions may increase the credit risk from customers of our Friesau Facility.
Our Friesau Facility generally extends credit to customers who are generally susceptible to thesame economic business risks that we are. Unfavorable housing market conditions could result in financialfailures of one or more of such customers. If such customers’ financial position becomes impaired, ourability to fully collect receivables from such customers could be impaired and negatively affect ouroperating results, cash flow and liquidity.
Our Friesau Facility’s lumber products are vulnerable to declines in demand due to competingtechnologies or materials.
Our lumber products may compete with alternative products. For example, plastic, wood/plastic orcomposite materials may be used by builders as alternatives to the lumber products produced by our FriesauFacility. Changes in the prices for oil, chemicals and other products can change the competitive position ofour Friesau Facility’s lumber products relative to available alternatives and could increase substitution ofthose products for our Friesau Facility’s products. If use of these alternative products grows, demand forand pricing of our Friesau Facility’s products could be adversely affected.
Changes in credit ratings issued by nationally recognized statistical rating organizations could adverselyaffect our cost of financing and have an adverse effect on the market price of our securities.
Credit rating agencies rate our debt securities on factors that include our operating results, actionsthat we take, their view of the general outlook for our industry and their view of the general outlook for theeconomy. Actions taken by the rating agencies can include maintaining, upgrading or downgrading thecurrent rating or placing the company on a watch list for possible future downgrading. Downgrading thecredit rating of our debt securities or placing us on a watch list for possible future downgrading could limitour access to the credit markets, increase our cost of financing and have an adverse effect on the marketprice of our securities, including our Senior Notes.
We rely on government grants and participate in German statutory energy programs.
We currently benefit from a subsidized capital expenditure program as a result of German federaland state government grants. Should either the German federal or state governments be prohibited fromhonoring legislative grants, or should we be required to repay any such legislative grants, this may have amaterial adverse effect on our business, financial condition, results of operations and cash flow.
Since 2005, our German mills have received emission allowances under the EU ETS. Since ourGerman mills receive stipulated special tariffs under the Renewable Energy Act, the amount of emissionsallowances granted to our German mills under the EU ETS has been reduced and, as a result, from time totime, we purchase emission allowances in order to meet statutory requirements. Additionally, such emissionallowances are subject to statutory amendment or change in the future.
In 2014, in response to an investigation by the European Commission into whether portions of theRenewable Energy Act constituted unpermitted state aid, the German government amended the Renewable
(48)
Energy Act. After such amendment, our German mills continued to sell green energy into the market atstipulated prices or “tariffs” and were exempted, as “existing installations”, from certain surcharges on theconsumption of energy that they generate, or “auto-generation”. The German government further amendedthe Renewable Energy Act effective January 1, 2017, so that funding for renewable energy is to be allocatedthrough an auction system, primarily to create a competitive bidding process for new installations of wind,solar and biomass energy. Our Friesau Facility’s tariff expires in 2029. However, the amendments providethat existing pulp mills, including our German pulp mills, are ineligible for such auction process and insteadwill have their tariffs renewed upon expiry of their initial 20-year terms for a further 10-year period, basedupon the price received in the last year prior to renewal regressing at a rate of 8% per annum. Our Rosenthalmill’s initial 20-year tariff expires on December 31, 2019 and our Stendal mill’s initial 20-year tariff expireson December 31, 2024. Such 10-year extensions for such pulp mills have been notified by the Germangovernment to the European Commission for review for compliance with applicable state aid rules. Whilewe currently expect they will become effective, we can provide no assurance that they will be permittedunder EU rules. As a result, we cannot currently predict the effect of promulgated amendments to theRenewable Energy Act on our German mills’ sale or consumption of energy.
Our costs of energy for our pulp operations in Germany could increase in the event that the auto-generation surcharge exemption is removed or reduced in the future. Additionally, if the stipulated tariffsfor energy sold by our German mills are reduced in the future, our energy sales in Germany may not be asprofitable. Any of the foregoing situations or any combination of them could have a material adverse effecton our results of operations.
We are subject to risks related to our employees.
The majority of our employees are unionized and we have collective agreements in place with ouremployees at all of our mills. Although we have not experienced any material work stoppages in the past,there can be no assurance that we will be able to negotiate acceptable collective agreements or othersatisfactory arrangements with our employees upon the expiration of our collective agreements. This couldresult in a strike or work stoppage by the affected workers. The registration or renewal of the collectiveagreements or the outcome of our wage negotiations could result in higher wages or benefits paid to unionmembers. Additionally, changing demographics may make it more difficult for us to recruit skilledemployees in the future. Accordingly, we could experience a significant disruption of our operations orhigher ongoing labor costs, which could have a material adverse effect on our business, financial condition,results of operations and cash flow. In addition, whenever we seek to reduce workforce at any of our mills,the affected mill’s labor force could seek to hinder or delay such actions, we could incur material severanceor other costs and our operations could be disrupted.
We are dependent on key personnel.
Our future success depends, to a large extent, on the efforts and abilities of our executive and seniormill operating officers. Such officers are industry professionals many of whom have operated throughmultiple business cycles. Our officers play an integral role in, among other things:
• sales and marketing;
• reducing operating costs;
• identifying capital projects which provide a high rate of return; and
• prioritizing expenditures and maintaining employee relations.
(49)
The loss of one or more of our officers could make us less competitive in these areas, which couldmaterially adversely affect our business, financial condition, results of operations and cash flows. We do notmaintain any key person life insurance for any of our executive or senior mill operating officers.
We may experience material disruptions to our production.
A material disruption at one of our manufacturing facilities could prevent us from meetingcustomer demand, reduce our pulp, lumber and energy sales and/or negatively impact our results ofoperations. Any of our mills could cease operations unexpectedly due to a number of events, including:
• unscheduled maintenance outages;
• prolonged power failures;
• equipment failure;
• employee errors or failures;
• design error or employee or contractor error;
• chemical spill or release;
• explosion of a boiler;
• disruptions in the transportation infrastructure, including roads, bridges, railway tracks,tunnels, canals and ports;
• fires, floods, earthquakes, windstorms, pest infestations, severe weather conditions or othernatural catastrophes affecting our production of goods or the supply of raw materials likefiber;
• prolonged supply disruption of major inputs;
• labor difficulties;
• capital projects that require temporary cost increases or curtailment of production; and
• other operational problems.
Any such downtime or facility damage could prevent us from meeting customer demand for ourproducts and/or require us to make unplanned capital expenditures. If any of our facilities were to incursignificant downtime, our ability to meet our production capacity targets and satisfy customer requirementswould be impaired and could have a material adverse effect on our business, financial condition, results ofoperations and cash flows.
If our long-lived assets become impaired, we may be required to record non-cash impairment chargesthat could have a material impact on our results of operations.
We review the carrying value of long-lived assets for impairment when events or changes incircumstances indicate that the carrying amount of the assets may not be recoverable. Should the marketsfor our products deteriorate or should we decide to invest capital differently or should other cash flowassumptions change, it is possible that we will be required to record non-cash impairment charges in thefuture that could have a material adverse effect on our results of operations.
We may incur losses as a result of unforeseen or catastrophic events, including the emergence of apandemic, terrorist attacks or natural disasters.
The occurrence of unforeseen or catastrophic events, including the emergence of a pandemic orother widespread health emergency (or concerns over the possibility of such an emergency), terrorist attacks
(50)
or natural disasters, could create economic and financial disruptions and could lead to operationaldifficulties (including travel limitations) that could impair our ability to manage or operate our business andadversely affect our results of operations.
Our insurance coverage may not be adequate.
We have obtained insurance coverage that we believe would ordinarily be maintained by anoperator of facilities similar to our mills. Our insurance is subject to various limits and exclusions. Damageor destruction to our facilities could result in claims that are excluded by, or exceed the limits of, ourinsurance coverage. Additionally, the weak global and financial markets have also reduced the availabilityand extent of credit insurance for our customers. If we cannot obtain adequate credit insurance for ourcustomers, we may be forced to amend or curtail our planned operations which could negatively impact oursales revenues, results of operations and financial position.
We rely on third parties for transportation services.
Our business primarily relies upon third parties for the transportation of pulp and lumber to ourcustomers, as well as for the delivery of our raw materials to our mills. Our pulp, lumber and raw materialsare principally transported by truck, barge, rail and sea-going vessels, all of which are highly regulated.Increases in transportation rates can also materially adversely affect our results of operations.
Further, if our transportation providers fail to deliver our pulp or lumber in a timely manner, itcould negatively impact our customer relationships and we may be unable to manufacture pulp or lumber inresponse to customer orders or sell them at full value. Also, if any of our transportation providers were tocease operations, we may be unable to replace them at a reasonable cost. The occurrence of any of theforegoing events could materially adversely affect our results of operations.
We periodically use derivatives to manage certain risks which has caused significant fluctuations in ouroperating results.
In 2002, Stendal entered into certain variable-to-fixed interest rate swaps to fix interest paymentsunder its indebtedness until 2017, which prevented Stendal from benefiting from the general decline ininterest rates that ensued. Because we effectively fixed the rate on Stendal’s indebtedness under suchcontract, the value of our derivative position moves inversely to interest rates. The Stendal interest rate swapcontract expired and was closed in October 2017.
We also periodically use other derivatives related to currency exchange rates, commodity pricesand energy prices.
We record unrealized gains or losses on our derivative instruments when they are marked to marketat the end of each reporting period and realized gains or losses on them when they are settled. Theseunrealized and realized gains and losses can materially impact our operating results for any reporting period.
If any of the variety of instruments and strategies we utilize is not effective, we may incur losseswhich may have a material adverse effect on our business, financial condition, results of operations andcash flow. The purpose of our derivative activity may also be considered speculative in nature; we do notuse these instruments with respect to any pre-set percentage of revenues or other formula, but either toaugment our potential gains or reduce our potential losses depending on our perception of future economicevents and developments.
(51)
Failures or security breaches of our information technology systems could disrupt our operations andnegatively impact our business.
We use information technologies to securely manage our operations and various business functions.We rely on various technologies to process, store and report on our business and to communicateelectronically between our facilities, personnel, customers and suppliers. We also use informationtechnologies to process financial information and results of operations for internal reporting purposes and tocomply with regulatory, legal and tax requirements. Despite our security design and controls, and those ofour third party providers, our information technology systems may be vulnerable to a variety ofinterruptions, including during the process of upgrading or replacing software, databases or componentsthereof, natural disasters, terrorist attacks, telecommunications failures, computer viruses, cyber-attacks,hackers, unauthorized access attempts and other security issues or may be breached due to employee error,malfeasance or other disruptions. Any such interruption or breach could result in operational disruptions orthe misappropriation of sensitive data that could subject us to civil and criminal penalties, litigation or havea negative impact on our reputation. There can be no assurance that such disruptions or misappropriationsand the resulting repercussions will not negatively impact our cash flows and materially affect our results ofoperations or financial condition.
The price of our common stock may be volatile.
The market price of our common stock may be influenced by many factors, some of which arebeyond our control, including those described above and the following:
• actual or anticipated fluctuations in our operating results or our competitors’ operatingresults;
• announcements by us or our competitors of new products, capacity changes, significantcontracts, acquisitions or strategic investments;
• our growth rate and our competitors’ growth rates;
• the financial market and general economic conditions;
• changes in stock market analyst recommendations regarding us, our competitors or theforest products industry generally or lack of analyst coverage of our common stock;
• sales of common stock by our executive officers, directors and significant shareholders;
• changes in accounting principles; and
• changes in laws and regulations.
In addition, there has been significant volatility in the market price and trading volume of securitiesof companies operating in the forest products industry that often has been unrelated to the operatingperformance of particular companies. Some companies that have had volatile market prices for theirsecurities have had securities litigation brought against them. If litigation of this type is brought against us,it could result in substantial costs and would divert management’s attention and resources.
A small number of our shareholders could significantly influence our business.
There are a few significant shareholders of our common stock who own a substantial percentage ofthe outstanding shares of our common stock. These few significant shareholders, either individually oracting together, may be able to exercise significant influence over matters requiring shareholder approval,including the election of directors and approval of significant corporate transactions, such as a merger or
(52)
other sale of the company or our assets. This concentration of ownership may make it more difficult forother shareholders to effect substantial changes in the company, may have the effect of delaying, preventingor expediting, as the case may be, a change in control of the company and may adversely affect the marketprice of our common stock. Further, the possibility that one or more of these significant shareholders maysell all or a large portion of their common stock in a short period of time could adversely affect the tradingprice of our common stock. Also, the interests of these few shareholders may not be in the best interests ofall shareholders.
Our international sales and operations are subject to applicable laws relating to trade, export controlsand foreign corrupt practices, the violation of which could adversely affect our operations.
As a result of our international sales and operations, we are subject to trade and economic sanctionsand other restrictions imposed by the United States, Canada and other governments or organizations,including prohibitions in the United States against foreign competitors’ (including our operatingsubsidiaries) receipt of certain unlawful foreign governmental benefits. We are also subject to the U.S.Foreign Corrupt Practices Act, the Canadian Corruption of Foreign Public Officials Act and other anti-bribery laws that generally bar bribes or unreasonable gifts to foreign governments or officials. Changes intrade sanctions laws could restrict our business practices, including cessation of business activities insanctioned countries or with sanctioned entities, and may result in modifications to compliance programs.Violations of these laws or regulations could result in sanctions including fines, loss of authorizationsneeded to conduct our international business, the imposition of tariffs or duties and other penalties, whichcould adversely impact our business, operating results and financial condition.
We are exposed to interest rate fluctuations.
Interest on borrowings under our revolving credit facilities are at “floating” rates. As a result,increases in interest rates will increase our costs of borrowing and reduce our operating margins.
ITEM 1B. UNRESOLVED STAFF COMMENTS
None.
ITEM 2. PROPERTIES
We own the Rosenthal, Stendal and Celgar pulp mills, the Friesau Facility and the underlyingproperties.
Rosenthal Mill. The Rosenthal mill is situated on a 230 acre site in the town of Blankenstein in thestate of Thüringia, approximately 300 kilometers south of Berlin. The Saale river flows through the site ofthe mill. In late 1999, we completed a major capital project which converted the Rosenthal mill to theproduction of kraft pulp. It is a single line mill with a current annual production capacity of approximately360,000 ADMTs of kraft pulp. The mill is self-sufficient in steam and electrical power. Some excesselectrical power which is constantly generated is sold to the regional power grid. The facilities at the millinclude:
• an approximately 425,000 square feet fiber storage area;
• debarking and chipping facilities for pulp logs;
• an approximately 700,000 square feet roundwood yard;
(53)
• a fiber line, which includes a Kamyr continuous digester and bleaching facilities;
• a pulp machine, which includes a dryer, a cutter and a baling line;
• an approximately 60,000 square feet finished goods storage area;
• a chemical recovery line, which includes a recovery boiler, evaporation plant,recausticizing plant and lime kiln;
• a fresh water plant;
• a wastewater treatment plant; and
• a power station with a turbine capable of producing 57 MW of electrical power from steamproduced by the recovery boiler and a power boiler.
Stendal Mill. The Stendal mill is situated on a 200 acre site owned by Stendal that is part of alarger 1,250 acre industrial park near the town of Stendal in the state of Saxony-Anhalt, approximately300 kilometers north of the Rosenthal mill and 130 kilometers west of Berlin. The mill is adjacent to theElbe river and has access to harbor facilities for water transportation. The mill is a single line mill with acurrent annual design production capacity of approximately 660,000 ADMTs of kraft pulp. The Stendal millis self-sufficient in steam and electrical power. Some excess electrical power which is constantly beinggenerated is sold to the regional power grid. The facilities at the mill include:
• an approximately 740,000 square feet fiber and roundwood storage area;
• debarking and chipping facilities for pulp logs;
• a fiber line, which includes ten SuperBatch™ digesters and bleaching facilities;
• a pulp machine, which includes a dryer, a cutter and a baling line;
• an approximately 105,000 square feet finished goods storage area;
• a chemical recovery line, which includes a recovery boiler, evaporation plant,recausticizing plant and lime kiln;
• a fresh water plant;
• a wastewater treatment plant; and
• a power station with two turbines capable of producing 148 MW of electrical power.
Celgar Mill. The Celgar mill is situated on a 400 acre site near the city of Castlegar, BritishColumbia. The mill is located on the south bank of the Columbia River, approximately 600 kilometers eastof the port city of Vancouver, British Columbia, and approximately 32 kilometers north of the Canada-U.S.border. The city of Seattle, Washington is approximately 650 kilometers southwest of Castlegar. The Celgarmill is a single line mill with a current annual production capacity of approximately 520,000 ADMTs ofkraft pulp. Internal power generating capacity resulting from the completion of the Celgar Energy Project in2010 enables the Celgar mill to be self-sufficient in electrical power and to sell surplus electricity. Thefacilities at the Celgar mill include:
• an approximately 25,000 square feet fiber storage area;
• a woodroom containing debarking and chipping facilities for pulp logs;
• a fiber line, which includes a dual vessel hydraulic digester, a two stage oxygendelignification system and a four stage bleach plant;
(54)
• two pulp machines, which each include a dryer, a cutter and a baling line;
• an approximately 28,000 square feet on-site finished goods storage area and anapproximately 29,000 square feet off-site finished goods storage area;
• a chemical recovery line, which includes a recovery boiler, evaporation plant,recausticizing plant and lime kiln;
• a wastewater treatment system; and
• a power station with two turbines capable of producing approximately 100 MW ofelectrical power.
Friesau Facility. The Friesau mill is situated on a 61.6 acre site in the town of Saalburg-Ebersdorf,Germany, approximately 300 km south of Berlin and only 16 kilometers from the Rosenthal mill. It is a twoline sawmill with an annual production capacity of approximately 550 MMfbm of lumber on a continuouslyoperating basis. The mill also sells electrical power generation to the regional power grid at fixed greenpower tariffs. The mill is self-sufficient in thermal power. The facilities at the Friesau mill include:
• an approximately one million square feet roundwood storage area;
• three log de-barking and two sorting lines;
• two Linck sawing lines;
• 56 lumber kilns capable of matching sawmill production;
• a two-line planer mill;
• an approximately 663,800 square feet finished goods storage area; and
• a bio-mass fueled cogeneration power plant capable of producing 13 MW of electricalpower.
(55)
The Manufacturing Process
The following diagram provides a simplified description of the kraft pulp manufacturing process atour pulp mills:
Wood Chips and Pulp Logs
Chip Screens
Digester
Unbleached Pulp
Washer
Evaporators
Weak Black Liquor
CookingChemicals
Recausticizing Plant
PulpScreens
Strong Black Liquor
RecoveredChemicals
Turbogenerators
Electricity
Steam Usedin Process
RecoveryBoiler
PowerBoiler
Biomass
Natural Gas
WashedPulp
Washing
Bleached Pulp
Pulp Machine
Market Pulp
Steam
Bio-Chemicals
ChemicalPlant
Bleaching
00
00
0
0
0
00
Bleaching Chemicals
In order to transform wood chips into kraft pulp, wood chips undergo a multi-step processinvolving the following principal stages: chip screening, digesting, pulp washing, screening, bleaching anddrying.
In the initial processing stage, wood chips are screened to remove oversized chips and sawdust andare conveyed to a pressurized digester where they are heated and cooked with chemicals. This occurs in acontinuous process at the Celgar and Rosenthal mills and in a batch process at the Stendal mill. This processsoftens and eventually dissolves the phenolic material called lignin that binds the fibers to each other in thewood.
Cooked pulp flows out of the digester and is washed and screened to remove most of the residualspent chemicals and partially cooked wood chips. The pulp then undergoes a series of bleaching stageswhere the brightness of the pulp is gradually increased. Finally, the bleached pulp is sent to the pulpmachine where it is dried to achieve a dryness level of approximately 90%. The pulp is then ready to bebaled for shipment to customers.
A significant feature of kraft pulping technology is the recovery system, whereby chemicals used inthe cooking process are captured and extracted for re-use, which reduces chemical costs and improvesenvironmental performance. During the cooking stage, dissolved organic wood materials and used
(56)
chemicals, collectively known as black liquor, are extracted from the digester. After undergoing anevaporation process, black liquor is burned in a recovery boiler. The chemical compounds of the blackliquor are collected from the recovery boiler and are reconstituted into cooking chemicals used in thedigesting stage through additional processing in the recausticizing plant.
The heat produced by the recovery boiler is used to generate high-pressure steam. Additional steamis generated by a power boiler through the combustion of biomass consisting of bark and other woodresiduals from sawmills and our woodrooms and residue generated by the effluent treatment system.Additionally, during times of upset, we may use natural gas to generate steam. The high pressure steamproduced by the recovery and power boilers is used to power a turbine generator to generate electricity, lowpressure steam coming off the turbine is then used to provide heat for the digesting and pulp dryingprocesses.
Our Friesau Facility principally manufactures finished sawn lumber milled from spruce and pine,including European metric and specialty lumber, U.S. dimensional lumber and J-grade lumber, in varioussizes and grades. The process for manufacturing lumber results in a significant percentage of each sawlogending up as by-products or residuals such as wood chips, trim blocks, sawdust shavings and bark, whichare typically sold to a wide variety of customers. In addition, we utilize a significant portion of the chipsfrom the Friesau Facility at our Rosenthal pulp mill.
Other Properties. In addition, we own a logistics and reload center near Trail, British Columbiaand lease offices in Vancouver, British Columbia, Berlin, Arneburg and Hamburg, Germany and Seattle,Washington.
The €5.0 million Rosenthal working capital facility is secured by certain land at the Rosenthal mill.The working capital loan facilities established for our mills and Mercer Holz are secured by first chargesagainst their respective inventories and receivables.
ITEM 3. LEGAL PROCEEDINGS
In January 2012, we initiated a claim against the Government of Canada for breaches by it of itsobligations under NAFTA. Our NAFTA claim relates to our investment in the Celgar mill and arises fromthe treatment of the Celgar mill’s energy generation assets and operations by the Province of BritishColumbia, primarily through the actions of B.C. Hydro, a provincially owned and controlled enterprise, andthe British Columbia Utilities Commission, a provincial government regulatory agency. Our NAFTA claimis against the Government of Canada, rather than the Province of British Columbia as, under NAFTA, theCanadian government is responsible for the actions of its provinces. Our NAFTA claim alleges that ourCelgar mill has received unfair and discriminatory treatment regarding the mill’s ability to purchase and sellenergy compared to other pulp mills and entities that generate and sell electricity within the Province ofBritish Columbia. Under our NAFTA claim, we are seeking approximately C$250.0 million in damagesconsisting of past losses accruing since 2008 and the net present value of projected losses that would resultfrom the ongoing application of discriminatory Provincial policies should the status quo remain unchanged.Our NAFTA claim was heard by a tribunal appointed pursuant thereto in 2015. We currently expect toreceive a decision from the tribunal some time in 2018.
As a result of the inherent uncertainty of litigation, there can be no assurance whether we will besuccessful in such NAFTA claim and we cannot quantify the amount we may recover, if any, under suchproceedings if we were successful.
We are also subject to routine litigation incidental to our business. We do not believe that theoutcome of such litigation will have a material adverse effect on our business or financial condition.
(57)
ITEM 4. MINE SAFETY DISCLOSURES
Not applicable.
(58)
PART II
ITEM 5. MARKET FOR REGISTRANT’S COMMON EQUITY, RELATED STOCKHOLDERMATTERS AND ISSUER PURCHASES OF EQUITY SECURITIES
(a) Market Information. Our shares are quoted for trading on the NASDAQ Global SelectMarket under the symbol “MERC” and listed in dollars on the Toronto Stock Exchange under the symbol“MERC.U”. The following table sets forth the high and low sale prices of our shares on the NASDAQGlobal Select Market for each quarter in the two-year period ended December 31, 2017:
(b) Shareholder Information. As at February 14, 2018, there were approximately 205 holdersof record of our shares and a total of 65,017,288 shares were outstanding.
(c) Dividend Information. On February 14, 2018, our board of directors approved a quarterlydividend of $0.125 per share to be paid to holders of our common stock on April 4, 2018 to shareholders ofrecord on March 28, 2018.
In 2017, our board of directors approved three quarterly dividend payments of $0.115 per shareeach and a fourth quarterly dividend payment of $0.125 per share, the first being paid on April 4, 2017, thesecond being paid on July 6, 2017, the third being paid on October 4, 2017 and the fourth being paid onJanuary 4, 2018.
The further declaration and payment of dividends is at the discretion of our board of directors andwill depend upon various factors, including our earnings, financial condition, restrictions imposed by ourcredit facilities and the terms of any other indebtedness that may be outstanding, cash requirements, futureprospects and other factors deemed relevant by our board of directors. The indentures governing our SeniorNotes and our credit facilities limit our ability to pay dividends or make other distributions on capital stock.See Item 1. “Business – Description of Certain Indebtedness”.
(d) Equity Compensation Plans. The following table sets forth information as at December 31,2017 with respect to the shares of our common stock that may be issued under our existing equitycompensation plans.
Number of securities to beissued upon exercise of
outstanding options,warrants and rights
(a)
Weighted-averageexercise price of outstandingoptions, warrants and rights
(b)
Number of securitiesremaining available for future
issuance under equitycompensation plans (excluding
securities reflected incolumn (a))
(c)
Plan CategoryEquity compensation plans
approved by shareholders . . . -(1) $ - 3,172,344(2)
(1) Excludes 43,635 outstanding restricted shares which vest in 2018 and a maximum of 1,867,158 outstanding performance share units,414,138 of which had vested as at December 31, 2017. The underlying shares of common stock relating to the vested performance shareunits were issued in February 2018. Of the remaining 1,453,020 performance share units, 931,844 will vest in 2018 and 521,176 willvest in 2019. The actual number of shares of common stock issued in respect of unvested performance share units will vary from 0% to200% of performance share units granted, based upon achievement of performance objectives established for such awards.
(2) Represents the number of shares of our common stock remaining available for issuance under the 2010 Plan as of December 31, 2017.Our 2010 Plan replaced the 2004 Plan and the 1992 Plan expired in 2008. Our 2010 Plan provides for options, restricted stock rights,restricted shares, performance shares, performance share units and stock appreciation rights to be awarded to employees, consultants andnon-employee directors.
(e) Performance Graph. The following graph shows a five-year comparison of cumulativetotal shareholder return, calculated on an assumed dividend reinvested basis, for our common stock, theNASDAQ Stock Market Index, referred to as the “NASDAQ Index”, and Standard Industrial Classification,or “SIC”, Code Index (SIC Code 2611 - pulp mills), referred to as the “Industry Index”. The graph assumes$100 was invested in each of our common stock, the NASDAQ Index and the Industry Index onDecember 31, 2012. Data points on the graph are annual.
COMPARISON OF CUMULATIVE TOTAL RETURN
$0
$50
$100
$150
$200
$250
$300
2012 2013 2014 2015 2016 2017
Mercer Interna�onal Inc. NASDAQ Stock Market Index SIC Code Index
The following table sets forth selected historical financial and operating data as at and for the yearsindicated. The following selected financial data are qualified in their entirety by, and should be read inconjunction with, our consolidated financial statements and related notes contained in this annual report andItem 7. “Management’s Discussion and Analysis of Financial Condition and Results of Operations”.
Year Ended December 31,
2017 2016 2015 2014 2013
(in thousands, other than per share amounts and operating data)Statement of Operations Data
(1) Redemption of 2019 Senior Notes.(2) Certain balance sheet amounts for December 31, 2014 and December 31, 2013 have been adjusted as a result of our adoption of
Accounting Standards Update 2015-17, Balance Sheet Classification of Deferred Taxes and Accounting Standards Update 2015-03,Simplifying the Presentation of Debt Issuance Costs.
(3) In December 2017, we issued $300.0 million of 2026 Senior Notes and used the proceeds along with cash on hand to redeem, onJanuary 5, 2018, $300.0 million of 2022 Senior Notes.
(4) We do not report the effect of government grants relating to our assets in our income. These grants reduce the cost basis of the assetspurchased. See Item 1. “Business – Capital Expenditures”.
(5) Sales realizations after customer discounts, rebates and other selling concessions. Incorporates the effect of pulp price variationsoccurring between the order and shipment dates.
(62)
NON-GAAP FINANCIAL MEASURES
This annual report on Form 10-K contains “non-GAAP financial measures”, that is, financialmeasures that either exclude or include amounts that are not excluded or included in the most directlycomparable measure calculated and presented in accordance with the generally accepted accountingprinciples in the United States, referred to as “GAAP”. Specifically, we make use of the non-GAAPmeasures “Operating EBITDA” and “Operating EBITDA margin”.
Operating EBITDA is defined as operating income (loss) plus depreciation and amortization andnon-recurring capital asset impairment charges. Operating EBITDA margin is Operating EBITDAexpressed as a percentage of revenues. We use Operating EBITDA and Operating EBITDA margin asbenchmark measurements of our own operating results and as benchmarks relative to our competitors. Weconsider them to be meaningful supplements to operating income as performance measures primarilybecause depreciation expense and non-recurring capital asset impairment charges are not actual cash costs,and depreciation expense varies widely from company to company in a manner that we consider largelyindependent of the underlying cost efficiency of our operating facilities. In addition, we believe OperatingEBITDA is commonly used by securities analysts, investors and other interested parties to evaluate ourfinancial performance.
Operating EBITDA does not reflect the impact of a number of items that affect our net income(loss), including financing costs and the effect of derivative instruments. Operating EBITDA is not ameasure of financial performance under GAAP, and should not be considered as an alternative to netincome (loss) or income (loss) from operations as a measure of performance, or as an alternative to net cashfrom operating activities as a measure of liquidity. Operating EBITDA and Operating EBITDA margin areinternal measures and therefore may not be comparable to other companies.
Operating EBITDA has significant limitations as an analytical tool, and should not be considered inisolation, or as a substitute for analysis of our results as reported under GAAP. Some of these limitations arethat Operating EBITDA does not reflect: (i) our cash expenditures, or future requirements, for capitalexpenditures or contractual commitments; (ii) changes in, or cash requirements for, working capital needs;(iii) the significant interest expense, or the cash requirements necessary to service interest or principalpayments, on our outstanding debt; (iv) the impact of realized or marked to market changes in our derivativepositions, which can be substantial; and (v) the impact of impairment charges against our investments orassets. Because of these limitations, Operating EBITDA should only be considered as a supplementalperformance measure and should not be considered as a measure of liquidity or cash available to us toinvest in the growth of our business. Because all companies do not calculate Operating EBITDA in thesame manner, Operating EBITDA as calculated by us may differ from Operating EBITDA or EBITDA ascalculated by other companies. We compensate for these limitations by using Operating EBITDA as asupplemental measure of our performance and by relying primarily on our GAAP financial statements.
(63)
ITEM 7. MANAGEMENT’S DISCUSSION AND ANALYSIS OF FINANCIAL CONDITIONAND RESULTS OF OPERATIONS
The following discussion and analysis of our financial condition and results of our operations forthe years ended December 31, 2017, 2016 and 2015 is based upon and should be read in conjunction withthe consolidated financial statements and related notes included elsewhere in this annual report. This annualreport contains forward-looking statements that involve risks and uncertainties. Our actual results may differmaterially from those indicated in forward-looking statements. See “Cautionary Note Regarding Forward-Looking Statements” and Item 1A. “Risk Factors”.
Results of Operations
General
We operate in the pulp business and, since the April 2017 acquisition of the Friesau Facility, in thewood products business. We operate three pulp mills, two of which are located in Germany and one inWestern Canada. Our pulp mills have a combined production capacity of approximately 1.5 million ADMTsof NBSK pulp and 305 MW of electrical generation. The Friesau Facility is located in Germany and has anannual production capacity of 550 million board feet of lumber and 13 MW of electrical generation.
Since the acquisition of the Friesau Facility, we have two reportable operating segments:
• Pulp – consists of the manufacture, sales and distribution of NBSK pulp, electricity and otherby-products at our three pulp mills.
• Wood Products – consists of the manufacture, sales and distribution of lumber, electricity andother wood residuals at the Friesau Facility.
Each segment offers primarily different products and requires different manufacturing processes,technology and sales and marketing.
Markets for NBSK pulp are global, cyclical and commodity based. Our financial performancedepends on a number of variables that impact sales and production costs. Sales and production results forkraft pulp are influenced largely by the market price for NBSK pulp, fiber costs and foreign currencyexchange rates. Kraft pulp prices are highly cyclical and primarily determined by the balance betweensupply and demand. Pricing and demand are influenced by global macro-economic conditions, changes inconsumption and industry capacity, the level of customer and producer inventories and fluctuations inexchange rates. The average European list prices for NBSK pulp between 2008 and 2017 have fluctuatedbetween a low of $575 per ADMT in 2009 to a high of $1,030 per ADMT at the end of 2017.
Our financial performance is also impacted by changes in the dollar to euro and Canadian dollarexchange rates. Changes in currency rates affect our operating results because most of our operating costs atour German mills are incurred in euros. Most of our operating costs at the Celgar mill are in Canadiandollars. These costs do not fluctuate with the dollar to euro or Canadian dollar exchange rates. Thus, anincrease in the strength of the dollar versus the euro and the Canadian dollar decreases our operating costsand increases our operating margins and income from operations. Conversely, a weakening of the dollaragainst the euro and the Canadian dollar tends to increase our operating costs and decrease our operatingmargins and income from operations. Our energy, chemical and European lumber sales are made in localcurrencies and, as a result, decline in dollar terms when the dollar strengthens and increase when the dollarweakens.
(64)
As a corollary to changes in exchange rates between the dollar and the euro and Canadian dollar, astronger dollar generally increases costs to our customers and results in downward pressure on pulp andlumber prices. Conversely, a weakening dollar generally supports higher pulp and lumber pricing. However,there is invariably a time lag between changes in currency exchange rates and prices. This lag can vary andis not predictable with any precision.
In 2017, the dollar was 2% weaker against the euro and Canadian dollar, compared to 2016, whichincreased our euro and Canadian dollar denominated costs and expenses. In 2016, a generally overall strongdollar benefited our costs and expenses. In 2015, changes in foreign exchange had a very significant effecton revenues, costs and expenses and results of operations, as the dollar was 16% and 14% stronger againstthe euro and Canadian dollar, respectively, compared to 2014.
In 2017, list prices for NBSK pulp increased by approximately 15% compared to 2016 as a resultof continued steady demand. At the end of 2017, the NBSK list price was approximately $1,030, $890 and$1,205 per ADMT in Europe, China and North America, respectively.
Late in the third quarter of 2017, prices increased in China as a result of strong demand and a sharpreduction in China’s imports of recovered or waste paper. Such reduction resulted from a majorenvironmental policy shift announced by China in the third quarter of 2017 to reduce and phase out importsof solid waste and scraps, including those within recovered or waste paper.
In 2016, largely as a result of the strong dollar and weakening hardwood prices, NBSK pricesdeclined by about 4% compared to 2015. At the end of 2016, the NBSK list price was approximately $810,$605 and $990 per ADMT in Europe, China and North America, respectively. In 2015, although pulpmarkets and demand were generally stable, the appreciation and the strength of the dollar versus the euroand Canadian dollar resulted in list prices declining by about 8% compared to 2014.
Our pulp sales realizations are list prices, net of customer discounts, rebates and other sellingconcessions. Over the last three years, these discounts, rebates and concessions, particularly in Europe andNorth America, have increased as producers compete for customers and sales. Our sales to China are closerto a net price with significantly lower or little discounts and rebates.
The European and U.S. lumber markets are very different. In the European market, lumber isgenerally customized in terms of dimensions and finishing, whereas the U.S. market is driven primarily bydemand from new housing starts and dimensions and finishing are generally standardized.
In 2017, European and U.S. lumber markets have been strong with prices near multi-year highs.
Production and sales of surplus energy and chemicals are key revenue sources for us. In 2017, 2016and 2015, our mills generated and sold 895,818 MWh, 785,845 MWh and 814,966 MWh, respectively, ofsurplus renewable energy. Our acquisition of the Friesau Facility has allowed us to grow our bio-massenergy profile. Further initiatives to increase our generation and sales of surplus renewable energy,chemicals and other by-products will continue to be a key focus for us. Such further initiatives may requireadditional capital spending.
Surplus energy and chemicals are by-products of our pulp and lumber production and the volumesgenerated and sold are primarily related to the rate of production. Prices for our energy and chemical salesare generally stable and unrelated to cyclical changes in pulp or lumber prices. In 2017, our energy andchemical revenues increased by approximately 20% compared to 2016 due to the acquisition of the FriesauFacility and higher production at our pulp mills. In 2016, our energy and chemical revenues declined from2015 as a result of lower sales volumes.
(65)
Our production costs are influenced by the availability and cost of raw materials, energy and labor,and our plant efficiencies and productivity. Our main raw material is fiber in the form of wood chips, pulplogs and sawlogs. Wood chip, pulp log and sawlog costs are primarily affected by the supply of, anddemand for, lumber and pulp, which are both highly cyclical. Higher fiber costs could affect producer profitmargins if they are unable to pass along price increases to pulp and lumber customers or purchasers ofsurplus energy.
During the past few years, strong sawmilling activity in Germany, coupled with initiatives toincrease harvest levels, particularly from small private forest owners, and increased imports of fiber havecontributed to a balanced wood market in Germany. A recovery in U.S. housing starts, which commencedin the latter part of 2012 and continued through 2017, resulted in increased sawmill activity in NorthAmerica. This increased the supply of wood chips for the Celgar mill and reduced its need for pulp logs,which are generally a higher cost for the mill than wood chips.
In 2017, our per unit fiber costs in our pulp segment were flat compared to 2016, primarily as aresult of a balanced wood market in both Germany and the Celgar mill’s fiber basket. In 2016, our per unitfiber costs were 8% lower than 2015, primarily as a result of balanced wood markets in both Germany andthe Celgar mill’s fiber basket.
Production costs also depend on the total volume of production. High operating rates andproduction efficiencies permit us to lower our average per unit cost by spreading fixed costs over moreunits. Higher operating rates also permit us to increase our generation and sales of surplus renewable energyand chemicals. Our production levels are also dependent on, among other things, the number of days ofmaintenance downtime at our mills. The following table sets out the number of days (and ADMTs) ofannual maintenance downtime at each of our pulp mills for the periods indicated:
Year Ended December 31,
2017 2016 2015
Days ADMTs Days ADMTs Days ADMTs(in thousands, except numbers of days)
In 2018 we have scheduled maintenance downtime for our pulp mills of 43 days, or approximately61,200 ADMTs. In the second quarter of 2018, 14 days, or approximately 18,000 ADMTs, will be at ourCelgar mill and 12 days, or approximately 22,700 ADMTs, will be at our Stendal mill. In the third quarterof 2018, 14 days, or approximately 14,800 ADMTs, will be at our Rosenthal mill and 3 days, orapproximately 5,700 ADMTs, will be at our Stendal mill. Additionally, one of the turbines at our Stendalmill will be offline for approximately 70 days commencing in the second quarter and into the third quarterof 2018, resulting in estimated lost energy sales in the range of 90,000 to 110,000 MWh. Unexpectedmaintenance downtime can be particularly disruptive in our industry.
Our product mix is also important because premium grades of NBSK pulp generally achieve higherprices and profit margins.
Selected 2017 Highlights
In 2017:
• we achieved record pulp, energy and chemical production and sales volumes;
(66)
• higher pulp prices and sales volumes contributed to strong net income of $70.5 millionand Operating EBITDA* of $252.3 million;
• our Friesau sawmill performed ahead of plan; and
• we increased our quarterly cash dividend 9% to $0.125 per share.
* See “- Summary Financial Highlights” for a reconciliation of net income to Operating EBITDA.
Current Market Environment
In 2017, pulp prices in Europe, China and North America increased compared to 2016 as a result ofcontinued steady demand. At December 31, 2017, NBSK list prices in Europe, China and North Americawere approximately $1,030, $890 and $1,205 per ADMT, respectively. As at December 31, 2017, theNBSK pulp market was balanced with world producer inventories at about 30 days’ supply.
We believe the new pulp production capacity that has or is coming online did not materiallyadversely impact the market in 2017 as a result of steady demand growth and diminishing supply andquality of recycled fiber. Further, we expect some of the new capacity will not hit the market in ameaningful amount until 2018. As a result, we currently expect overall steady pulp demand in the near term.
Currently both the European and U.S. lumber markets are strong and prices are near multi-yearhighs and are expected to remain steady in the near term.
Summary Financial Highlights
Year Ended December 31,
(in thousands, other than percent and per share amounts)2017 2016 2015
Common shares outstanding at period end . . . . . . . . . . . . . . . 65,017 64,694 64,502
(67)
(1) See “Non-GAAP Financial Measures” for a description of Operating EBITDA and Operating EBITDA margin, their limitations andwhy we consider them to be useful measures. The following table provides a reconciliation of net income to operating income andOperating EBITDA for the years indicated:
(1) Source: RISI pricing report.(2) Sales realizations after customer discounts, rebates and other selling concessions. Incorporates the effect of pulp price variations
occurring between the order and shipment dates.(3) Average Federal Reserve Bank of New York Noon Buying Rates over the reporting period.
(68)
Year Ended December 31, 2017 Compared to Year Ended December 31, 2016
Consolidated - Year Ended December 31, 2017 Compared to Year Ended December 31, 2016
Total revenues in 2017 increased by approximately 25% to $1,169.1 million from $931.6 million in2016 primarily due to higher pulp revenues and the inclusion of $97.4 million of revenues from our woodproducts segment.
Costs and expenses in 2017 increased by approximately 23% to $1,002.1 million from$817.9 million in 2016 primarily due to the inclusion of our wood products segment and higher pulp salesvolumes.
In 2017, operating depreciation and amortization increased to $84.9 million from $71.5 million in2016 due to the completion of large capital projects at our pulp mills and the acquisition of the FriesauFacility.
Selling, general and administrative expenses increased to $49.7 million in 2017 from $44.5 millionin 2016 primarily due to the inclusion of our wood products segment.
In 2017, our operating income increased by approximately 47% to $167.1 million from$113.7 million in 2016 primarily due to higher pulp sales realizations.
In the first quarter of 2017, we issued an aggregate of $250.0 million of 6.5% 2024 Senior Notesand utilized the proceeds primarily to acquire the Friesau Facility and redeem $227.0 million of our 7.0%2019 Senior Notes at a cost, including premium, of $234.9 million and recorded a loss on such redemptionof $10.7 million (being $0.16 per basic and diluted share). In December 2017, we issued $300.0 million of5.5% 2026 Senior Notes and used the proceeds and cash on hand to redeem, on January 5, 2018,$300.0 million of 2022 Senior Notes.
Interest expense in 2017 increased to $54.8 million from $51.6 million in 2016 primarily as interestaccrued on the 2024 and 2026 Senior Notes issued in 2017 and the redeemed 2019 and 2022 Senior Notesduring the requisite redemption notice periods and increased borrowings to partially finance the acquisitionof the Friesau Facility and build up its working capital.
During 2017, income tax expense increased to $33.5 million from $24.5 million in 2016 due tohigher taxable income for our German mills.
In 2017, net income increased to $70.5 million, or $1.09 per basic and $1.08 per diluted share, from$34.9 million, or $0.54 per basic and diluted share, in 2016.
In 2017, Operating EBITDA increased by approximately 36% to $252.3 million from$185.7 million in 2016 primarily as a result of higher pulp sales realizations and, to a lesser degree, theinclusion of our wood products segment.
(69)
Pulp Segment – Year Ended December 31, 2017 Compared to Year Ended December 31, 2016
Pulp revenues in 2017 increased by approximately 16% to $979.6 million from $847.3 million in2016 due to higher sales realizations and sales volumes.
Energy and chemical revenues increased by approximately 9% to $92.1 million in 2017 comparedto $84.3 million in 2016 primarily due to higher sales volumes.
Pulp production increased by approximately 6% to 1,507,019 ADMTs, being an annual productionrecord, in 2017 from 1,428,384 ADMTs in 2016. In 2017, we had annual maintenance downtime of 35 days(approximately 48,000 ADMTs), compared to 43 days (approximately 61,400 ADMTs) in 2016.
We estimate that such maintenance downtime in 2017 adversely impacted our operating income byapproximately $36.8 million, comprised of approximately $28.1 million in direct out-of-pocket expensesand the balance in reduced production. Many of our competitors that report their financial results usingInternational Financial Reporting Standards, referred to as “IFRS”, capitalize their direct costs ofmaintenance downtime.
Pulp sales volumes increased by approximately 6% to 1,515,084 ADMTs in 2017 compared to1,428,672 ADMTs in 2016 primarily due to continued steady demand from both China and Europe andrecord production.
In 2017, list prices for NBSK pulp increased from 2016, largely as a result of continued steadydemand. Average list prices for NBSK pulp in Europe were approximately $901 per ADMT in 2017,compared to approximately $803 per ADMT in 2016. Average list prices for NBSK pulp in China andNorth America were approximately $712 per ADMT and $1,105 per ADMT, respectively, in 2017,compared to approximately $599 per ADMT and $978 per ADMT, respectively, in 2016.
Average pulp sales realizations increased by approximately 9% to $640 per ADMT in 2017 fromapproximately $586 per ADMT in 2016 due to higher list prices.
In 2017, the dollar was 2% weaker against the euro and Canadian dollar compared to 2016 whichincreased the dollar cost of our euro and Canadian dollar denominated costs and expenses and contributed toa negative foreign exchange impact on operating income of approximately $28.0 million when compared to2016.
Costs and expenses in 2017 increased by approximately 12% to $903.3 million from $808.4 millionin 2016 primarily due to higher sales volumes, the negative impact of a weaker dollar on our euro andCanadian dollar denominated costs and expenses and the reversal in 2016 of accruals for wastewater fees atour German mills of $20.8 million.
In 2017, depreciation and amortization increased to $80.8 million from $71.5 million in 2016 dueto the completion of several major capital projects.
(70)
On average, in 2017 overall per unit fiber prices in Germany and for our Celgar mill were flatcompared to 2016 primarily as a result of a balanced wood market in both Germany and the Celgar mill’sfiber basket. In 2018, we currently expect our overall per unit fiber prices to modestly increase in bothEurope and Canada due to increased demand.
Transportation costs increased by approximately 12% to $76.4 million in 2017 from $68.1 millionin 2016 primarily due to higher sales volumes.
In 2017, pulp segment operating income increased by approximately 38% to $169.8 million from$123.2 million in 2016 primarily due to higher pulp sales realizations and sales volumes, partially offset bythe negative impact of a weaker dollar and the reversal in 2016 of accruals for wastewater fees.
Wood Products Segment – Year Ended December 31, 2017
In 2017, we had lumber revenues of $82.2 million, the majority of which was in the Europeanmarket. European lumber markets were generally strong and prices steady and near multi-year highs.
We produced 281.3 million board feet of lumber. Lumber sales volumes were 213.5 million boardfeet as we completed our inventory build-up to support sales to the U.S. market.
Average lumber sales realizations in 2017 were approximately $385 per Mfbm.
In 2017, energy and other by-product revenues were approximately $15.3 million and we sold73,698 MWh of electricity.
Our fiber costs were approximately 80% of our cash production costs. The ramping up ofproduction resulted in our purchasing large volumes of sawlogs in a short period. This resulted in oursawlog costs being marginally higher than our regional competitors.
In 2017 we started realizing on identified fiber synergies between the Friesau Facility and ourRosenthal pulp mill. During 2017, the facility shipped approximately 738,300 cubic meters of chips toRosenthal, and Rosenthal shipped approximately 70,100 cubic meters of waste wood to Friesau. Bothvolumes are in line with our forecasts and have begun to lower costs at both mills. As at December 31,2017, we estimate we have realized approximately $6.9 million of our expected synergy savings.
In 2017, depreciation and amortization for our wood products segment was $4.1 million.
In 2017, our wood products segment operating income was $5.6 million.
Year Ended December 31, 2016 Compared to Year Ended December 31, 2015
Total revenues in 2016 decreased by approximately 10% to $931.6 million from $1,033.2 millionin 2015.
(71)
Pulp revenues in 2016 decreased by approximately 10% to $847.3 million from $946.2 million in2015, due to lower pulp sales realizations and sales volumes.
Energy and chemical revenues decreased by approximately 3% to $84.3 million in 2016 from$87.0 million in 2015, primarily due to lower sales volumes.
Pulp production decreased by approximately 2% to 1,428,384 ADMTs in 2016 from 1,457,973ADMTs in 2015. In 2016, we had annual maintenance downtime of a total of 43 days (approximately61,400 ADMTs), 37 days of which were scheduled and six days of which were unscheduled to effectadditional work at our Celgar mill. In 2015, we had scheduled annual maintenance downtime of 40 days(approximately 58,400 ADMTs).
We estimate that such maintenance downtime in 2016 adversely impacted our Operating EBITDAby approximately $38.4 million, comprised of approximately $29.8 million in direct out-of-pocket expensesand the balance in reduced production. Many of our competitors that report their financial results usingIFRS capitalize their direct costs of maintenance downtime.
Pulp sales volumes marginally decreased by approximately 2% to 1,428,672 ADMTs in 2016 from1,463,132 ADMTs in 2015, primarily due to lower production at our Celgar mill due to an extended shutand subsequent slow start up at the mill.
In 2016, list prices for NBSK pulp declined from 2015, largely as a result of the strong dollar andthe impact of weakening hardwood pulp prices on NBSK pricing. Average list prices for NBSK pulp inEurope were approximately $803 per ADMT, compared to approximately $850 per ADMT in 2015.Average list prices for NBSK pulp in China and North America were approximately $599 per ADMT and$978 per ADMT, respectively, in 2016, compared to approximately $643 per ADMT and $972 per ADMT,respectively, in 2015.
Average pulp sales realizations decreased by approximately 8% to $586 per ADMT in 2016 fromapproximately $640 per ADMT in 2015, primarily due to lower list prices.
In 2016, the dollar was flat against the euro and 3% stronger against the Canadian dollar comparedto 2015, which had a positive impact on our Canadian dollar denominated costs and expenses. However,this was more than offset by the negative impact of a weaker dollar at year end on our Celgar mill’s dollar-denominated cash balances and receivables, resulting in an overall negative impact of approximately$1.8 million in 2016 compared to 2015.
Costs and expenses in 2016 decreased by approximately 6% to $817.9 million from $867.5 millionin 2015, primarily due to lower fiber prices, lower sales volumes and the reversal of $20.8 million inaccrued wastewater fees at our German mills.
In 2016, operating depreciation and amortization increased by approximately 5% to $71.5 millionfrom $67.8 million in 2015.
Selling, general and administrative expenses decreased by approximately 4% to $44.5 million in2016 from $46.2 million in 2015, due to lower costs associated with our completed NAFTA claim.
Transportation costs decreased to $68.1 million in 2016 from $74.4 million in 2015, primarily dueto lower pulp shipments to China.
On average, our overall per unit fiber costs in 2016 decreased by approximately 8% from 2015,primarily as a result of a balanced wood market in Germany and the Celgar mill’s fiber basket. In 2016, our
(72)
per unit fiber costs in Germany were 9% lower than in 2015. In 2016, our Celgar mill’s per unit fiber costswere approximately 6% lower than in 2015, due to strong sawmilling activity in the Celgar mill’s fiberbasket.
In 2016, our operating income decreased to $113.7 million from $165.7 million in 2015, primarilydue to lower pulp sales realizations and sales volumes, partially offset by lower fiber prices and the reversalof wastewater fee accruals at our German mills.
Interest expense in 2016 decreased by approximately 4% to $51.6 million from $53.9 million in2015, primarily due to lower indebtedness.
In 2016, we recorded a derivative loss of $0.2 million on the mark to market adjustment of ourinterest rate swap, compared to a derivative loss of $0.9 million in 2015.
During 2016, as a result of the strengthening of the dollar versus the euro at the end of 2016, werecorded a non-cash loss on the foreign exchange translation of intercompany debt between Mercer Inc. andits wholly owned subsidiaries of $1.1 million, compared to $5.3 million in 2015.
During 2016, we recorded an income tax expense of $24.5 million, compared to an income taxexpense of $29.4 million in 2015. Our tax rate is affected by recurring items, such as tax rates in foreignjurisdictions and the related amounts of income we earn in such jurisdictions, as well as discrete items thatmay occur in any given year but are not consistent from year to year. Our effective tax rate for fiscal 2016was 41%, compared to 28% in 2015. This increase was due to lower income from entities for which we donot recognize deferred tax assets.
We had net income of $34.9 million, or $0.54 per basic and diluted share, in 2016. In 2015, netincome was $75.5 million, or $1.17 per basic and diluted share.
In 2016, Operating EBITDA decreased by 21% to $185.7 million from $234.0 million in 2015,primarily as a result of lower pulp sales realizations and sales volumes, only being partially offset by lowerfiber prices and the reversal of wastewater fee accruals at our German mills.
Sensitivities
Our earnings are sensitive to, among other things, fluctuations in:
NBSK Pulp Price. NBSK pulp is a global commodity that is priced in dollars, whose markets arehighly competitive and cyclical in nature. As a result, our earnings are sensitive to NBSK pulp pricechanges. Based upon our 2017 sales volume (and assuming all other factors remained constant), each$10.00 per tonne change in NBSK list pulp prices yields a change in Operating EBITDA of approximately$12.0 million.
Lumber Price. Lumber pricing is priced in markets which are highly competitive and cyclical innature. As a result, our earnings are sensitive to lumber price changes. Based upon our 2017 sales volume,and adjusting for the Friesau Facility operating for a full year and assuming all other factors remainedconstant, each $10.00 per Mfbm change in lumber price yields a change in Operating EBITDA ofapproximately $4.0 million.
Fiber Price. Our main raw material is fiber in the form of wood chips, pulp logs and sawlogs. Fiberis a commodity and both prices and supply are cyclical. As a result, our operating costs are sensitive to fiberprice changes. For our pulp segment, based upon our 2017 fiber costs, and assuming all other factors
(73)
remained constant, each 1% change in per unit fiber price yields a change in annual operating costs ofapproximately $4.0 million. For our wood products segment, based upon our 2017 fiber costs, adjusting forthe Friesau Facility operating for a full year and assuming all other factors remained constant, each 1%change in per unit fiber price yields a change in annual operating costs of approximately $1.0 million.
Foreign Exchange. Our operating costs are in euros for our German mills and Canadian dollars forour Celgar mill. As a result, our operating costs will fluctuate with changes in the value of the dollar relativeto the euro and Canadian dollar. Based on our 2017 operating costs, and adjusting for the Friesau Facilityoperating for a full year, each $0.01 change in the value of the dollar relative to the euro and the Canadiandollar yields a total change in annual operating costs of approximately $10.0 million.
Our European lumber, energy and chemical sales are made in local currencies and, as a result,decline in dollar terms when the dollar strengthens. Based on our 2017 lumber, energy and chemicalrevenues, and adjusting for the Friesau Facility operating for a full year, each $0.01 change in the value ofthe dollar relative to the euro and the Canadian dollar yields a total change in lumber, energy and chemicalrevenues of approximately $2.0 million.
The above sensitivity analysis provides only a limited point-in-time view of the NBSK pulp price,lumber price, fiber price and foreign exchange rates discussed. The actual impact of the underlying priceand rate changes may differ materially from that shown in the sensitivity analysis.
Seasonal Influences. We are exposed to fluctuations in quarterly sales volumes and expenses dueto seasonal factors. These factors are common in the NBSK pulp and lumber industries. We generally haveweaker pulp demand in Europe during the summer holiday months and in China in the period relating to itslunar new year. We typically have a seasonal build-up in raw material inventories in the early winter monthsas the mills build up their fiber supply for the winter when there is reduced availability.
(1) Includes cash from issuance of 2024 Senior Notes and 2026 Senior Notes of $550.0 million, less note issuance costs of $11.6 million,and redemption of senior notes of $234.9 million in 2017. Excluding such note issuances and redemptions, cash used in financingactivities was $14.7 million.
(2) Includes proceeds from $300.0 million of 2026 Senior Notes issued in December 2017 which were used to redeem, on January 5, 2018,$300.0 million of 2022 Senior Notes. Excluding the redemption, the net increase was $2.4 million.
We operate in a cyclical industry and our operating cash flows vary accordingly. Our principaloperating cash expenditures are for labor, fiber, chemicals and debt service.
Working capital levels fluctuate throughout the year and are affected by maintenance downtime,changing sales patterns, seasonality and the timing of receivables and the payment of payables and
(74)
expenses. Generally, finished goods inventories are increased prior to scheduled maintenance downtime tomaintain sales volume while production is stopped. Our fiber inventories exhibit seasonal swings as weincrease pulp log, sawlog and wood chip inventories to ensure adequate supply of fiber to our mills duringthe winter months. Changes in sales volume can affect the level of receivables and influence overallworking capital levels. We believe our management practices with respect to working capital conform tocommon business practices.
Cash Flows from Operating Activities
Cash from operations includes:
• cash received from customers;
• cash paid to employees and suppliers;
• cash paid for interest on our debt; and
• cash paid or received for taxes.
Cash provided by operating activities in 2017 was $141.9 million and in 2016 was $140.8 million,down from $159.2 million in 2015 as higher operating income in 2017 was offset by a higher workingcapital balance. An increase in accounts receivable used cash of $64.9 million in 2017 of which $8.3 millionwas related to our wood products segment. In 2016 a decrease in accounts receivable provided cash of$9.5 million and an increase in accounts receivable used cash of $11.3 million in 2015. An increase ininventories used cash of $20.0 million in 2017, which reflected an increase of $27.0 million from our woodproducts segment and a decrease of $7.0 million in our pulp segment. A decrease in inventories providedcash of $6.8 million in 2016 and an increase in inventories used cash of $13.2 million in 2015. An increasein accounts payable and accrued expenses provided cash of $37.2 million of which $15.6 million wasrelated to our wood products segment, compared to a decrease in accounts payable and accrued expensesusing cash of $10.3 million in 2016 and an increase in accounts payable and accrued expenses providingcash of $9.7 million in 2015.
Cash Flows from Investing Activities
Cash from investing activities includes:
• acquisitions of property, plant and equipment and businesses;
• proceeds from the sale of assets; and
• purchases and sales of short-term investments.
Investing activities in 2017 used cash of $121.6 million primarily related to the acquisition of ourFriesau Facility for $61.6 million and capital expenditures of $57.9 million. Investing activities in 2016 usedcash of $44.3 million primarily related to capital expenditures of $42.5 million and intangible assetpurchases of $1.8 million primarily related to our Enterprise Resource Planning, or “ERP” project. Investingactivities in 2015 used cash of $49.8 million, primarily related to capital expenditures of $46.5 million andintangible asset purchases of $3.8 million, primarily related to our ERP project.
In 2017, capital expenditures which used cash of $57.9 million primarily related to a railcaracceptance system for logs and additional land for raw material storage at our Rosenthal mill, a pre-bleachpress system upgrade and large maintenance projects at our Celgar mill and various other smaller projects.In 2016, capital expenditures, which used cash of $42.5 million, were primarily related to a railcar
(75)
acceptance system for logs and a lime kiln retrofit at our Rosenthal mill, a wastewater reduction projectconsisting of an evaporation plant upgrade and a project to reduce chloride levels in the process water at ourStendal mill and new wood harvesting equipment, a logistics and reload center and other maintenanceprojects at our Celgar mill. In 2015, capital expenditures, which used cash of $46.5 million, were primarilyrelated to wastewater reduction projects at our German mills designed to reduce wastewater fees that wouldotherwise be payable and the completion of an automated chip storage project at the Rosenthal mill.
Cash Flows from Financing Activities
Cash from financing activities includes:
• issuances and payments of debt;
• borrowings and payments under revolving lines of credit;
• proceeds from issuances of stock; and
• payment of cash dividends and repurchases of stock.
In 2017, financing activities provided cash of $288.8 million, including an aggregate of$250.0 million from the issuance of the 2024 Senior Notes, which was primarily used to redeem the 2019Senior Notes at a cost of $234.9 million and $300.0 million from the issuance of the 2026 Senior Noteswhich along with cash on hand was used to redeem, on January 5, 2018, $300.0 million of 2022 SeniorNotes at a cost of $317.4 million. In 2017, debt issuance costs primarily for the 2024 Senior Notes and the2026 Senior Notes used cash of $11.6 million, dividend payments used cash of $29.9 million and scheduledpayments in respect of our Stendal mill’s interest rate swap contract used cash of $6.9 million. In 2017, wealso drew $22.3 million on a revolving credit facility to partially finance the acquisition of the FriesauFacility and to build its working capital. In 2016, financing activities used cash of $62.4 million, primarilydue to our quarterly dividend payments which used cash of $29.7 million, the repurchase and cancellationof $23.0 million of our 2019 Senior Notes, which used cash of $23.1 million, and scheduled payments inrespect of the Stendal interest rate swap contract, which used cash of $10.9 million. In 2015, financingactivities used cash of $56.7 million, primarily due to repayments of our revolving credit facilities, whichused cash of $23.1 million, the redemption of the payment-in-kind note issued in respect of the purchase ofthe minority interest in our Stendal mill in 2014, which used cash of $10.8 million, scheduled payments inrespect of the Stendal interest rate swap contract, which used cash of approximately $13.5 million, and ourquarterly dividend payment, which used cash of $7.4 million.
Balance Sheet Data
The following table is a summary of selected financial information for the dates indicated:
(1) Excludes restricted cash and cash held to redeem $300.0 million of 2022 Senior Notes on January 5, 2018.(2) In December 2017, we issued $300.0 million of 2026 Senior Notes and used the proceeds along with cash on hand to redeem, on
January 5, 2018, $300.0 million of 2022 Senior Notes.
(76)
At December 31, 2017, our pulp and wood products segments had total assets of $1,253.5 million and$116.3 million, respectively.
Sources and Uses of Funds
Our principal sources of funds are cash flows from operations and cash and cash equivalents onhand. Our principal uses of funds consist of operating expenditures, capital expenditures and interestpayments on our Senior Notes.
The following table sets out our total capital expenditures and interest expense for the periodsindicated:
(1) Amounts differ from interest expense which includes non-cash items. See supplemental disclosure of cash flow information from ourconsolidated financial statements included in this annual report.
(2) Interest on our 2022 Senior Notes is paid semi-annually in June and December of each year. In March 2017, we redeemed our 2019Senior Notes and, in January 2018, we redeemed $300 million of our 2022 Senior Notes. Interest on our 2024 Senior Notes is paid semi-annually in February and August of each year and interest on our 2026 Senior Notes is paid semi-annually in January and July of eachyear, commencing in July 2018. See Item 1. “Business – Description of Certain Indebtedness” for further information.
In 2017, we expended $29.9 million to pay four quarterly dividends of $0.115 per common share.
As at December 31, 2017, our cash and cash equivalents were $143.3 million, compared to$136.6 million at the end of 2016.
As at December 31, 2017, we had approximately $170.7 million available under our revolvingcredit facilities. Subsequently in 2018, we established the €25.0 million Holz Facility.
As at December 31, 2017, we had no material commitments to acquire assets or operatingbusinesses.
In 2018, excluding amounts being financed through government grants, we currently expect capitalexpenditures to be approximately $85 million to $95 million.
We currently consider the majority of undistributed earnings of our foreign subsidiaries to beindefinitely reinvested and, accordingly, no U.S. income tax has been provided on such earnings. However,if we were required to repatriate funds to the United States, we believe that we currently could repatriate themajority thereof without incurring any material amount of taxes as a result of our shareholder advances, taxloss carryforwards and U.S. tax reform. However, it is currently not practical to estimate the income taxliability that might be incurred if such earnings were remitted to the United States. Substantially all of ourundistributed earnings are held by our foreign subsidiaries outside of the United States.
Based upon the current level of operations and our current expectations for future periods in light ofthe current economic environment, and in particular, current and expected pulp and lumber pricing andforeign exchange rates, we believe that cash flow from operations and available cash, together withavailable borrowings under our revolving credit facilities, will be adequate to finance the capitalrequirements for our business including the payment of our quarterly dividend during the next 12 months.
(77)
In the future we may make acquisitions of businesses or assets or commitments to additional capitalprojects. To achieve the long-term goals of expanding our assets and earnings, including throughacquisitions, capital resources will be required. Depending on the size of a transaction, the capital resourcesthat will be required can be substantial. The necessary resources will be generated from cash flow fromoperations, cash on hand, borrowing against our assets or the issuance of securities.
Credit Facilities and Debt Covenants
We had the following principal amounts outstanding under our credit facilities and Senior Notes asat the dates indicated:
(1) In December 2017, we issued $300.0 million of 2026 Senior Notes and on January 5, 2018, we redeemed $300.0 million of our 2022Senior Notes. See Item 1. “Business - Description of Certain Indebtedness” for further information.
For a description of such indebtedness, see Item 1. “Business - Description of CertainIndebtedness”.
Certain of our long-term obligations contain various financial tests and covenants customary tothese types of arrangements.
Under the Stendal Revolving Credit Facility, our Stendal mill must not exceed a ratio of net debt toEBITDA of 2.5:1 in any 12-month period and there must be a ratio of EBITDA to interest expense equal toor in excess of 1.2:1 for each 12-month period. Additionally, current assets to current liabilities must equalor exceed 1.1:1.
Under the Rosenthal Joint Revolving Facility, until June 30, 2018, our Rosenthal mill must notexceed a ratio of net debt to EBITDA of 3:1 in any 12-month period and its current assets to currentliabilities must equal or exceed 1.1:1. After June 30, 2018, the borrowers under the facility, being Rosenthaland MTP, jointly must not exceed a ratio of net debt to EBITDA of 3.5:1 and their current assets to currentliabilities must equal or exceed 1.1:1.
The Celgar Working Capital Facility includes a covenant that, for so long as the excess amountunder the facility is less than C$5.0 million, then until it becomes equal to or greater than such amount, theCelgar mill must maintain a fixed charge coverage ratio of not less than 1.1:1.0 for each 12-month period.
The Stendal Revolving Credit Facility is provided by a syndicate of four financial institutions, theRosenthal Joint Revolving Facility is provided by two financial institutions and our Celgar Working CapitalFacility and our Rosenthal revolving €5.0 million facility are each provided by one financial institution. To
(78)
date we have not experienced any reductions in credit availability with respect to these credit facilities.However, if any of these financial institutions were to default on their commitment to fund, we could beadversely affected.
The indentures governing the Senior Notes do not contain any financial maintenance covenants andthere are no scheduled principal payments until maturity. Interest on our 2022 Senior Notes is payable semi-annually in arrears on June 1 and December 1, commencing June 1, 2015, at the rate of 7.75% and theymature in December 2022. Interest on our 2024 Senior Notes is payable semi-annually in arrears onFebruary 1 and August 1, commencing August 1, 2017, at the rate of 6.50% and they mature in February2024. Interest on our 2026 Senior Notes is payable semi-annually in arrears on January 15 and July 15,commencing July 15, 2018, at the rate of 5.50% and they mature in January 2026.
As at December 31, 2017, we were in full compliance with all of the covenants of ourindebtedness.
Off-Balance-Sheet Activities
At December 31, 2017 and 2016, we had no off-balance sheet arrangements.
Contractual Obligations and Commitments
The following table sets out our contractual obligations and commitments as at December 31, 2017:
Payments Due By Period
Contractual Obligations(1) 2018 2019-2020 2021-2022 Beyond 2022 Total
(1) We have identified approximately $5.3 million of asset retirement obligations. However, due to the uncertain timing related to thesepotential liabilities, we are unable to allocate the payments in the contractual obligations table.
(2) This reflects the future principal payments due under our debt obligations. See Item 1. “Business – Description of Certain Indebtedness”and Note 7 to our consolidated financial statements included herein for a description of such indebtedness.
(3) In January 2018, we redeemed $300.0 million of our 2022 Senior Notes. See Item 1. “Business – Description of Certain Indebtedness”for further information.
(4) Amounts presented for interest payments assume that all debt outstanding as of December 31, 2017 will remain outstanding untilmaturity, and interest rates on variable rate debt in effect as of December 31, 2017 will remain in effect until maturity.
(5) Capital lease obligations relate to transportation vehicles and production equipment. These amounts reflect principal and imputedinterest.
(6) Operating lease obligations relate to transportation vehicles and other production and office equipment.(7) Purchase obligations relate primarily to take-or-pay contracts, including for purchases of raw materials, made in the ordinary course of
business.(8) Other long-term liabilities relate primarily to future payments that will be made for post-employment benefits. Those amounts are
estimated using actuarial assumptions, including expected future service, to project the future obligations.
Foreign Currency
Our reporting currency is the dollar. However, we hold certain assets and liabilities in euros andCanadian dollars and the majority of our expenditures are denominated in euros or Canadian dollars.Accordingly, our consolidated financial results are subject to foreign currency exchange rate fluctuations.
(79)
We translate foreign denominated assets and liabilities into dollars at the rate of exchange on thebalance sheet date. Equity accounts are translated using historical exchange rates. Unrealized gains or lossesfrom these translations are recorded in our other comprehensive income (loss) and do not affect our netearnings.
In 2017, accumulated other comprehensive loss decreased by $126.3 million to a loss of$59.0 million, primarily due to the foreign currency translation adjustment.
Based upon the exchange rate at December 31, 2017, the dollar was approximately 14% weakeragainst the euro and approximately 7% weaker against the Canadian dollar since December 31, 2016. SeeItem 7A. “Quantitative and Qualitative Disclosures about Market Risk”.
Credit Ratings of Senior Notes
We and our Senior Notes are rated by Standard & Poor’s Rating Services, referred to as “S&P”,and Moody’s Investors Service, Inc., referred to as “Moody’s”.
S&P and Moody’s base their assessment of the credit risk on our Senior Notes on the business andfinancial profile of Mercer Inc. and our restricted subsidiaries under the indentures governing the SeniorNotes. As of December 31, 2017, all of our subsidiaries are restricted subsidiaries. Factors that may affectour credit rating include changes in our operating performance and liquidity. Credit rating downgrades canadversely impact, among other things, future borrowing costs and access to capital markets.
Moody’s rating on our Senior Notes is B1 and its outlook is stable and S&P’s rating on our SeniorNotes is BB- and its recovery rating is “3”.
Credit ratings are not recommendations to buy, sell or hold securities and may be subject torevision or withdrawal by the assigning rating organization. Each rating should be evaluated independentlyof any other rating.
Critical Accounting Policies
The preparation of financial statements and related disclosures in conformity with GAAP requiresmanagement to make estimates and assumptions that affect both the amount and the timing of recording ofassets, liabilities, revenues and expenses in the consolidated financial statements and accompanying notedisclosures. Our management routinely makes judgments and estimates about the effects of matters that areinherently uncertain. As the number of variables and assumptions affecting the probable future resolution ofthe uncertainties increase, these judgments become even more subjective and complex.
Our significant accounting policies are disclosed in Note 1 to our audited annual consolidatedfinancial statements included in Part IV of this annual report. While all of the significant accounting policiesare important to the consolidated financial statements, some of these policies may be viewed as having ahigh degree of judgment. On an ongoing basis using currently available information, management reviewsits estimates, including those related to accounting for, among other things, pension and other post-retirement benefit obligations, deferred income taxes (valuation allowance and permanent reinvestment),depreciation and amortization, future cash flows associated with impairment testing for long-lived assets,the allocation of the purchase price in a business combination to the assets acquired and liabilities assumed,legal liabilities and contingencies. Actual results could differ materially from these estimates, and changesin these estimates are recorded when known.
The following accounting policies require management’s most difficult, subjective and complexjudgments, and are subject to a fair degree of measurement uncertainty.
(80)
Pension and Other Post-Retirement Benefit Obligations
We maintain a defined benefit pension plan and other post-retirement benefit plan for certainemployees at our Celgar mill which is funded based on actuarial estimates and requirements and arenon-contributory. We recognize the net funded status of the plan and we record net periodic benefit costsassociated with these net obligations. As at December 31, 2017, we had pension and other post-retirementbenefit obligations aggregating $59.1 million and accumulated pension plan assets with a fair value of$37.1 million. Our 2017 net periodic pension and other post-retirement benefit costs were $2.2 million. Theamounts recorded for the net pension and other post-retirement obligations include various judgments anduncertainties.
The following inputs are used to determine our net obligations and our net periodic benefit costseach year and the determination of these inputs requires judgment:
• discount rate – used to determine the net present value of our pension and other post-retirement benefit obligations and to determine the interest cost component of our netperiodic pension and other post-retirement benefit costs;
• return on assets – used to estimate the growth in the value of invested assets that areavailable to satisfy pension obligations and to determine the expected return on the planassets component of our net periodic pension costs;
• mortality rate – used to estimate the impact of mortality on pension and other post-retirement benefit obligations;
• rate of compensation increase – used to calculate the impact future pay increases will haveon pension benefit obligations; and
• health care cost trend rate – used to calculate the impact of future health care costs on otherpost-retirement benefit obligations.
For the discount rate, we use the rates available on high-quality corporate bonds with a durationthat is expected to match the timing of expected pension and other post-retirement benefit obligations. High-quality corporate bonds are those with a rating of “AA” or better.
In determining the expected return on assets, we consider the historical long-term returns, expectedasset mix and the active management premium.
For the mortality rate we use actuarially-determined mortality tables that are consistent with ourhistorical mortality experience and future expectations for mortality of the employees who participate in ourpension and other post-retirement benefit plans.
In determining the rate of compensation increase, we review historical compensation increases andpromotions, while considering current industry conditions, the terms of collective bargaining agreementswith employees and the outlook for the industry.
For the health care cost trend rate, we consider historical trends for these costs, as well as recentlyenacted healthcare legislation. We also compare our health care rate to those of our industry.
(81)
Variations in assumptions described above could have a significant effect on the pension and otherpost-retirement benefits net periodic benefit cost and obligation reported in our consolidated financialstatements. For example, a one-percentage point change in any one of the following assumptions wouldhave increased (decreased) our 2017 net periodic benefit cost and our accrued benefit obligation as follows:
Net periodic benefit cost Accrued benefit obligation
As at December 31, 2017, we had $1.4 million in deferred tax assets and $32.0 million in deferredtax liabilities, resulting in a net deferred tax liability of $30.6 million. Our tax assets are net of a$75.7 million valuation allowance. Our deferred tax assets are comprised primarily of tax loss and interestcarryforwards and deductible temporary differences, all of which will reduce taxable income in the future.We assess the realization of these deferred tax assets at each reporting period to determine whether it ismore likely than not that the deferred tax assets will be realized. Our assessment includes a review of allavailable positive and negative evidence, including, but not limited to, the following:
• the history of the tax loss carryforwards and their expiry dates;
• future reversals of temporary differences;
• our historical and projected earnings; and
• tax planning opportunities.
Significant judgment is required when evaluating the positive and negative evidence, specificallythe Company’s estimates of future earnings. The weight given to negative and positive evidence iscommensurate with the extent to which it can be objectively verified. Operating results during the mostrecent three-year period are generally given more weight than expectations of future profitability, which areinherently uncertain. A cumulative loss position during the most recent three-year period is consideredsignificant negative evidence in assessing the realizability of deferred income tax assets that is difficult toovercome.
Once our evaluation of the evidence is complete, if we believe that it is more likely than not thatsome of the deferred tax assets will not be realized, based on currently available information, an income taxvaluation allowance is recorded against the deferred tax assets.
If market conditions improve or tax planning opportunities arise in the future, we may reduce ourvaluation allowance, resulting in future tax benefits. If market conditions deteriorate in the future, we mayincrease our valuation allowance, resulting in future tax expenses. Any change in tax laws may change thevaluation allowances in future periods.
Property, Plant and Equipment
As at December 31, 2017, we had property, plant and equipment recorded in our ConsolidatedBalance Sheet of $844.8 million. In 2017, we recorded depreciation and amortization for property, plant andequipment of $80.9 million.
(82)
The calculation of depreciation and amortization of property, plant and equipment requires us toapply judgment in selecting the remaining useful lives of the assets. The remaining useful life of an assetmust address both physical and economic considerations. The remaining economic life of property, plantand equipment may be shorter than its physical life. The pulp industry in recent years has been characterizedby considerable uncertainty in business conditions. Estimates of future economic conditions for ourproperty, plant and equipment and therefore, their remaining useful economic life, require considerablejudgment.
If our estimate of the remaining useful life changes, such a change is accounted for prospectively inour determination of depreciation and amortization. Actual depreciation and amortization charges for anindividual asset may therefore be significantly accelerated if the outlook for its remaining useful life isshortened considerably.
We evaluate property, plant and equipment for impairment whenever events or changes incircumstances indicate that the carrying value of an asset may not be recoverable. In performing the reviewof recoverability, we estimate future cash flows expected to result from the use of the asset and its eventualdisposition. The estimates of future cash flows, based on reasonable and supportable assumptions andprojections, require management to make subjective judgments. In addition, the time periods for estimatingfuture cash flows is often lengthy, which increases the sensitivity of the assumptions made. Depending onthe assumptions and estimates used, the estimated future cash flows projected in the evaluation of property,plant and equipment can vary within a wide range of outcomes. Our management considers the likelihoodof possible outcomes in determining the best estimate of future cash flows. If actual results are notconsistent with the assumptions and judgments used in estimating future cash flows and asset fair values,actual impairment losses could vary materially, either positively or negatively, from estimated impairmentlosses.
Business Combination
We allocate the total purchase of the assets acquired and liabilities assumed based on theirestimated fair values as of the business combination date. In developing estimates of fair values for long-lived assets, including identifiable intangible assets, we utilize a variety of inputs including forecasted cashflows, discount rates, estimated replacement costs and depreciation and obsolescence factors. Determiningthe fair value for specifically identified intangible assets such as contracts involves judgment. We mayrefine our estimates and make adjustments to the assets acquired and liabilities assumed over ameasurement period, not to exceed one year. Upon the conclusion of the measurement period or the finaldetermination of the values of assets acquired and liabilities assumed, whichever comes first, anysubsequent adjustments are charged to earnings. Subsequent actual results of the underlying businessactivity supporting the specifically identified intangible assets could change, requiring us to recordimpairment charges or accelerate the remaining useful life.
Contingent Liabilities
We are subject to lawsuits, investigations and other claims related to environmental, product andother matters, and are required to assess the likelihood of any adverse judgments or outcomes to thesematters, as well as potential ranges of probable losses. We disclose contingent liabilities when there is areasonable possibility that an ultimate loss may occur and we record contingent liabilities when it becomesprobable that we will have to make payments and the amount of loss can be reasonably estimated.
Assessing probability of loss and estimating probable losses requires analysis of multiple factors,including, but not limited to, the following:
• historical experience;
(83)
• judgments about the potential actions of third party claimants and courts; and
• recommendations of legal counsel.
Contingent liabilities are based on the best information available and actual losses in any futureperiod are inherently uncertain. If estimated probable future losses or actual losses exceed our recordedliability for such claims, we would record additional charges. These exposures and proceedings can besignificant and the ultimate negative outcomes could be material to our operating results or liquidity in anygiven quarter or year.
New Accounting Standards
See Note 1 to our consolidated financial statements included in Item 15 of this annual report onForm 10-K.
(84)
ITEM 7A. QUANTITATIVE AND QUALITATIVE DISCLOSURES ABOUT MARKET RISK
We are exposed to risks associated with fluctuations in:
• foreign currency exchange rates;
• prices for the products we manufacture and in particular for NBSK pulp and lumber;
• fiber costs;
• credit risk; and
• interest rates.
For a discussion of our earnings sensitivities to foreign exchange rates, NBSK pulp and lumberprices and fiber costs, see Item 7. “Management’s Discussion and Analysis of Financial Condition andResults of Operations – Sensitivities” on page 73 hereof.
Foreign Currency Exchange Risk
We compete with producers from around the world, particularly Europe and North America, in ourproduct lines. We sell our principal product, pulp, mainly in transactions denominated in dollars but sellcertain other products including energy and European lumber in local currencies, being euros and Canadiandollars. Changes in the relative strength or weakness of the dollar versus the euro and the Canadian dollaraffect our operating costs and margins. A stronger dollar lowers our operating costs but can in turn increasethe cost of pulp to our customers and thereby create downward pressure on prices. On the other hand, aweaker dollar tends to increase our operating costs but tends to support higher pulp prices.
We are particularly sensitive to changes in the value of the dollar versus the euro and Canadiandollar. We expect exchange rate fluctuations to continue to impact costs and revenues, but we cannot predictthe magnitude or direction of this effect for any period, and there can be no assurance of any future effects.
Furthermore, certain of our assets and liabilities are denominated in euros and Canadian dollars. Adepreciation of these currencies against the dollar will decrease the fair value of such financial instrumentassets and an appreciation of these currencies against the dollar will increase the fair value of such financialinstrument liabilities, thereby decreasing our fair value. An appreciation of these currencies against thedollar will increase the fair value of such financial instrument assets and a depreciation of these currenciesagainst the dollar will decrease the fair value of financial instrument liabilities, thereby increasing our fairvalue. As a result, our earnings can be subject to the potentially significant effect of foreign currencytranslation gains or losses in respect of these euros and Canadian dollar items.
(85)
The following table provides information about our exposure to foreign currency exchange ratefluctuations for the carrying amount of financial instruments sensitive to such fluctuations as atDecember 31, 2017 and expected cash flows from these instruments:
Historically, economic and market shifts, fluctuations in capacity and changes in foreign currency exchangerates have created cyclical changes in prices, sales volume and margins for our products, particularly NBSKpulp and lumber. In general, our products are commodities that are widely available from other producersand, because these products have few distinguishing qualities from producer to producer, competition isbased primarily on price which is determined by supply relative to demand. The overall levels of demandfor the products we manufacture, and consequently our sales and profitability, reflect fluctuations in enduser demand.
Fiber Price Risk
Fiber in the form of wood chips, pulp logs and sawlogs represents our largest operating cost. Fiberis a market-priced commodity and, as such, is subject to fluctuations in prices based on supply and demand.Increases in the prices of fiber will tend to increase our operating costs and reduce our operating margins.
Interest Rate Risk
Fluctuations in interest rates may affect the fair value of fixed interest rate financial instrumentswhich are sensitive to such fluctuations. A decrease in interest rates may increase the fair value of suchfixed interest rate financial instrument assets and an increase in interest rates may decrease the fair value ofsuch fixed interest rate financial instrument liabilities, thereby increasing our fair value. An increase ininterest rates may decrease the fair value of such fixed interest rate financial instrument assets and adecrease in interest rates may increase the fair value of such fixed interest rate financial instrumentliabilities, thereby decreasing our fair value. We may seek to manage our interest rate risks through the useof interest rate derivatives.
(86)
The following tables provide information about our exposure to interest rate fluctuations for thefinancial instruments sensitive to such fluctuations as at December 31, 2017 and expected cash flows fromthese instruments:
As at December 31, 2017
TotalFair
Value
Expected maturity date
2018 2019 2020 2021 2022 Thereafter
(in thousands, other than percentages)LiabilitiesLong-term debt:Fixed rate ($)(1)(2)(3) . . . . . . . . . . . . . . 950,000 989,125 300,000 - - - 100,000 550,000
(1) 2022 Senior Notes bearing interest at 7.75%, principal amount $400.0 million. In January 2018, we redeemed $300.0 million principalamount of our 2022 Senior Notes. See Item 1. “Business – Description of Certain Indebtedness” for further information.
(2) 2024 Senior Notes bearing interest at 6.50%, principal amount $250.0 million.(3) 2026 Senior Notes bearing interest at 5.50%, principal amount $300.0 million.(4) Rosenthal Joint Revolving Facility bearing interest at Euribor plus 2.95%.
Credit Risk
We are exposed to credit risk on the accounts receivable from our customers. In order to manageour credit risk, we have adopted policies which include the analysis of the financial position of ourcustomers and the regular review of their credit limits. We also subscribe to credit insurance and, in somecases, require bank letters of credit. Our customers are mainly in the business of tissue, printing, paperconverting and other consumer products, as well as lumber wholesale and retail.
Risk Management and Derivatives
We seek to manage these risks through internal risk management policies as well as the periodicuse of derivatives. We may use derivatives to reduce or limit our exposure to interest rate and currencyrisks. We may also use derivatives to reduce or limit our exposure to fluctuations in pulp and lumber prices.We use derivatives to reduce our potential losses or to augment our potential gains, depending on ourmanagement’s perception of future economic events and developments. These types of derivatives aregenerally highly speculative in nature. They are also very volatile as they are highly leveraged given thatmargin requirements are relatively low in proportion to notional amounts.
Many of our strategies, including the use of derivatives, and the types of derivatives selected by us,are based on historical trading patterns and correlations and our management’s expectations of futureevents. However, these strategies may not be effective in all market environments or against all types ofrisks. Unexpected market developments may affect our risk management strategies during this time, andunanticipated developments could impact our risk management strategies in the future. If any of the varietyof instruments and strategies we utilize is not effective, we may incur significant losses.
Derivatives are contracts between two parties where payments between the parties are dependentupon movements in the price of an underlying asset, index or financial rate. Examples of derivatives includeswaps, options and forward rate agreements. The notional amount of the derivatives is the contract amountused as a reference point to calculate the payments to be exchanged between the two parties and the notionalamount itself is not generally exchanged by the parties.
The principal derivatives we periodically use are interest rate derivatives, pulp price derivatives,energy derivatives and foreign exchange derivatives.
(87)
Interest rate derivatives include interest rate forwards (forward rate agreements) which arecontractual obligations to buy or sell an interest-rate-sensitive financial instrument on a future date at aspecified price. They also include interest rate swaps which are over-the-counter contracts in which twocounterparties exchange interest payments based upon rates applied to a notional amount.
Pulp price derivatives include fixed price pulp swaps which are contracts in which twocounterparties exchange payments based upon the difference between the market price of pulp and thenotional amount in the contract.
Energy derivatives include fixed electricity forward sales and purchase contracts which arecontractual obligations to buy or sell electricity at a future specified date. Our mills produce surpluselectricity that we sell to third parties. As a result, we monitor the electricity market closely. Where possibleand to the extent we think it is advantageous, we may sell into the forward market through forwardcontracts.
Foreign exchange derivatives include currency swaps which involve the exchange of fixedpayments in one currency for the receipt of fixed payments in another currency. Such cross currency swapsinvolve the exchange of both interest and principal amounts in two different currencies. They also includeforeign exchange forwards which are contractual obligations in which two counterparties agree to exchangeone currency for another at a specified price for settlement at a pre-determined future date. Forwardcontracts are effectively tailor-made agreements that are transacted between counterparties in theover-the-counter market.
As at December 31, 2017, we had no outstanding derivatives. In 2016, we had no outstandingderivatives, other than our Stendal mill’s interest rate swap contract which matured and was terminated inOctober 2017.
However, in the future, we may from time to time use foreign exchange derivatives to convert someof our costs (including currency swaps relating to our long-term indebtedness) from euros to dollars as ourprincipal product is priced in dollars. We have also converted some of our costs to dollars by issuing long-term dollar-denominated debt in the form of our Senior Notes. We may also from time to time use pulp orlumber derivatives to fix price realizations and interest rate derivatives to fix the rate of interest onindebtedness.
We record unrealized gains and losses on our outstanding derivatives when they are marked tomarket at the end of each reporting period and realized gains or losses on them when they are settled. Wedetermine market valuations based primarily upon valuations provided by our counterparties.
We are exposed to modest credit related risks in the event of non-performance by counterparties toderivative contracts.
The following table and the notes thereto sets forth the maturity date, the notional amount, therecognized gain or loss and the strike and swap rates for derivatives that were in effect during 2017 and 2016:
December 31, 2017 December 31, 2016
Derivative Instrument Maturity DateNotionalAmount
RecognizedGain (Loss)
NotionalAmount
RecognizedGain (Loss)
(in millions) (in thousands) (in millions) (in thousands)Stendal interest rate swap(1) . . . . . . . . . . October 2017 $ - $ - $ 135.4 $ (241)
(1) In 2002, Stendal entered into the Stendal interest rate swap contract with respect to an aggregate maximum amount of approximately€612.6 million of the principal amount of the long-term indebtedness under its then credit facility. The remaining contract commencedin April 2005 for a notional amount of €612.6 million, with an interest rate of 5.28%, and the notional amount gradually decreased andthe contract terminated in October 2017.
(88)
ITEM 8. FINANCIAL STATEMENTS AND SUPPLEMENTARY DATA
The consolidated financial statements and supplementary data required with respect to this Item 8,and as listed in Item 15 of this annual report on Form 10-K, are included in this annual report on Form 10-Kcommencing on page 102.
ITEM 9. CHANGES IN AND DISAGREEMENTS WITH ACCOUNTANTS ON ACCOUNTINGAND FINANCIAL DISCLOSURE
Not applicable.
ITEM 9A. CONTROLS AND PROCEDURES
Evaluation of Disclosure Controls and Procedures
Our management, with the participation of our principal executive officer and principal financialofficer, has evaluated the effectiveness of our disclosure controls and procedures (as such term is defined inRules 13a-15(e) and 15d-15(e) under the Exchange Act), as of the end of the period covered by this annualreport on Form 10-K. Disclosure controls and procedures include, without limitation, controls andprocedures designed to ensure that information required to be disclosed in the reports we file or submitunder the Exchange Act is accumulated and communicated to management, including our principalexecutive officer and principal financial officer, as appropriate, to allow timely decisions regarding requireddisclosure. Based on such evaluation, our principal executive officer and principal financial officer haveconcluded that, as of the end of the period covered by this report, our disclosure controls and procedures areeffective in recording, processing, summarizing and reporting, on a timely basis, information required to bedisclosed by us in the reports that we file or submit under the Exchange Act.
It should be noted that any system of controls is based in part upon certain assumptions designed toobtain reasonable (and not absolute) assurance as to its effectiveness, and there can be no assurance that anydesign will succeed in achieving its stated goals.
Management’s Report on Internal Control Over Financial Reporting
Our management is responsible for establishing and maintaining adequate internal control overfinancial reporting. Mercer’s internal control over financial reporting is designed to provide reasonableassurance regarding the reliability of financial reporting and the preparation of financial statements forexternal purposes in accordance with generally accepted accounting principles.
Our internal control over financial reporting includes those policies and procedures that:
• Pertain to the maintenance of records that, in reasonable detail, accurately and fairly reflectthe transactions and dispositions of the assets of Mercer;
• Provide reasonable assurance that transactions are recorded as necessary to permitpreparation of financial statements in accordance with generally accepted accountingprinciples, and that receipts and expenditures are being made only in accordance withauthorizations of management and directors; and
• Provide reasonable assurance regarding prevention or timely detection of unauthorizedacquisition, use or disposition of assets that could have a material effect on the financialstatements.
Because of its inherent limitations, internal control over financial reporting may not prevent ordetect misstatements. Also, projections of any evaluation of effectiveness to future periods are subject to therisk that controls may become inadequate because of changes in conditions, or that the degree orcompliance with the policies or procedures may deteriorate.
(89)
Management assessed the effectiveness of Mercer’s internal control over financial reporting as ofDecember 31, 2017. In making this assessment, management used the criteria set forth in Internal Control-Integrated Framework, as issued in 2013 by the Committee of Sponsoring Organizations of the TreadwayCommission. Based on our assessment and those criteria, management concluded that Mercer maintainedeffective internal control over financial reporting as of December 31, 2017.
The effectiveness of Mercer’s internal control over financial reporting as of December 31, 2017 hasbeen audited by PricewaterhouseCoopers LLP, an independent registered public accounting firm, as statedin their attestation report which appears within.
Changes in Internal Controls
There have been no changes in our internal control over financial reporting (as defined in Rules13a-15(f) and 15d-15(f) under the Exchange Act) during the period that have materially affected, or arereasonably likely to materially affect, our internal control over financial reporting.
ITEM 9B. OTHER INFORMATION
Not applicable.
(90)
PART III
ITEM 10. DIRECTORS, EXECUTIVE OFFICERS AND CORPORATE GOVERNANCE
Executive Chairman, Chief Executive Officer and Directors
We are governed by a board of directors, referred to as the “Board”, each member of which iselected annually. The following sets forth information relating to our directors and executive officers.
Jimmy S.H. Lee, Executive Chairman and Director, age 60, has served as director since May 1985,as President and Chief Executive Officer from 1992 to July 2015 and as Executive Chairman since July2015. In March 2016, Mr. Lee was appointed a director of Golden Valley Mines Ltd. Previously, during theperiod when MFC Bancorp Ltd. was our affiliate, he served as a director from 1986 and President from1988 to December 1996 when it was spun out. Mr. Lee was also a director of Quinsam Capital Corp. fromMarch 2004 to November 2007 and Fortress Paper Ltd. from August 2006 to April 2008. During Mr. Lee’stenure with Mercer, we acquired the Rosenthal mill and converted it to the production of kraft pulp,constructed and commenced operations at the Stendal mill and acquired the Celgar mill and the FriesauFacility. He holds a Bachelor of Science degree in Chemical Engineering from the University of BritishColumbia, Canada. Mr. Lee possesses particular knowledge and experience in our business as a “founder”and as our Chief Executive Officer for over 24 years. He also has broad knowledge and experience infinance and banking, credit markets, international pulp markets, derivative risk management and capitalallocation. Through his experience and background, Mr. Lee provides vision and leadership to the Board.Mr. Lee also provides the Board with insight and information regarding our strategy, operations andbusiness.
David M. Gandossi, Chief Executive Officer, President and Director, age 60, has served as adirector and as Chief Executive Officer and President since July 2015 and served as Executive Vice-President, Chief Financial Officer and Secretary from August 2003 to July 2015. His previous rolesincluded Chief Financial Officer and other senior executive positions with Formation Forest Products andPacifica Papers Inc. Mr. Gandossi has previously chaired a number of industry working committees orgroups including The B.C. Pulp and Paper Task Force, the BC Bio-economy Transformation Council andthe FPI National Research Advisory Committee. He also participated in the Pulp and Paper AdvisoryCommittee to the BC Competition Council and was a member of B.C.‘s Working Roundtable on Forestry.He is currently a director of FPInnovations, The Forest Products Association of Canada (FPAC) and TheCouncil of Forest Industries (COFI). Mr. Gandossi holds a Bachelor of Commerce degree from theUniversity of British Columbia and is a Fellow of the Institute of Chartered Professional Accountants ofBritish Columbia (ICABC).
Eric Lauritzen, Lead Director, Vice Chairman, age 79, has served as a director since June 2004.From 1994 until his retirement in 1998, he was President and Chief Executive Officer of HarmacPacific, Inc., a TSX-listed pulp producer that was acquired by Pope & Talbot Inc. From 1981 to 1994, heserved as Vice President, Pulp and Paper Marketing of MacMillan Bloedel Limited, a TSX-listed NorthAmerican pulp and paper company that was acquired by Weyerhaeuser Company Limited. Mr. Lauritzenhas accumulated extensive executive, production and marketing experience in the pulp and paper industry,particularly in the softwood kraft pulp sector. He received his Bachelor of Commerce degree in 1961 fromthe University of British Columbia and his M.B.A. in 1963 from Harvard Business School. Mr. Lauritzenbrings to the Board broad industry and leadership experience and understanding of the pulp business on aglobal basis, including sales and marketing. He also provides leadership to our Board on board practices,governance matters and succession planning in his role as the Lead Director of the Board.
William D. McCartney, Director, age 62, has served as a director since January 2003. He has beenthe President and Chief Executive Officer of Pemcorp Management Inc., a corporate finance and
(91)
management consulting firm, since its inception in 1990. From 1984 to 1990, he was a founding partner ofDavidson & Company, Chartered Accountants, where he specialized in business advisory services. He hasbeen involved with numerous capital restructuring and financing events involving several public companiesand brings substantial knowledge relating to the financial accounting and auditing processes. He is amember of the Local Advisory Committee of the TSX and TSX Venture Exchange. He is a charteredaccountant and has been a member of the Chartered Professional Accountants of Canada since 1980. Heholds a Bachelor of Arts degree in Business Administration from Simon Fraser University. Mr. McCartneyhas extensive experience in accounting, financial and capital markets. He provides the Board with insightand leads its review and understanding of accounting, financial and reporting matters. Mr. McCartneyprovides the Board experience and leadership on accounting and financial matters in his role as Chair of theBoard’s Audit Committee.
Bernard Picchi, Director, age 68, has served as a director since June 2011. He is now ManagingDirector of Private Wealth Management for Palisade Capital Management, LLC, of Fort Lee, New Jersey,and has been in that role since July 2009. Before joining Palisade, Mr. Picchi served as Managing Partner ofWillow Rock Associates from August 2008 through June 2009, a company which advised securities firmson energy investments. From March 2003 through July 2008, Mr. Picchi served as Senior Energy Analyst attwo independent research firms based in New York City, Foresight Research Solutions (2003-2005) andWall Street Access (2006-2008). From 1999 through 2002, he was Director of U.S. Equity Research atPittsburgh-based Federated Investors, where he also managed the Capital Appreciation Fund, a 5-star rated(during his tenure) $1.5 billion equity mutual fund. Before Federated Investors, Mr. Picchi enjoyed a20-year career on Wall Street (Salomon Brothers, Kidder Peabody, and Lehman Brothers) both as an award-winning energy analyst and as an executive (Director of U.S. Equity Research at Lehman in the mid-1990s).He began his post-college career at Mellon Bank in Pittsburgh, Pennsylvania. Mr. Picchi holds a Bachelorof Science degree in Foreign Service from Georgetown University, and he has achieved the professionaldesignation Chartered Financial Analyst. He has also served on various non-profit boards, most notably thatof the Georgetown University Library on which he has served for the past 30 years. Mr. Picchi brings to ourBoard his significant experience and financial expertise in the capital markets, investments and analysis ofpublic companies. His broad experience in the capital markets and particularly as a financial analyst andwealth manager provide the Board with valuable insight into the expectations, concerns and interests ofinvestors, shareholders and the capital markets generally.
James Shepherd, Director, age 65, has served as a director since June 2011. He is also currently adirector of Buckman Laboratories International Inc. Mr. Shepherd was President and Chief ExecutiveOfficer of Canfor Corporation from 2004 to 2007 and Slocan Forest Products Ltd. from 1999 to 2004. He isalso the former President of Crestbrook Forest Industries Ltd. and Finlay Forest Industries Limited and theformer Chairman of the Forest Products Association of Canada. Mr. Shepherd has previously served as adirector of Conifex Timber Inc., Canfor Corporation and Canfor Pulp Income Fund (now Canfor PulpProducts Inc.). Mr. Shepherd holds a degree in Mechanical Engineering from Queen’s University.Mr. Shepherd has held several chief executive officer leadership and other senior positions in the forestindustry. As a result, Mr. Shepherd brings to the Board extensive senior executive experience relevant toour operations and an understanding of all aspects of the forest products business, ranging from fiberharvesting to lumber and pulp and paper operations. He also brings to our Board significant experience andbackground in the designing, execution and implementation of large, complex capital projects at largemanufacturing facilities like our mills.
R. Keith Purchase, Director, age 73, has served as a director since June 2012. Mr. Purchase wasExecutive Vice-President and Chief Operating Officer for MacMillan Bloedel Ltd. from 1998 to 1999,President and Chief Executive Officer of TimberWest Forest Ltd. from 1994 to 1998 and ManagingDirector of Tasman Pulp and Paper from 1990 to 1994. Mr. Purchase was previously a director of Catalyst
(92)
Paper Corporation and Chair of its board of directors. Mr. Purchase has held several very senior positions insignificant companies involved in the forestry industry. He brings to the Board extensive senior executiveexperience relevant to the Company’s operations, as well as significant board of director leadershipexperience from a wide variety of companies.
Nancy Orr, Director, age 67, has served as a director since May 2013. Ms. Orr is also a director ofProtocol Biomass Corp., Prometic Life Sciences Inc., Ressources Québec Inc., and of AAA Trichomes, asubsidiary of Investissement Québec. Ms. Orr’s previous experience includes serving as President ofDynamis Group Inc. from 1991 to 2007, a private company involved in the energy and wood recyclingsectors in Europe and the United States. Ms. Orr also served as Interim Chief Financial Officer of RedlineCommunications Inc., where she also served as a director, Chair of its Audit Committee and a member of itsCompensation Committee. She brings to the Board significant experience as a senior executive, director andaudit and compensation committee member of a wide variety of publicly traded companies and governmentcorporations, including the Bank of Canada, Dundee Wealth Management Inc., Fibrek Inc., Donohue Inc.,les Services Financiers CDPQ – la Caisse de dépôt et placement du Québec, H.E.C. Montréal and FRVMedia Inc. Ms. Orr is a member of the Women Corporate Directors and a Fellow member of the CharteredProfessional Accountants of Quebec and holds a Master of Business Administration from Queen’sUniversity and a Bachelor of Arts degree from the University of Western Ontario. Ms. Orr brings to theBoard extensive experience and knowledge in the forest products industry and in financial and accountingmatters. She provides the Board with valuable experience and insight into board and governance practicesand accounting matters.
Marti Morfitt, Director, age 60, has served as a director since May 31, 2017. Ms. Morfitt iscurrently the President and Chief Executive Officer of River Rock Partners, Inc., a business consultinggroup based in Naples, Florida. Ms. Morfitt was the Chief Executive Officer of Airborne, Inc. from 2009 to2012, the President and Chief Executive Officer, Chief Operating Officer and a Director of CNS, Inc. andthe VP, Meals US of the Pillsbury Company from 1982 to 1998. She currently serves as a director of GracoInc. and lululemon athletica, Inc. Ms. Morfitt brings a track record of industry leading business performancein the consumer packaged goods industry. She brings to the Board extensive senior executive experience, aswell as significant public company board experience from a wide variety of companies.
Other Executive Officers
David K. Ure, Chief Financial Officer and Secretary, age 50, returned to Mercer in September2013, assuming the role of Senior Vice President, Finance from September 2013 to July 2015 and the roleof Chief Financial Officer and Secretary from July 2015. Prior to serving as Vice President, Finance ofSierra Wireless Inc., Mr. Ure was Vice President, Controller at Mercer from 2006 to 2010. He has alsoserved as Controller at various companies including Catalyst Paper Corp., Pacifica Papers Inc., and TrojanLithograph Corporation, as well as Chief Financial Officer and Secretary of Finlay Forest Industries Inc.Mr. Ure has over 15 years’ experience in the forest products industry. He also has served on variousnon-profit boards in the neuro developmental research, child disability and family support spaces andcurrently sits on the boards of Kids Brain Health Network Inc., Semiahmoo House Society and PeninsulaEstates Housing Society. He holds a Bachelor of Commerce in Finance from the University of BritishColumbia, Canada and is a member of the Chartered Professional Accountants of Canada.
Adolf Koppensteiner, Chief Operating Officer, age 56, has served as Managing Director,Operations and Technical of the Stendal mill since October 2013, prior to which he served as Mill Managerat the Rosenthal mill since joining Mercer in 2007. In the past, Mr. Koppensteiner was Managing Directorof Kvaerner Central Europe, where he was responsible for sales and service for fifteen years. His whole
(93)
career has been in the pulp and paper industry, where he has held a variety of positions building upsignificant experience in engineering, project work, and pulp mill start-ups, as well as the development andoptimization of operating processes.
Leonhard Nossol, age 60, has served as our Group Controller for Europe since August 2005. Hehas also been Managing Director of Rosenthal since 1997 and the sole Managing Director of Rosenthalsince 2005. Before joining Mercer, Mr. Nossol was Director, Finance and Administration for a Germanhousehold appliance producer from 1992 to 1997. Prior to this, he was Operations Controller at GrundigAG (consumer electronics) in Nürnberg. Mr. Nossol has been a member of the board of directors of thePulp and Paper Association of Germany since 2014 and was elected as the speaker of the forest and woodunit of such association since 2014. He has been a member of the German Industry Federation’s (BDI) TaxCommittee since 2003. He was elected President of the German Wood Users Association (AGR) in 2013.He is also a member of the Scientific Advisory Board of Germany’s Thünen Insitute, the federal researchinstitute for forestry, fishery and agriculture. Mr. Nossol holds a Political Science degree from FreieUniversität Berlin and a degree in Business Management from the University of Applied Sciences in Berlin.
Richard Short, age 50, has served as Vice President, Controller since February 2014 and asController from November 2010 to February 2014, prior to which he served as Controller and Director,Corporate Finance since joining Mercer in 2007. Previous roles include Controller, Financial Reportingfrom 2006 to 2007 and Director, Corporate Finance from 2004 to 2006 with Catalyst Paper Corporation andAssistant Controller at The Alderwoods Group, Inc. Mr. Short holds a Bachelor of Arts in Psychology fromthe University of British Columbia and has been a member of the Chartered Professional Accountants ofCanada since 1993.
Eric X. Heine, age 54, has served as Vice President of Sales and Marketing for North America andAsia since June 2005. Mr. Heine was previously Vice President Pulp and International Paper Sales andMarketing for Domtar Inc. from 1999 to 2005. Mr. Heine has over twenty-five years of experience in thepulp and paper industry, including developing strategic sales channels and market partners to buildcorporate brands. He holds a Bachelor of Science in Forestry (Wood Science) from the University ofToronto, Canada.
Wolfram Ridder, age 56, has served as Vice President of Business Development since 2005, priorto which he served as Managing Director at Mercer’s Stendal mill from 2001 to 2005. Mr. Ridder alsoserved as Vice President Pulp Operations, Assistant to CEO from 1999 to 2005 and Assistant ManagingDirector at the Rosenthal mill from 1995 to 1998. Prior to joining Mercer, Mr. Ridder worked as a Scientistfor pulping technology development at the German Federal Research Center for Wood Science andTechnology in Hamburg from 1988 to 1995. Mr. Ridder has a Master of Business Administration and aMaster of Wood Science and Forest Product Technology from Hamburg University.
Genevieve Stannus, age 47, has served as Treasurer since July 2005, prior to which she served asSenior Financial Analyst since joining Mercer in August 2003. Prior to her role at Mercer, Ms. Stannus heldSenior Treasury Analyst positions with Catalyst Paper Corporation and Pacifica Papers Inc. Ms. Stannushas over twenty years of experience in the forest products industry. She is a member of the CharteredProfessional Accountants of Canada.
Brian Merwin, age 44, has served as Vice President, Strategic Initiatives since February 2009.Mr. Merwin previously held roles within Mercer such as Director, Strategic and Business Initiatives, andBusiness Analyst. He was a key member of the Celgar Energy Project, and was instrumental in thedevelopment of the B.C. Hydro energy purchase agreement and securing the ecoENERGY grant.Mr. Merwin has a Master of Business Administration from the Richard Ivey School of Business in Ontario,Canada and a Bachelor of Commerce degree from the University of British Columbia, Canada.
(94)
We also have experienced mill managers at all of our mills who have operated through multiplebusiness cycles in the pulp industry.
The Board met nine times during 2017 and, with the exception of Ms. Morfitt, each currentmember of the Board attended 100% of the total number of such meetings and meetings of the committeesof the Board on which they serve during their term. In addition, our independent directors regularly meet inseparate executive sessions without any member of our management present. The Lead Director presidesover these meetings. Although we do not have a formal policy with respect to attendance of directors at ourannual meetings, all directors are encouraged and expected to attend such meetings if possible. All of ourdirectors with the exception of Ms. Morfitt attended our 2017 annual meeting.
The Board has developed corporate governance guidelines in respect of: (i) the duties andresponsibilities of the Board, its committees and officers; and (ii) practices with respect to the holding ofregular quarterly and strategic meetings of the Board including separate meetings of non-managementdirectors. The Board has established four standing committees, the Audit Committee, the Compensation andHuman Resources Committee, the Governance and Nominating Committee and the Environmental, Healthand Safety Committee.
Audit Committee
The Audit Committee was established in accordance with Section 3(a)(58)(A) of the Exchange Actand functions pursuant to a charter adopted by the directors. A copy of the current charter is incorporated byreference in the exhibits to this Form 10-K and is available on our website at www.mercerint.com under the“Governance” link. The function of the Audit Committee generally is to meet with and review the results ofthe audit of our financial statements performed by the independent registered public accounting firm and torecommend the selection of an independent registered public accounting firm. The members of the AuditCommittee are Mr. McCartney, Ms. Orr and Ms. Morfitt, each of whom is independent under applicablelaws and regulations and the listing requirements of the NASDAQ Global Select Market. Mr. McCartney isa Chartered Professional Accountant and a “financial expert” within the meaning of such term under theSarbanes-Oxley Act of 2002. The Audit Committee met four times in 2017.
The Audit Committee has established procedures for: (i) the receipt, retention and treatment ofcomplaints received by us regarding accounting, internal accounting controls or auditing matters; and(ii) the confidential and anonymous submission by our employees and others of concerns regardingquestionable accounting or auditing matters. A person wishing to notify us of such a complaint or concernshould send a written notice thereof, marked “Private & Confidential”, to the Chairman of the AuditCommittee, Mercer International Inc., c/o Suite 1120, 700 West Pender Street, Vancouver, BritishColumbia, Canada V6C 1G8.
Compensation and Human Resources Committee
The Board has established a Compensation and Human Resources Committee. The Compensationand Human Resources Committee is responsible for reviewing and approving the strategy and design of ourcompensation, equity-based and benefits programs. The Compensation and Human Resources Committeefunctions pursuant to a charter adopted by the directors, a copy of which is available on our website atwww.mercerint.com in the Corporate Governance Guidelines under the “Governance” link. TheCompensation and Human Resources Committee is also responsible for approving all compensation actionsrelating to executive officers. The members of the Compensation and Human Resources Committee areMr. Picchi, Mr. Shepherd, Ms. Orr and Ms. Morfitt, each of whom is independent under applicable laws andregulations and the listing requirements of the NASDAQ Global Select Market. The Compensation andHuman Resources Committee met five times in 2017.
(95)
Governance and Nominating Committee
The Board has established a Governance and Nominating Committee comprised of Mr. Lauritzen,Mr. McCartney and Mr. Purchase, each of whom is independent under applicable laws and regulations andthe listing requirements of the NASDAQ Global Select Market. The Governance and NominatingCommittee functions pursuant to a charter adopted by the directors, a copy of which is incorporated byreference in the exhibits to this Form 10-K and is available on our website at www.mercerint.com in theCorporate Governance Guidelines under the “Governance” link. The purpose of the committee is to:(i) manage the corporate governance system of the Board; (ii) assist the Board in fulfilling its duties to meetapplicable legal and regulatory and self-regulatory business principles and codes of best practice; (iii) assistin the creation of a corporate culture and environment of integrity and accountability; (iv) in conjunctionwith the Lead Director, monitor the quality of the relationship between the Board and management;(v) review management succession plans; (vi) recommend to the Board nominees for appointment to theBoard; (vii) lead the Board’s annual review of the Chief Executive Officer’s performance; and (viii) set theBoard’s forward meeting agenda. The Governance and Nominating Committee met four times in 2017.
Environmental, Health and Safety Committee
The Board established an Environmental, Health and Safety Committee in 2006, currentlycomprised of Mr. Shepherd, Mr. Purchase, Mr. Lee and Mr. Gandossi, to review on behalf of the Board thepolicies and processes implemented by management, and the resulting impact and assessments of all ourenvironmental, health and safety related activities. The Environmental, Health and Safety Committeefunctions pursuant to a charter adopted by the directors, a copy of which is available on our website atwww.mercerint.com in the Corporate Governance Guidelines under the “Governance” link. Morespecifically, the Environmental, Health and Safety Committee is to: (i) review and approve, and if necessaryrevise, our environmental, health and safety policies and environmental compliance programs; (ii) monitorour environmental, health and safety management systems including internal and external audit results andreporting; and (iii) provide direction to management on the frequency and focus of external independentenvironmental, health and safety audits. The Environmental, Health and Safety Committee met four times in2017.
Lead Director/Deputy Chairman
The Board appointed Mr. Lauritzen as Lead Director in 2012. The role of the Lead Director is toprovide leadership to the non-management directors on the Board and to ensure that the Board can operateindependently of management and that directors have an independent leadership contact. The duties of theLead Director include, among other things: (i) ensuring that the Board has adequate resources to support itsdecision-making process and ensuring that the Board is appropriately approving strategy and supervisingmanagement’s progress against that strategy; (ii) ensuring that the independent directors have adequateopportunity to meet to discuss issues without management being present; (iii) chairing meetings of directorsin the absence of the Chairman and Chief Executive Officer; (iv) ensuring that delegated committeefunctions are carried out and reported to the Board; and (v) communicating to management, as appropriate,the results of private discussions among outside directors and acting as a liaison between the Board and theChief Executive Officer.
Code of Business Conduct and Ethics and Anti-Corruption Policy
The Board has adopted a Code of Business Conduct and Ethics that applies to our directors,employees and executive officers and an Anti-Corruption Policy. The code and the policy are available onour website at www.mercerint.com under the “Governance” link. Copies of the code and the policy mayalso be obtained without charge upon request to Investor Relations, Mercer International Inc., Suite 1120,700 West Pender Street, Vancouver, British Columbia, Canada V6C 1G8 (Telephone: (604) 684-1099).
The information required under “Section 16(a) Beneficial Ownership Reporting Compliance” isincorporated by reference from the proxy statement relating to our annual meeting to be held in 2018, whichwill be filed with the SEC within 120 days of our most recently completed fiscal year.
ITEM 11. EXECUTIVE COMPENSATION
The information required by this Item 11 is incorporated by reference from the proxy statementrelating to our annual meeting to be held in 2018, which will be filed with the SEC within 120 days of ourmost recently completed fiscal year.
ITEM 12. SECURITY OWNERSHIP OF CERTAIN BENEFICIAL OWNERS ANDMANAGEMENT AND RELATED STOCKHOLDER MATTERS
The information required by this Item 12 is incorporated by reference from the proxy statementrelating to our annual meeting to be held in 2018, which will be filed with the SEC within 120 days of ourmost recently completed fiscal year.
ITEM 13. CERTAIN RELATIONSHIPS AND RELATED TRANSACTIONS, AND DIRECTORINDEPENDENCE
Review, Approval or Ratification of Transactions with Related Persons
Pursuant to the terms of the Audit Committee Charter, the Audit Committee is responsible forreviewing and approving the terms and conditions of all proposed transactions between us, any of ourofficers, directors or shareholders who beneficially own more than 5% of our outstanding shares of commonstock, or relatives or affiliates of any such officers, directors or shareholders, to ensure that such relatedparty transactions are fair and are in our overall best interest and that of our shareholders. In the case oftransactions with employees, a portion of the review authority is delegated to supervising employeespursuant to the terms of our written Code of Business Conduct and Ethics.
The Audit Committee has not adopted any specific procedures for conduct of reviews and considerseach transaction in light of the facts and circumstances. In the course of its review and approval of atransaction, the Audit Committee considers, among other factors it deems appropriate:
• Whether the transaction is fair and reasonable to us;
• The business reasons for the transaction;
• Whether the transaction would impair the independence of one of our non-employeedirectors; and
• Whether the transaction is material, taking into account the significance of the transaction.
Any member of the Audit Committee who is a related person with respect to a transaction underreview may not participate in the deliberations or vote respecting approval or ratification of the transaction,provided, however, that such director may be counted in determining the presence of a quorum at a meetingof the committee that considers the transaction.
The information called for by Items 404(a) and 407(a) of Regulation S-K required to be includedunder this Item 13 is incorporated by reference from the proxy statement relating to our annual meeting tobe held in 2018, which will be filed with the SEC within 120 days of our most recently completed fiscalyear.
(97)
ITEM 14. PRINCIPAL ACCOUNTANT FEES AND SERVICES
The information required by this Item 14 is incorporated by reference from the proxy statementrelating to our annual meeting to be held in 2018, which will be filed with the SEC within 120 days of ourmost recently completed fiscal year.
(98)
PART IV
ITEM 15. EXHIBITS AND FINANCIAL STATEMENT SCHEDULES
All schedules are omitted because they are not applicable or the required information is shown inthe consolidated financial statements or notes thereto.
(a)(3) Exhibits
Exhibits that are not filed herewith have been previously filed with the SEC and are incorporatedherein by reference.
3.1 Articles of Incorporation of Mercer International Inc., as amended. Incorporated by referencefrom Form 8-A filed March 2, 2006.
3.2 Bylaws of Mercer International Inc. Incorporated by reference from Form 8-A filed March 2,2006.
4.1 Indenture dated November 26, 2014 between Mercer International Inc. and Wells Fargo Bank,National Association, as trustee, relating to the 2022 Senior Notes. Incorporated by referencefrom Form 8-K filed November 28, 2014.
4.2 Indenture dated February 3, 2017 between Mercer International Inc. and Wells Fargo Bank,National Association, as trustee, relating to the 2024 Senior Notes. Incorporated by referencefrom Form 8-K filed February 3, 2017.
4.3 Indenture dated December 20, 2017 between Mercer International Inc. and Wells Fargo Bank,National Association, as trustee, relating to the 2026 Senior Notes. Incorporated by referencefrom Form 8-K filed December 20, 2017.
10.1 Revolving Credit Facility Agreement dated November 25, 2014 among Zellstoff Stendal GmbH,UniCredit Bank AG, Credit Suisse AG, London Branch, Royal Bank of Canada and BarclaysBank PLC. Incorporated by reference from Form 8-K filed November 28, 2014.
10.2 Form of Trustee’s Indemnity Agreement between Mercer International Inc. and its Trustees.Incorporated by reference from Form 10-K filed March 31, 2003.
10.3† Mercer International Inc. 2010 Stock Incentive Plan. Incorporated by reference from AppendixA to Mercer International Inc.’s definitive proxy statement on Schedule 14A filed April 24,2014.
10.4† Employment Agreement effective September 1, 2005 between Mercer International Inc. andLeonhard Nossol dated August 18, 2005. Incorporated by reference from Form 10-Q filedMay 6, 2008.
(99)
10.5† Employment Agreement dated October 2, 2006 between Stendal Pulp Holding GmbH andWolfram Ridder. Incorporated by reference from Form 8-K filed October 3, 2006.
10.6 Electricity Purchase Agreement effective January 27, 2009 between Zellstoff Celgar LimitedPartnership and British Columbia Hydro and Power Authority. Incorporated by reference fromForm 10-K filed March 2, 2009. Certain non-public information has been omitted from theappendices to Exhibit 10.9 pursuant to a request for confidential treatment filed with the SEC.Such non-public information was filed with the SEC on a confidential basis. The SEC approvedthe request for confidential treatment in March 2009.
10.7 Second Amended and Restated Credit Agreement dated as of May 2, 2013 among ZellstoffCelgar Limited Partnership, as borrower, and the lenders from time to time parties thereto, aslenders, and Canadian Imperial Bank of Commerce, as agent. Incorporated by reference fromForm 8-K filed May 8, 2013.
10.8 Asset Purchase Agreement between Mercer Timber Products GmbH (formerlyBlitz B16-230 GmbH), Mercer International Inc., Klausner Holz Thüringen GmbH and FritzKlausner dated February 21, 2017. Incorporated by reference from Form 10-Q filed April 28,2017.
10.9 Revolving Credit Facility Agreement among Zellstoff-Und Papierfabrik Rosenthal GmbH andMercer Timber Products GmbH, as borrowers, and UniCredit Bank AG, as bender, datedApril 12, 2017. Incorporated by reference from Form 10-Q filed April 28, 2017.
10.10† Employment Agreement between Mercer International Inc. and David Ure dated August 12,2013. Incorporated by reference from Form 8-K filed on July 19, 2015.
10.11 First Amending Agreement dated October 21, 2014 between Zellstoff Celgar LimitedPartnership, Mercer International Inc., as guarantor, and Canadian Imperial Bank of Commerce.Incorporated by reference from Form 10-Q filed October 31, 2014.
10.12† Amendment to Employment Agreement between Mercer International Inc. and David Ure, datedJuly 17, 2015. Incorporated by reference from Form 8-K filed July 19, 2015.
10.13† Second Amended and Restated Employment Agreement between Mercer International Inc. andJimmy S.H. Lee, dated for reference September 29, 2015. Incorporated by reference from Form8-K filed September 28, 2015.
10.14† Amended and Restated Employment Agreement between Mercer International Inc. and DavidM. Gandossi, dated for reference September 29, 2015. Incorporated by reference from Form 8-Kfiled September 28, 2015.
10.15 Registration Rights Agreement dated February 3, 2017 between Mercer International Inc. andCredit Suisse Securities (USA) LLC, related to the 2024 Senior Notes. Incorporated by referencefrom Form 8-K filed on February 3, 2017.
10.16 Registration Rights Agreement dated March 27, 2017 between Mercer International Inc. andCredit Suisse Securities (USA) LLC, related to the 2024 Senior Notes. Incorporated by referencefrom Form 8-K filed on March 27, 2017.
10.17 Registration Rights Agreement dated December 20, 2017 between Mercer International Inc. andCredit Suisse Securities (USA) LLC, related to the 2026 Senior Notes. Incorporated by referencefrom Form 8-K filed on December 20, 2017.
21.1* List of Subsidiaries of Registrant.
23.1* Consent of PricewaterhouseCoopers LLP.
(100)
31.1* Section 302 Certificate of Chief Executive Officer.
31.2* Section 302 Certificate of Chief Financial Officer.
32.1* Section 906 Certificate of Chief Executive Officer.
32.2* Section 906 Certificate of Chief Financial Officer.
101* The following financial statements from the Company’s annual report on Form 10-K for the yearended December 31, 2017, filed with the SEC on February 16, 2018, formatted in ExtensibleBusiness Reporting Language (XBRL): (i) Consolidated Statements of Operations;(ii) Consolidated Statements of Comprehensive Income (Loss); (iii) Consolidated BalanceSheets; (iv) Consolidated Statements of Changes in Shareholders’ Equity; (v) ConsolidatedStatements of Cash Flows; and (vi) Notes to the Consolidated Financial Statements.
* Filed herewith.† Denotes management contract or compensatory plan or arrangement.
ITEM 16. FORM 10-K SUMMARY
None.
(101)
Report of Independent Registered Public Accounting Firm
To the Shareholders and Board of Directors of Mercer International Inc.
Opinions on the Financial Statements and Internal Control over Financial ReportingWe have audited the accompanying consolidated balance sheets of Mercer International Inc. and itssubsidiaries, (together, the Company) as of December 31, 2017 and 2016, and the related consolidatedstatements of operations, comprehensive income (loss), changes in shareholders’ equity and cash flows foreach of the three years in the period ended December 31, 2017, including the related notes (collectivelyreferred to as the consolidated financial statements). We also have audited the Company’s internal controlover financial reporting as of December 31, 2017, based on criteria established in Internal Control -Integrated Framework (2013) issued by the Committee of Sponsoring Organizations of the TreadwayCommission (COSO).
In our opinion, the consolidated financial statements referred to above present fairly, in all material respects,the financial position of the Company as of December 31, 2017 and 2016, and their results of operationsand their cash flows for each of the three years in the period ended December 31, 2017 in conformity withaccounting principles generally accepted in the United States of America. Also in our opinion, the Companymaintained, in all material respects, effective internal control over financial reporting as of December 31,2017, based on criteria established in Internal Control – Integrated Framework (2013) issued by the COSO.
Basis for OpinionsThe Company’s management is responsible for these consolidated financial statements, for maintainingeffective internal control over financial reporting, and for its assessment of the effectiveness of internalcontrol over financial reporting, included in Management’s Report on Internal Control over FinancialReporting appearing under Item 9A. Our responsibility is to express opinions on the Company’sconsolidated financial statements and on the Company’s internal control over financial reporting based onour audits. We are a public accounting firm registered with the Public Company Accounting OversightBoard (United States) (PCAOB) and are required to be independent with respect to the Company inaccordance with the U.S. federal securities laws and the applicable rules and regulations of the Securitiesand Exchange Commission and the PCAOB. We conducted our audits in accordance with the standards ofthe PCAOB. Those standards require that we plan and perform the audits to obtain reasonable assuranceabout whether the consolidated financial statements are free of material misstatement, whether due to erroror fraud, and whether effective internal control over financial reporting was maintained in all materialrespects.
Our audits of the consolidated financial statements included performing procedures to assess the risks ofmaterial misstatement of the consolidated financial statements, whether due to error or fraud, andperforming procedures that respond to those risks. Such procedures included examining, on a test basis,evidence regarding the amounts and disclosures in the consolidated financial statements. Our audits alsoincluded evaluating the accounting principles used and significant estimates made by management, as wellas evaluating the overall presentation of the consolidated financial statements. Our audit of internal controlover financial reporting included obtaining an understanding of internal control over financial reporting,
(102)
assessing the risk that a material weakness exists, and testing and evaluating the design and operatingeffectiveness of internal control based on the assessed risk. Our audits also included performing such otherprocedures as we considered necessary in the circumstances. We believe that our audits provide areasonable basis for our opinions.
Definition and limitations of internal control over financial reportingA company’s internal control over financial reporting is a process designed to provide reasonable assuranceregarding the reliability of financial reporting and the preparation of consolidated financial statements forexternal purposes in accordance with generally accepted accounting principles. A company’s internalcontrol over financial reporting includes those policies and procedures that (i) pertain to the maintenance ofrecords that, in reasonable detail, accurately and fairly reflect the transactions and dispositions of the assetsof the company; (ii) provide reasonable assurance that transactions are recorded as necessary to permitpreparation of consolidated financial statements in accordance with generally accepted accountingprinciples, and that receipts and expenditures of the company are being made only in accordance withauthorizations of management and directors of the company; and (iii) provide reasonable assuranceregarding prevention or timely detection of unauthorized acquisition, use, or disposition of the company’sassets that could have a material effect on the consolidated financial statements.
Because of its inherent limitations, internal control over financial reporting may not prevent or detectmisstatements. Also, projections of any evaluation of effectiveness to future periods are subject to the riskthat controls may become inadequate because of changes in conditions, or that the degree of compliancewith the policies or procedures may deteriorate.
/s/ PricewaterhouseCoopers LLP
Chartered Professional AccountantsVancouver, CanadaFebruary 16, 2018
We have served as the Company’s auditors since 2007.
The accompanying notes are an integral part of these consolidated financial statements.
(107)
MERCER INTERNATIONAL INC.NOTES TO THE CONSOLIDATED FINANCIAL STATEMENTS
(In thousands of U.S. dollars, except share and per share data)
Note 1. The Company and Summary of Significant Accounting Policies
Background
Mercer International Inc. (“Mercer Inc.”) is a Washington corporation and its shares of common stock arequoted and listed for trading on the NASDAQ Global Market and the Toronto Stock Exchange.
Mercer Inc. operates three pulp manufacturing facilities, one in Canada and two in Germany, and is one ofthe largest producers of market northern bleached softwood kraft (“NBSK”) pulp in the world.
On April 12, 2017, the Company through its wholly owned subsidiary, Mercer Timber Products GmbH,referred to as “MTP” acquired substantially all of the assets of a German sawmill, and a bio-mass powerplant, near Friesau, Germany (the “Friesau Facility”).
In these consolidated financial statements, unless otherwise indicated, all amounts are expressed in U.S.dollars (“$”). The symbol “€” refers to euros and the symbol “C$” refers to Canadian dollars.
Basis of Presentation
These consolidated financial statements contained herein include the accounts of Mercer Inc. and all of itssubsidiaries (collectively, the “Company”). The Company’s consolidated financial statements have beenprepared in accordance with accounting principles generally accepted in the U.S. (“GAAP”). All significantintercompany balances and transactions have been eliminated upon consolidation.
Use of Estimates
Preparation of financial statements and related disclosures in conformity with GAAP requires managementto make estimates and assumptions that affect the amounts reported in the financial statements andaccompanying notes. Significant management judgment is required in determining the accounting for,among other things, pension and other post-retirement benefit obligations, deferred income taxes (valuationallowance and permanent reinvestment), depreciation and amortization, future cash flows associated withimpairment testing for long-lived assets, the allocation of the purchase price in a business combination tothe assets acquired and liabilities assumed, legal liabilities and contingencies. Actual results could differmaterially from these estimates, and changes in these estimates are recorded when known.
Significant Accounting Policies
Cash, Cash Equivalents and Restricted Cash
Cash and cash equivalents include cash held in bank accounts and highly liquid investments with originalmaturities of three months or less. Restricted cash is comprised of cash deposits that are designated for thesettlement of debt or which cannot be withdrawn without prior notice or penalty.
Accounts Receivable
Accounts receivable are recorded at cost, net of an allowance for doubtful accounts. The Company reviewsthe collectability of receivables at each reporting date. The Company maintains an allowance for doubtful
(108)
MERCER INTERNATIONAL INC.NOTES TO THE CONSOLIDATED FINANCIAL STATEMENTS
(In thousands of U.S. dollars, except share and per share data)
Note 1. The Company and Summary of Significant Accounting Policies (continued)
accounts at an amount estimated to cover the potential losses on certain uninsured receivables. Any amountsthat are determined to be uncollectible and uninsured are offset against the allowance. The allowance isbased on the Company’s evaluation of numerous factors, including the payment history and financialposition of the debtors. For certain customers the Company receives a letter of credit prior to shipping itsproduct.
Inventories
Inventories of raw materials, finished goods and work in progress are valued at the lower of cost, using theweighted-average cost method, or net realizable value. Spare parts and other materials are valued at thelower of cost and replacement cost. Cost includes labor, materials and production overhead and isdetermined by using the weighted average cost method. Raw materials inventories include pulp logs,sawlogs and wood chips. These inventories are located both at the mills and at various offsite locations. Inaccordance with industry practice, physical inventory counts utilize standardized techniques to estimatequantities of pulp logs, sawlogs and wood chip inventory volumes. These techniques historically haveprovided reasonable estimates of such inventories.
Property, Plant and Equipment
Property, plant and equipment is stated at cost less accumulated depreciation. Depreciation of buildings andproduction equipment is based on the estimated useful lives of the assets and is computed using the straight-line method. Buildings are depreciated over 10 to 50 years and production and other equipment primarilyover 25 years.
The costs of major rebuilds, replacements and those expenditures that substantially increase the useful livesof existing property, plant, and equipment are capitalized, as well as interest costs associated with majorcapital projects until ready for their intended use. The cost of repairs and maintenance as well as plannedshutdown maintenance performed on manufacturing facilities, composed of labor, materials and otherincremental costs, is recognized as an expense in the Consolidated Statement of Operations as incurred.
Leases which transfer to the Company substantially all the risks and benefits incidental to ownership of theleased item are capitalized at the present value of the minimum lease payments. Capital leases aredepreciated over the lease term. Operating lease payments are recognized as an expense in the ConsolidatedStatement of Operations on a straight-line basis over the lease term.
The Company provides for asset retirement obligations when there is a legislated or contractual basis forthose obligations. An obligation is recorded as a liability at fair value in the period in which the Companyincurs a legal obligation associated with the retirement of an asset. The associated costs are capitalized aspart of the carrying value of the related asset and amortized over its remaining useful life. The liability isaccreted using a credit adjusted risk-free interest rate.
Impairment of Long-Lived Assets
The Company reviews its long-lived assets, consisting of property, plant and equipment and finite-lifeintangibles, for impairment whenever events or changes in circumstances indicate that the carrying value of
(109)
MERCER INTERNATIONAL INC.NOTES TO THE CONSOLIDATED FINANCIAL STATEMENTS
(In thousands of U.S. dollars, except share and per share data)
Note 1. The Company and Summary of Significant Accounting Policies (continued)
such assets may not be recoverable. To determine recoverability, the Company compares the carrying valueof the assets to the estimated future undiscounted cash flows. Measurement of an impairment loss for long-lived assets held for use is based on the fair value of the asset.
Government Grants
The Company records investment grants from federal and state governments when the conditions of theirreceipt are complied with and there is reasonable assurance that the grants will be received. Grants related toassets are government grants whose primary condition is that the company qualifying for them shouldpurchase, construct or otherwise acquire long-term assets. Secondary conditions may also be attached,including restricting the type or location of the assets and/or other conditions that must be met. Grantsrelated to assets are deducted from the cost of the assets in the Consolidated Balance Sheet.
Grants related to income are government grants which are either unconditional, related to reducedenvironmental emissions or related to the Company’s normal business operations, and are reported as areduction of related expenses in the Consolidated Statement of Operations when the conditions of theirreceipt are complied with and there is reasonable assurance that the grants will be received.
The Company is required to pay certain fees based on wastewater emissions at its German mills. Accruedfees can be reduced upon the mills’ demonstration of reduced wastewater emissions. The fees are expensedas incurred and the fee reduction is recognized once the Company has reasonable assurance that the Germanregulators will accept the reduced level of wastewater emissions. There may be a significant period of timebetween recognition of the wastewater expense and recognition of the wastewater fee reduction.
Pension Plans
The Company maintains a defined benefit pension plan for its salaried employees at its Celgar mill which isfunded and non-contributory. The cost of the benefits earned by the salaried employees is determined usingthe projected benefit method prorated on services. The pension expense reflects the current service cost, theinterest on the unfunded liability and the amortization over the estimated average remaining service life ofthe employees of (i) prior service costs, and (ii) the net actuarial gain or loss that exceeds 10% of the greaterof the accrued benefit obligation and the fair value of plan assets as at the beginning of the year. TheCompany recognizes the net funded status of the plan.
In addition, hourly-paid employees at the Celgar mill are covered by a multiemployer pension plan forwhich contributions are charged against earnings in the Consolidated Statement of Operations.
Foreign Operations and Currency Translation
The Company determines its foreign subsidiaries’ functional currency by reviewing the currency of theprimary economic environment in which the foreign subsidiaries operate, which is normally the currency ofthe environment in which the foreign subsidiaries generate and expend cash. The Company translates assetsand liabilities of its non-U.S. dollar functional currency subsidiaries into U.S. dollars using the rate in effectat the balance sheet date and revenues and expenses are translated at the average rate of exchangethroughout the period. Foreign currency translation gains and losses are recognized within accumulatedother comprehensive loss in shareholders’ equity.
(110)
MERCER INTERNATIONAL INC.NOTES TO THE CONSOLIDATED FINANCIAL STATEMENTS
(In thousands of U.S. dollars, except share and per share data)
Note 1. The Company and Summary of Significant Accounting Policies (continued)
Transactions in foreign currencies are translated to the respective functional currencies of each operationusing exchange rates at the dates of the transactions. Monetary assets and liabilities denominated in foreigncurrencies at the reporting date are translated to the functional currency using the exchange rate at that date.Non-monetary assets and liabilities denominated in foreign currencies are translated to the functionalcurrency using historical exchange rates. Gains and losses resulting from foreign currency transactionsrelated to operating activities are included in costs and expenses while those related to non-operatingactivities are included in other income (expenses) in the Consolidated Statement of Operations.
Where intercompany loans are of a long-term investment nature, exchange rate changes are included as aforeign currency translation adjustment within accumulated other comprehensive loss in shareholders’equity.
Revenue Recognition
The Company recognizes revenue for pulp, lumber, wood products and chemical sales when persuasiveevidence of an arrangement exists, the sales price is fixed or determinable, title of ownership and risk ofloss have passed to the customer and collectability is reasonably assured.
Title of ownership and risk of loss depends on the shipping mode specified in the sales contract. ForEuropean sales sent by truck or train from the mills directly to the customer, the contracted sales terms aresuch that title and ownership transfers once the truck/train leaves the mill. For orders that are sent by oceanfreighter, the contract terms state that title and ownership transfers at the time the product passes the shipsrail. For certain of our North American sales shipped by truck or train, our contracts state that ownershiptransfers once the truck or train has arrived at the customer’s location. The sales price is included in thesales contract and is net of customer discounts, rebates and other selling concessions.
Energy revenues are recognized as the electricity is consumed by customers and when collection isreasonably assured. These revenues include an estimate of the value of electricity transferred to customersin the period but billed subsequent to period-end. Customer bills are based on agreed upon rates and meterreadings that indicate electricity consumption.
Value added, sales and other taxes the Company collects concurrent with revenue-producing activities areexcluded from revenues.
Shipping and Handling Costs
Amounts charged to customers for shipping and handling costs are recognized as revenue in theConsolidated Statement of Operations. Shipping and handling costs incurred by the Company are includedin operating costs in the Consolidated Statement of Operations.
Stock-Based Compensation
The Company recognizes stock-based compensation expense over an award’s requisite service period basedon the award’s fair value in selling, general, and administrative expenses within the Consolidated Statementof Operations. The Company issues new shares upon the exercise of stock-based compensation awards.
(111)
MERCER INTERNATIONAL INC.NOTES TO THE CONSOLIDATED FINANCIAL STATEMENTS
(In thousands of U.S. dollars, except share and per share data)
Note 1. The Company and Summary of Significant Accounting Policies (continued)
For performance share units (“PSUs”) which have the same grant and service inception date, the fair valueis based upon the targeted number of shares to be awarded and the quoted market price of the Company’sshares at that date. For PSUs where the service inception date precedes the grant date, the fair value is basedupon the targeted number of shares awarded and the quoted price of the Company’s shares at each reportingdate up to the grant date. The target number of shares is determined using management’s best estimate. Thefinal determination of the number of shares to be granted is made by the Company’s Board of Directors.The Company estimates forfeitures of PSUs based on management’s expectations and recognizescompensation cost only for those awards expected to vest. Estimated forfeitures are adjusted to actualexperience at each balance sheet date.
The fair value of restricted shares is determined based upon the number of shares granted and the quotedprice of the Company’s shares on the date of grant.
Deferred Income Taxes
Deferred income taxes are recognized using the asset and liability method, whereby deferred tax assets andliabilities are recognized for the future tax consequences attributable to differences between the financialstatement carrying amounts of existing assets and liabilities and their respective tax basis, and operating lossand tax credit carryforwards. Valuation allowances are provided if, after considering both positive andnegative available evidence, it is more likely than not that some or all of the net deferred tax assets will notbe realized.
Deferred income taxes are determined separately for each tax-paying component of the Company. For eachtax-paying component, all deferred tax liabilities and assets are offset and presented as a single net amount.
Derivative Financial Instruments
The Company occasionally enters into derivative financial instruments to manage certain market risks.These derivative instruments are not designated as hedging instruments and accordingly, are recorded at fairvalue on the Consolidated Balance Sheet with the changes in fair value recognized in other income(expenses) in the Consolidated Statement of Operations. Periodically, the Company enters into derivativecontracts to supply materials for its own use and as such are exempt from mark-to-market accounting.
Fair Value Measurements
The fair value methodologies and, as a result, the fair value of the Company’s financial instruments aredetermined based on the fair value hierarchy provided in the Fair Value Measurements and Disclosurestopic of the Financial Accounting Standards Board (“FASB”) Accounting Standards Codification, and areas follows:
Level 1 – Valuations based on quoted prices in active markets for identical assets and liabilities.
Level 2 – Valuations based on observable inputs in active markets for similar assets and liabilities, otherthan Level 1 prices, such as quoted commodity prices or interest or currency exchange rates.
(112)
MERCER INTERNATIONAL INC.NOTES TO THE CONSOLIDATED FINANCIAL STATEMENTS
(In thousands of U.S. dollars, except share and per share data)
Note 1. The Company and Summary of Significant Accounting Policies (continued)
Level 3 – Valuations based on significant unobservable inputs that are supported by little or no marketactivity, such as discounted cash flow methodologies based on internal cash flow forecasts.
The financial instrument’s fair value measurement level within the fair value hierarchy is based on thelowest level of any input that is significant to the fair value measurement.
Net Income Per Common Share
Basic net income per common share is computed by dividing net income by the weighted average numberof common shares outstanding in the period. Diluted net income per common share is calculated to giveeffect to all potentially dilutive common shares outstanding by applying the “Treasury Stock” and“If-Converted” methods. Instruments that could have a potentially dilutive effect on the Company’sweighted average shares outstanding include all or a portion of outstanding stock options, restricted shares,restricted share units, performance shares and PSUs.
New Accounting Pronouncements
Accounting Pronouncements Implemented
In July 2015, the FASB issued Accounting Standards Update 2015-11, Simplifying the Measurement ofInventory (“ASU 2015-11”) which requires that inventory within the scope of this update, includinginventory stated at average cost, be measured at the lower of cost and net realizable value. This update iseffective for financial statements issued for fiscal years beginning after December 15, 2016. The adoption ofASU 2015-11 did not impact the Company’s financial position.
In March 2016, the FASB issued Accounting Standards Update 2016-09, Improvements to EmployeeShare-Based Payment Accounting (“ASU 2016-09”) which simplifies several aspects of accounting forshare-based payment transactions including income tax consequences, classification of awards as eitherequity or liabilities, classification on the statement of cash flows and accounting for forfeitures. This updateis effective for financial statements issued for fiscal years beginning after December 15, 2016. The adoptionof ASU 2016-09 did not impact the Company’s financial position.
Accounting Pronouncements Not Yet Implemented
In May 2014, the FASB issued Accounting Standards Update 2014-09, Revenue Recognition – Revenuefrom Contracts with Customers (“ASU 2014-09”) that requires companies to recognize revenue when acustomer obtains control rather than when companies have transferred substantially all risks and rewards ofa good or service. In 2016 the FASB issued the following Accounting Standards which further affect theguidance of ASU 2014-09:
• March 2016: ASU 2016-08, Principal versus Agent Considerations (Reporting Revenue Grossversus Net);
• April 2016: ASU 2016-10, Identifying Performance Obligations and Licensing;• May 2016: ASU 2016-12, Revenue from Contracts with Customers: Narrow Scope
Improvements and Practical Expedients; and
(113)
MERCER INTERNATIONAL INC.NOTES TO THE CONSOLIDATED FINANCIAL STATEMENTS
(In thousands of U.S. dollars, except share and per share data)
Note 1. The Company and Summary of Significant Accounting Policies (continued)
• December 2016: ASU 2016-20, Technical Corrections and Improvements to Topic 606,Revenue from Contracts with Customers.
These standards are effective for annual reporting periods after December 15, 2017. The Company willadopt this standard as at January 1, 2018 using the modified retroactive method.
The Company has completed its assessment of the impact of these standards on the Company’s financialposition and believes the new standards will not have a material impact. The majority of the Company’srevenue arises from contracts with customers in which the sale of goods is the main performance obligationunder the customer contract. Accordingly, revenue will be recognized at a point in time when control of theasset is transferred to the customer which is generally consistent with the Company’s current accountingpolicies. In addition, the Company does not provide significant discounts or volume-based incentives thatcould be a source of variable consideration. Any pricing discounts offered are known at the time the order isplaced and the price is agreed to with the customer.
ASU 2014-09 provides presentation and disclosure requirements which are more detailed than under currentGAAP. The Company has therefore developed internal controls and procedures to collect the requiredinformation to comply with the additional required financial statement disclosures.
In February 2016, the FASB issued Accounting Standards Update 2016-02, Leases (“ASU 2016-02”) whichrequires lessees to recognize virtually all of their leases on the balance sheet, by recording a right-of-useasset and liability. This update is effective for financial statements issued for fiscal years beginning afterDecember 15, 2018, with early adoption permitted at the beginning of an interim or annual reporting period.The Company is currently assessing the impact the adoption of ASU 2016-02 will have on its consolidatedfinancial statements.
In October 2016, the FASB issued Accounting Standards Update 2016-16, Intra-Entity Transfers of AssetsOther Than Inventory (“ASU 2016-16”) which eliminates the deferral of the tax effects of intra-entity assettransfers other than inventory until the transferred assets are sold to a third party or recovered through use.This update is effective on a modified retrospective approach for fiscal years beginning after December 15,2017, and interim periods within those fiscal years. The Company believes this new standard will not have amaterial impact on its consolidated financial statements.
In January 2017, the FASB issued Accounting Standards Update 2017-01, Clarifying the Definition of aBusiness (“ASU 2017-01”) which revises the definition of a business. When substantially all of the fairvalue of gross assets acquired is concentrated in a single asset (or a group of similar assets), the assetacquired would not represent a business. This update is effective for fiscal years beginning afterDecember 15, 2017, and interim periods within those fiscal years. The Company believes this new standardwill not have a material impact on its consolidated financial statements.
In March 2017, the FASB issued Accounting Standards Update 2017-07, Improving the Presentation of NetPeriodic Pension Cost and Net Periodic Post-Retirement Benefit Cost (“ASU 2017-07”) which requires thatan employer report the service cost component in the same line item or items as other compensation costsarising from services rendered by the pertinent employees during the period. The other components of netbenefit cost are required to be presented in the income statement separately from the service cost component
(114)
MERCER INTERNATIONAL INC.NOTES TO THE CONSOLIDATED FINANCIAL STATEMENTS
(In thousands of U.S. dollars, except share and per share data)
Note 1. The Company and Summary of Significant Accounting Policies (continued)
and outside a subtotal of income from operations. This standard is effective for fiscal years beginning afterDecember 15, 2017 and should be applied retrospectively to all periods presented. The Company believesthis new standard will not have a material impact on its consolidated financial statements.
In August 2017, the FASB issued Accounting Standards Update 2017-12, Derivatives and Hedging (“ASU2017-12”) which expands and refines hedge accounting for both nonfinancial and financial risk componentsand aligns the recognition and presentation of the effects of the hedging instrument and the hedged item inthe financial statements. This standard is effective for fiscal years beginning after December 15, 2018. Earlyapplication is permitted in any interim period and all transition requirements and elections should be appliedto hedging relationships existing on the date of adoption. The Company believes this new standard will nothave a material impact on its consolidated financial statements.
Note 2. Acquisition
On April 12, 2017, the Company, through its wholly owned subsidiary MTP acquired the Friesau Facility, aGerman sawmill and bio-mass power plant near Friesau, Germany, for $61,627 cash. The acquisition of theFriesau Facility presents the Company with the opportunity to expand into the German lumber market andgrow its bio-mass energy profile.
The following summarizes the Company’s allocation of the purchase price to the fair value of the assetsacquired and liabilities assumed at the acquisition date:
(a) Amortizable intangible assets relate to an energy sales agreement, which has an estimated fair value of $15,970 and is being amortizedon a straight line basis over 11 years and enterprise resource planning software, which has an estimated fair value of $1,810 and is beingamortized on a straight line basis over five years.
The Friesau Facility is a business under GAAP, accordingly the Company began consolidating the results ofoperations, financial position and cash flows of the Friesau Facility in the Consolidated FinancialStatements as of the acquisition date. The amount of the Friesau Facility’s revenues and net incomeincluded in the Consolidated Statements of Operations for the year ended December 31, 2017 was $97,430and $1,601, respectively. In the year ended December 31, 2017, $868 of acquisition related costs wererecognized in selling, general and administrative expenses in the Consolidated Statements of Operations.
The following unaudited pro forma information represents the Company’s results of operations as if theacquisition of the Friesau Facility had occurred on January 1, 2016. This pro forma information does not
(115)
MERCER INTERNATIONAL INC.NOTES TO THE CONSOLIDATED FINANCIAL STATEMENTS
(In thousands of U.S. dollars, except share and per share data)
Note 2. Acquisition (continued)
purport to be indicative of the results that would have occurred for the periods presented or that may beexpected in the future.
The unaudited pro forma information includes additional interest expense related to debt issued to financethe acquisition and adjustments related to acquisition costs and depreciation and amortization. Theadjustments were immaterial and the nonrecurring items are included in the earliest period presented.
As at December 31, 2017, property, plant and equipment was net of $243,164 of unamortized governmentinvestment grants (2016 – $233,186). As at December 31, 2017, included in production and otherequipment is equipment under capital leases which had gross amounts of $35,648 (2016 – $31,916), and
(116)
MERCER INTERNATIONAL INC.NOTES TO THE CONSOLIDATED FINANCIAL STATEMENTS
(In thousands of U.S. dollars, except share and per share data)
Note 5. Property, Plant and Equipment (continued)
accumulated depreciation of $13,954 (2016 – $9,712). During the year ended December 31, 2017,production and other equipment totaling $145 was acquired under capital lease obligations (2016 – $17,792;2015 – $70).
The Company maintains industrial landfills on its premises for the disposal of waste, primarily from themills’ pulp processing activities. The mills have obligations under their landfill permits to decommissionthese disposal facilities pursuant to certain regulations. As at December 31, 2017, the Company hadrecorded $5,278 (2016 – $4,716) of asset retirement obligations in capital leases and other in theConsolidated Balance Sheet.
Certain of the Company’s debt instruments were issued under agreements which, among other things, maylimit its ability and the ability of its subsidiaries to make certain payments, including dividends. Theselimitations are subject to specific exceptions. As at December 31, 2017, the Company is in compliance withthe terms of its debt agreements.
(a) On December 20, 2017, the Company issued $300,000 in aggregate principal amount of 5.50% seniornotes which mature on January 15, 2026 (“2026 Senior Notes”). The 2026 Senior Notes were issued ata price of 100% of their principal amount. The net proceeds of the offering were $293,749, afterdeducting the underwriter’s discount and offering expenses.
In January 2018, the Company used the net proceeds, together with cash on hand, to purchase$300,000 in aggregate principal amount of 2022 Senior Notes (herein defined below). In connectionwith this purchase the Company incurred a loss on settlement of debt of $21,515 in the ConsolidatedStatement of Operations. As at December 31, 2017, the total cash used to purchase the 2022 SeniorNotes was classified as restricted cash and the carrying value of the 2022 Senior Notes was classifiedas a current liability in the Consolidated Balance Sheet.
On February 3, 2017, the Company issued $225,000 in aggregate principal amount of 6.50% seniornotes which mature on February 1, 2024 (“2024 Senior Notes”) and on March 16, 2017, the Companyissued an additional $25,000 in aggregate principal amount of its 2024 Senior Notes. The 2024 SeniorNotes were issued at a price of 100.00% of their principal amount. The net proceeds of the offeringswere $244,711, after deducting the underwriter’s discount and offering expenses. The net proceeds,together with cash on hand, were used to finance the Company’s acquisition of the Friesau Facility, topurchase $227,000 of remaining aggregate principal amount of outstanding 2019 Senior Notes (hereindefined below) and for general working capital purposes. In connection with the debt purchase theCompany recorded a loss on settlement of debt of $10,696 in the Consolidated Statement ofOperations.
On November 26, 2014, the Company issued $650,000 of senior notes consisting of $250,000 inaggregate principal amount of 7.00% senior notes which were to mature on December 1, 2019 (“2019Senior Notes”) and $400,000 in aggregate principal amount of 7.75% senior notes which mature onDecember 1, 2022 (“2022 Senior Notes” and collectively with the 2019 Senior Notes, the “2019 and2022 Senior Notes” and collectively with the 2024 Senior Notes and 2026 Senior Notes, the “Senior
(118)
MERCER INTERNATIONAL INC.NOTES TO THE CONSOLIDATED FINANCIAL STATEMENTS
(In thousands of U.S. dollars, except share and per share data)
Note 7. Debt (continued)
Notes”). The 2019 and 2022 Senior Notes were issued at a price of 100% of their principal amount.The net proceeds of the offering were $635,949, after deducting the underwriter’s discount andoffering expenses.
The Senior Notes are general unsecured senior obligations of the Company. They rank equal in right ofpayment with all existing and future unsecured senior indebtedness of the Company and are senior inright of payment to any current or future subordinated indebtedness of the Company. The Senior Notesare effectively junior in right of payment to all existing and future secured indebtedness, to the extentof the assets securing such indebtedness, and all indebtedness and liabilities of the Company’ssubsidiaries.
The Company may redeem all or a part of the 2026 Senior Notes, upon not less than 10 days’ or morethan 60 days’ notice, at the redemption prices (expressed as percentages of principal amount) discussedbelow, plus accrued and unpaid interest to (but not including) the applicable redemption date. TheCompany may redeem all or a part of the 2024 Senior Notes or 2022 Senior Notes, upon not less than30 days’ or more than 60 days’ notice, at the redemption prices (expressed as percentages of principalamount) discussed below, plus accrued and unpaid interest to (but not including) the applicableredemption date. The 2026 Senior Notes redemption prices are equal to 102.750% for the twelvemonth period beginning on January 15, 2021, 101.375% for the twelve month period beginning onJanuary 15, 2022, and 100.000% beginning on January 15, 2023 and at any time thereafter. The 2024Senior Notes redemption prices are equal to 103.250% for the twelve month period beginning onFebruary 1, 2020, 101.625% for the twelve month period beginning on February 1, 2021, and100.000% beginning on February 1, 2022 and at any time thereafter. The 2022 Senior Notesredemption prices are equal to 105.813% for the twelve month period beginning on December 1, 2017,103.875% for the twelve month period beginning on December 1, 2018, 101.938% for the twelvemonth period beginning on December 1, 2019, and 100.000% beginning on December 1, 2020 and atany time thereafter.
In March 2016, the Company purchased $23,000 in aggregate principal amount of its 2019 SeniorNotes. In connection with this purchase the Company recorded a loss on settlement of debt of $454 inthe Consolidated Statement of Operations.
(b) A €75.0 million revolving credit facility at the Stendal mill that matures in October 2019. Borrowingsunder the facility are collateralized by the mill’s inventory and accounts receivable and bear interest atEuribor plus 3.50%. As at December 31, 2017, approximately €75.0 million ($89,948) was available.
(c) A C$40.0 million revolving credit facility at the Celgar mill that matures in May 2019. Borrowingsunder the facility are collateralized by the mill’s inventory and accounts receivable and are restrictedby a borrowing base calculated on the mill’s inventory and accounts receivable. Canadian dollardenominated amounts bear interest at bankers acceptance plus 1.50% or Canadian prime. U.S. dollardenominated amounts bear interest at LIBOR plus 1.50% or U.S. base. As at December 31, 2017,approximately C$1.7 million ($1,354) was supporting letters of credit and approximatelyC$38.3 million ($30,531) was available.
(119)
MERCER INTERNATIONAL INC.NOTES TO THE CONSOLIDATED FINANCIAL STATEMENTS
(In thousands of U.S. dollars, except share and per share data)
Note 7. Debt (continued)
(d) In April 2017, in connection with the acquisition of the Friesau Facility, the Company replaced the€25.0 million revolving credit facility with a new €70.0 million joint revolving credit facility thatmatures in April 2022. The Rosenthal mill has full access to the available amount under the facility andMTP has access to a maximum of €45.0 million. Borrowings under the facility are collateralized by theborrowers’ inventory and accounts receivable and bear interest at Euribor plus 2.95%. As atDecember 31, 2017, approximately €21.0 million ($25,185) of this facility was drawn and accruinginterest at a rate of 2.95% and approximately €9.0 million ($10,819) of this facility was supportingbank guarantees leaving approximately €40.0 million ($47,947) available.
(e) A €5.0 million revolving credit facility at the Rosenthal mill that matures in December 2018.Borrowings under this facility bear interest at the rate of the three-month Euribor plus 2.50% and aresecured by certain land at the Rosenthal mill. As at December 31, 2017 approximately €3.1 million($3,708) of this facility was supporting bank guarantees leaving approximately €1.9 million ($2,288)available.
(f) In 2018, the Company’s wholly owned German subsidiary engaged in wood procurement and logistics,Mercer Holz GmbH, referred to as “Mercer Holz”, entered into a €25.0 million revolving credit facilitythat matures in February 2020. Borrowings under this facility bear interest at Euribor plus 3.30% andare secured by Mercer Holz’s inventory and accounts receivable.
Note 8. Pension and Other Post-Retirement Benefit Obligations
Defined Benefit Plans
Included in pension and other post-retirement benefit obligations are amounts related to the Company’sCelgar and Rosenthal mills. The largest component of these obligations is with respect to the Celgar millwhich maintains a defined benefit pension plan and other post-retirement benefit plans for certainemployees (the “Celgar Defined Benefit Plans”).
Pension benefits are based on employees’ earnings and years of service. The Celgar Defined Benefit Plansare funded by contributions from the Company based on actuarial estimates and statutory requirements.
(120)
MERCER INTERNATIONAL INC.NOTES TO THE CONSOLIDATED FINANCIAL STATEMENTS
(In thousands of U.S. dollars, except share and per share data)
Note 8. Pension and Other Post-Retirement Benefit Obligations (continued)
Information about the Celgar Defined Benefit Plans, in aggregate for the year ended December 31, 2017was as follows:
(1) The total of $22,141 on the Consolidated Balance Sheet also includes pension liabilities of $80 relating to employees at the Company’sRosenthal mill.
(121)
MERCER INTERNATIONAL INC.NOTES TO THE CONSOLIDATED FINANCIAL STATEMENTS
(In thousands of U.S. dollars, except share and per share data)
Note 8. Pension and Other Post-Retirement Benefit Obligations (continued)
Information about the Celgar Defined Benefit Plans, in aggregate for the year ended December 31, 2016was as follows:
(1) The total of $26,121 on the Consolidated Balance Sheet also includes pension liabilities of $79 relating to employees at the Company’sRosenthal mill.
The amortization of unrecognized items relates to net actuarial losses and prior service costs. The Companyexpects to recognize approximately $1,435 of net actuarial losses and prior service costs in 2018. TheCelgar Defined Benefit Plans do not have any net transition asset or obligation recognized as areclassification adjustment of other comprehensive income. There are no plan assets that are expected to bereturned to the Company in 2018.
(122)
MERCER INTERNATIONAL INC.NOTES TO THE CONSOLIDATED FINANCIAL STATEMENTS
(In thousands of U.S. dollars, except share and per share data)
Note 8. Pension and Other Post-Retirement Benefit Obligations (continued)
The Company anticipates that it will make contributions to the Celgar Defined Benefit Plans ofapproximately $26 in 2018. Estimated future benefit payments under the Celgar Defined Benefit Plans areas follows:
The discount rate assumption is adjusted annually to reflect the rates available on high-quality debtinstruments, with a duration that is expected to match the timing of expected pension and other post-retirement benefit obligations. High-quality debt instruments are corporate bonds with a rating of “AA” orbetter.
The expected rate of return on plan assets is a management estimate based on, among other factors,historical long-term returns, expected asset mix and active management premium.
The expected rate of compensation increase is a management estimate based on, among other factors,historical compensation increases and promotions, while considering current industry conditions, the termsof collective bargaining agreements with employees and the outlook for the industry.
(123)
MERCER INTERNATIONAL INC.NOTES TO THE CONSOLIDATED FINANCIAL STATEMENTS
(In thousands of U.S. dollars, except share and per share data)
Note 8. Pension and Other Post-Retirement Benefit Obligations (continued)
The assumed health care cost trend rates used to determine the other post-retirement benefit obligationswere as follows:
December 31,
2017 2016
Health care cost trend rate assumed for next year . . . . . . . . . . . . . . . . . . . . . . . . . . . . . . . . . 6.00% 6.00%Rate to which the cost trend is assumed to decline to (ultimate trend rate) . . . . . . . . . . . . . 4.50% 4.50%Year that the rate reaches the ultimate trend rate . . . . . . . . . . . . . . . . . . . . . . . . . . . . . . . . . . 2021 2020
The expected health care cost trend rates are based on historical trends for these costs, as well as recentlyenacted health care legislation. The Company also compares health care cost trend rates to those of theindustry.
A one-percentage point change in assumed health care cost trend rate would have the following effect onother post-retirement benefit obligations:
December 31, 2017 December 31, 2016
1% Increase 1% Decrease 1% Increase 1% Decrease
Effect on total service and interest rate components . . . . . $ 32 $ (34) $ 32 $ (34)Effect on other post-retirement benefit obligations . . . . . $ 601 $ (583) $ 578 $ (564)
Investment Objective and Asset Allocation
The investment objective for the defined benefit pension plan is to sufficiently diversify invested plan assetsto maintain a reasonable level of risk without imprudently sacrificing the return on the invested funds, andultimately to achieve a long-term total rate of return, net of fees and expenses, at least equal to the long-terminterest rate assumptions used for funding actuarial valuations. To achieve this objective, the Company’soverall investment strategy is to maintain an investment allocation mix of long-term growth investments(equities) and fixed income investments (debt securities). Investment allocation targets have beenestablished by asset class after considering the nature of the liabilities, long-term return expectations, therisks associated with key asset classes, inflation and interest rates and related management fees andexpenses. In addition, the defined benefit pension plan’s investment strategy seeks to minimize risk beyondlegislated requirements by constraining the investment managers’ investment options. There are a numberof specific constraints based on investment type, but they all have the general purpose of ensuring that theinvestments are fully diversified and that risk is appropriately managed. For example, there are constraintson the book value of assets that can be invested in any one entity or group, and all equity holdings must belisted on a public exchange. Reviews of the investment objectives, key assumptions and the independentinvestment managers are performed periodically.
Pension De-Risking Actions
During 2017 the Company initiated a pension de-risking strategy. The first step of the strategy resulted inchanging the target investment mix to 80% debt securities, to more effectively hedge the plan liabilities for
(124)
MERCER INTERNATIONAL INC.NOTES TO THE CONSOLIDATED FINANCIAL STATEMENTS
(In thousands of U.S. dollars, except share and per share data)
Note 8. Pension and Other Post-Retirement Benefit Obligations (continued)
inactive members, and 20% equity securities, to consider the inflationary effect of future salary increases forthe remaining active members. The following table presents the defined benefit pension plan’s assets fairvalue measurements as at December 31, 2017 under the fair value hierarchy:
Fair value measurements as at December 31, 2017 using:
Concentrations of Risk in the Defined Benefit Pension Plan’s Assets
The Company has reviewed the defined benefit pension plan’s investments and determined that they areallocated based on the specific investment manager’s stated investment strategy with only slight over- orunder-weightings within any specific category, and that those investments are within the constraints thathave been set by the Company. Those constraints include a limitation on the value that can be invested inany one entity or group and the investment category targets noted above. In addition, we have twoindependent investment managers. The Company has concluded that there are no significant concentrationsof risk.
Defined Contribution Plan
Effective December 31, 2008, the Celgar Defined Benefit Plans were closed to new members. In addition,the defined benefit service accrual ceased on December 31, 2008, and members began to receive pensionbenefits, at a fixed contractual rate, under a new defined contribution plan effective January 1, 2009. Duringthe year ended December 31, 2017, the Company made contributions of $959 (2016 – $743; 2015 – $646),to this plan.
Multiemployer Plan
The Company participates in a multiemployer plan for the hourly-paid employees at the Celgar mill. Thecontributions to the plan are determined based on a percentage of pensionable earnings pursuant to acollective bargaining agreement. The Company has no current or future contribution obligations in excessof the contractual contributions. Contributions during the year ended December 31, 2017 totaled $1,969(2016 – $1,944; 2015 – $1,390). Plan details are included in the following table:
Legal name
ProvinciallyRegistered
Plan Number
ExpirationDate of
CollectiveBargainingAgreement
Are the Company’sContributions Greater Than 5% of Total
Contributions?
2017 2016 2015
The Pulp and Paper Industry Pension Plan . . . . . P085324 April 30, 2021 No No No
(125)
MERCER INTERNATIONAL INC.NOTES TO THE CONSOLIDATED FINANCIAL STATEMENTS
(In thousands of U.S. dollars, except share and per share data)
Note 9. Income Taxes
Income before provision for income taxes by taxing jurisdiction was as follows:
The net income tax provision recognized in the Consolidated Statement of Operations for the years endedDecember 31, 2017, 2016 and 2015 was related to foreign tax jurisdictions.
The Company’s effective income tax rate can be affected by many factors, including but not limited to,changes in the mix of earnings in tax jurisdictions with differing statutory rates, changes in corporatestructure, changes in the valuation of deferred tax assets and liabilities, the result of audit examinations ofpreviously filed tax returns and changes in tax laws and rates. The asset and liability approach is used torecognize deferred tax assets and liabilities for the expected future tax consequences of temporarydifferences between the carrying amounts and the tax bases of assets and liabilities.
The Company and/or one or more of its subsidiaries file income tax returns in the U.S., Germany andCanada. Currently, the Company does not anticipate that the expiration of the statute of limitations or thecompletion of audits in the next fiscal year will result in liabilities for uncertain income tax positions thatare materially different than the amounts accrued or disclosed as at December 31, 2017. However, thiscould change as tax years are examined by taxing authorities, the timing of which are uncertain at this time.The German tax authorities have completed examinations up to and including the 2013 tax year for all butone German entity. For this entity the German tax authorities have completed examinations up to andincluding the 2007 tax year. The Company is generally not subject to U.S. or Canadian income taxexaminations for tax years before 2014 and 2013, respectively. The Company believes that it has adequatelyprovided for any reasonable foreseeable outcomes related to its tax audits and that any settlement will nothave a material adverse effect on its consolidated results.
The liability in the Consolidated Balance Sheet related to unrecognized tax benefits was $nil as atDecember 31, 2017 (2016 – $nil). The Company recognizes interest and penalties related to unrecognizedtax benefits in provision for income taxes in the Consolidated Statement of Operations. During the yearended December 31, 2017, the Company recognized $nil in interest and penalties (2016 – $nil; 2015 – $nil).
(126)
MERCER INTERNATIONAL INC.NOTES TO THE CONSOLIDATED FINANCIAL STATEMENTS
(In thousands of U.S. dollars, except share and per share data)
Note 9. Income Taxes (continued)
Differences between the U.S. Federal Statutory and the Company’s effective rates are as follows:
The following table details the scheduled expiration dates of the Company’s net operating loss, interest andincome tax credit carryforwards as at December 31, 2017:
At each reporting period, the Company assesses whether it is more likely than not that the deferred taxassets will be realized, based on the review of all available positive and negative evidence, including futurereversals of existing taxable temporary differences, estimates of future taxable income, past operatingresults and prudent and feasible tax planning strategies. The carrying value of the Company’s deferred taxassets reflects its expected ability to generate sufficient future taxable income in certain tax jurisdictions to
(128)
MERCER INTERNATIONAL INC.NOTES TO THE CONSOLIDATED FINANCIAL STATEMENTS
(In thousands of U.S. dollars, except share and per share data)
Note 9. Income Taxes (continued)
utilize these deferred income tax benefits. Significant judgment is required when evaluating this positiveand negative evidence.
The following table summarizes the changes in valuation allowances related to net deferred tax assets:
As at December 31, 2017, the Company has fully recognized all deferred tax assets for its German entitiesand has a full valuation allowance against the deferred tax assets for its U.S. and Canadian entities.
The Company has not recognized a tax liability on the undistributed earnings of foreign subsidiaries as atDecember 31, 2017 because these earnings are expected to be permanently reinvested outside the U.S. orrepatriated without incurring a tax liability. As at December 31, 2017, the cumulative amount ofundistributed earnings upon which U.S. income taxes have not been provided was approximately $443,000.
The Tax Cuts and Jobs Act
On December 22, 2017, the Tax Cuts and Jobs Act of 2017 (the “Act”) was signed into law makingsignificant changes to the Internal Revenue Code. Changes include, but are not limited to, a corporate taxrate decrease from 35% to 21% effective for tax years beginning after December 31, 2017, the transition ofU.S international taxation from a worldwide tax system to a territorial system, and a one-time transition taxon the mandatory deemed repatriation of cumulative foreign earnings as at December 31, 2017. TheCompany has calculated its best estimate of the impact of the Act in its year end income tax provision inaccordance with its understanding of the Act and guidance available as of the date of this filing.
On December 22, 2017, the SEC staff issued Staff Accounting Bulletin No. 118 (“SAB 118”), whichprovides guidance on accounting for the tax effects of the Act. SAB 118 provides a measurement periodthat should not extend beyond one year from the Act enactment date for companies to complete theaccounting under ASC 740, Income Taxes. In accordance with SAB 118, a company must reflect theincome tax effects of those aspects of the Act for which the accounting under ASC 740 is complete. To theextent that a company’s accounting for certain income tax effects of the Act is incomplete but it is able todetermine a reasonable estimate, it must record a provisional estimate in the financial statements.
As a result of the reduction of the corporate tax rate, the Company revalued its U.S. net deferred tax assetbalance, excluding after tax credits, as at December 31, 2017. Based on this revaluation, the net deferred taxasset was reduced by $27,445 and the Company recorded an offsetting reduction to the valuation allowanceas the Company has a full valuation allowance against its U.S. deferred tax assets.
(129)
MERCER INTERNATIONAL INC.NOTES TO THE CONSOLIDATED FINANCIAL STATEMENTS
(In thousands of U.S. dollars, except share and per share data)
Note 9. Income Taxes (continued)
The amount related to the one-time transition tax on the mandatory deemed repatriation of foreign earningswas $3,584 based on cumulative foreign earnings of $23,116. The Company has loss carryforwards whichwill be used to offset the tax.
Note 10. Shareholders’ Equity
Dividends
During the years ended December 31, 2017 and 2016 the Company’s Board of Directors declared thefollowing quarterly dividends:
Dividends are paid in the quarter subsequent to the quarter in which they were declared.
In February 2018, the Company’s Board of Directors declared a quarterly dividend of $0.125 per commonshare. Payment of the dividend will be made on April 4, 2018 to all shareholders of record on March 28,2018. Future dividends are subject to approval by the Board of Directors and may be adjusted as businessand industry conditions warrant.
Share Capital
Preferred shares
The Company has authorized 50,000,000 preferred shares (2016 – 50,000,000) with $1 par value issuable inseries, of which 2,000,000 shares have been designated as Series A. The preferred shares may be issued inone or more series. Designations and preferences for each series shall be stated in the resolutions providingfor the designation and issuance of each such series adopted by the Company’s Board of Directors. TheBoard of Directors is authorized by the Company’s articles of incorporation to determine the voting,dividend, redemption and liquidation preferences pertaining to each such series. As at December 31, 2017,no preferred shares had been issued by the Company.
(130)
MERCER INTERNATIONAL INC.NOTES TO THE CONSOLIDATED FINANCIAL STATEMENTS
(In thousands of U.S. dollars, except share and per share data)
Note 10. Shareholders’ Equity (continued)
Stock Based Compensation
In June 2010, the Company adopted a stock incentive plan which provides for options, restricted stockrights, restricted shares, performance shares, PSUs and stock appreciation rights to be awarded toemployees, consultants and non-employee directors. During the year ended December 31, 2017, there wereno issued and outstanding options, restricted stock rights, performance shares or stock appreciation rights.As at December 31, 2017, after factoring in all allocated shares, there remain approximately 3.2 millioncommon shares available for grant.
PSUs
PSUs comprise rights to receive common shares at a future date that are contingent on the Company and thegrantee achieving certain performance objectives. The performance objective period is generally threeyears.
For the year ended December 31, 2017, the Company recognized an expense of $2,437 related to PSUs(2016 – $4,210; 2015 – $1,819).
The following table summarizes PSU activity during the year:
The weighted-average grant date fair value per unit of all PSUs granted in 2016 and 2015 was $6.04 and$12.95, respectively. The total fair value of PSUs vested and issued in 2017, 2016 and 2015 was $3,445,$1,382 and $2,031, respectively.
Restricted Shares
Restricted shares generally vest at the end of one year.
Expense recognized for the year ended December 31, 2017 was $453 (2016 – $449; 2015 – $590). As atDecember 31, 2017, the total remaining unrecognized compensation cost related to restricted sharesamounted to approximately $215 which will be amortized over the remaining vesting periods.
(131)
MERCER INTERNATIONAL INC.NOTES TO THE CONSOLIDATED FINANCIAL STATEMENTS
(In thousands of U.S. dollars, except share and per share data)
Note 10. Shareholders’ Equity (continued)
The following table summarizes restricted share activity during the year:
The weighted-average grant date fair value per share of all restricted shares granted in 2016 and 2015 was$9.41 and $14.48, respectively. The total fair value of restricted shares vested and issued in 2017, 2016 and2015 was $437, $697 and $1,096, respectively.
Settlement of Short Swing Profit Claim
In March 2017, the Company and a shareholder entered into a settlement agreement pursuant to which theshareholder paid $3,000 (net $2,450 after costs) to the Company to settle a claim by the Company for shortswing profits under Section 16(b) in the Exchange Act. The net settlement was classified as additionalpaid-in-capital.
(1) For the year ended December 31, 2017, the basic weighted average number of common shares outstanding excludes 43,635 restrictedshares which have been issued, but have not vested as at December 31, 2017 (2016 – 38,000 restricted shares; 2015 – 78,000 restrictedshares).
The calculation of diluted net income per common share does not assume the exercise of any instrumentsthat would have an anti-dilutive effect on net income per common share. There were no anti-dilutiveinstruments for the years ended December 31, 2017, 2016 and 2015.
(132)
MERCER INTERNATIONAL INC.NOTES TO THE CONSOLIDATED FINANCIAL STATEMENTS
(In thousands of U.S. dollars, except share and per share data)
Note 12. Accumulated Other Comprehensive Loss
The components of accumulated other comprehensive loss are as follows:
ForeignCurrency
TranslationAdjustment
Defined BenefitPension andOther Post-Retirement
Benefit Items
UnrealizedGains / Losseson Marketable
Securities Total
Balance as at December 31, 2015 . . . . . . . . . . $ (156,223) $ (15,338) $ (13) $ (171,574)
Other comprehensive income (loss) . . . . . . 120,509 5,763 (4) 126,268
Balance as at December 31, 2017 . . . . . . . . . . $ (50,083) $ (8,900) $ (18) $ (59,001)
Note 13. Business Segment Information
The Company is managed based on the primary products it manufactures: pulp and wood products.Accordingly, the Company’s three pulp mills are aggregated into the pulp business segment, and the FriesauFacility is a separate reportable business segment, wood products.
None of the income or loss items following operating income in the Company’s Consolidated Statement ofOperations are allocated to the segments, since those items are reviewed separately by management.
Revenues between segments are accounted for at prices that approximate fair value. These include revenuesfrom the sale of residual fiber from the wood products segment to the pulp segment for use in the pulpproduction process and from the sale of residual fuel from the pulp segment to the wood products segmentfor use in energy production.
(133)
MERCER INTERNATIONAL INC.NOTES TO THE CONSOLIDATED FINANCIAL STATEMENTS
(In thousands of U.S. dollars, except share and per share data)
Note 13. Business Segment Information (continued)
Information about certain segment data for the years ended December 31, 2017, 2016 and 2015, was asfollows:
Purchase of property, plant and equipment . . . . $ 46,536 $ — $ — $ — $ 46,536
The pulp segment includes revenues from the sale of pulp and energy and chemical by-products. The woodproducts segment includes revenues from the sale of lumber and energy and other wood residualby-products. The Company’s revenues from external customers by product are as follows:
In 2017, one customer for the pulp segment through several of their operations accounted for 13% of theCompany’s total revenues (2016 – two customers through several of their operations accounted for 19% and10%; 2015 – one customer through several of their operations accounted for 16%).
Note 14. Derivative Transactions
The Company is exposed to certain market risks relating to its ongoing business. The Company seeks tomanage these risks through internal risk management policies as well as, from time to time, the use ofderivatives. The derivatives are measured at fair value with changes in fair value immediately recognized inother income (expenses) in the Consolidated Statement of Operations.
Interest Rate Swaps
During 2002, the Company entered into certain variable-to-fixed interest rate swaps in connection with theStendal mill’s senior project finance facility, which was settled in November 2014. Under the terms of theinterest rate swaps, the Company paid a fixed rate and received a floating rate with the derivative paymentsbeing calculated on a notional amount. The swap matured in October 2017. As at December 31, 2016, thecontract had a fair value $6,522 which was classified as current within accounts payable and other in theConsolidated Balance Sheet.
The Company had pledged as collateral cash in the amount of 67% of the fair value of the interest rate swapup to €8.5 million to the derivative counterparty. The calculation to determine the collateral was performedsemi-annually, with the final calculation in October 2017. As at December 31, 2016, the collateral was$4,327. This cash was classified as restricted cash in the Consolidated Balance Sheet.
(135)
MERCER INTERNATIONAL INC.NOTES TO THE CONSOLIDATED FINANCIAL STATEMENTS
(In thousands of U.S. dollars, except share and per share data)
Note 14. Derivative Transactions (continued)
Credit Risk
The Company’s credit risk is primarily attributable to cash held in bank accounts and accounts receivable.The Company maintains cash balances in foreign financial institutions in excess of insured limits. TheCompany limits its credit exposure on cash held in bank accounts by periodically investing cash in excess ofshort-term operating requirements and debt obligations in low risk government bonds, or similar debtinstruments. The Company’s credit risk associated with the sale of pulp, lumber and other wood residuals ismanaged through setting credit limits, the purchase of credit insurance and for certain customers a letter ofcredit is received prior to shipping the product. Concentrations of credit risk on the sale of pulp, lumber andother wood residuals are with customers and agents based primarily in Germany, China and Italy.
The carrying amount of cash and cash equivalents of $143,299, restricted cash of $317,439 and accountsreceivable of $206,027 recorded in the Consolidated Balance Sheet, net of any allowances for losses,represents the Company’s maximum exposure to credit risk.
Note 15. Fair Value Measurement and Disclosure
Due to their short-term maturity, the carrying amounts of cash and cash equivalents, restricted cash,accounts receivable and accounts payable and other approximates their fair value.
The fair value of the interest rate derivative liability classified as Level 2 was determined using a discountedcash flow model that uses as its basis readily observable market inputs, such as forward interest rates andyield curves observable at specified intervals. The observable inputs reflect market data obtained fromindependent sources, including the Euribor rate provided by the counterparty to the interest rate derivative.
The fair value of the Senior Notes classified as Level 2 was determined using quoted prices in a dealermarket, or using recent market transactions.
The following tables present a summary of the Company’s outstanding financial instruments and theirestimated fair values under the fair value hierarchy:
Fair value measurements as at December 31, 2017 using:
MERCER INTERNATIONAL INC.NOTES TO THE CONSOLIDATED FINANCIAL STATEMENTS
(In thousands of U.S. dollars, except share and per share data)
Note 16. Lease Commitments
Minimum lease payments, primarily for various vehicles, and plant and equipment under capital andnon-cancellable operating leases and the present value of net minimum payments as at December 31, 2017are as follows:
The current portion of the capital lease obligations was included in accounts payable and other and the long-term portion was included in capital leases and other in the Consolidated Balance Sheet. Rent expense underoperating leases was $1,697 for the year ended December 31, 2017 (2016 – $1,393; 2015 – $2,271).
Note 17. Commitments and Contingencies
(a) The Company is involved in legal actions and claims arising in the ordinary course of business. Whilethe outcome of any legal actions and claims cannot be predicted with certainty, it is the opinion ofmanagement that the outcome of any such claims which are pending or threatened, either individuallyor on a combined basis, will not have a material adverse effect on the consolidated financial condition,results of operations or liquidity of the Company.
(b) The Company is subject to regulations that require the handling and disposal of asbestos in aprescribed manner if a property undergoes a major renovation or demolition. Otherwise, the Companyis not required to remove asbestos from its facilities. Generally asbestos is found on steam andcondensate piping systems as well as certain cladding on buildings and in building insulationthroughout older facilities. The Company’s obligation for the proper removal and disposal of asbestosproducts from the Company’s mills is a conditional asset retirement obligation. As a result of thelongevity of the Company’s mills, due in part to the maintenance procedures and the fact that theCompany does not have plans for major changes that require the removal of asbestos, the timing of theasbestos removal is indeterminate. As a result, the Company is currently unable to reasonably estimatethe fair value of its asbestos removal and disposal obligation. The Company will recognize a liability inthe period in which sufficient information is available to reasonably estimate its fair value.
(137)
SUPPLEMENTARY FINANCIAL INFORMATION(UNAUDITED)
Selected Quarterly Financial Data(In thousands of U.S. dollars, except per share data)
3.1 Articles of Incorporation of Mercer International Inc., as amended. Incorporated byreference from Form 8-A filed March 2, 2006.
3.2 Bylaws of Mercer International Inc. Incorporated by reference from Form 8-A filedMarch 2, 2006.
4.1 Indenture dated November 26, 2014 between Mercer International Inc. and Wells FargoBank, National Association, as trustee, relating to the 2022 Senior Notes. Incorporated byreference from Form 8-K filed November 28, 2014.
4.2 Indenture dated February 3, 2017 between Mercer International Inc. and Wells Fargo Bank,National Association, as trustee, relating to the 2024 Senior Notes. Incorporated byreference from Form 8-K filed February 3, 2017.
4.3 Indenture dated December 20, 2017 between Mercer International Inc. and Wells FargoBank, National Association, as trustee, relating to the 2026 Senior Notes. Incorporated byreference from Form 8-K filed December 20, 2017.
10.1 Revolving Credit Facility Agreement dated November 25, 2014 among Zellstoff StendalGmbH, UniCredit Bank AG, Credit Suisse AG, London Branch, Royal Bank of Canada andBarclays Bank PLC. Incorporated by reference from Form 8-K filed November 28, 2014.
10.2 Form of Trustee’s Indemnity Agreement between Mercer International Inc. and itsTrustees. Incorporated by reference from Form 10-K filed March 31, 2003.
10.3† Mercer International Inc. 2010 Stock Incentive Plan. Incorporated by reference fromAppendix A to Mercer International Inc.‘s definitive proxy statement on Schedule 14Afiled April 24, 2014.
10.4† Employment Agreement effective September 1, 2005 between Mercer International Inc.and Leonhard Nossol dated August 18, 2005. Incorporated by reference from Form 10-Qfiled May 6, 2008.
10.5† Employment Agreement dated October 2, 2006 between Stendal Pulp Holding GmbH andWolfram Ridder. Incorporated by reference from Form 8-K filed October 3, 2006.
10.6 Electricity Purchase Agreement effective January 27, 2009 between Zellstoff CelgarLimited Partnership and British Columbia Hydro and Power Authority. Incorporated byreference from Form 10-K filed March 2, 2009. Certain non-public information has beenomitted from the appendices to Exhibit 10.9 pursuant to a request for confidential treatmentfiled with the SEC. Such non-public information was filed with the SEC on a confidentialbasis. The SEC approved the request for confidential treatment in March 2009.
10.7 Second Amended and Restated Credit Agreement dated as of May 2, 2013 among ZellstoffCelgar Limited Partnership, as borrower, and the lenders from time to time parties thereto,as lenders, and Canadian Imperial Bank of Commerce, as agent. Incorporated by referencefrom Form 8-K filed May 8, 2013.
10.8 Asset Purchase Agreement between Mercer Timber Products GmbH (formerlyBlitz B16-230 GmbH), Mercer International Inc., Klausner Holz Thüringen GmbH andFritz Klausner dated February 21, 2017. Incorporated by reference from Form 10-Q filedApril 28, 2017.
10.9 Revolving Credit Facility Agreement among Zellstoff-Und Papierfabrik Rosenthal GmbHand Mercer Timber Products GmbH, as borrowers, and UniCredit Bank AG, as bender,dated April 12, 2017. Incorporated by reference from Form 10-Q filed April 28, 2017.
(139)
10.10† Employment Agreement between Mercer International Inc. and David Ure datedAugust 12, 2013. Incorporated by reference from Form 8-K filed on July 19, 2015.
10.11 First Amending Agreement dated October 21, 2014 between Zellstoff Celgar LimitedPartnership, Mercer International Inc., as guarantor, and Canadian Imperial Bank ofCommerce. Incorporated by reference from Form 10-Q filed October 31, 2014.
10.12† Amendment to Employment Agreement between Mercer International Inc. and David Ure,dated July 17, 2015. Incorporated by reference from Form 8-K filed July 19, 2015.
10.13† Second Amended and Restated Employment Agreement between Mercer International Inc.and Jimmy S.H. Lee, dated for reference September 29, 2015. Incorporated by referencefrom Form 8-K filed September 28, 2015.
10.14† Amended and Restated Employment Agreement between Mercer International Inc. andDavid M. Gandossi, dated for reference September 29, 2015. Incorporated by referencefrom Form 8-K filed September 28, 2015.
10.15 Registration Rights Agreement dated February 3, 2017 between Mercer International Inc.and Credit Suisse Securities (USA) LLC, related to the 2024 Senior Notes. Incorporated byreference from Form 8-K filed on February 3, 2017.
10.16 Registration Rights Agreement dated March 27, 2017 between Mercer International Inc.and Credit Suisse Securities (USA) LLC, related to the 2024 Senior Notes. Incorporated byreference from Form 8-K filed on March 27, 2017.
10.17 Registration Rights Agreement dated December 20, 2017 between Mercer International Inc.and Credit Suisse Securities (USA) LLC, related to the 2026 Senior Notes. Incorporated byreference from Form 8-K filed on December 20, 2017.
21.1* List of Subsidiaries of Registrant.
23.1* Consent of PricewaterhouseCoopers LLP.
31.1* Section 302 Certificate of Chief Executive Officer.
31.2* Section 302 Certificate of Chief Financial Officer.
32.1* Section 906 Certificate of Chief Executive Officer.
32.2* Section 906 Certificate of Chief Financial Officer.
101* The following financial statements from the Company’s annual report on Form 10-K for theyear ended December 31, 2017, filed with the SEC on February 16, 2018, formatted inExtensible Business Reporting Language (XBRL): (i) Consolidated Statements ofOperations; (ii) Consolidated Statements of Comprehensive Income (Loss); (iii)Consolidated Balance Sheets; (iv) Consolidated Statements of Changes in Shareholders’Equity; (v) Consolidated Statements of Cash Flows; and (vi) Notes to the ConsolidatedFinancial Statements.
* Filed herewith.† Denotes management contract or compensatory plan or arrangement.
(140)
SIGNATURES
Pursuant to the requirements of Section 13 or 15(d) of the Securities Exchange Act of 1934, theRegistrant has duly caused this report to be signed on its behalf by the undersigned, thereunto dulyauthorized.
MERCER INTERNATIONAL INC.
Dated: February 16, 2018 By: /s/ JIMMY S.H. LEE
Jimmy S.H. LeeExecutive Chairman
Pursuant to the requirements of the Securities Exchange Act of 1934, this report has been signedbelow by the following persons on behalf of the Registrant and in the capacities and on the dates indicated.
/s/ JIMMY S.H. LEE Date: February 16, 2018Jimmy S.H. LeeExecutive Chairman and Director
/s/ DAVID M. GANDOSSI Date: February 16, 2018David M. GandossiChief Executive Officer and Director
/s/ DAVID K.URE Date: February 16, 2018David K. UreExecutive Vice President,Chief Financial Officer and PrincipalAccounting Officer
/s/ ERIC LAURITZEN Date: February 16, 2018Eric LauritzenDirector
/s/ WILLIAM D. MCCARTNEY Date: February 16, 2018William D. McCartneyDirector
/s/ BERNARD PICCHI Date: February 16, 2018Bernard PicchiDirector
/s/ JAMES SHEPHERD Date: February 16, 2018James ShepherdDirector
/s/ KEITH PURCHASE Date: February 16, 2018Keith PurchaseDirector
(141)
/s/ NANCY ORR Date: February 16, 2018Nancy OrrDirector
/s/ MARTHA MORFITT Date: February 16, 2018Martha MorfittDirector
(142)
EXHIBIT 21.1
SUBSIDIARIES OF MERCER INTERNATIONAL INC.
Name of Subsidiary(1)State or Other Jurisdiction ofIncorporation or Organization
(1) All the subsidiaries are conducting business under their own names.
EXHIBIT 23.1
CONSENT OF INDEPENDENT REGISTERED PUBLIC ACCOUNTING FIRM
We hereby consent to the incorporation by reference in the Registration Statements on Form S-8 (No.333-219333), S-8 (No. 333-198365), S-8 (No. 333-167478), S-8 (No. 333-116520-99), and S-3 (No.333-213644) of Mercer International Inc. of our report dated February 16, 2018 relating to the consolidatedfinancial statements and the effectiveness of internal control over financial reporting, which appears in this Form10-K.
/s/ PricewaterhouseCoopers LLP
Chartered Professional AccountantsVancouver, CanadaFebruary 16, 2018
EXHIBIT 31.1
CERTIFICATION OF PERIODIC REPORT
I, David M. Gandossi, certify that:
1. I have reviewed this annual report on Form 10-K of Mercer International Inc. (the “Registrant”);
2. Based on my knowledge, this annual report does not contain any untrue statement of a material fact oromit to state a material fact necessary to make the statements made, in light of the circumstances underwhich such statements were made, not misleading with respect to the period covered by this annualreport;
3. Based on my knowledge, the financial statements, and other financial information included in this annualreport, fairly present in all material respects the financial condition, results of operations and cash flowsof the Registrant as of, and for, the periods presented in this annual report;
4. The Registrant’s other certifying officer and I are responsible for establishing and maintaining disclosurecontrols and procedures (as defined in Exchange Act Rules 13a-15(e) and 15d-15(e)) and internal controlover financial reporting (as defined in Exchange Act Rules 13a-15(f) and 15d-15(f)) for the Registrantand have:
a) Designed such disclosure controls and procedures, or caused such disclosure controls andprocedures to be designed under our supervision, to ensure that material information relating tothe Registrant, including its consolidated subsidiaries, is made known to us by others within thoseentities, particularly during the period in which this annual report is being prepared;
b) Designed such internal control over financial reporting, or caused such internal control overfinancial reporting to be designed under our supervision, to provide reasonable assuranceregarding the reliability of financial reporting and the preparation of financial statements forexternal purposes in accordance with generally accepted accounting principles;
c) Evaluated the effectiveness of the Registrant’s disclosure controls and procedures and presented inthis annual report our conclusions about the effectiveness of the disclosure controls andprocedures, as of the end of the period covered by this annual report based on such evaluation; and
d) Disclosed in this annual report any change in the Registrant’s internal control over financialreporting that occurred during the Registrant’s most recent fiscal quarter (the Registrant’s fourthfiscal quarter in the case of this annual report) that has materially affected, or is reasonably likelyto materially affect, the Registrant’s internal control over financial reporting; and
5. The Registrant’s other certifying officer and I have disclosed, based on our most recent evaluation ofinternal control over financial reporting, to the Registrant’s auditors and the audit committee of theRegistrant’s board of directors (or persons performing the equivalent functions):
a) All significant deficiencies and material weaknesses in the design or operation of internal controlover financial reporting which are reasonably likely to adversely affect the Registrant’s ability torecord, process, summarize and report financial information; and
b) Any fraud, whether or not material, that involves management or other employees who have asignificant role in the Registrant’s internal control over financial reporting.
Date: February 16, 2018
/s/ DAVID M. GANDOSSI
David M. GandossiChief Executive Officer
EXHIBIT 31.2
CERTIFICATION OF PERIODIC REPORT
I, David K. Ure, certify that:
1. I have reviewed this annual report on Form 10-K of Mercer International Inc. (the “Registrant”);
2. Based on my knowledge, this annual report does not contain any untrue statement of a material fact oromit to state a material fact necessary to make the statements made, in light of the circumstances underwhich such statements were made, not misleading with respect to the period covered by this annualreport;
3. Based on my knowledge, the financial statements, and other financial information included in this annualreport, fairly present in all material respects the financial condition, results of operations and cash flowsof the Registrant as of, and for, the periods presented in this annual report;
4. The Registrant’s other certifying officer and I are responsible for establishing and maintaining disclosurecontrols and procedures (as defined in Exchange Act Rules 13a-15(e) and 15d-15(e)) and internal controlover financial reporting (as defined in Exchange Act Rules 13a-15(f) and 15d-15(f)) for the Registrantand have:
a) Designed such disclosure controls and procedures, or caused such disclosure controls andprocedures to be designed under our supervision, to ensure that material information relating tothe Registrant, including its consolidated subsidiaries, is made known to us by others within thoseentities, particularly during the period in which this annual report is being prepared;
b) Designed such internal control over financial reporting, or caused such internal control overfinancial reporting to be designed under our supervision, to provide reasonable assuranceregarding the reliability of financial reporting and the preparation of financial statements forexternal purposes in accordance with generally accepted accounting principles;
c) Evaluated the effectiveness of the Registrant’s disclosure controls and procedures and presented inthis annual report our conclusions about the effectiveness of the disclosure controls andprocedures, as of the end of the period covered by this annual report based on such evaluation; and
d) Disclosed in this annual report any change in the Registrant’s internal control over financialreporting that occurred during the Registrant’s most recent fiscal quarter (the Registrant’s fourthfiscal quarter in the case of this annual report) that has materially affected, or is reasonably likelyto materially affect, the Registrant’s internal control over financial reporting; and
5. The Registrant’s other certifying officer and I have disclosed, based on our most recent evaluation ofinternal control over financial reporting, to the Registrant’s auditors and the audit committee of theRegistrant’s board of directors (or persons performing the equivalent functions):
a) All significant deficiencies and material weaknesses in the design or operation of internal controlover financial reporting which are reasonably likely to adversely affect the Registrant’s ability torecord, process, summarize and report financial information; and
b) Any fraud, whether or not material, that involves management or other employees who have asignificant role in the Registrant’s internal control over financial reporting.
Date: February 16, 2018
/s/ DAVID K. URE
David K. UreChief Financial Officer
EXHIBIT 32.1
CERTIFICATION OF PERIODIC REPORT PURSUANT TO18 U.S.C. SECTION 1350,
AS ADOPTED PURSUANT TO SECTION 906OF THE SARBANES-OXLEY ACT OF 2002
I, David M. Gandossi, Chief Executive Officer of Mercer International Inc. (the “Company”), certify pursuant to18 U.S.C. Section 1350, as adopted pursuant to Section 906 of the Sarbanes-Oxley Act of 2002, that, to myknowledge:
(1) the annual report on Form 10-K of the Company for the year ended December 31, 2017 (the“Report”) fully complies with the requirements of Section 13(a) or 15(d) of the SecuritiesExchange Act of 1934; and
(2) the information contained in the Report fairly presents, in all material respects, the financialcondition and results of operations of the Company.
Dated: February 16, 2018/s/ DAVID M. GANDOSSI
David M. GandossiChief Executive Officer
A signed original of this written statement required by Section 906 of the Sarbanes-Oxley Act of 2002 has beenprovided to Mercer International Inc. and will be retained by Mercer International Inc. and furnished to theSecurities and Exchange Commission or its staff upon request.
This certification accompanies the Report pursuant to Section 906 of the Sarbanes-Oxley Act of 2002 and shallnot, except to the extent required by the Sarbanes-Oxley Act of 2002, be deemed filed by the Company forpurposes of Section 18 of the Securities Exchange Act of 1934, as amended.
EXHIBIT 32.2
CERTIFICATION OF PERIODIC REPORT PURSUANT TO18 U.S.C. SECTION 1350,
AS ADOPTED PURSUANT TO SECTION 906OF THE SARBANES-OXLEY ACT OF 2002
I, David K. Ure, Chief Financial Officer of Mercer International Inc. (the “Company”), certify pursuant 18U.S.C. Section 1350, as adopted pursuant to Section 906 of the Sarbanes-Oxley Act of 2002, that, to myknowledge:
(1) the annual report on Form 10-K of the Company for the year ended December 31, 2017 (the“Report”) fully complies with the requirements of Section 13(a) or 15(d) of the SecuritiesExchange Act of 1934; and
(2) the information contained in the Report fairly presents, in all material respects, the financialcondition and results of operations of the Company.
Dated: February 16, 2018
/s/ DAVID K. URE
David K. UreChief Financial Officer
A signed original of this written statement required by Section 906 of the Sarbanes-Oxley Act of 2002 has beenprovided to Mercer International Inc. and will be retained by Mercer International Inc. and furnished to theSecurities and Exchange Commission or its staff upon request.
This certification accompanies the Report pursuant to Section 906 of the Sarbanes-Oxley Act of 2002 and shallnot, except to the extent required by the Sarbanes-Oxley Act of 2002, be deemed filed by the Company forpurposes of Section 18 of the Securities Exchange Act of 1934, as amended.