Washington D.C., USA, 22-27 July 2012 www.aids2012.org Treatment as Prevention: It is complex: Let us work on it Kenneth H. Mayer Fenway Health Beth Israel Deaconess Hospital Harvard Medical School Boston, Mass July 23 rd , 2012 Session Room 2
Transcript
Washington D.C., USA, 22-27 July 2012www.aids2012.org
Treatment as Prevention: It is complex: Let us work on it
Kenneth H. Mayer
Fenway Health
Beth Israel Deaconess Hospital
Harvard Medical School
Boston, Mass
July 23rd, 2012 Session Room 2
Is Treatment as Prevention Utopian?
Percentage of women and men who received an HIV test and test results in last 12 months, 2003–2010 (WHO/UNAIDS)
Most PLHIV are unaware that they are infected Successful TasP requires massive ↑Testing
Still a long way to go to reach 15 million on ART, let alone treating everyone
3 000 000
6 000 000
9 000 000
12 000 000
15 000 000
2003 2004 2005 2006 2007 2008 2009 2010
PLH
IV in
nee
d of
AR
T
Treatment gap
Receiving antiretroviral therapy
Estimated gap: CD4 cell count ≤ 350/mm3 but not on ART
Patients receiving ART 47%3%
WHO, 2011
53%97%
Effective prevention interventions have not been brought to scale
Goal:
~20 million by 2016
Total MCs through 2011:
~1.35 million, 6.5%
of target
0
100,000
200,000
300,000
400,000
500,000
600,000
700,000
800,000
900,000
2008 2009 2010 2011
#
Source: WHO
Male circumcisions performed annually in 14 priority countries in eastern and southern Africa
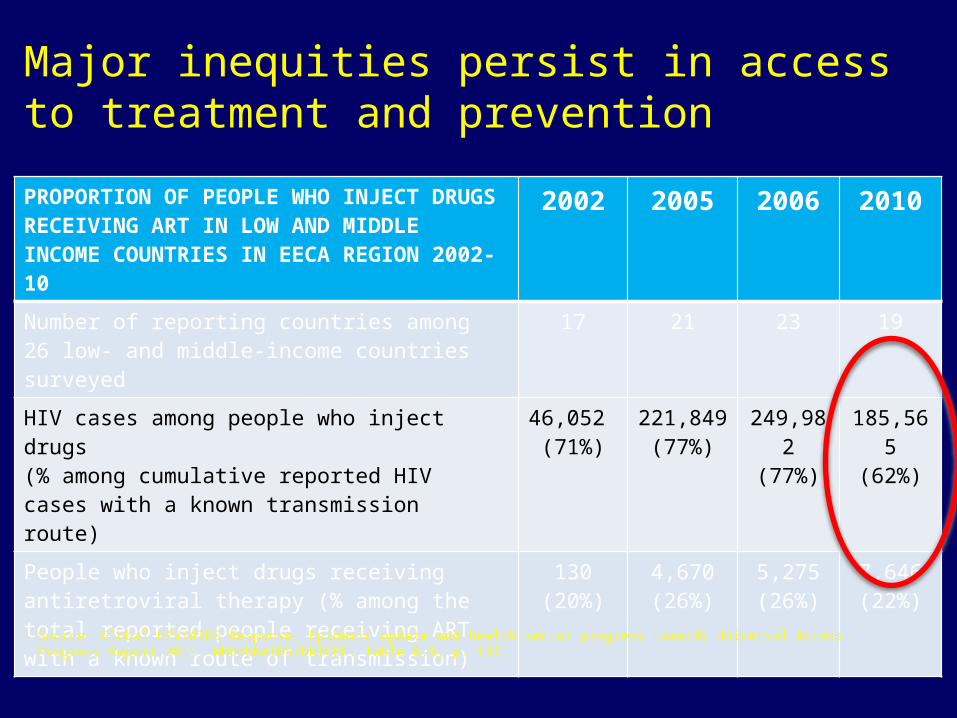
Major inequities persist in access to treatment and prevention
PROPORTION OF PEOPLE WHO INJECT DRUGS RECEIVING ART IN LOW AND MIDDLE INCOME COUNTRIES IN EECA REGION 2002-10
2002 2005 2006 2010
Number of reporting countries among 26 low- and middle-income countries surveyed
17 21 23 19
HIV cases among people who inject drugs (% among cumulative reported HIV cases with a known transmission route)
46,052 (71%)
221,849(77%)
249,982(77%)
185,565(62%)
People who inject drugs receiving antiretroviral therapy (% among the total reported people receiving ART with a known route of transmission)
130(20%)
4,670(26%)
5,275(26%)
7,646(22%)
Source: Global HIV/AIDS Response. Epidemic update and health sector progress towards Universal Access. Progress Report 2011. WHO/UNAIDS/UNICEF. Table 6.9, p. 137.
Who is Prescribed ART and Who Achieves Viral Suppression in the USA
(MMP)?
Characteristic Prescribed ART % (95% CI)
Virally suppressed % (95% CI)
Race/ethnicity
Non-Hispanic White
92 (90-94) 80 (76-83)
Non-Hispanic Black
86 (83-88)* 64 (60-68)*
Hispanic 89 (86-92) 74 (71-78)
Other 87 (81-94) 69 (63-76)
Sexual risk behavior
MSM 89 (87-91) 76 (72-79)
MSW 91 (88-93) 70 (66-75)
WSM 86 (83-89) 66 (62-70)** P value <0.05 Skarbinski, CROI, 2012
80%
77%
51%89%
77%
MMWR (60), 2011850,000 with HIV do not have virus under control (72%)
Clinical Care System ConsiderationsAddressing the HIV Continuum of Care
Early retention in care (Mugavero et al) The first year in outpatient HIV medical
care is a dynamic, formative & vulnerable time
Poor early retention in care associated with: Delayed / failed antiretroviral therapy (ART)
receipt Delayed time to VL suppression and greater
cumulative HIV burden Increased sexual risk transmission behaviors Increased risk of clinical events & mortality Worse ART adherence, CD4 & VL response
and increased long-term mortality following ART start
Ulett et al. AIDS Pt Care STDS 2009;23, Giordano et al. JAIDS 2003;32, Metsch et al. Clin Infect Dis 2008;47, Mugavero et al. Clin Infect Dis 2009;48, Tripathi et al. AIDS Res Hum Retrovirus 2011;e-pub, Giordano et al. Clin Infect Dis 2007;44
Outcome: 1o HIV provider visit attended w/in:
Case Manageme
nt
Standard of Care
P-value
6 months 78% 60% <0.01
Gardner et al. AIDS 2005;19
Intervention is efficacious, but additional steps needed to promote linkage to care…
12 months 64% 49% <0.01
Linkage to Care: CDC ARTAS
Clinical Care System ConsiderationsLinkage, retention, and effectiveness (USA)
• Linkage to care and preventive services– Only 69% of persons with HIV attend clinic within 12 months
of diagnosis– Case management improves linkage by 32% at cost of $1,200
per person– Interventions focused on adherence increase likelihood of
undetectable viral load by 15%
• Effectiveness depends on coverage during entire cascade from testing to care– Transmission reductions can vary from 15% to 44%
Walensky ClD 2010, Marks AIDS 2010; Crepaz AIDS 2006 11
Looking Ahead:Challenging Times for HIV Prevention
• Picture in the United States especially grim:– Federal deficit ~$1.3 trillion for FY 2011– 5-year freeze on federal discretionary spending– Reductions in HIV prevention by health departments
• ~45,000 state and local public health jobs lost• Staff furloughs, hiring freezes, pay cuts
– Many community organizations closed or struggling
• Similar picture being observed in other Western Industrialized settings, driven by economic downturn
*Total includes HIV and viral hepatitis prevention programs, but majority of funds cut were from HIV
Kaiser Family Foundation; NASTAD; Center on Budget and Policy Priorities
Social Cognitive Model: TasP Needs to Consider Concomitant Issues
Self efficacy
Safer Sex Adherence
Pleasure reduction
Disease prevention
Social Models
Depression, anxiety, mental health problems
Wulfert, Safren, et al., 1999; Journal of Applied Social Psychology
Total HIV-1 Transmission Events: 39
HPTN 052: Lots of “Uncoupled” Transmissions
Linked Transmissions: 28
Unlinked or TBD Transmissions: 11
p < 0.001
Immediate Arm: 1
Delayed Arm: 27
Up to 30% of new infections in couples occur outside the primary relationship (Campbell et al PLoS One
2011; Hughes et al. J Infect Dis 2011)
Source: Tim Hallett, personal communication
A combination of interventions has more impact than the interventions delivered alone
16
Decrease inHIV Transmission
Maintain ViralSuppression
Treat
Enroll in Care
Address concomitant concerns, e.g. depression, substance use,