Page 1
10/23/2019
© Compensation Connections LLC 1
Washington HR AcademyCompensation Administration
Shannon DrohmanCompensation Connections LLC
November 13, 2019
Shannon Drohman, MS, SPHR, SHRM‐SCP, CCP
20+ years in HR and Compensation
Shannon has developed compensation strategies and designed comprehensive total reward programs
as an internal partner and external consultant. She serves a variety of clients, including non‐profit organizations.
Shannon is a past President of LWHRA. She has taught numerous HR classes, including the Compensation course for the UW HR Certificate Program.
2
1
2
Page 2
10/23/2019
© Compensation Connections LLC 2
• Your name• Your role and organization• Why did you sign up for the HR Academy?
About You
3
Agenda
• Applicable Laws• Strategy• Compensation Philosophy• Establishing the Value of Jobs• Pay Structures• Pay Administration• Linking Pay and Performance• Trends
4
3
4
Page 3
10/23/2019
© Compensation Connections LLC 3
Applicable Laws
5
Laws Affecting Compensation
1930s 2000s1980s1970s1960s1950s 1990s 2010s
1890 Sherman Anti‐Trust Act
1931 Davis‐Bacon Act
1936Walsh‐Healey Act
1938Fair Labor Standards Act (FLSA)(Wage and Hour Law) – Major revision in 2004
1947National Labor Relations Act (NLRA)
1963Equal Pay Act (EPA)
1965Service Contract Act
1964The Civil Rights Act (Title VII)
1967Age Discrimination in Employment Act
2009Lilly Ledbetter Fair Pay Act
2010Dodd‐Frank Wall Street Reform and Consumer Protection Act
1940s
6
5
6
Page 4
10/23/2019
© Compensation Connections LLC 4
Sherman Anti‐Trust Act
• Passed in 1890
• Applies to all employers
• Intended to preserve a competitive environment
• Prohibits “wage fixing”
• Administered by US Department of Labor
7
Davis Bacon Act
• Passed in 1931
• Applies to all federal construction projects >$2,000
• Requires “prevailing wage” for public works projects
8
7
8
Page 5
10/23/2019
© Compensation Connections LLC 5
Walsh‐Healey Public Contracts Act
• Part of the new deal in 1936
• Extended provisions of Davis‐Bacon Act
• Federal contractors
• Requires overtime pay
9
Lily Ledbetter Fair Pay Act
• Passed In 2009
• Amendment to Civil Rights Act of 1964
• Resets 180‐day Statute of Limitations
10
9
10
Page 6
10/23/2019
© Compensation Connections LLC 6
Exempt Salary Threshold
Federal Labor Standards Act• Current: $23,660
• 1/1/2020: $35,568
11
WA Laws Affecting Compensation
Washington Minimum Wage Act
• 2020 WA Minimum Wage: $13.50/hour
• After 2021: Annual increases tied to CPI
Proposed Exempt Salary Threshold• 7/1/2020: $49,140
• $35,100 for employers with 50 or fewer employees
12
11
12
Page 7
10/23/2019
© Compensation Connections LLC 7
WA Laws Affecting Compensation
Equal Pay Opportunity Act
• Passed and signed March 2018
• Effective June 7, 2018
• Applies to all employers
• Prohibits discrimination in compensation between “similarly
situated” employees
13
Oregon Equal Pay Act
Oregon Equal Pay Act of 2017
• Signed June 2017
• Effective January 1, 2019
• Applies to all employers
• Outlaws discrimination in all compensation for work of a
comparable character on the basis of any protected
characteristic
14
13
14
Page 8
10/23/2019
© Compensation Connections LLC 8
City Ordinances
15
Strategy Is A Big Deal
16
15
16
Page 9
10/23/2019
© Compensation Connections LLC 9
Business Strategy
Every organization has a business strategy.
Even if you’ve never seen a written strategy, there is one.
It’s the basis for how decisions are made.
When in doubt, ask, “Why are we in business?”
17
Strategy CompassResults: (GE)
Establish roles and goals, reward for getting the job done. Exit those not
on the same page.
Mission: (Theo Chocolate)When a company practices what they stand for, their
brand becomes a movement.
Customers: (Nordstrom)Create a great customer experience and customers
will be loyal to us.
Institution: (Johnson & Johnson)People are lucky to have a job here. We are the leaders in our industry. The company founders gave us a proud
tradition.Execution: (UPS)
We know this business – get the details right and the rest will follow.
Work Team: (Quicken Loans)We are team driven. There is no “I” in team. Work together, win together.
Shareholders: (PACCAR)We are here to serve the
shareholders of this company.
Workforce: (Southwest Airlines)Our people are our greatest asset. Be loyal to
them and they will be loyal to us.
Management Compass concept courtesy of David Cichelli of the Alexander Group Inc.
17
18
Page 10
10/23/2019
© Compensation Connections LLC 10
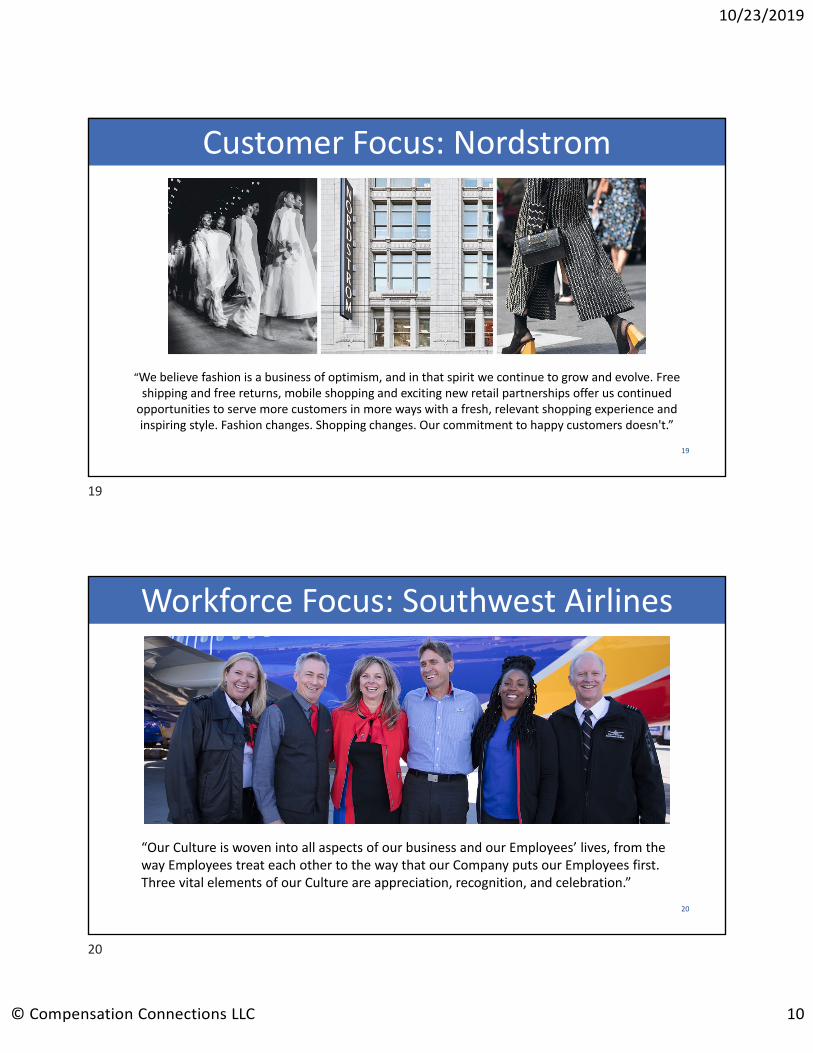
Customer Focus: Nordstrom
“We believe fashion is a business of optimism, and in that spirit we continue to grow and evolve. Free shipping and free returns, mobile shopping and exciting new retail partnerships offer us continued opportunities to serve more customers in more ways with a fresh, relevant shopping experience and inspiring style. Fashion changes. Shopping changes. Our commitment to happy customers doesn't.”
19
Workforce Focus: Southwest Airlines
“Our Culture is woven into all aspects of our business and our Employees’ lives, from the way Employees treat each other to the way that our Company puts our Employees first. Three vital elements of our Culture are appreciation, recognition, and celebration.”
20
19
20
Page 11
10/23/2019
© Compensation Connections LLC 11
Mission Focus: Hopelink
21
“Hopelink's mission is to promote self‐sufficiency for all members of our community; we help people make lasting change.”
Compensation Philosophy
22
21
22
Page 12
10/23/2019
© Compensation Connections LLC 12
What Is A Compensation Philosophy?
• Grounded in business strategy
• Foundation of an organization’s compensation program
• Creates a shared understanding and framework for program
design decisions
• Who is involved in developing the philosophy?
23
Compensation Philosophy Components
• Mission and values
• Competitive market
• Market position – lead, lag, meet
• Jobs difficult to recruit or retain
• Benefits and intangibles
24
23
24
Page 13
10/23/2019
© Compensation Connections LLC 13
Compensation Philosophy
Let’s Do It!• Review the philosophy statement
• Determine “your” organization and the business strategy
• Discuss the compensation philosophy questionnaire
25
Establishing the Value of Jobs
26
25
26
Page 14
10/23/2019
© Compensation Connections LLC 14
Job Descriptions
27
Internal and External Value of Jobs
Internal Value External Value
28
27
28
Page 15
10/23/2019
© Compensation Connections LLC 15
Internal Job Value: Job Ranking
• Simple ranking
• Paired comparison
• Alternation ranking
2929
Internal Job Value: Point Factor
30
29
30
Page 16
10/23/2019
© Compensation Connections LLC 16
External Job Value
Why Use Market Pricing?• Changes in scope of jobs
• Changes in market conditions
• Benchmark new positions
• Account for “hot jobs”
• Help establish job hierarchy
31
External Job Value
Compensation Philosophy
Compensation Philosophy
Relevant External Market• Competition for talent
• Industry
• Size of organization
• Geographic area
• Lead, lag or match the market
32
31
32
Page 17
10/23/2019
© Compensation Connections LLC 17
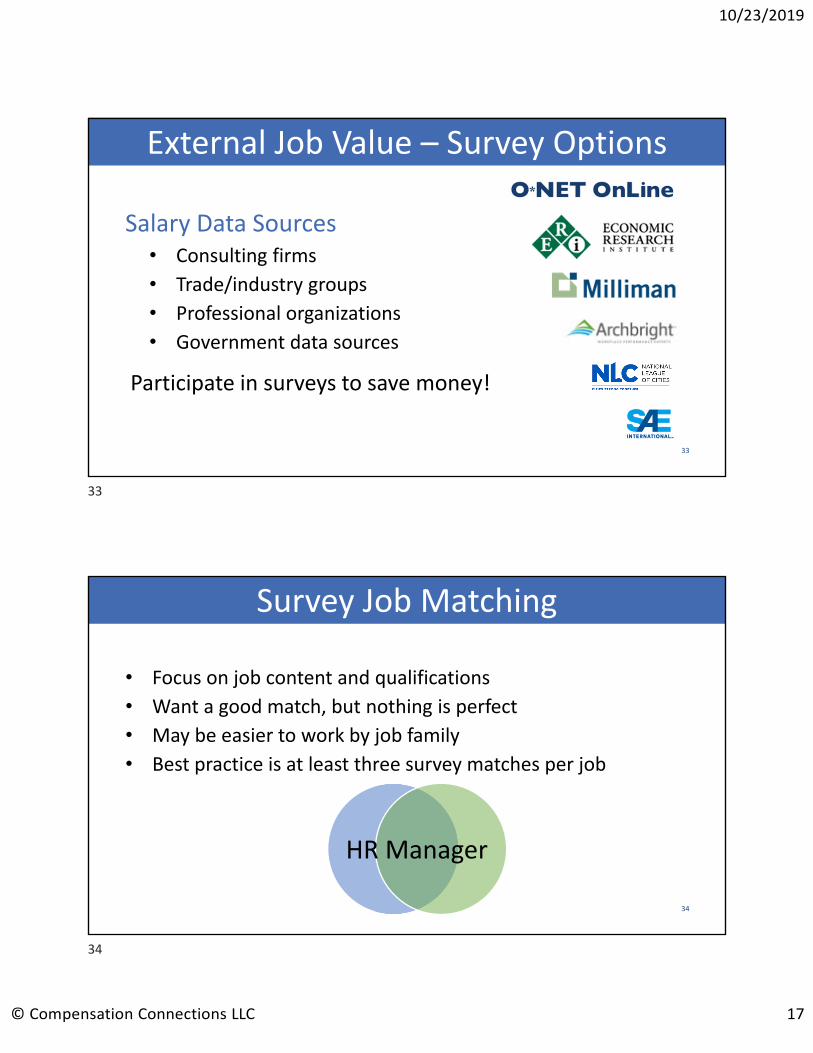
Salary Data Sources• Consulting firms
• Trade/industry groups
• Professional organizations
• Government data sources
Participate in surveys to save money!
External Job Value – Survey Options
33
Survey Job Matching
• Focus on job content and qualifications
• Want a good match, but nothing is perfect
• May be easier to work by job family
• Best practice is at least three survey matches per job
HR Manager
34
33
34
Page 18
10/23/2019
© Compensation Connections LLC 18
Survey Job Matching – Job Summaries
Economic Research Institute (ERI)
HUMAN RESOURCES MANAGERDevelops and/or implements human resource policies and programs within the policy guidelines formulated by top corporate human resource or general management. Typically directs the following human resources functions: staffing, affirmative action, wage/salary and benefit administration, training and development, safety and health, and employee services. Usually supervises the activities of professional and clerical Human Resource staff. Typically requires a degree and 5‐8 years experience.
HUMAN RESOURCES MANAGER• Manages Human Resources staff and plans, develops, recommends, and implements human
resources activities, policies, procedures, and programs for an organization, assisting upper management as requested.
• Manages activities relating to staffing, employee education and training, management development, labor relations, affirmative action, benefits administration, and salary administration.
Milliman Compensation Survey
35
Survey Market Data
Milliman Compensation Survey36
35
36
Page 19
10/23/2019
© Compensation Connections LLC 19
External Job Evaluation
Let’s Do It!• Review salary survey data
• Discuss which data to use
• Fill in the worksheet with your group's data
37
External Job Evaluation
38
37
38
Page 20
10/23/2019
© Compensation Connections LLC 20
Which Is Better?
39
Internal Value External Value
Pay Structures
40
39
40
Page 21
10/23/2019
© Compensation Connections LLC 21
Pay Structure Types
Types of Structures• Step structure
• Traditional/discretionary
• Broadband
41
Minimum Midpoint Maximum ‐‐‐‐ Pay Range ‐‐‐‐
50th Percentile of Market
Market Data and Midpoint
42
41
42
Page 22
10/23/2019
© Compensation Connections LLC 22
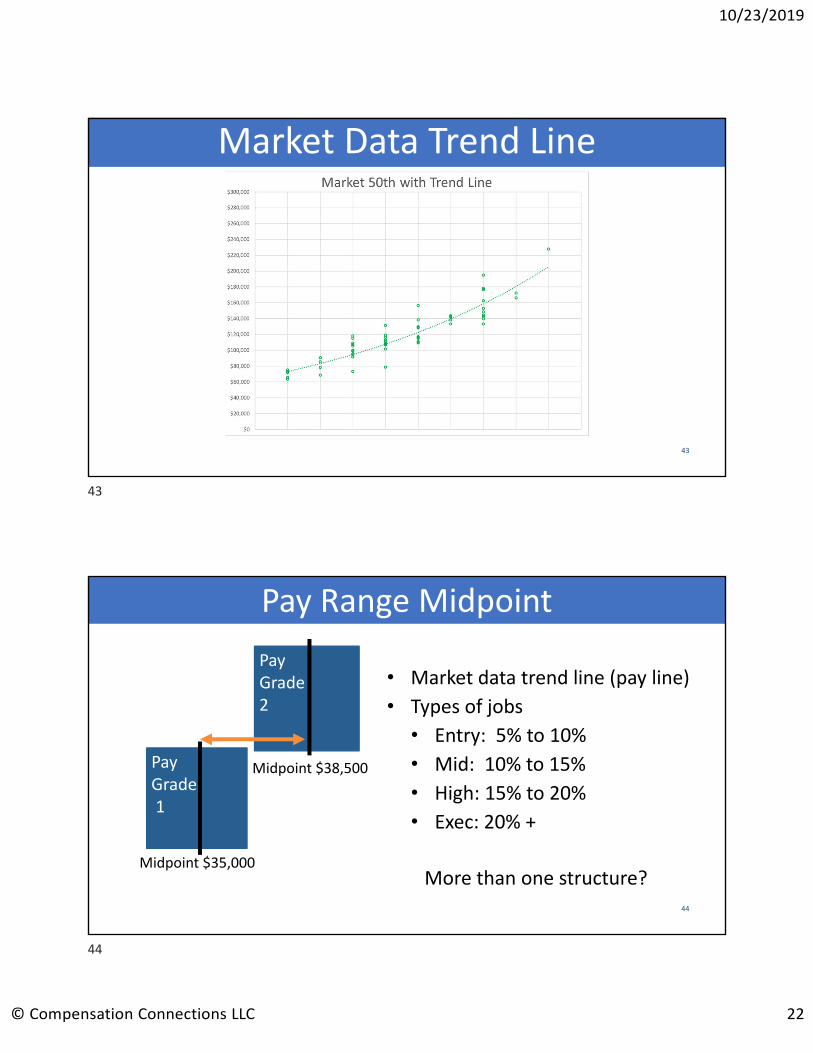
Market Data Trend Line
43
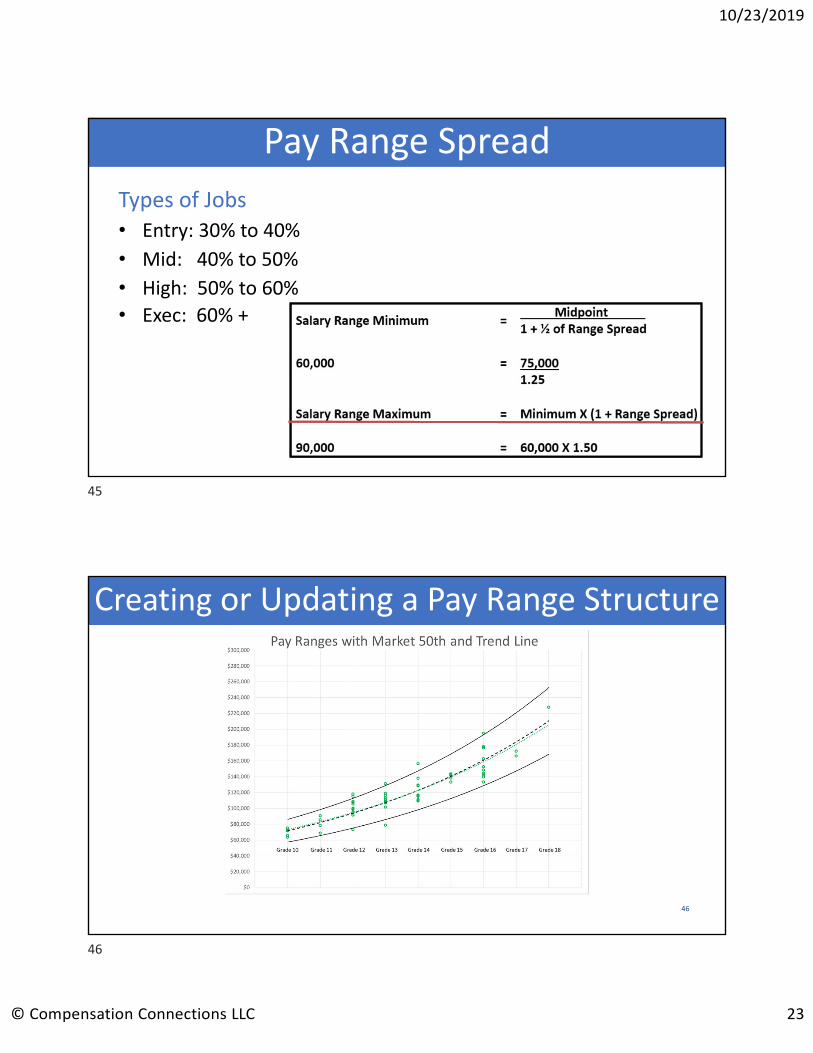
Pay Range Midpoint
Pay Grade2
Pay Grade1
Midpoint $38,500
Midpoint $35,000
• Market data trend line (pay line)
• Types of jobs
• Entry: 5% to 10%
• Mid: 10% to 15%
• High: 15% to 20%
• Exec: 20% +
More than one structure?44
43
44
Page 23
10/23/2019
© Compensation Connections LLC 23
Pay Range Spread
Types of Jobs• Entry: 30% to 40%
• Mid: 40% to 50%
• High: 50% to 60%
• Exec: 60% +
Creating or Updating a Pay Range Structure
46
45
46
Page 24
10/23/2019
© Compensation Connections LLC 24
• Initial placement based on market data, closest to the midpoint
• Example: Jobs that pay $47,000 in the market would be placed into grade 61
• Validate based on internal value of the job• Jobs of similar responsibility and scope• Within own department/group and across the organization• Could perform regression analysis if point factor system
Placing Jobs in a Pay Range Structure
47
Pay Range Structure ‐ Example
48
10 28,080 30,888 33,696 36,504 39,312 Groundskeeper
Hourly 13.50 14.85 16.20 17.55 18.90
11 30,888 28,746 37,066 37,835 43,243 Custodian, Data Entry Clerk, Receptionist
Hourly 14.85 13.82 17.82 18.19 20.79
12 33,977 28,746 40,772 37,835 47,568 Admin Asst I, Maintenance Tech
Hourly 16.34 13.82 19.60 18.19 22.87
13 37,374 28,746 44,849 37,835 52,324 Admin Asst II, Bookkeeper, Program Asst
Hourly 17.97 13.82 21.56 18.19 25.16
14 41,112 28,746 49,334 37,835 57,557
Hourly 19.77 13.82 23.72 18.19 27.67
15 45,223 28,746 54,268 37,835 63,312 Program Coordinator
Hourly 21.74 13.82 26.09 18.19 30.44
16 49,745 28,746 59,695 37,835 69,644 Facilities Supv
Hourly 23.92 13.82 28.70 18.19 33.48
17 54,720 28,746 65,664 37,835 76,608 Program Manager
Hourly 26.31 13.82 31.57 18.19 36.83
18 60,192 28,746 72,230 37,835 84,269
19 66,211 28,746 79,453 37,835 92,696 Facilities Manager
20 72,832 28,746 87,399 37,835 101,965 Program Director
Job TitleGrade Minimum 25th Midpoint 75th Maximum
47
48
Page 25
10/23/2019
© Compensation Connections LLC 25
Evaluating the Results
• Green circles and red circles• Pay compression• Pay equity analysis
49
What’s A Compa‐Ratio?
Range Minimum
Range Midpoint
Range Maximum
$36,000 $45,000 $54,000Compa‐Ratio Compa‐Ratio Compa‐Ratio
0.80 1.00 1.20
Formula commonly used by compensation professionals
to assess the competitiveness of an employee’s pay level.
50
49
50
Page 26
10/23/2019
© Compensation Connections LLC 26
Using Compa‐RatiosCompa‐ratio Matrix
Years of Experience Place‐In‐RangeExample
Compa‐ratios0 ‐ 2 years 1 .80 to .873 ‐ 4 years 2 .88 to .955 ‐ 8 years 3 .96 to 1.049 ‐ 12 years 4 1.05 to 1.1113 ‐ 18 years 5 1.12 to 1.2019+ years Maximum 1.20 (top of range)
Other factors to consider:‐ Job performance‐ Potential‐ Value to the organization
Note:Years of experience includes relevant experience prior to
working at company + years with company.51
Using Compa‐Ratios
Employee Name Job TitleCompa‐ratio to
Market
Current Pay
Level
ENTER New
Compa‐ratio
Langer, Reita Administrative Assistant 0.90 Under 1.00
Morones, Simona Administrative Assistant 1.03 In Range 1.03
Jelley, Edyth Receptionist 1.06 Slightly Over 1.06
Batdorf, Holly Office Manager 1.11 Slightly Over 1.11
Bookman, Angelo Accountant 0.90 Under 1.00
Canning, Reena Accountant 1.03 In Range 1.03
Boyers, Mathilda AP/AR Clerk 0.98 In Range 1.00
Mikesell, Gabriela Accounting Manager 0.89 Under 1.00
Farnum, Ronna LPN 1.01 In Range 1.01
Grieco, Hildred LPN 0.99 In Range 1.00
Hennig, Yajaira LPN 1.20 Slightly Over 1.20
Linder, Kerstin LPN 1.23 Over 1.23
Matsuda, Lenny LPN 1.23 Over 1.23
Meraz, Jong LPN 1.02 In Range 1.02
Pribble, Colleen LPN 1.21 Over 1.21
Stoll, Harrison LPN 1.01 In Range 1.01
52
51
52
Page 27
10/23/2019
© Compensation Connections LLC 27
Pay Administration
53
Pay Range Adjustments• How often?
• How much?
• What time of year?
World at Work
JOB TYPENATIONAL ALL INDUSTRY
2016 2017 2018 2019 2020
Exempt 2.00% 2.10% 2.00% 2.20% 2.20%
Non Exempt 2.00% 2.10% 2.00% 2.10% 2.20%
Average Pay Range Adjustments
54
53
54
Page 28
10/23/2019
© Compensation Connections LLC 28
Integrating New Jobs
If This Happens:• New job is created
• Existing job changes
Use One of These Methods:• Internal value approach – “slot” the job
• Market approach – use external market data
55
Market Adjustments
When HR researches the market value of a job and finds that the
market is paying (significantly) more than the organization:
• Should there be a grade change?
• How much should someone’s pay change?
• Should pay for everyone in that job be adjusted?
56
55
56
Page 29
10/23/2019
© Compensation Connections LLC 29
Setting Pay For New Hires
57
Step Increases
• Periodic increases in employee’s rate of base pay
• Standard for government employers
• Adopted by private sector unionized organizations
• Set by schedule or bargaining• Unrelated to job performance
• Intent is to keep up with inflation
• At top of scale: What then?
58
57
58
Page 30
10/23/2019
© Compensation Connections LLC 30
Promotions
How much money should someone receive for a promotion?
Job Group 2010 2012 2014 2016
Nonexempt 7.0% 7.4% 7.6% 8.1%
Exempt 8.3% 8.7% 8.8% 9.3%
Management 9.5% 10.2% 10.1% 9.6%
Promotional Guidelines Report, World at Work, 2016 (most recent)
59
Transfers
How much money should someone receive for a transfer?
60
59
60
Page 31
10/23/2019
© Compensation Connections LLC 31
Counter Offers
61
Total Compensation Statements
• Demonstrates transparency• Reinforces your employer brand• Helps employees understand the overall value of their
compensation• Gives employees a chance to ask questions (eek!)• Is data readily available?
61
62
Page 32
10/23/2019
© Compensation Connections LLC 32
Pay Guidelines
• Establish written pay guidelines
• Consistent application and decision making
• Transparency
63
Compensation Budgets
How Much To Budget?• Typically annual amount
• Includes current amount + additional pay
• Include all pay changes throughout the year:• Market adjustments
• Merit increases
• Promotions
• New positions
• Unplanned changes64
63
64
Page 33
10/23/2019
© Compensation Connections LLC 33
Linking Pay and Performance
65
Motivation Theories
66
65
66
Page 34
10/23/2019
© Compensation Connections LLC 34
Maslow’s Hierarchy of Needs
Physiological
Safety and Security
Belonging and Love
Esteem (Self and Others)
Self‐Actualization
Hierarchy of Needs67
Herzberg’s Motivation‐Hygiene Theory
Hygiene Factors
Pay
Status
Security
Working Conditions
Benefits
Relationships
Motivator Factors
Meaningful Work
Challenging Work
Recognition
Feeling of Achievement
Opportunity for Growth
Responsibility
68
67
68
Page 35
10/23/2019
© Compensation Connections LLC 35
Vroom’s Expectancy Theory
69
Differentiating Pay by Job Performance
Merit Increases
70
Average Increase by Performance % of Workforce in Each Performance Rating
Mercer’s US Compensation Planning Survey 2019‐2020
69
70
Page 36
10/23/2019
© Compensation Connections LLC 36
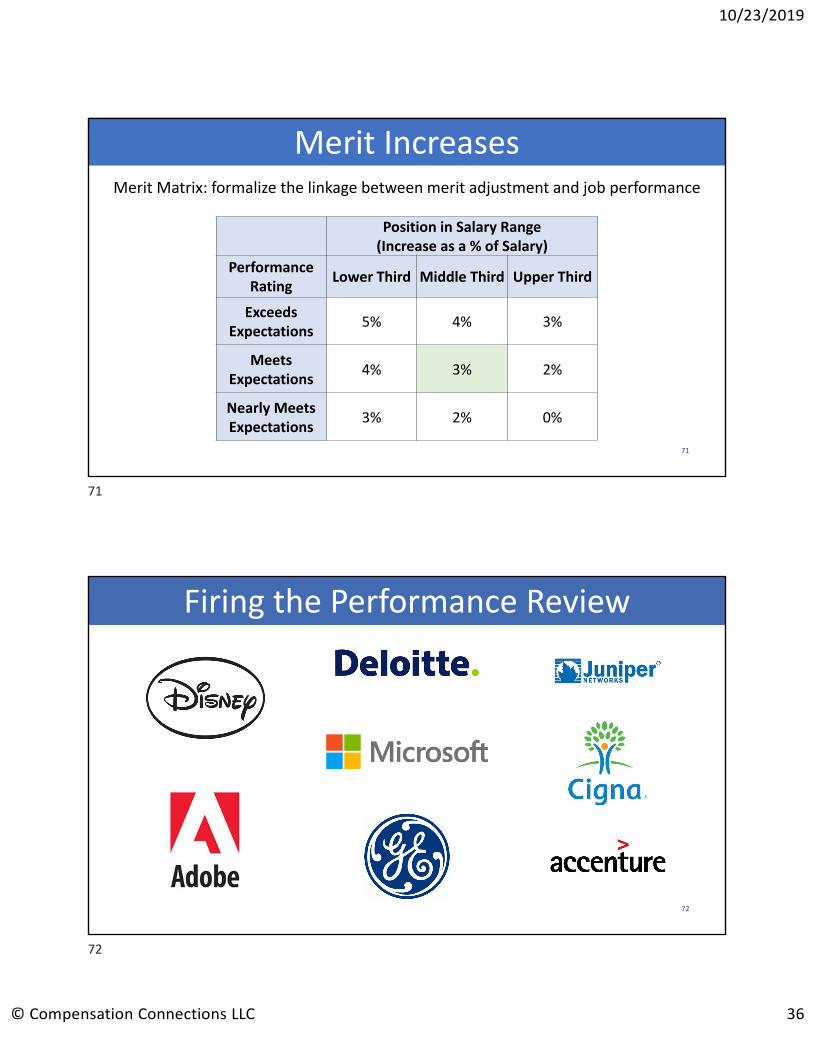
Merit Matrix: formalize the linkage between merit adjustment and job performance
Merit Increases
Position in Salary Range(Increase as a % of Salary)
Performance Rating
Lower Third Middle Third Upper Third
Exceeds Expectations
5% 4% 3%
Meets Expectations
4% 3% 2%
Nearly Meets Expectations
3% 2% 0%
71
Firing the Performance Review
72
71
72
Page 37
10/23/2019
© Compensation Connections LLC 37
Merit Increases vs. COLA
3.6% 3.6%
1.6%
2.3%
2.7% 2.7%2.9%
3.0% 3.0% 3.0% 3.0%2.8%
3.8%
‐0.4%
1.6%
3.2%
2.1%
1.5% 1.5%
2.1%
1.3%
2.1%
‐1.0%
‐0.5%
0.0%
0.5%
1.0%
1.5%
2.0%
2.5%
3.0%
3.5%
4.0%
4.5%
2007 2008 2009 2010 2011 2012 2013 2014 2015 2016 2017
Merit COLA 73
Trends
74
73
74
Page 38
10/23/2019
© Compensation Connections LLC 38
Flat Merit Budgets…
… are leading to an increased use of incentive pay75
NATIONAL ALL INDUSTRY
2017 2018 2019 2020
3.1% 3.1% 3.2% 3.3%
3.1% 3.1% 3.2% 3.3%
World at Work 2019‐2020 Salary Budget Survey: Top‐Level Results
Minimum Wage Map
Economic Policy Institute and Wolters Kluwer, 201876
75
76
Page 39
10/23/2019
© Compensation Connections LLC 39
Living Wage Map
MIT Living Wage Calculator 77
Pay Equity
The State of the Gender Pay Gap 2018, PayScale 78
77
78
Page 40
10/23/2019
© Compensation Connections LLC 40
Pay Equity
Disappointing Facts About the Black‐White Wage Gap, Federal Reserve Bank San Francisco, 2017
79
Personalized Rewards
80
79
80
Page 41
10/23/2019
© Compensation Connections LLC 41
THANK YOU!
Shannon DrohmanPrincipal at Compensation Connectionswww.compensationconnections.com
206‐946‐8056
81
82