125
Washington State Economic and Revenue Forecast September 2017 Volume XL, No. 3

Washington State Economic
and Revenue Forecast
September 2017
Volume XL, No. 3

6400 Linderson Way SW, Suite 238, Tumwater, WA 98501• P.O. Box 40912 • Olympia, WA 98504-0912
(360) 534-1560 • FAX (360) 534-1561 • www.erfc.wa.gov
Economic and Revenue Forecast Council Members
Senator Kevin Ranker, Chair
Senator John Braun Representative Terry Nealey
Representative Timm Ormsby
Treasurer Duane Davidson
David Schumacher, Director, OFM Vikki Smith, Director, DOR
Forecast Council Staff
Dr. Steve Lerch, Executive Director, Chief Economist Mr. Bret Bertolin, Senior Economist
Mr. Eric Swenson, Senior Economist Mr. Lance Carey, Senior Economist
Ms. desirée Monroy, Assistant Director of Administrative Services
This Publication is available on the Internet at http://www.erfc.wa.gov

Washington State Economic
and Revenue Forecast
Prepared by the
Economic and Revenue Forecast Council
September 2017
Volume XL, No. 3

This page left intentionally blank.

September 2017 iii
Preface
ERFC forecasting structure and schedule
The Economic and Revenue Forecast Council is required by Chapter 231, Section 34,
Laws of 1992 (RCW 82.33.020) to prepare a quarterly state economic and revenue
forecast and submit it to the Forecast Council. This report presents the state’s
economic and General Fund-State revenue forecast. It is issued four times a year.
The Washington State GF-S revenue forecast is prepared quarterly in conjunction
with the state economic forecast for the Economic and Revenue Forecast Council.
The Council consists of six members, two appointed by the Governor and four
appointed by the Legislature – one from each caucus of the Senate and House of
Representatives. Current members of the Economic and Revenue Forecast Council
are listed inside the front cover of this publication. The GF-S revenue forecast is
updated four times per year: March (February in even-numbered years), June,
September, and November. The staff of the Economic and Revenue Forecast Council
is responsible for the preparation of the state’s economic forecast and the forecast of
the Department of Revenue’s GF-S revenue sources as well as GF-S revenue from
fines and forfeitures collected by the Administrative Office of the Courts. The staff is
also responsible for review and coordination of the revenue forecasts of other
agencies that collect relatively large amounts of GF-S revenue. These are the
Department of Licensing, the Office of the Insurance Commissioner, the Lottery
Commission, the State Treasurer, the Liquor and Cannabis Board and the Office of
Financial Management. The Office of Financial Management is responsible for
summarizing the forecasts of all other state agencies that collect relatively smaller
amounts of GF-S revenue.
Forecast Procedure
For each quarterly update, the staff of the Economic and Revenue Forecast Council,
under the direction of the Executive Director, reviews (and if warranted, modifies) a
national economic forecast prepared by Global Insight, Inc. A state economic
forecast is then prepared using an econometric model that links Washington’s
economy to the national economy. After review by forecast workgroups; the
Governor’s Council of Economic Advisors; and the Economic and Revenue Forecast
Council, this state economic forecast (updated for newly released data) is used to
prepare a baseline revenue forecast for GF-S and the related funds. The forecasts
are based on current law and administrative practices and do not reflect pending
legal challenges to GF-S receipts until they are resolved. Additionally, at least two
alternative forecasts are prepared for all GF-S and related fund sources and
presented to the Forecast Council for approval. Once the Council approves the
forecast, it becomes the official forecast of GF-S and related fund revenues.
Data in this publication are accurate through September 29, 2017.

This page left intentionally blank.

v
Table of Contents
Preface ................................................................................................................. iii
List of Tables ......................................................................................................... vi
List of Figures ...................................................................................................... vii
Executive Summary ............................................................................................... 1
U.S. Economic Forecast .............................................................................................. 2
Washington Economic Forecast ................................................................................... 2
Revenue Forecast ...................................................................................................... 3
Chapter 1: U.S. Economy – Current Conditions and Forecast ................................ 5
Current Conditions .................................................................................................... 5
Forecast ................................................................................................................. 10
Risks to the Forecast ............................................................................................... 17
Chapter 2: Washington Economy – Current Conditions and Forecast ................. 23
Current Conditions .................................................................................................. 23
Washington State Forecast ....................................................................................... 27
Washington Payroll Employment ............................................................................... 28
Washington Personal Income .................................................................................... 29
Washington Building Permits .................................................................................... 30
Seattle Consumer Price Index ................................................................................... 30
Alternative Scenarios ............................................................................................... 31
Chapter 3: Washington State Revenue Forecast Summary ................................. 45
Overview................................................................................................................ 45
Recent Collection Experience .................................................................................... 47
Legislative Changes to the Forecast ........................................................................... 49
Revenue Forecasts by Source ................................................................................... 50
Department of Revenue ........................................................................................... 50
Forecasted Revenue from Cannabis-Related Sales ....................................................... 54
The Office of Financial Management (Other Agencies) .................................................. 54
State Treasurer ....................................................................................................... 55
Insurance Commissioner .......................................................................................... 55
Liquor and Cannabis Board ....................................................................................... 55
Lottery Commission ................................................................................................. 56
Administrative Office of the Courts ............................................................................ 56
Track Record for the 2015-17 Biennium ..................................................................... 56
Track Record for the 2017-19 Biennium ..................................................................... 57
The Relationship between the Cash and GAAP GF-S Revenue Forecasts ......................... 57
Budgetary Balance Sheet for the 2015-17 Biennium .................................................... 57
Alternative Forecasts for the 2015-17 and 2017-19 Biennia .......................................... 58
Near General Fund Forecasts for the 2015-17 - 2019-21 Biennia ................................... 58
Appendix ............................................................................................................. 77
Glossary ............................................................................................................ 115

vi
List of Tables
Chapter 1: U.S. Economy – Current Conditions and Forecast
Table 1.1 U.S. Economic Forecast Summary ......................................................... 18
Table 1.2 Forecast Analysis, Comparison of Forecasts for 2015-17 .......................... 19
Table 1.3 Forecast Analysis, Comparison of Forecasts for 2017-19 .......................... 20
Table 1.4 Forecast Comparison, 2018 to 2021 ...................................................... 21
Chapter 2: Washington Economy – Current Conditions and Forecast
Table 2.1 Washington Economic Forecast Summary ............................................... 34
Table 2.2 Comparison of Alternative Forecasts ...................................................... 35
Table 2.3 Governor’s Council of Economic Advisor’s Forecast .................................. 36
Table 2.4 Forecast Analysis, Comparison of Forecasts for 2015-17 .......................... 37
Table 2.5 Forecast Analysis, Comparison of Forecasts for 2017-19 .......................... 38
Table 2.6 Forecast Comparison, 2018 to 2021 ...................................................... 39
Chapter 3: Washington State Revenue Forecast Summary
Table 3.1 Revisions to the General Fund-State Forecast ......................................... 46
Table 3.2 Collection Variance of Major General Fund-State Taxes by Agency ............. 48
Table 3.3 General Fund-State Collections ............................................................. 60
Table 3.4 Taxable Retail Sales ............................................................................ 61
Table 3.5 General Fund-State forecast by agency, 2015-17 biennium, Cash ............. 62
Table 3.6 General Fund-State forecast by agency, 2015-17 biennium, GAAP............. 63
Table 3.7 General Fund-State forecast by agency, 2017-19 biennium, Cash ............. 64
Table 3.8 General Fund-State forecast by agency, 2017-19 biennium, GAAP............. 65
Table 3.9 September 2017 General Fund-State History and Forecast ....................... 66
Table 3.10 Track Record for the 2015-17 General Fund-State Cash Forecast .............. 67
Table 3.11 Track Record for the 2017-19 General Fund-State Cash Forecast .............. 68
Table 3.12 2015-17 Enacted Budget Balance Sheet ................................................. 69
Table 3.13 Alternative Forecasts Compared to the Baseline Forecast, 2015-17 ........... 70
Table 3.14 Alternative Forecasts Compared to the Baseline Forecast, 2017-19 ........... 71
Table 3.15 Lottery Transfers by Fund, Cash ............................................................ 72
Table 3.16 Lottery Transfers by Fund, GAAP ........................................................... 72
Table 3.17 GF-S, ELTA and OPA: History and Forecast of Components ....................... 73
Table 3.18 Forecasted Distribution of Excise Tax & License Fees from Cannabis Sales .. 74
Table 3.19 Revenue Legislation Affecting General Fund-State Revenues ..................... 75
Appendix: Detail Components of the State Economic and Revenue Forecast
Table A1.1 U.S. Economic Forecast Summary, Annual ............................................. 79
Table A1.2 U.S. Economic Forecast Summary, Quarterly .......................................... 80
Table A1.3 Washington Economic Forecast Summary, Annual ................................... 83
Table A1.4 Washington Economic Forecast Summary, Quarterly ............................... 84
Table A2.1 U.S. Nonagricultural Employment by Industry, Annual ............................. 87
Table A2.2 U.S. Nonagricultural Employment by Industry, Quarterly .......................... 88
Table A2.3 Washington Nonagricultural Employment by Industry, Annual ................... 91
Table A2.4 Washington Nonagricultural Employment by Industry, Quarterly ............... 92
Table A3.1 U.S. Personal Income by Component, Annual ......................................... 95
Table A3.2 U.S. Personal Income by Component, Quarterly ...................................... 96
Table A3.3 Washington Personal Income by Component, Annual ............................... 99
Table A3.4 Washington Personal Income by Component, Quarterly ......................... 100
Table A4.1 Selected Inflation Indicators ............................................................... 103
Table A4.2 Chain-Weighted Price Indices .............................................................. 104
Table A5.1 Washington Resident Population and Components of Change .................. 105
Table A5.2 Washington Population ....................................................................... 106
Table A6.1 Summary of National and State Indicators ........................................... 107
Table A6.2 Washington Business Indicators .......................................................... 108

vii
List of Figures
Chapter 1: U.S. Economy – Current Conditions and Forecast
Figure 1.1 Net Change in U.S. Total Nonfarm Employment ........................................7
Figure 1.2 30-Year Fixed Mortgage Rate ..................................................................9
Figure 1.3 Institute for Supply Management Index ................................................. 10
Figure 1.4 U.S. Months of Recovery after Reaching Previous Peak in Employment ...... 11
Figure 1.5 Core Personal Consumption Expenditure (PCE) Price Index ....................... 12
Figure 1.6 GDP Growth of Major U.S. Trading Partners ............................................ 15
Chapter 2: Washington Economy – Current Conditions and Forecast
Figure 2.1 Washington Initial Claims ..................................................................... 24
Figure 2.2 Case-Shiller Home Price Indices ............................................................ 25
Figure 2.3 Washington Personal Income Revision ................................................... 27
Figure 2.4 Washington Construction Employment ................................................... 29
Figure 2.5 Washington Personal Income ................................................................ 30
Figure 2.6 Seattle Consumer Price Inflation ........................................................... 31
Figure 2.7 Comparison of Washington and U.S. Economic Forecasts ......................... 40
Figure 2.8 Comparison of Alternative U.S. Economic Forecasts ................................. 43
Figure 2.9 Comparison of Alternative Washington Economic Forecasts ...................... 44
Chapter 3: Washington State Revenue Forecast Summary
Figure 3.1 GF-S Revenue as Percentage of State Personal Income ............................ 47
Figure 3.2 Revenue Act Collections ....................................................................... 48
Figure 3.3 Taxable Real Estate Excise Activity ........................................................ 49
Figure 3.4 Taxable Sales as a Percentage of State Personal Income .......................... 51
Appendix:
Detail Components of the Washington State Economic and Revenue Forecast
Figure A7.1 Washington State Economic Indicators ................................................. 109
Figure A7.2 Washington State Leading Indicators ................................................... 110
Figure A7.3 Other State Economic Indicators ......................................................... 111
Figure A7.4 Other Economic Indicators ................................................................. 112

This page left intentionally blank.

Economic and Revenue Forecast Council 1
Executive Summary
The national economy continues to expand at a moderate pace. Real GDP rose 3.1% (SAAR) in the second quarter after growing 1.2% (SAAR) in the first quarter.
Employment growth has remained solid even as the economy has approached full employment.
Consumer and business confidence remains high.
The Blue Chip Consensus GDP forecast calls for real GDP growth of 2.2% in 2017 and then increases to 2.4% in 2018. The forecast calls for growth of 2.1%, 2.0%, and 2.0% from 2019 through 2021.
Since the November presidential election, no major policy changes have been enacted although the forecast includes an increase in infrastructure spending and tax changes.
Recent Washington employment and income have been revised higher since the June forecast.
Seattle home prices continue to rise very rapidly and housing construction remains strong.
The September forecast for Washington State features higher employment and personal income than in June.
Revenue collections since the June 2017 forecast have come in $94 million over
the forecasted amount.
The September forecast includes large increases in expected General Fund-State (GF-S) revenue from legislative changes. These new laws, intended to provide full state funding of basic education as required by the State Supreme Court’s McCleary decision, add $2.1 billion to forecasted revenue in the 2017-19 biennium and $3.3 billion in the 2019-21 biennium.
Forecast increases from changes to the economic forecast were relatively small. Projected higher employment and personal income brought increases of $279 million in the 2017-19 biennium and $243 million in the 2019-21 biennium.
The preliminary estimate of GF-S revenue for the 2015-17 biennium is $3 million higher than forecasted in June.
The total forecast increase for the 2017-19 biennium was $2.4 billion and the increase for the 2019-21 biennium was $3.5 billion.
Executive Summary 2
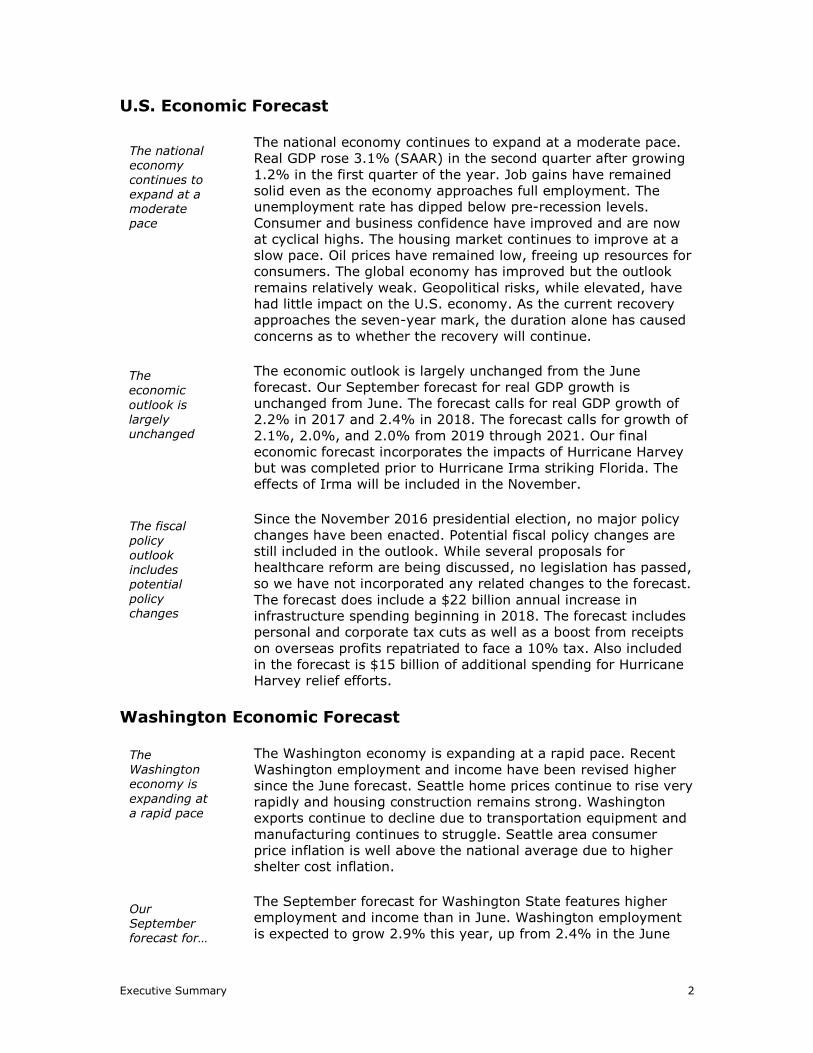
U.S. Economic Forecast
The national economy continues to expand at a moderate pace.
Real GDP rose 3.1% (SAAR) in the second quarter after growing
1.2% in the first quarter of the year. Job gains have remained
solid even as the economy approaches full employment. The
unemployment rate has dipped below pre-recession levels.
Consumer and business confidence have improved and are now
at cyclical highs. The housing market continues to improve at a
slow pace. Oil prices have remained low, freeing up resources for
consumers. The global economy has improved but the outlook
remains relatively weak. Geopolitical risks, while elevated, have
had little impact on the U.S. economy. As the current recovery
approaches the seven-year mark, the duration alone has caused
concerns as to whether the recovery will continue.
The economic outlook is largely unchanged from the June
forecast. Our September forecast for real GDP growth is
unchanged from June. The forecast calls for real GDP growth of
2.2% in 2017 and 2.4% in 2018. The forecast calls for growth of
2.1%, 2.0%, and 2.0% from 2019 through 2021. Our final
economic forecast incorporates the impacts of Hurricane Harvey
but was completed prior to Hurricane Irma striking Florida. The
effects of Irma will be included in the November.
Since the November 2016 presidential election, no major policy
changes have been enacted. Potential fiscal policy changes are
still included in the outlook. While several proposals for
healthcare reform are being discussed, no legislation has passed,
so we have not incorporated any related changes to the forecast.
The forecast does include a $22 billion annual increase in
infrastructure spending beginning in 2018. The forecast includes
personal and corporate tax cuts as well as a boost from receipts
on overseas profits repatriated to face a 10% tax. Also included
in the forecast is $15 billion of additional spending for Hurricane
Harvey relief efforts.
Washington Economic Forecast
The Washington economy is expanding at a rapid pace. Recent
Washington employment and income have been revised higher
since the June forecast. Seattle home prices continue to rise very
rapidly and housing construction remains strong. Washington
exports continue to decline due to transportation equipment and
manufacturing continues to struggle. Seattle area consumer
price inflation is well above the national average due to higher
shelter cost inflation.
The September forecast for Washington State features higher
employment and income than in June. Washington employment
is expected to grow 2.9% this year, up from 2.4% in the June
The Washington economy is
expanding at
a rapid pace
Our September forecast for…
The national economy continues to expand at a moderate pace
The fiscal policy
outlook includes
potential policy changes
The economic
outlook is largely unchanged

Executive Summary 3
forecast. We expect employment growth to average 1.6% per
year in 2018 through 2021, which is slightly higher than the
1.4% rate assumed in June. Our forecast for nominal personal
income growth this year is 5.8%, up from 4.7% in the June
forecast. Our new forecast for nominal personal income growth
in 2018 through 2021 averages 5.1% per year which is the same
rate as expected in the June forecast. The September housing
construction forecast is very close to the forecast adopted in
June. We expect total housing units authorized by building
permits to decline 2.4% this year to 43,000 units compared to
43,300 in the June forecast. We expect permits to average
42,300 during the next four years compared to 42,100 in June.
We expect the all-items Seattle CPI to rise 2.9% this year, down
from 3.0% in the June forecast. As in June, we expect Seattle
area inflation to average 2.2% per year in 2018 through 2021.
Revenue Forecast
Due to a surplus in revenue collections since the June forecast
and a slightly stronger state economic forecast, collections
excluding non-economic forecast changes are expected to
increase slightly. These changes, however, are greatly
outweighed by changes stemming from legislation passed in the
special legislative sessions subsequent to the June forecast.
These changes, enacted in response to a State Supreme Court
decision that found the state was inadequately funding basic
education, are expected to add over $5 billion in new revenue
over current and following biennia.
The preliminary tally of total GF-S revenue for the 2015-17
biennium, which ended on June 30, 2017, was $38,311.3 million,
$2.9 million more than forecasted in June. In the current
biennium, revenue sources that are tracked monthly came in
$87.0 million higher than forecasted in June. Legislative changes
added $2,079.1 million to the forecast. Changes to the economic
forecast resulted in a $192.5 million increase to projected
collections for the rest of the biennium. The total of these
components was a $2,358.6 million increase in projected
revenue for the current 2017-19 biennium. The forecast for the
2019-21 biennium has been increased by $3,521.3 million, with
a $3,278.4 million increase in forecasted revenue from legislative
changes and $242.8 million increase from economic factors. GF-
S revenue is now forecasted to total $38,311.3 million in the
2015-17 biennium, $43,261.7 million in the 2017-19 biennium,
and $47,396.4 million in the 2019-21 biennium.
The revenue forecast includes large
increases due to legislative changes
GF-S forecast
change by biennium (millions): 15-17: +$3 17-19: +$2,359 19-21: +$3,521
… Washington State features higher employment
and income than in June

This page left intentionally blank.

Economic and Revenue Forecast Council 5
Chapter 1: U.S. Economy – Current Conditions and Forecast
The national economy continues to expand at a moderate pace. Real GDP rose 3.1% (SAAR) in the second quarter after growing 1.2% (SAAR) in the first quarter.
Employment growth has remained solid even as the economy has approached full employment.
Consumer and business confidence remains high.
The manufacturing sector has strengthened while construction has hit a soft patch.
Oil prices remain low and inflation is moderate.
Exports are once again improving. Foreign growth has stabilized and the dollar is depreciating.
The Blue Chip Consensus GDP forecast calls for real GDP growth of 2.2% in 2017
and then increases to 2.4% in 2018. The forecast calls for growth of 2.1%, 2.0%, and 2.0% from 2019 through 2021.
Since the November presidential election, no major policy changes have been enacted although the forecast includes an increase in infrastructure spending and tax changes.
Higher business and consumer confidence leading to more hiring and spending is the most significant upside risk. A slowdown in global growth is the major
downside risk.
Current Conditions
The national economy continues to expand at a moderate pace.
Real GDP rose 3.1% (SAAR) in the second quarter after growing
1.2% in the first quarter of the year. Job gains have remained
solid even as the economy approaches full employment. The
unemployment rate has dipped below pre-recession levels.
Consumer and business confidence have improved and are now
at cyclical highs. The housing market continues to improve at a
slow pace. Oil prices have remained low, freeing up resources for
consumers. The global economy has improved but the outlook
remains relatively weak. Geopolitical risks, while elevated, have
had little impact on the U.S. economy. As the current recovery
The national
economy continues to expand at a moderate pace

Chapter 1 6
approaches the seven-year mark, the duration alone has caused
concerns as to whether the recovery will continue.
U.S. real GDP rose 3.1% (SAAR) in the second quarter of 2017
after growing 1.2% (SAAR) in the first quarter. Growth in
consumer spending accelerated from the previous quarter,
increasing 3.3% (SAAR) and adding 2.2 points to GDP growth.
Fixed investment was again a major contributor to growth,
increasing 3.2% (SAAR) and adding 0.5 points to GDP growth.
The gains came from the nonresidential sector while the
residential sector declined. Nonresidential fixed investment
increased 6.7% with gains in structures, equipment, and
intellectual property. Residential investment declined 7.3% in the
second quarter. Inventory investment added 0.1 points to overall
growth. Final sales, which exclude the impact from inventories,
increased 2.9% (SAAR). Government spending was slightly
negative with declines from state and local governments
offsetting increases in national defense spending. Net exports
added 0.2 points to growth. Real disposable income increased
3.3% (SAAR) after a 2.9% increase in the first quarter.
Personal income growth slowed to 3.0% (SAAR) in the second
quarter from 5.6% (SAAR) the quarter before. Personal income
is now up 2.9% from a year ago. Rental income was again
strong, increasing 5.3% (SAAR) in the second quarter. The tight
rental market has enabled landlords to increase rent, boosting
their income. Wage and salary growth was strong at 4.4%
(SAAR). Wage growth in the private sector improved to 4.9%
(SAAR) while public sector wages grew just 1.9% (SAAR). Over
the past few years, private sector wages have increased faster
than wages in the public sector. Transfer payment growth slowed
to 0.7% (SAAR), due to declines in Medicaid payments,
unemployment insurance benefits, and other transfers.
Proprietors’ income fell 0.5% (SAAR) due to a sharp drop in farm
income. Interest income fell 3.1% (SAAR). Dividend income
increased 11.4% (SAAR) but is up just 0.7% since last year.
Employment growth has remained solid. Nonfarm payrolls
increased by 156,000 in August following a 189,000 increase in
July. The three-month moving average of employment gains
dipped to 175,000, but remains consistent with gains earlier in
the year (see Figure 1.1). The goods-producing sector increased
70,000 with gains in construction (+28,000), manufacturing
(+36,000), and mining and logging (+6,000). Private service-
providing industries slowed, increasing 95,000 jobs over the
month. In July, private service jobs increased by 179,000.
August gains were led by professional and business services
(+40,000) and education and health (+25,000). Both retail trade
(+800) and temporary help services (+100) remain weak.
Government employment declined 9,000 in June, with losses in
federal (-1,000), state (-5,000), and local (-3,000) government
employment. Continued job gains have fueled a steady decline in
U.S. real GDP rose 3.1% (SAAR) in the second quarter
Employment growth has
remained
solid
Personal income growth slowed to
3.0% in the second quarter

Chapter 1 7
unemployment. The unemployment rate rose slightly to 4.4% in
August but remains below pre-recession levels.
Figure 1.1: Net Change in U.S. Total Nonfarm Employment
Source: U.S. Bureau of Labor Statistics; data through August 2017
Consumer attitudes have declined slightly in recent months but
remain high. The two primary measures of confidence have both
come down from their recent highs earlier in the year. In
September, the Conference Board measure of consumer
confidence declined 0.6 points to 119.8. Confidence is down
slightly from the peak of 124.9 reached in March, but still higher
than 103.5 from a year ago. Respondents to the survey indicated
they are less confident about present conditions while future
expectations improved. The University of Michigan Consumer
Sentiment Index fell by 1.7 points to 95.1 in September. The
University of Michigan measure is down from the peak of 98.5
reached in January, but still above the year-ago reading of 91.2.
Current conditions improved modestly while future expectations
declined in September.
Small business confidence remains high. After averaging below
94 for the first ten months of 2016, the National Federation of
Independent Business (NFIB) Index of Small Business Optimism
has been above 103 in each of the past nine months. In August,
the index was little changed at 105.3 and remains near its 10-
year high of 105.9 in January. The level of the index is just below
the all-time high of 107.4 reached in November 2004 (data back
to 1986). Small business expectations of general business
conditions, expansion, sales, and earnings have all remained
high. Actual earnings and sales of small businesses have
improved as well, but to a much smaller degree. Actual
employment changes have also turned positive. Taxes remain
the most cited concern for small businesses. Quality of labor is
now the second most cited concern, surpassing government
regulation.
Consumer attitudes have declined but remain high
Small business confidence
remains high
The trend in employment growth remains
solid
0
50
100
150
200
250
300
Sep-16 Dec-16 Mar-17 Jun-17
Thousands
Net New Jobs 3 Month MA

Chapter 1 8
Oil prices have moved up recently but remain low. West Texas
Intermediate (WTI) reached $48 per barrel in August, up from
$47 last month. Brent crude oil was $52 per barrel in August, up
from $48 last month. Both prices are up slightly from last year.
U.S. crude production has bounced around 9 million barrels per
day as prices have hovered in the $50 range. Production has
temporarily dropped due to the impact of Hurricane Harvey. The
U.S. Energy Information Administration (EIA) estimates that U.S.
crude oil production fell 7.8% to 8.8 million barrels per day due
to the hurricane. Internationally, the impact of Organization of
Petroleum Exporting Countries’ (OPEC) attempt to reduce supply
appears limited. Previously, OPEC had hoped that some of the
more expensive drilling techniques deployed in the U.S. would no
longer be profitable and would be shut down. Even if OPEC
members can maintain the discipline of supply quotas, U.S.
production is likely to ramp up, keeping prices in check. The
Kurdish referendum on independence from Iraq has the potential
to disrupt global supply. Turkey has threatened to shut the only
route to market for the nearly 600,000 barrels per day going
through the region.
Headline inflation remains tame. Energy prices increased in each
month this year after declining for much of the past two years.
The Consumer Price Index (CPI) increased 0.4% over the month
in August, resulting in an increase of 1.9% since last year. Food
price inflation is starting to pick up with prices rising 0.1% over
the month and 1.1% since last year. Shelter costs have been the
primary driver of higher overall prices. Shelter costs increased
0.5% in August and are now up 3.3% year over year. Core
inflation, which excludes food and energy, increased 0.2% in
August. Year-over-year, core inflation remains modest at 1.7%.
The housing market is stuck in a soft patch. Housing starts
declined in August for the second consecutive month. While the
drop is not likely the start of a downward turn in construction,
the trend remains flat. Housing starts declined in August to
1.180 million units (SAAR) from 1.190 million units (SAAR) in
July. Starts still remain up 1.4% since last year, however.
Single-family starts increased 1.6% while multi-family starts fell
6.5%. The multi-family segment, while somewhat sporadic,
appears to have fully recovered from the housing downturn.
Housing permits appear stronger than starts. Total permits
increased 5.7% in August and are up 8.3% from a year ago.
Single-family permits are up 7.7% while multi-family permits are
up 9.4% since last year. Homebuilder confidence declined in
September but remains healthy. The National Association of
Homebuilders (NAHB) Housing Market Index, which measures
confidence of homebuilders, declined 3 points from last month to
64 (readings above 50 indicate a positive view of conditions).
While builders are confident, the recent hurricanes weighed on
the index.
Inflation remains tame
Oil prices
remain low
The housing market is stuck in a soft patch

Chapter 1 9
Home price appreciation remains solid. The seasonally adjusted
Case-Shiller 20-city Home Price Index increased 0.3% over the
month in July. Home prices are now 5.9% higher than a year
ago. Home prices appear to be settling into a consistent growth
pattern, averaging 5.4% annual growth over the past two years.
Prices have increased 41.6% since the trough of the recession,
and are now only 3.5% below their previous peak. Rising prices
encourage new construction and are contributing to the high
level of homebuilder confidence. Home price appreciation also
enables previously underwater homeowners to sell their homes
and trade up for more expensive houses. Despite the Federal
Reserve tightening monetary policy, mortgage rates for a fixed
30-year mortgage have declined to just above 3.8% (see Figure
1.2). Lending standards eased again in the third quarter, making
it easier for consumers to obtain a mortgage. Continued positive
wage growth should also help keep homes affordable.
Figure 1.2: 30-Year Fixed Mortgage Rate
Source: Freddie Mac; data through September 2017
The manufacturing sector has picked up strength. The Institute
of Supply Management (ISM) Report on Business indicated that
activity in the manufacturing sector improved in August to 58.8
from 56.3 (index levels above 50 indicate expansion). This was
the best reading since 2011 (see Figure 1.3). The new orders
component decreased slightly by 0.1 points but remains strong
at 60.3. Production increased 0.4 points to 61.0. The
employment component increased 4.7 points to 59.9. The latest
G-17 report from the Federal Reserve, which measures
manufacturing output, declined 0.3 percent after six consecutive
monthly gains. Hurricane Harvey is estimated to have lowered
output by 0.75 percentage points. The production of durable
goods increased 0.3% but was more than offset by declines in
nondurable goods and other manufacturing. Manufacturing
output is now 1.5% higher than last year. New orders for core
capital goods (nondefense capital goods excluding aircraft)
The manufacturing sector has picked up
strength
Home price
appreciation remains solid
Mortgage rates
continue to
decline
3.6
3.7
3.8
3.9
4.0
4.1
4.2
4.3
4.4
Jan Mar May Jul Sep
Perc
ent

Chapter 1 10
increased 0.9% in August after increasing by 1.1% the month
before. New orders are now 3.3% above year-ago levels.
Figure 1.3: Institute for Supply Management Index
Source: Institute for Supply Management; data through August 2017
U.S. exports increased in the second quarter by 5.9% year-over-
year. Transportation equipment exports remain weak, declining
0.3% from last year. Oil and gas exports again increased
dramatically, up 61.5% from a year ago. Global economic growth
has picked up, increasing demand for U.S. products. The U.S.
dollar continues to weaken making U.S. exports more affordable.
Exports to the rest of North America are growing again. Exports
to Canada increased 3.0% while exports to Mexico were up
4.2%. Exports to China and Japan, our third and fourth largest
trading partners, increased 14.2% and 11.0% respectively.
Forecast
The economic forecast was based on a modified version of the
September IHS Markit (formerly Global Insight) Control forecast
for the U.S. economy. Consistent with our standard practice, the
U.S. real GDP forecast was adjusted to match the September
Blue Chip Consensus GDP forecasts for 2017 and 2018. We also
matched the latest long-term Blue Chip GDP forecast for 2019
through 2021. Our oil price forecast was adjusted to reflect
futures prices for both Brent crude oil and for West Texas
Intermediate crude.
The economic outlook is largely unchanged from the June
forecast. Our September forecast for real GDP growth is
unchanged from June. The forecast calls for real GDP growth of
2.2% in 2017 and 2.4% in 2018. The forecast calls for growth of
2.1%, 2.0%, and 2.0% from 2019 through 2021. Our final
economic forecast incorporates the impacts of Hurricane Harvey
Our forecast is
based on the September Blue Chip Consensus forecast
The economic outlook is largely unchanged
U.S. exports have returned to growth
Manufacturing activity is improving
44
46
48
50
52
54
56
58
60
62
2010 2012 2014 2016
Index,
50
+ =
gro
wth

Chapter 1 11
but was completed prior to Hurricane Irma striking Florida. The
effects of Irma will be included in the November forecast.
The positive GDP growth throughout the forecast will make the
recovery from the 2007-09 recession the longest on record.
From the second quarter of 2009 through the end of our forecast
in 2021, the recovery is forecasted to be at least 150 months.
Through August, this recovery has already lasted 98 months.
Prior to this, the longest recovery was from the 1990-91
recession and lasted 120 months. The primary reason for the
exceptional length of the current recovery was the depth of the
recession. Despite positive GDP growth, the labor market
remained weak for an extended period. It took 58 months of
recovery just to reach the previous peak in employment. When
comparing recoveries in the duration since reaching the previous
employment peak, this expansion appears more in line with
other post-war expansionary periods (see Figure 1.4). The two
longest post-war expansions had 96 and 95 months of additional
employment growth after reaching the previous peak. We expect
growth to continue through the end of the forecast in 2021,
which would result in 92 months of employment gains after
reaching the previous employment peak.
Figure 1.4: U.S. Months of Recovery after Reaching
Previous Peak in Employment
Source: NBER, ERFC September 2017 forecast; historical data through August 2017
The oil price forecast was changed by only a small amount since
the June forecast. Prices are slightly higher compared to the
previous forecast. The refiner acquisition price of crude oil fell to
$48 per barrel in the second quarter of this year from $50 per
barrel in the first quarter. The forecast calls for $47 to be the
trough in the second half of this year before gradually increasing
throughout the forecast. We expect prices to increase to $50 per
barrel in the first quarter of next year and then slowly reach $51
per barrel in 2021. Oil prices will remain well below the levels
Oil prices will
remain low
This recovery will be the longest on record
0
20
40
60
80
100
Month
s
Actual Forecast
The jobs recovery will be one of the
longest on record

Chapter 1 12
seen earlier in the recovery. Hurricane Harvey is going to distort
oil price data temporarily, but will not have a lasting impact. The
hurricane caused only moderate damage to Gulf of Mexico oil
production. Oil production in the U.S. has hovered around 9
million barrels per day this year. Production is just below the
previous peak reached in the summer of 2015 when production
hit 9.6 million barrels per day. The number of drilling structures
has been increasing lately. The Baker Hughes rig count was at
935 at the end of September, an increase of 424 since last year.
Inflation (as measured by the price index for personal
consumption expenditures) was just 1.2% in 2016, helped by a
decline in energy prices. While energy prices will remain low,
they are no longer declining and pulling inflation down. Rising
housing costs have put upward pressure on inflation. Absent the
downward pressure from energy prices, we expect low to
moderate inflation throughout the forecast. Core inflation (minus
food and energy) will move towards the Federal Reserve’s goal of
2% (see Figure 1.5). We expect inflation to be 1.7% this year
and then range from 1.5% to 2.0% per year from 2018 through
2021.
Figure 1.5: Core Personal Consumption Expenditure (PCE)
Price Index, Year-Over-Year Percent Change
Source: Bureau of Economic Analysis forecast; historical data through 2016
Real consumer spending was stronger than expected in the
second quarter of 2017, growing 3.3% (SAAR) compared to
2.8% (SAAR) expected in the previous forecast. Hurricane
Harvey will affect consumer spending in the short term. Third
quarter growth will slow as consumers curtail purchases,
although fourth quarter growth will be boosted due to rebuilding.
We now expect real consumer spending to grow 2.7% this year
compared to 2.4% in the June forecast. Consumer optimism
remains high. Rising home prices and a stronger stock market
make consumers feel more confident in their financial situation.
Wages are also increasing. Unemployment continues to fall and
Spending
growth will outperform overall GDP
growth in the near term
Inflation will
remain low
1.0
1.2
1.4
1.6
1.8
2.0
2.2
2015 2016 2017 2018 2019 2020 2021
Perc
ent
Fed Target Core Inflation
Core inflation will approach the Fed’s
target

Chapter 1 13
more part-time workers are finding full-time jobs. We expect real
spending growth to continue to slightly outpace overall real GDP
growth next year. The forecast calls for real consumption growth
of 2.5% in 2018. The forecast assumes a federal tax cut that
boosts disposable personal income in 2018. Consumer spending
growth is then expected to slow to 2.3% in 2019, 2.2% in 2020,
and 2.1% in 2021, unchanged from the previous forecast. We
expect consumer spending to contribute 1.6 percentage points to
real GDP growth on average for each year of the forecast
through 2021.
Real disposable personal income growth is expected to slow this
year to 1.3% from 2.4% in 2016. The boost to real incomes from
falling energy prices has ended. Growth is expected to increase
to 2.7% in 2018 and 2.9% in 2019 due to the assumption of
modest tax cuts. We expect growth to moderate to 2.3% in 2020
and 2.1% in 2021. Nominal disposable income is projected to
grow 3.1% this year, led by strong growth in rental income of
5.2%. Interest income is expected to grow 4.2% in 2017 as the
Federal Reserve slowly tightens monetary policy. Private sector
wages and salaries are forecasted to grow 3.3%. Wage growth in
the public sector will again lag, with growth of 2.6% in 2017.
Total wages and salaries are expected to grow 3.2% this year
after increasing 2.9% in 2016. The forecast then calls for growth
in wages and salaries to average 4.0% in 2018 through 2021.
Dividend payments are expected to grow 0.7% in 2017. Growth
in government transfer payments is expected to be 3.0% this
year. We expect growth to pick up an average of 5.3% per year
in 2018 through 2021 as an increasingly older population results
in rising Medicare and Social Security payments. Income will be
boosted in the latter part of the forecast by rising interest
income, as interest rates return to pre-recession levels, as well
as by dividend income.
The forecast for employment is only minimally changed from the
June forecast. Growth in payrolls is anticipated to be 1.5% this
year after growing 1.8% in 2016. The June forecast had
expected 1.4% growth for 2017. We expect employment growth
to slowly trend down to 0.6% by 2021 as the economy nears full
employment. By 2021, the forecast expects 800,000 more jobs
than in June, a difference of only 0.5%. Due to the steady job
growth, we expect the unemployment rate to average 4.4% in
2017, down from 4.9% the year before. We expect the
unemployment rate to hold at 4.3% in from 2018 through 2021.
The continued strengthening of the labor market and
corresponding fall in the unemployment rate will create an
incentive for more and more marginally attached workers to
begin looking for a job. We expect the labor force participation
rate to be 61.5% in 2017. The labor force participation rate will
grow as the economy reaches full employment, reaching a peak
of 61.6% in 2019 and 2020. Going forward, the participation rate
will resume its long-term secular decline.
Disposable
personal income growth is
expected to increase next year
The outlook for employment is only minimally changed
Chapter 1 14
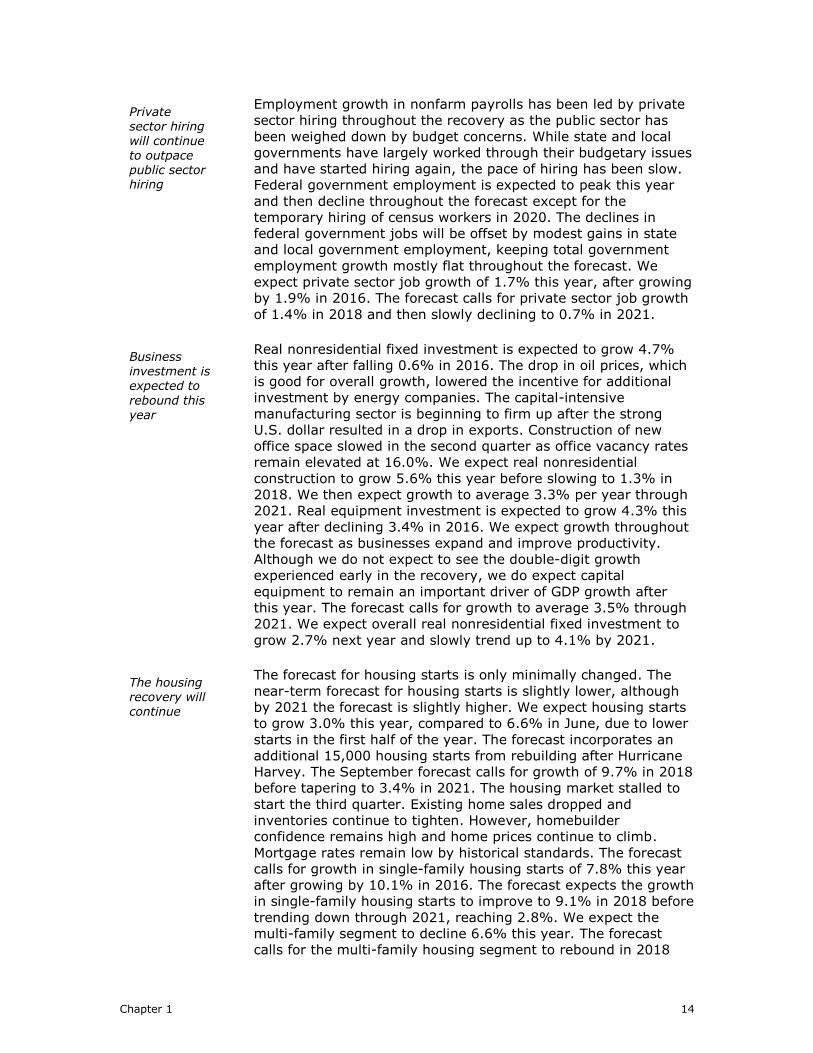
Employment growth in nonfarm payrolls has been led by private
sector hiring throughout the recovery as the public sector has
been weighed down by budget concerns. While state and local
governments have largely worked through their budgetary issues
and have started hiring again, the pace of hiring has been slow.
Federal government employment is expected to peak this year
and then decline throughout the forecast except for the
temporary hiring of census workers in 2020. The declines in
federal government jobs will be offset by modest gains in state
and local government employment, keeping total government
employment growth mostly flat throughout the forecast. We
expect private sector job growth of 1.7% this year, after growing
by 1.9% in 2016. The forecast calls for private sector job growth
of 1.4% in 2018 and then slowly declining to 0.7% in 2021.
Real nonresidential fixed investment is expected to grow 4.7%
this year after falling 0.6% in 2016. The drop in oil prices, which
is good for overall growth, lowered the incentive for additional
investment by energy companies. The capital-intensive
manufacturing sector is beginning to firm up after the strong
U.S. dollar resulted in a drop in exports. Construction of new
office space slowed in the second quarter as office vacancy rates
remain elevated at 16.0%. We expect real nonresidential
construction to grow 5.6% this year before slowing to 1.3% in
2018. We then expect growth to average 3.3% per year through
2021. Real equipment investment is expected to grow 4.3% this
year after declining 3.4% in 2016. We expect growth throughout
the forecast as businesses expand and improve productivity.
Although we do not expect to see the double-digit growth
experienced early in the recovery, we do expect capital
equipment to remain an important driver of GDP growth after
this year. The forecast calls for growth to average 3.5% through
2021. We expect overall real nonresidential fixed investment to
grow 2.7% next year and slowly trend up to 4.1% by 2021.
The forecast for housing starts is only minimally changed. The
near-term forecast for housing starts is slightly lower, although
by 2021 the forecast is slightly higher. We expect housing starts
to grow 3.0% this year, compared to 6.6% in June, due to lower
starts in the first half of the year. The forecast incorporates an
additional 15,000 housing starts from rebuilding after Hurricane
Harvey. The September forecast calls for growth of 9.7% in 2018
before tapering to 3.4% in 2021. The housing market stalled to
start the third quarter. Existing home sales dropped and
inventories continue to tighten. However, homebuilder
confidence remains high and home prices continue to climb.
Mortgage rates remain low by historical standards. The forecast
calls for growth in single-family housing starts of 7.8% this year
after growing by 10.1% in 2016. The forecast expects the growth
in single-family housing starts to improve to 9.1% in 2018 before
trending down through 2021, reaching 2.8%. We expect the
multi-family segment to decline 6.6% this year. The forecast
calls for the multi-family housing segment to rebound in 2018
Private sector hiring will continue to outpace public sector hiring
Business investment is expected to
rebound this year
The housing recovery will continue

Chapter 1 15
with 11.1% growth then average 6.0% growth through the
remainder of the forecast.
Major foreign economies are improving. The Canadian economy
grew 4.5% (SAAR) in the second quarter, the fastest since 2011.
Exports and household spending were the main contributors to
growth. The latest Blue Chip forecast expects growth of 2.7% in
Canada for 2017 and 2.1% in 2018. The Mexican economy
slowed in the second quarter to 2.5% (SAAR) from 2.7% (SAAR)
in the first quarter. The Blue Chip forecast called for 2.1%
growth this year followed by 2.3% growth in 2018. The recent
earthquake in Mexico City may hamper growth somewhat in the
near term. The recovery in the Eurozone is improving with real
GDP increasing 2.3% in the second quarter on an annual basis.
The latest Blue Chip forecast calls for 2.0% growth this year and
1.8% in 2018. China, which is the largest U.S. export market
outside of North America, continues to slow. Export demand for
Chinese goods has weakened and the Chinese have had difficulty
transitioning to a more domestic consumer driven economy.
Chinese GDP growth in 2016 was 6.7%, well below the 2005-11
average of 11%. The most recent Blue Chip forecast calls for
Chinese growth to slow further, with growth of 6.6% this year
and 6.1% in 2018. Japan’s economy expanded by 2.5% (SAAR)
in the second quarter, although this spike is not expected to last.
Japan’s long run potential GDP growth is roughly 0.7% due
primarily to demographics. The most recent Blue Chip forecast
expects slow growth of 1.7% this year followed by 1.1% in 2018.
Economic growth of major U.S. trading partners is expected to
accelerate this year. GDP growth of U.S. trading partners was
the weakest since the recession in 2016, growing just 2.1%. The
forecast calls for GDP of U.S. trading partners to grow 2.8% this
year, up from 2.6% in the June forecast (see Figure 1.6). The
September forecast now calls for GDP of U.S. trading partners to
Figure 1.6: GDP Growth of Major U.S. Trading Partners
Source: IHS Markit, September 2017 ERFC forecast; historical data through 2016
Foreign growth is improving
Economic
growth of U.S. trading partners is expected to improve
1.0
1.5
2.0
2.5
3.0
2015 2016 2017 2018 2019 2020 2021
Perc
ent
June September
GDP growth of U.S. trading
partners is expected to
be higher

Chapter 1 16
grow 2.7% in 2018 through 2020 and 2.8% in 2021. The dollar
has declined recently and the drag on exports has diminished.
Real U.S. exports are forecasted to grow 3.6% this year after
declining 0.3% in 2016. Export growth is forecasted to slowly
pick up throughout the forecast, reaching 3.8% in 2020 and
2021. Export growth is more than offset by increased imports in
the forecast. Net exports are expected to reduce GDP growth by
0.1 percentage points on average through 2021.
Since the November 2016 presidential election, no major policy
changes have been enacted. Potential fiscal policy changes are
still included in the outlook. While several proposals for
healthcare reform are being discussed, no legislation has passed,
so we have not incorporated any related changes to the forecast.
The forecast does include a $22 billion annual increase in
infrastructure spending beginning in 2018. The forecast includes
personal and corporate tax cuts as well as a boost from receipts
on overseas profits repatriated to face a 10% tax. Also included
in the forecast is $15 billion of additional spending for Hurricane
Harvey relief efforts.
The federal budget deficit is expected to decline this year to
$634 billion from $687 billion in 2016. However, we expect the
federal budget deficit to grow starting in 2018 and reach $900
billion in 2021. The forecast assumes the cuts in real defense
spending that started in 2011 will pause in 2017 and 2018
consistent with the administration’s policy preferences. The
forecast calls for real defense spending to grow 0.3% this year
and 1.6% in 2019. We then expect real defense spending to
decline through 2021. Real nondefense spending is expected to
decline throughout the forecast. State and local governments,
having worked through the majority of their budget difficulties,
will largely offset the decline in spending at the federal level. We
expect total real government spending to contract 0.1% this year
before averaging 0.4% growth through 2021.
The Federal Reserve is gradually tightening monetary policy after
years of measures aimed at supporting the economy. The
Federal Reserve is facing a more upbeat economic outlook but
also a more uncertain policy environment. As expected, the
Federal Open Market Committee announced they will start a
process to shrink its balance sheet. The forecast assumes one
more 25 basis point rate hike in mid-December. The Federal
Reserve is likely to focus more on strong jobs gains than
relatively weak wage gains and inflation.
Table 1.1 provides a fiscal year summary of the U.S. economic
indicators. For calendar year tables, see the appendix.
The Fed is gradually tightening monetary policy
The federal
budget deficit will increase after this year
The fiscal
policy outlook includes potential policy changes from
the new
administra-tion

Chapter 1 17
Risks to the Forecast
Our view of the risks to the forecast is unchanged since the June
forecast. The recovery is forecasted to be the longest on record.
The outlook for U.S. trading partners, although improving,
remains somewhat weak. The level of uncertainty in the baseline
remains elevated, and downside risks once again outweigh
upside risks.
Downside Risks
A breakdown in trade relations
Infrastructure spending assumed in the baseline fails to
materialize
Chinese economy experiences a “hard landing” (annual
growth under 5%); growth is weaker in emerging market
economies
Too aggressive tightening of monetary policy
Weaker than expected employment growth
Real wage growth stagnates, leading to slower consumer
spending
Slower household formation
Slowdown in economic growth and negative effects to
financial markets due to Brexit
Increasing geopolitical tensions negatively impact
consumer confidence
U.S. dollar appreciates against other currencies, limiting
exports
Weak global growth persists, further impacting exports
Failure to raise the debt ceiling and/or government shut
down
Upside Risks
Increased business confidence leads to more hiring
Increased consumer confidence gives a boost to
consumer spending
The housing sector improves faster than anticipated
Oil prices decline as OPEC fails to impact prices
Labor productivity growth returns to the higher rates seen
in 1995-2005
Employment growth expands faster than in the baseline
China successfully transitions to a more consumption
based economy
European and emerging market economies grow faster
than expected
The U.S. dollar declines, making U.S. exports cheaper
abroad
Wage growth picks up faster than expected.
Downside risks outweigh upside risks

Table 1.1 Fiscal Years
U.S. Economic Forecast Summary
Forecast 2018 to 2021
2014 2015 2016 2017 2018 2019 2020 2021
Real National Income Accounts (Billions of Chained 2009 Dollars)
Real Gross Domestic Product 15,782.2 16,292.7 16,577.6 16,890.7 17,292.9 17,684.9 18,033.1 18,400.7
% Ch 2.2 3.2 1.7 1.9 2.4 2.3 2.0 2.0
Real Consumption 10,688.5 11,082.1 11,413.0 11,733.2 12,029.7 12,313.7 12,589.4 12,861.9
% Ch 2.0 3.7 3.0 2.8 2.5 2.4 2.2 2.2
Real Nonresidential Fixed Investment 2,094.8 2,215.7 2,210.4 2,253.6 2,350.6 2,413.4 2,493.7 2,598.8
% Ch 5.1 5.8 -0.2 2.0 4.3 2.7 3.3 4.2
Real Residential Fixed Investment 494.6 529.4 580.2 592.6 611.4 632.2 644.4 673.7
% Ch 6.2 7.0 9.6 2.1 3.2 3.4 1.9 4.5
Real Personal Income 13,280.1 13,927.6 14,327.2 14,462.9 14,724.9 15,145.6 15,599.8 16,010.4
% Ch 1.2 4.9 2.9 0.9 1.8 2.9 3.0 2.6
Real Per Capita Income ($/Person) 41,760 43,478 44,417 44,532 45,002 45,918 46,922 47,782
% Ch 0.5 4.1 2.2 0.3 1.1 2.0 2.2 1.8
Price and Wage Indexes
U.S. Implicit Price Deflator, PCE (2009=1.0) 1.084 1.093 1.100 1.118 1.135 1.153 1.174 1.197
% Ch 1.4 0.9 0.7 1.6 1.6 1.6 1.8 1.9
U.S. Consumer Price Index (1982-84=1.0) 2.350 2.367 2.383 2.427 2.473 2.523 2.578 2.635
% Ch 1.6 0.7 0.7 1.9 1.9 2.0 2.2 2.2
Employment Cost Index (Dec. 2005=1.0) 1.193 1.221 1.248 1.278 1.314 1.355 1.400 1.448
% Ch 1.9 2.3 2.2 2.4 2.9 3.1 3.3 3.4
Current Dollar National Income (Billions of Dollars)
Gross Domestic Product 17,025.4 17,831.5 18,344.5 18,984.8 19,806.0 20,706.7 21,573.9 22,483.2
% Ch 3.9 4.7 2.9 3.5 4.3 4.5 4.2 4.2
Personal Income 14,393.2 15,222.7 15,764.0 16,165.7 16,713.1 17,468.4 18,320.1 19,163.1
% Ch 2.6 5.8 3.6 2.5 3.4 4.5 4.9 4.6
Employment (Millions)
U.S. Civilian Labor Force 155.5 156.6 158.0 159.8 161.1 162.7 164.4 165.7
Total U.S. Employment 145.0 147.7 150.1 152.3 154.2 155.8 157.3 158.6
Unemployment Rate (%) 6.77 5.68 4.98 4.66 4.29 4.27 4.28 4.28
Nonfarm Payroll Employment 137.56 140.42 143.09 145.43 147.41 149.05 150.31 151.34
% Ch 1.7 2.1 1.9 1.6 1.4 1.1 0.8 0.7
Manufacturing 12.09 12.28 12.35 12.36 12.54 12.75 12.99 13.17
% Ch 0.9 1.6 0.6 0.1 1.4 1.6 1.9 1.5
Durable Manufacturing 7.60 7.74 7.75 7.72 7.86 8.02 8.21 8.38
% Ch 1.1 1.9 0.1 -0.4 1.8 2.1 2.3 2.1
Nondurable Manufacturing 4.49 4.54 4.61 4.65 4.68 4.73 4.78 4.80
% Ch 0.5 1.0 1.5 0.9 0.8 0.9 1.2 0.3
Construction 5.99 6.31 6.61 6.80 6.97 7.15 7.41 7.65
% Ch 4.3 5.4 4.7 3.0 2.5 2.5 3.7 3.2
Service-Providing 118.61 120.96 123.40 125.59 127.17 128.39 129.15 129.74
% Ch 1.7 2.0 2.0 1.8 1.3 1.0 0.6 0.5
Miscellaneous Indicators
Oil-WTI ($ per barrel) 101.3 69.3 41.7 48.6 49.7 50.8 50.8 51.0
Personal Saving/Disposable Income (%) 5.3 6.0 5.8 4.0 3.5 4.2 4.7 4.7
Auto Sales (Millions) 7.6 7.7 7.2 6.5 5.9 5.7 5.8 5.8
% Ch 2.3 0.8 -5.9 -10.5 -8.7 -3.7 1.8 0.7
Housing Starts (Millions) 0.955 1.056 1.149 1.200 1.271 1.352 1.413 1.478
% Ch 8.9 10.5 8.9 4.5 5.9 6.3 4.5 4.6
Federal Budget Surplus (Billions) -612.4 -597.2 -649.4 -669.6 -694.2 -828.7 -883.7 -912.0
Net Exports (Billions) -490.7 -513.6 -519.7 -551.7 -515.0 -442.6 -418.6 -414.0
3-Month Treasury Bill Rate (%) 0.04 0.02 0.18 0.55 1.27 2.06 2.80 2.85
10-Year Treasury Note Yield (%) 2.71 2.23 2.02 2.10 2.68 3.54 4.04 3.97
Bond Index of 20 G.O. Munis. (%) 4.55 3.83 3.51 3.51 4.11 4.82 4.98 4.93
30-Year Fixed Mortgage Rate (%) 4.33 3.92 3.80 3.85 4.38 5.45 6.03 5.96
Chapter 1 18

Table 1.2
Forecast Analysis
Comparison of Forecasts for 2015-17
U.S.
Real GDP Implicit Price Deflator 3 Month T-Bill Rate Mortgage Rate
2012
September 2.9 1.9 2.17 5.92
November 2.9 1.6 2.56 6.08
2013
March 2.9 1.6 1.71 5.68
June 2.8 1.5 1.98 5.63
September 2.9 1.5 2.13 5.66
November 2.7 1.5 2.12 5.67
2014
February 2.7 1.3 2.13 5.75
June 2.8 1.4 2.13 5.78
September 2.8 1.5 1.96 5.59
November 2.8 1.6 1.72 5.48
2015
February 2.8 1.7 1.69 5.19
June 2.8 1.7 1.29 4.73
September 2.7 1.5 0.84 4.38
November 2.5 1.6 0.82 4.35
2016
February 2.2 1.1 0.56 4.09
June 2.0 1.5 0.43 3.91
September 1.8 1.4 0.36 3.76
November 1.8 1.3 0.32 3.72
2017
March 1.9 1.3 0.35 3.89
June 1.8 1.3 0.37 3.84
September 1.7 1.3 0.36 3.83
Average Annual Rate of Growth (Percent) Average Rate (Percent)
2015:2-2017:2 2015:3 to 2017:2
Chapter 1 19
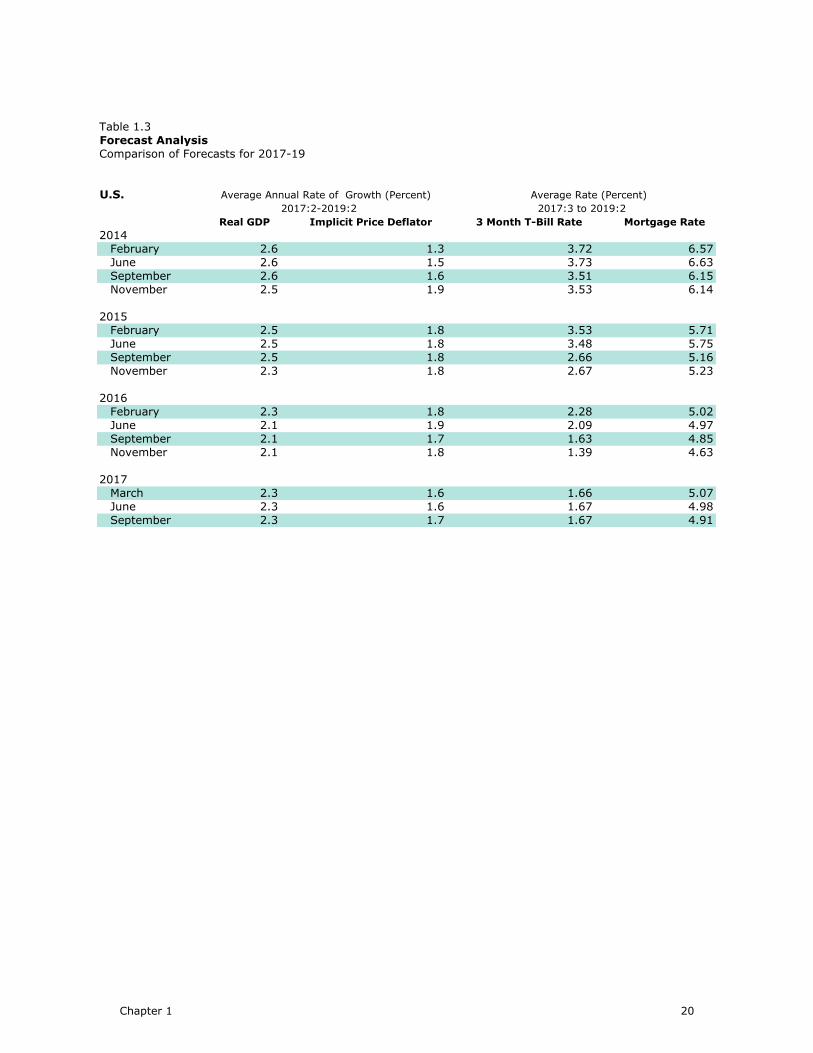
Table 1.3
Forecast Analysis
Comparison of Forecasts for 2017-19
U.S.
Real GDP Implicit Price Deflator 3 Month T-Bill Rate Mortgage Rate
2014
February 2.6 1.3 3.72 6.57
June 2.6 1.5 3.73 6.63
September 2.6 1.6 3.51 6.15
November 2.5 1.9 3.53 6.14
2015
February 2.5 1.8 3.53 5.71
June 2.5 1.8 3.48 5.75
September 2.5 1.8 2.66 5.16
November 2.3 1.8 2.67 5.23
2016
February 2.3 1.8 2.28 5.02
June 2.1 1.9 2.09 4.97
September 2.1 1.7 1.63 4.85
November 2.1 1.8 1.39 4.63
2017
March 2.3 1.6 1.66 5.07
June 2.3 1.6 1.67 4.98
September 2.3 1.7 1.67 4.91
Average Annual Rate of Growth (Percent) Average Rate (Percent)
2017:2-2019:2 2017:3 to 2019:2
Chapter 1 20
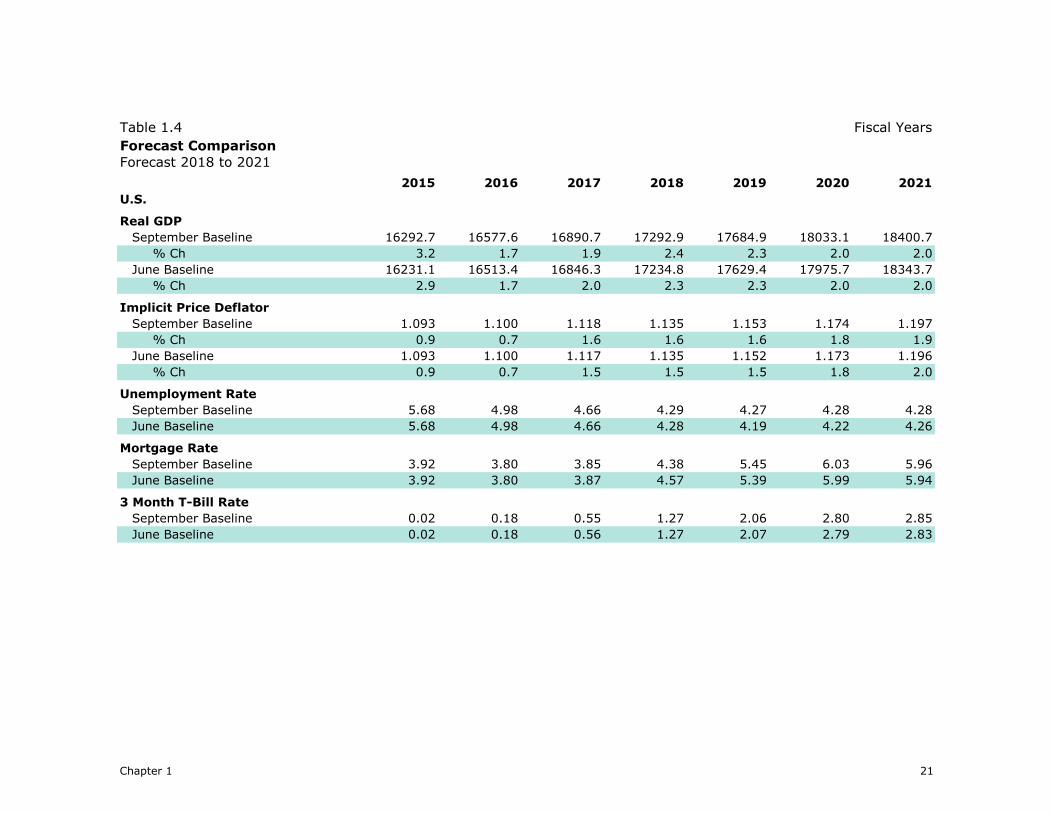
Table 1.4 Fiscal Years
Forecast Comparison
Forecast 2018 to 2021
2015 2016 2017 2018 2019 2020 2021
U.S.
Real GDP
September Baseline 16292.7 16577.6 16890.7 17292.9 17684.9 18033.1 18400.7
% Ch 3.2 1.7 1.9 2.4 2.3 2.0 2.0
June Baseline 16231.1 16513.4 16846.3 17234.8 17629.4 17975.7 18343.7
% Ch 2.9 1.7 2.0 2.3 2.3 2.0 2.0
Implicit Price Deflator
September Baseline 1.093 1.100 1.118 1.135 1.153 1.174 1.197
% Ch 0.9 0.7 1.6 1.6 1.6 1.8 1.9
June Baseline 1.093 1.100 1.117 1.135 1.152 1.173 1.196
% Ch 0.9 0.7 1.5 1.5 1.5 1.8 2.0
Unemployment Rate
September Baseline 5.68 4.98 4.66 4.29 4.27 4.28 4.28
June Baseline 5.68 4.98 4.66 4.28 4.19 4.22 4.26
Mortgage Rate
September Baseline 3.92 3.80 3.85 4.38 5.45 6.03 5.96
June Baseline 3.92 3.80 3.87 4.57 5.39 5.99 5.94
3 Month T-Bill Rate
September Baseline 0.02 0.18 0.55 1.27 2.06 2.80 2.85
June Baseline 0.02 0.18 0.56 1.27 2.07 2.79 2.83
Chapter 1 21

This page left intentionally blank.
Economic and Revenue Forecast Council 23
Chapter 2: Washington Economy – Current Conditions and Forecast
Washington employment has grown about as expected in the June forecast but historical employment was revised higher.
Historical Washington personal income was revised higher after the September forecast. We will reflect the personal income revision in the November forecast.
Seattle home prices continue to rise very rapidly and housing construction remains strong.
Exports are down because of transportation equipment and manufacturing
continues to struggle.
Seattle area consumer price inflation is well above the national average due to higher shelter cost inflation.
The September forecast for Washington State features higher employment and
personal income than in June.
As in June, we expect the Washington economy to continue to outperform the
U.S. economy.
Current Conditions
The Washington economy is expanding at a rapid pace. Recent
Washington employment and income have been revised higher
since the June forecast. Seattle home prices continue to rise very
rapidly and housing construction remains strong. Washington
exports continue to decline due to transportation equipment and
manufacturing continues to struggle. Seattle area consumer
price inflation is well above the national average due to higher
shelter cost inflation.
We have three months of new Washington employment data
since the June forecast was released. Total nonfarm payroll
employment rose 16,000 (seasonally adjusted) in June, July, and
August, which was the number expected in the June forecast.
Manufacturing lost only 400 jobs in the three-month period in
spite of the loss of 1,600 aerospace jobs. Construction
employment increased 900 in June, July, and August and
The Washington
economy is expanding at a rapid pace
Employment growth has been on target

Chapter 2 24
government employment expanded by 3,000 jobs. As usual, the
bulk of the net new jobs occurred in private, service-providing
sectors, which added 12,500 jobs.
We have also incorporated another quarter of benchmark
employment data from the Quarterly Census of Employment and
Wages (QCEW). The new QCEW data and other revisions raised
the estimated level of total employment in May 2017 by 16,700
jobs (0.5%). As a result of the upward revision to history (and
spot on growth), the total effect is 16,600 (0.5%), more jobs in
August 2017 than expected in the June forecast.
Washington’s unemployment rate inched up to 4.6% in August
from 4.5% in July. The August increase was not statistically
significant. July’s 4.5% unemployment rate was the lowest in the
series that extends back to 1976. A year ago, in August 2016,
the Washington unemployment rate stood at 5.4%.
Washington initial claims for unemployment insurance remain
near the post-recession low. The four-week moving average of
seasonally adjusted claims increased to 6,600 in the week ending
September 23, 2017 from 6,500 in the previous week. While the
current level of claims is slightly above the post-recession low of
6,000 reached in January, it is below the previous trough of
7,200 reached during the last expansion (see Figure 2.1). Claims
have fallen 60% since the peak in early 2009.
Figure 2.1: Washington Initial Claims
Source: Employment Security Department; data through September 23, 2017
Second quarter 2017 Washington exports were down 3.4% from
the second quarter of 2016 because of a 10.1% decline in
transportation equipment exports (mostly Boeing planes).
Exports of agricultural products increased 28.9% over the year
and exports of all other commodities rose 1.9% over the year.
This “other” category, which consists mainly of manufactured
Historical employment estimates were revised
higher
Washington UI claims remain near the post-recession low
Washington unemployment ticked up in
August
Claims are below the previous cyclical trough
4
6
8
10
12
14
16
18
2007 2009 2011 2013 2015 2017
Thousands
Exports are down
because of transportation equipment
Chapter 2 25
goods, has shown positive over-the-year growth for the last
three quarters.
Washington housing construction increased in the second quarter
of 2017 but fell slightly short of the forecast. The number of
housing units authorized by building permits increased to 43,900
units (SAAR) in the second quarter of 2017 from 40,800 units in
the first quarter. Second quarter permits were made up of
22,500 single-family units and 21,400 multi-family units. The
June forecast assumed 45,300 units (SAAR) in the second
quarter, consisting of 22,600 single-family units and 22,700
multi-family units. Washington housing construction in the third
quarter to date has been stronger than expected in the June
forecast. In July and August, 46,400 units (SAAR) were
permitted of which 23,700 were single family and 22,700 were
multi-family. The June forecast assumed an average rate of
43,800 units for the third quarter as a whole (SAAR) consisting
of 24,200 single-family units and 19,600 multi-family units.
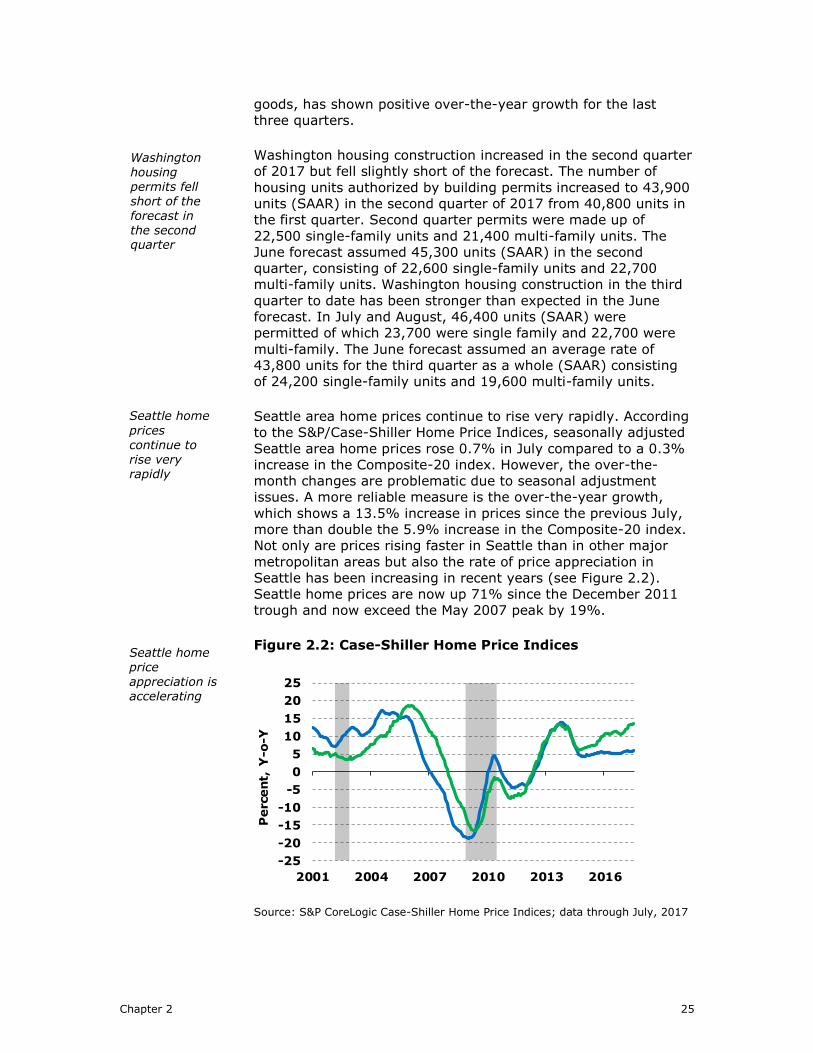
Seattle area home prices continue to rise very rapidly. According
to the S&P/Case-Shiller Home Price Indices, seasonally adjusted
Seattle area home prices rose 0.7% in July compared to a 0.3%
increase in the Composite-20 index. However, the over-the-
month changes are problematic due to seasonal adjustment
issues. A more reliable measure is the over-the-year growth,
which shows a 13.5% increase in prices since the previous July,
more than double the 5.9% increase in the Composite-20 index.
Not only are prices rising faster in Seattle than in other major
metropolitan areas but also the rate of price appreciation in
Seattle has been increasing in recent years (see Figure 2.2).
Seattle home prices are now up 71% since the December 2011
trough and now exceed the May 2007 peak by 19%.
Figure 2.2: Case-Shiller Home Price Indices
Source: S&P CoreLogic Case-Shiller Home Price Indices; data through July, 2017
Seattle home
prices continue to rise very rapidly
Washington housing permits fell short of the forecast in the second quarter
Seattle home price appreciation is accelerating
-25
-20
-15
-10
-5
0
5
10
15
20
25
2001 2004 2007 2010 2013 2016
Perc
ent,
Y-o
-Y

Chapter 2 26
The Institute of Supply Management - Western Washington
Index (ISM-WW) moved back into positive territory in August.
The index, which measures conditions in the manufacturing
sector, increased from 47.0 in in July to 58.2 in August (index
values above 50 indicate growth while values below 50 indicate
contraction). The index had been less than or equal to 50 in each
of the three previous months. The production, orders, and
inventory components indicated expansion in August but the
employment component indicated contraction. The vender
deliveries component was neutral at 50. Manufacturing has
fluctuated around the 50 mark since mid-2015.
Washington car and truck sales increased in July and August after
sinking to the lowest level in more than three years in June.
Seasonally adjusted new vehicle registrations increased 3.5% in
July and 8.6% in August to 308,100 units (SAAR). Car and truck
sales are up 0.4% over the year but down 8.0% since the post-
recession peak in January 2016.
After the September forecast was released, the U.S. Department
of Commerce, Bureau of Economic Analysis (BEA) released state
personal income estimates for the second quarter of 2017.
According to these estimates, Washington personal income rose
to $412.3 billion (SAAR) in the second quarter of 2017 from
$409.1 billion in the first quarter. The reported 3.2% growth rate
(SAAR) in Washington personal income was the 18th largest
among the states and District of Columbia and slightly exceeded
the 2.9% growth rate for the U.S. as a whole. Over the last year,
from the second quarter of 2016 to the second quarter of 2017,
Washington personal income grew 4.1% which was well above
the 2.9% for the nation and 3rd highest among the states and the
District of Columbia.
The September personal income release also incorporated the
impact of the annual revision to the national income and product
accounts. The revisions covered the period from 2014 through
the first quarter of 2017. The estimate for 2016 annual personal
income was revised up $7.9 billion (2.0%) compared to the June
BEA release. The increase in 2016 was mainly due to the
estimate for property income (dividends, interest, and rent),
which was revised up by $8.4 billion (see Figure 2.3). The
revision to property income was the result of newly available IRS
tabulations for 2015 and revised tabulations for 2014. We will
reflect the revised personal income data in the November 2017
forecast.
Washington
car and truck sales
increased in July and August
Manufacturing continues to struggle
The September personal income release
incorporated the annual revision to the national income and product
accounts
Washington personal income grew moderately in the second quarter of 2017

Chapter 2 27
Figure 2.3: Washington Personal Income Revision
Source: Bureau of Economic Analysis; data through 2016
Seattle area consumer price inflation remains above the national
average. Over the last year, from August 2016 to August 2017,
consumer prices in the Seattle area rose 2.5% compared to 1.9%
for the U.S. city average. Core prices, which exclude food and
energy, were up 2.2% in Seattle compared to 1.7% for the
nation. The higher Seattle inflation is due to more rapid growth in
shelter costs. During the year, shelter costs in Seattle rose 6.1%
compared to 3.3% for the nation. Excluding shelter, Seattle
inflation was below the national average at 0.5% compared to
1.2%.
Washington State Forecast
The September forecast for Washington State features higher
employment and income than in June. Washington employment
is expected to grow 2.9% this year, up from 2.4% in the June
forecast. We expect employment growth to average 1.6% per
year in 2018 through 2021, which is slightly higher than the
1.4% rate assumed in June. Our forecast for nominal personal
income growth this year is 5.8%, up from 4.7% in the June
forecast. Our new forecast for nominal personal income growth in
2018 through 2021 averages 5.1% per year which is the same
rate as expected in the June forecast. The September housing
construction forecast is very close to the forecast adopted in
June. We expect total housing units authorized by building
permits to decline 2.4% this year to 43,000 units compared to
43,300 in the June forecast. We expect permits to average
42,300 during the next four years compared to 42,100 in June.
We expect the all-items Seattle CPI to rise 2.9% this year, down
from 3.0% in the June forecast. As in June, we expect Seattle
area inflation to average 2.2% per year in 2018 through 2021.
Seattle area
consumer price inflation remains above the national average
Our September forecast for
Washington State features higher employment and income than in June
Historical Washington personal income was revised higher
-4
-2
0
2
4
6
8
10
2014 2015 2016
Billio
ns of
Dollars
Earnings Transfers Property

Chapter 2 28
Washington Payroll Employment
Washington employment growth in 2016 was 3.1%, which was
the highest rate since 1998. We expect the employment growth
rate to slow in the coming years as the economy approaches full
employment. Employment growth will also be constrained by
baby boomers leaving the work force, further reducing labor
force growth. Washington employment is expected to grow 2.9%
this year, up from 2.4% in the June forecast. As in June, we
expect growth to decelerate gradually as the recovery matures.
We expect employment growth to average 1.6% per year in 2018
through 2021, which is slightly higher than the 1.4% rate
assumed in June. On a calendar year basis, we expect 2.1%
employment growth in 2018, 1.6% in 2019, 1.4% growth in
2020, and 1.1% growth in 2021.
Boeing has indicated that their 2017 job cuts will be similar to
those experienced in 2016. In the current forecast, we assume a
decline of 6,700 aerospace jobs from December 2016 through
December 2017, which is slightly larger than the 6,100 decline
experienced during 2016. The September aerospace employment
forecast is about 200 higher than the June assumption from the
end of this year through 2021. On an annual average basis, we
expect aerospace employment to decline 7.9% in 2017, 4.4% in
2018, 2.0% in 2019, and 0.8% in 2020 with no change in 2021.
Software employment grew only 0.5% in 2015 after absorbing a
series of Microsoft layoffs during the latter part of 2014. Growth
rebounded to 5.2% in 2016. The September software
employment forecast is higher than in June because actual
employment in recent months has been higher than expected.
We now expect 4.4% growth this year on an annual average
basis compared to 3.3% in the June forecast. As in June, we
expect slower growth through the remainder of the forecast.
Software employment is expected to grow 0.9% in 2018, 0.7% in
2019, 0.8% in 2020, and 1.0% in 2021.
Washington electronic shopping and mail order employment
continues to exceed expectations. In Washington, this sector
consists almost entirely of electronic shopping employment. As of
August, year-over year-electronic shopping and mail order
employment grew by 11,700 jobs, a phenomenal 29.2% rate of
increase. The June forecast assumed 10,200 net new jobs over
the year. We continue to expect employment growth to slow in
this sector. The recent announcement by Amazon of a second
headquarters lends support to this view. Still, the forecast
expects employment growth of 28,900 jobs in the sector in
calendar 2017 through 2021. On an annual basis, electronic
shopping and mail order employment is expected to grow 30.4%
this year, 14.4% in 2018, 7.8% in 2019, 5.2% in 2020, and
3.8% in 2021.
The software employment
forecast is
higher
Washington employment growth will slow
The aerospace
forecast is virtually unchanged
Electronic shopping employment continues to exceed expectations
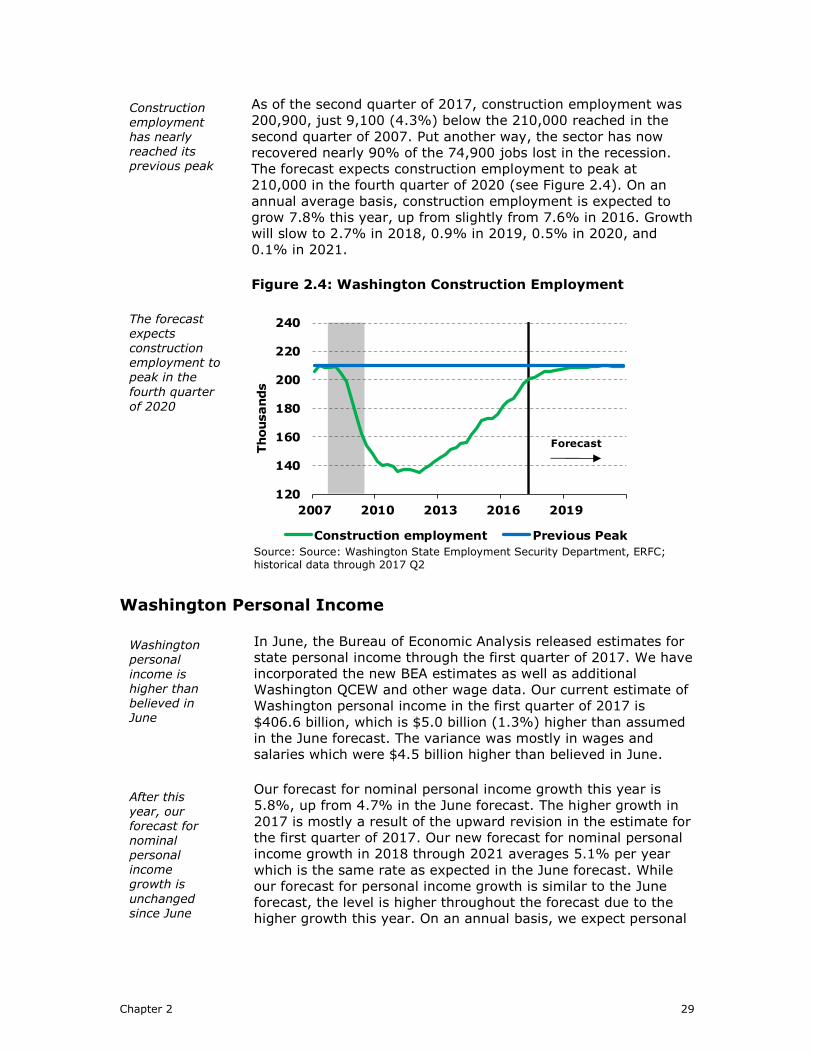
Chapter 2 29
As of the second quarter of 2017, construction employment was
200,900, just 9,100 (4.3%) below the 210,000 reached in the
second quarter of 2007. Put another way, the sector has now
recovered nearly 90% of the 74,900 jobs lost in the recession.
The forecast expects construction employment to peak at
210,000 in the fourth quarter of 2020 (see Figure 2.4). On an
annual average basis, construction employment is expected to
grow 7.8% this year, up from slightly from 7.6% in 2016. Growth
will slow to 2.7% in 2018, 0.9% in 2019, 0.5% in 2020, and
0.1% in 2021.
Figure 2.4: Washington Construction Employment
Source: Source: Washington State Employment Security Department, ERFC; historical data through 2017 Q2
Washington Personal Income
In June, the Bureau of Economic Analysis released estimates for
state personal income through the first quarter of 2017. We have
incorporated the new BEA estimates as well as additional
Washington QCEW and other wage data. Our current estimate of
Washington personal income in the first quarter of 2017 is
$406.6 billion, which is $5.0 billion (1.3%) higher than assumed
in the June forecast. The variance was mostly in wages and
salaries which were $4.5 billion higher than believed in June.
Our forecast for nominal personal income growth this year is
5.8%, up from 4.7% in the June forecast. The higher growth in
2017 is mostly a result of the upward revision in the estimate for
the first quarter of 2017. Our new forecast for nominal personal
income growth in 2018 through 2021 averages 5.1% per year
which is the same rate as expected in the June forecast. While
our forecast for personal income growth is similar to the June
forecast, the level is higher throughout the forecast due to the
higher growth this year. On an annual basis, we expect personal
Construction
employment has nearly reached its previous peak
Washington personal
income is higher than believed in June
After this
year, our forecast for nominal personal income growth is
unchanged since June
The forecast expects
construction employment to peak in the
fourth quarter
of 2020
120
140
160
180
200
220
240
2007 2010 2013 2016 2019
Thousands
Construction employment Previous Peak
Forecast

Chapter 2 30
income to grow 4.5% in 2018, 5.5% in 2019, 5.4% in 2020, and
5.0% in 2021.
Figure 2.5: Washington Personal Income
Source: Bureau of Economic Analysis, ERFC; historical data through 2016
Washington Building Permits
The housing recovery in Washington is essentially complete
although the composition of new housing will change in coming
years. Multi-family housing has recovered from a low of only
4,000 units in 2009 to 21,600 in 2016. We believe 2016 was the
peak in multi-family construction in this cycle and that permits
will decline to 15,700 by 2021. The recovery in single-family
construction has been less robust, from 13,000 units in 2009 to
22,500 in 2016. We expect single-family construction to continue
to strengthen with the number of units rising to 26,300 by 2021.
The September housing construction forecast is very close to the
forecast adopted in June. We expect total housing units
authorized by building permits to decline 2.4% this year to
43,000 units, rising 0.8% next year to 43,400 then declining
3.4% in 2019 to 41,900. We expect little change in the final two
year of the forecast with the number of units rising 0.5% in 2020
to 42,100 and declining 0.2% in 2021 to 42,000.
Seattle Consumer Price Index
Core inflation (excluding food and energy) in Seattle was 3.0% in
2016 while national core inflation was 2.2%. The reason for the
difference was shelter costs, which were rising much faster in
Seattle. Recent data show that shelter costs continue to rise
faster in Seattle than in the U.S. city average. We expect core
inflation in Seattle to moderate as shelter costs stabilize. Our
forecast for core Seattle inflation is 2.7% in 2017, 2.3% in 2018,
2.0% in 2019, and 2.2% per year in 2020 and 2021.
The housing recovery in Washington is essentially complete
Rents are driving Seattle core
inflation higher
The
Washington personal income forecast is higher than in June
0
100
200
300
400
500
600
2015 2016 2017 2018 2019 2020 2021
Billio
ns of
Dollars
June September

Chapter 2 31
After working to reduce overall inflation considerably in 2015 and
2016, energy costs are leveling off in the forecast. As a result,
they will not significantly affect headline inflation in the next few
years (see Figure 2.6). We expect the Seattle CPI to rise 2.9%
this year, 2.1% in 2018, 2.1% in 2019, and 2.3% in 2020 and
2021.
Figure 2.6: Seattle Consumer Price Inflation
Source: Bureau of Labor Statistics, ERFC; historical data through 2016
Table 2.1 provides a fiscal year summary of the state economic
indicators. For calendar year tables, see the appendix.
Alternative Scenarios
In accordance with state law, the Washington State Economic
and Revenue Forecast Council adopted a forecast based on
optimistic assumptions and a forecast based on pessimistic
assumptions.
Optimistic
In the optimistic scenario, the federal government provides a
boost to both the supply and demand sides of the economy. On
the supply side, a rollback of regulations and lower corporate
taxes result in greater capital spending. Stronger growth in
business fixed investment and an explosion of new technologies
lead to stronger productivity gains, bringing economic growth
above the baseline rate throughout the forecast period. Given the
strengthening outlook, both consumer and business confidence
improve and the stock market sees strong gains. On the demand
side, higher incomes combine with lower oil prices, inflation, and
interest rates to support robust consumer spending. Thanks to
increased household formation, solid income growth, and a
favorable financing environment, housing remains an engine of
growth. Meanwhile, economic conditions in the rest of the world
Alternative
forecasts are required by
law
In the
optimistic scenario, lower taxes and fewer
regulations boost growth
Declining
energy costs lowered inflation in 2015 and 2016
Energy costs will not significantly affect inflation in the forecast
0.0
0.5
1.0
1.5
2.0
2.5
3.0
3.5
2015 2016 2017 2018 2019 2020 2021
Perc
ent
Change
Headline Core

Chapter 2 32
improve with the help of structural reforms and quantitative-
easing programs.
In addition to reflecting the impact of the stronger U.S. forecast
on the state economy, the optimistic Washington forecast
assumes that aerospace employment declines less in 2017 then
gradually rises through 2021 rather than continuing to fall as in
the baseline. Software employment growth is also much stronger
than in the baseline forecast. In the optimistic scenario, the
stronger regional economy drives Seattle consumer price inflation
above the baseline. Washington average wage growth is also
higher in the optimistic scenario than in the baseline. Washington
population growth is higher in the optimistic scenario as the
strong local economy attracts migrants from other states. The
recovery in construction employment is much stronger than in
the baseline forecast with employment in the sector exceeding
the previous peak in the second quarter of 2018. By the end of
2021, Washington nonfarm payroll employment is higher by
140,500 jobs (3.9%) than in the baseline forecast and
Washington personal income is $56.2 billion (11.0%) higher.
Pessimistic
In the pessimistic scenario, the U.S. economy suffers from a
crisis of confidence, managing only feeble growth during the final
quarter of 2018 and first quarter of 2019, as consumers and
businesses react to an uncertain fiscal and monetary policy
environment with guarded and more risk-averse behavior. In this
scenario, the political and fiscal policy turmoil in Washington,
D.C. escalates. Congress and the president make no progress on
any major policy initiatives this year. There is no tax or
healthcare reform, and no fiscal stimulus. Even more routine
action, including the omnibus budget bill and increase in the debt
limit, is contentious and accomplished only at the last minute,
provoking anxiety and a wait-and-see attitude. Uncertainty
regarding future tax and healthcare policies causes business
confidence to deteriorate, affecting capital spending and hiring
plans. Consumers feel the pinch as well. With fewer job prospects
and weaker wage gains, they pull back on spending. The U.S.
economy manages growth of just 0.8% (annual rate) in the
fourth quarter of 2018 and the first quarter of 2019.
Unemployment climbs through 2019, reaching an eventual peak
of nearly 5.0%
In addition to reflecting the impact of the weaker U.S. forecast on
the state economy, aerospace employment declines much more
rapidly than assumed in the baseline forecast. Software
employment also declines rather than growing moderately as in
the baseline forecast. Population growth is also weaker than in
the baseline forecast as migration into Washington drops.
Construction employment peaks in early 2018 then declines
through 2021 rather than rising as in the baseline. The relatively
In the pessimistic scenario, a crisis of confidence
damages economic
growth
This scenario also assumes a weaker local economy
The optimistic scenario also assumes a
much stronger Washington economy

Chapter 2 33
weak local economy puts downward pressure on Washington
wages and the Seattle CPI. By the end of 2021, Washington
nonfarm payroll employment is 107,100 (3.0%) lower than in the
baseline forecast and Washington personal income is $27.2 billion
(5.3%) lower.
Table 2.2 compares the optimistic and pessimistic forecasts with
the baseline forecast.
Governor’s Council of Economic Advisors (GCEA)
In the GCEA scenario, the U.S. and state forecasts were adjusted
to match the average view of the Council members.
At the national level, the GCEA forecast for real GDP growth is
the same as the baseline forecast this year but slightly lower in
2018, 2019, 2020, and 2021. The GCEA forecast is 2.0% per
year over the five-year interval compared to 2.1% per year in the
baseline forecast. The GCEA forecast of real consumer spending
growth is similarly slightly lower than the baseline forecast.
However, the GCEA inflation forecast is a higher than the
baseline forecast at 1.9% compared to 1.8%, offsetting the lower
real growth. Consistent with their weaker real growth forecast,
the Council members’ mortgage rate forecast is generally lower
than the baseline forecast at 4.7% compared to 5.4% on
average. The GCEA oil price forecast is slightly lower than the
baseline forecast, averaging $54 in 2017 through 2021 compared
to $55 in the baseline forecast.
The GCEA scenario for Washington real personal income growth
averages 3.0% per year in 2017 through 2021 compared to the
baseline forecast of 3.4%. Their inflation forecast is higher,
however, so their nominal personal income forecast is closer to
ours at 5.0% versus 5.2%. At an average rate of 1.5% per year,
the Council members’ forecast for total employment growth over
the five-year period is also lower than the baseline forecast of
1.8% per year. The GCEA forecasts for manufacturing
employment and construction employment are both weaker than
in the baseline forecast. The Council members’ housing permit
forecast is slightly higher than ours is, averaging 43,200 units
per year through 2021 compared to 42,500 in the baseline
forecast. At the end of 2021, the GCEA forecast for Washington
nonfarm payroll employment is 50,900 (1.4%) lower than in the
baseline forecast and Washington personal income is $5.7 billion
(1.1%) lower.
Table 2.3 compares the GCEA forecast with the baseline forecast.
The GCEA members expect weaker Washington growth
The Governor’s Council of Economic
Advisors’ national forecast is slightly weaker than the baseline

Table 2.1 Fiscal Years
Washington Economic Forecast Summary
Forecast 2018 to 2021
2014 2015 2016 2017 2018 2019 2020 2021
Real Income (Billions of Chained 2009 Dollars)
Real Personal Income 316.623 333.926 345.403 358.784 369.825 382.883 396.898 409.677
% Ch 2.3 5.5 3.4 3.9 3.1 3.5 3.7 3.2
Real Wage and Salary Disb. 162.178 170.842 180.055 189.545 196.388 202.582 208.513 214.390
% Ch 3.5 5.3 5.4 5.3 3.6 3.2 2.9 2.8
Real Nonwage Income 154.446 163.084 165.349 169.238 173.437 180.301 188.385 195.287
% Ch 1.1 5.6 1.4 2.4 2.5 4.0 4.5 3.7
Real Per Capita Income ($/Person) 45,153 46,973 47,806 48,791 49,472 50,445 51,551 52,501
% Ch 1.2 4.0 1.8 2.1 1.4 2.0 2.2 1.8
Price and Wage Indexes
U.S. Implicit Price Deflator, PCE (2009=1.0) 1.084 1.093 1.100 1.118 1.135 1.153 1.174 1.197
% Ch 1.4 0.9 0.7 1.6 1.6 1.6 1.8 1.9
Seattle Cons. Price Index (1982-84=1.0) 2.437 2.473 2.521 2.589 2.648 2.705 2.766 2.830
% Ch 1.4 1.5 1.9 2.7 2.3 2.2 2.2 2.3
Average Nonfarm Annual Wage 55,988 57,971 59,790 62,179 63,892 65,750 67,942 70,354
% Ch 3.0 3.5 3.1 4.0 2.8 2.9 3.3 3.5
Avg. Hourly Earnings-Mfg. ($/Hour) 24.76 25.28 26.00 26.80 27.82 28.61 29.47 30.39
% Ch 2.3 2.1 2.8 3.1 3.8 2.8 3.0 3.1
Current Dollar Income (Billions of Dollars)
Personal Income 343.162 364.967 380.035 401.024 419.762 441.609 466.113 490.352
% Ch 3.8 6.4 4.1 5.5 4.7 5.2 5.5 5.2
Disposable Personal Income 302.066 320.192 333.065 351.442 368.631 388.405 408.397 427.621
% Ch 3.1 6.0 4.0 5.5 4.9 5.4 5.1 4.7
Per Capita Income ($/Person) 48,936 51,340 52,599 54,534 56,152 58,182 60,540 62,838
% Ch 2.6 4.9 2.5 3.7 3.0 3.6 4.1 3.8
Employment (Thousands)
Washington Civilian Labor Force 3,465.7 3,517.0 3,589.6 3,677.0 3,750.4 3,823.4 3,892.5 3,953.2
Total Washington Employment 3,240.7 3,313.2 3,388.8 3,492.6 3,583.3 3,656.1 3,722.9 3,782.2
Unemployment Rate (%) 6.49 5.80 5.59 5.02 4.46 4.37 4.36 4.33
Nonfarm Payroll Employment 3,017.1 3,102.5 3,193.2 3,290.0 3,371.6 3,435.5 3,485.6 3,528.5
% Ch 2.3 2.8 2.9 3.0 2.5 1.9 1.5 1.2
Manufacturing 287.5 290.5 292.3 286.4 284.5 288.5 292.8 296.8
% Ch 0.9 1.0 0.6 -2.0 -0.7 1.4 1.5 1.4
Durable Manufacturing 209.4 210.7 210.5 203.5 200.2 202.7 205.2 208.1
% Ch 0.4 0.6 -0.1 -3.3 -1.6 1.2 1.2 1.5
Aerospace 94.7 94.3 93.2 87.5 81.2 79.3 78.0 77.9
% Ch -1.7 -0.5 -1.2 -6.1 -7.2 -2.4 -1.6 -0.1
Nondurable Manufacturing 78.0 79.8 81.8 82.9 84.3 85.8 87.6 88.7
% Ch 2.3 2.2 2.6 1.4 1.7 1.8 2.1 1.2
Construction 153.7 168.0 178.8 194.4 204.4 207.4 208.7 209.8
% Ch 6.8 9.3 6.4 8.7 5.2 1.5 0.6 0.5
Service-Providing 2,569.7 2,637.7 2,715.8 2,803.1 2,876.6 2,933.3 2,977.7 3,015.5
% Ch 2.2 2.6 3.0 3.2 2.6 2.0 1.5 1.3
Software Publishers 55.0 55.5 57.2 60.3 61.9 62.1 62.6 63.2
% Ch 3.9 1.0 3.1 5.3 2.7 0.3 0.8 0.9
Nonfarm Payroll Employment, EOP* 3,037.8 3,137.3 3,234.2 3,327.1 3,398.0 3,456.2 3,507.6 3,542.8
% Ch* 2.2 3.3 3.1 2.9 2.1 1.7 1.5 1.0
Housing Indicators (Thousands)
Housing Units Authorized by Bldg. Permit 33.222 38.703 40.103 44.154 43.856 42.378 41.834 42.198
% Ch 6.5 16.5 3.6 10.1 -0.7 -3.4 -1.3 0.9
Single-Family 17.383 18.652 21.822 22.155 24.461 25.468 25.792 26.267
% Ch -6.3 7.3 17.0 1.5 10.4 4.1 1.3 1.8
Multi-Family 15.839 20.051 18.281 21.999 19.395 16.911 16.042 15.931
% Ch 25.2 26.6 -8.8 20.3 -11.8 -12.8 -5.1 -0.7
30-Year Fixed Mortgage Rate (%) 4.33 3.92 3.80 3.85 4.38 5.45 6.03 5.96
*End of Period, for use in the Budget Stabilization Account calculation
Chapter 2 34

Table 2.2 Fiscal Years
Comparison of Alternative Forecasts
2016 2017 2018 2019 2020 2021
U.S.
Real GDP, Percent Change
Optimistic 1.7 1.9 3.1 3.5 2.6 2.7Baseline 1.7 1.9 2.4 2.3 2.0 2.0Pessimistic 1.7 1.9 2.1 1.4 1.8 2.5
Implicit Price Deflator, Percent Change
Optimistic 0.7 1.6 1.3 1.5 2.0 2.2Baseline 0.7 1.6 1.6 1.6 1.8 1.9Pessimistic 0.7 1.6 1.3 1.5 2.0 2.2
Mortgage Rate, Percent
Optimistic 3.80 3.85 4.31 5.67 6.48 6.48Baseline 3.80 3.85 4.38 5.45 6.03 5.96
Pessimistic 3.80 3.85 4.32 4.82 4.91 5.41
3 Month T-Bill Rate, Percent
Optimistic 0.18 0.55 1.15 2.06 2.94 3.12Baseline 0.18 0.55 1.27 2.06 2.80 2.85Pessimistic 0.18 0.55 1.18 1.00 1.09 1.97
Washington
Real Personal Income, Percent Change
Optimistic 3.4 3.9 5.6 6.4 6.1 4.9Baseline 3.4 3.9 3.1 3.5 3.7 3.2
Pessimistic 3.4 3.9 1.8 2.1 1.9 2.6
Personal Income, Percent Change
Optimistic 4.1 5.5 7.0 8.1 8.2 7.1Baseline 4.1 5.5 4.7 5.2 5.5 5.2Pessimistic 4.1 5.5 3.1 3.6 3.9 4.8
Employment, Percent Change
Optimistic 2.9 3.0 3.1 2.8 2.3 2.1Baseline 2.9 3.0 2.5 1.9 1.5 1.2Pessimistic 2.9 3.0 2.0 1.0 0.5 0.8
Housing Permits, Thousands of Authorized Units
Optimistic 40.1 44.2 45.9 46.6 47.2 48.4Baseline 40.1 44.2 43.9 42.4 41.8 42.2Pessimistic 40.1 44.2 42.9 38.8 36.6 37.0
Chapter 2 35

Table 2.3 Calendar Years
Governor's Council of Economic Advisor's Forecast
2017 2018 2019 2020 2021U.S.Real GDPGrowth
ERFC 2.2 2.4 2.1 2.0 2.0 GCEA Average 2.2 2.2 2.0 1.9 1.9Real ConsumptionGrowth
ERFC 2.7 2.5 2.3 2.2 2.1 GCEA Average 2.6 2.2 2.0 2.1 2.0Implicit Price Deflator, PCEGrowth
ERFC 1.7 1.6 1.7 1.9 2.0 GCEA Average 1.8 1.9 2.0 2.0 2.0Mortgage RatePercent
ERFC 4.1 5.0 5.8 6.0 6.0 GCEA Average 4.0 4.4 4.7 5.0 5.4Oil Price (Brent)
Dollars per barrel
ERFC 53.1 54.7 54.8 55.1 55.5 GCEA Average 51.7 52.5 53.4 54.3 55.8
Washington StateReal Personal IncomeGrowth
ERFC 4.1 2.9 3.7 3.5 3.0 GCEA Average 3.7 2.9 3.0 2.7 2.7
Wage and Salary Employment
Growth
ERFC 2.9 2.1 1.6 1.4 1.1 GCEA Average 2.6 1.7 1.2 1.0 1.1Manufacturing EmploymentGrowth
ERFC -1.8 0.6 1.5 1.4 1.2 GCEA Average -1.9 -0.8 0.0 0.3 0.6Construction EmploymentGrowth
ERFC 7.8 2.7 0.9 0.5 0.1 GCEA Average 5.1 2.0 1.1 0.5 -0.2Housing PermitsThousands of authorized units
ERFC 43.0 43.4 41.9 42.1 42.0 GCEA Average 43.1 43.2 42.8 43.7 43.5
Washington Average Annual Wage
Growth
ERFC 4.4 2.1 3.2 3.4 3.7 GCEA Average 3.8 2.9 3.3 3.3 3.4
Chapter 2 36

Table 2.4
Forecast Analysis
Comparison of Forecasts for 2015-17
Washington Average Annual Rate (Thousands)
2015:3 to 2017:2
Employment Personal Income Real Personal Income Housing Units Authorized
2012
September 1.7 5.1 3.1 38.5
November 1.7 4.9 3.2 38.4
2013
March 1.7 5.1 3.5 41.6
June 1.7 5.0 3.5 42.2
September 1.6 5.1 3.5 40.6
November 1.7 5.1 3.6 40.6
2014
February 1.8 5.2 3.9 40.8
June 1.7 5.7 4.3 40.5
September 1.7 5.9 4.3 40.4
November 1.8 6.1 4.4 38.8
2015
February 2.0 6.1 4.2 38.8
June 1.8 5.5 3.7 40.2
September 1.8 5.2 3.6 39.1
November 1.6 4.8 3.2 39.2
2016
February 1.6 4.3 3.1 38.6
June 2.0 4.2 2.7 40.3
September 2.3 4.4 3.0 40.4
November 2.5 4.4 3.1 39.5
2017
March 2.7 4.7 3.3 41.4
June 2.7 4.3 3.0 42.3
September 3.0 5.1 3.7 42.1
Average Annual Rate of Growth (Percent)
2015:2-2017:2
Chapter 2 37

Table 2.5
Forecast Analysis
Comparison of Forecasts for 2017-19
Washington Average Annual Rate (Thousands)
2017:3 to 2019:2
Employment Personal Income Real Personal Income Housing Units Authorized
2014
February 1.3 4.9 3.5 42.5
June 1.2 5.3 3.8 43.0
September 1.3 5.4 3.8 43.1
November 1.1 5.5 3.6 43.2
2015
March 1.3 5.4 3.6 43.1
June 1.4 5.6 3.8 44.2
September 1.3 5.4 3.6 43.9
November 1.4 5.4 3.5 44.0
2016
February 1.2 5.0 3.2 43.3
June 1.2 5.1 3.2 43.7
September 1.4 5.1 3.3 43.8
November 1.5 5.1 3.2 41.0
2017
March 1.7 5.3 3.6 41.0
June 1.6 5.2 3.6 42.7
September 1.9 4.8 3.1 43.1
Average Annual Rate of Growth (Percent)
2017:2-2019:2
Chapter 2 38

Table 2.6 Fiscal Years
Forecast Comparison
Forecast 2018 to 2021
2015 2016 2017 2018 2019 2020 2021
Washington
Real Personal Income
September Baseline 333.926 345.403 358.784 369.825 382.883 396.898 409.677
% Ch 5.5 3.4 3.9 3.1 3.5 3.7 3.2
June Baseline 333.849 345.727 355.999 367.967 381.078 394.023 405.581
% Ch 5.4 3.6 3.0 3.4 3.6 3.4 2.9
Personal Income
September Baseline 364.967 380.035 401.024 419.762 441.609 466.113 490.352
% Ch 6.4 4.1 5.5 4.7 5.2 5.5 5.2
June Baseline 364.967 380.443 397.772 417.495 439.057 462.220 485.297
% Ch 6.4 4.2 4.6 5.0 5.2 5.3 5.0
Employment
September Baseline 3102.5 3193.2 3290.0 3371.6 3435.5 3485.6 3528.5
% Ch 2.8 2.9 3.0 2.5 1.9 1.5 1.2
June Baseline 3102.5 3193.2 3283.2 3348.6 3402.2 3450.5 3492.5
% Ch 2.8 2.9 2.8 2.0 1.6 1.4 1.2
Housing Permits
September Baseline 38.703 40.103 44.154 43.856 42.378 41.834 42.198
% Ch 16.5 3.6 10.1 -0.7 -3.4 -1.3 0.9
June Baseline 38.703 40.103 44.511 43.338 42.020 41.950 42.021
% Ch 16.5 3.6 11.0 -2.6 -3.0 -0.2 0.2
Chapter 2 39

(Percent change)
Total nonfarm payroll employment Manufacturing employment
Source: WA State Employment Security Dept. 2016, ERFC 2021 Source: WA State Employment Security Dept. 2016, ERFC 2021
Durable manufacturing employment Nondurable manufacturing employment
Source: WA State Employment Security Dept. 2016, ERFC 2021 Source: WA State Employment Security Dept. 2016, ERFC 2021
Figure 2.7: Comparison of Washington and U.S. Economic Forecasts
Forecast
-2.0
-1.0
0.0
1.0
2.0
3.0
4.0
2010 2012 2014 2016 2018 2020
Washington U.S.
-4.0
-3.0
-2.0
-1.0
0.0
1.0
2.0
3.0
4.0
5.0
2010 2012 2014 2016 2018 2020
-4.0
-2.0
0.0
2.0
4.0
6.0
8.0
2010 2012 2014 2016 2018 2020
-3.0
-2.0
-1.0
0.0
1.0
2.0
3.0
2010 2012 2014 2016 2018 2020
Chapter 2 40

(Percent change)
Construction employment Information employment
Source: WA State Employment Security Dept. 2016, ERFC 2021 Source: WA State Employment Security Dept. 2016, ERFC 2021
Other private employment Government employment
Source: WA State Employment Security Dept. 2016, ERFC 2021 Source: WA State Employment Security Dept. 2016, ERFC 2021
Figure 2.7: Comparison of Washington and U.S. Economic Forecasts (continued)
Forecast
Washington U.S.
-15.0
-10.0
-5.0
0.0
5.0
10.0
2010 2012 2014 2016 2018 2020
-4.0
-2.0
0.0
2.0
4.0
6.0
8.0
2010 2012 2014 2016 2018 2020
-1.0
0.0
1.0
2.0
3.0
4.0
2010 2012 2014 2016 2018 2020
-2.0
-1.0
0.0
1.0
2.0
3.0
2010 2012 2014 2016 2018 2020
Chapter 2 41

(Percent change)
Real personal income Consumer price indices
Source: Bureau of Economic Analysis 2015, ERFC 2021 Source: Bureau of Labor Statistics 2016, ERFC 2021
Population New Housing Units Per 1,000 population (level)
Source: Office of Financial Management/Census Bureau 2016, ERFC 2021 Source: Census Bureau 2016, ERFC 2021
Figure 2.7: Comparison of Washington and U.S. Economic Forecasts (continued)
Forecast
Washington U.S.
-1.0
0.0
1.0
2.0
3.0
4.0
5.0
6.0
7.0
2010 2012 2014 2016 2018 2020
0.5
0.7
0.9
1.1
1.3
1.5
1.7
1.9
2010 2012 2014 2016 2018 2020
0
1
2
3
4
5
6
7
2010 2012 2014 2016 2018 2020
0.0
0.5
1.0
1.5
2.0
2.5
3.0
3.5
2010 2012 2014 2016 2018 2020
Chapter 2 42

Real GDP, billions of chained 2009 dollars Implicit price deflator, index 2009 = 1.0
Source: Bureau of Economic Analysis 2017 Q2, ERFC 2021 Source: Bureau of Economic Analysis 2017 Q2, ERFC 2021
Mortgage rate, percent Three month T-bill rate, percent
Source: Freddie Mac 2017 Q2, ERFC 2021 Source: Federal Reserve Board 2017 Q2, ERFC 2021
Figure 2.8: Comparison of Alternative U.S. Economic Forecasts
Forecast
15,000
15,500
16,000
16,500
17,000
17,500
18,000
18,500
19,000
19,500
20,000
2014 2015 2016 2017 2018 2019 2020 2021
Baseline Optimistic Pessimistic
1.05
1.10
1.15
1.20
1.25
2014 2015 2016 2017 2018 2019 2020 2021
3.00
3.50
4.00
4.50
5.00
5.50
6.00
6.50
7.00
2014 2015 2016 2017 2018 2019 2020 2021
0.00
1.00
2.00
3.00
4.00
2014 2015 2016 2017 2018 2019 2020 2021
Chapter 2 43

Personal income, billions of dollars Real personal income, billions of chained 2009 dollars
Source: Bureau of Economic Analysis 2015 Q4, ERFC 2021 Source: Bureau of Economic Analysis 2015 Q4, ERFC 2021
Total nonfarm payroll employment, thousands Housing permits, thousands
Source: WA State Employment Security 2017 Q2, ERFC 2021 Source: Census Bureau 2017 Q2, ERFC 2021
Figure 2.9: Comparison of Alternative Washington Economic Forecasts
Forecast
300
325
350
375
400
425
450
475
500
525
550
575
600
2014 2015 2016 2017 2018 2019 2020 2021
Baseline Optimistic Pessimistic
2,900
3,000
3,100
3,200
3,300
3,400
3,500
3,600
3,700
2014 2015 2016 2017 2018 2019 2020 2021
295
310
325
340
355
370
385
400
415
430
445
460
475
2014 2015 2016 2017 2018 2019 2020 2021
20
30
40
50
60
2014 2015 2016 2017 2018 2019 2020 2021
Chapter 2 44

Economic and Revenue Forecast Council 45
Chapter 3: Washington State Revenue Forecast Summary
Revenue collections since the June 2017 forecast have come in $94 million over the forecasted amount.
The September forecast includes large increases in expected General Fund-State (GF-S) revenue from legislative changes. These new laws, intended to provide full state funding of basic education as required by the State Supreme Court’s
McCleary decision, add $2.1 billion to forecasted revenue in the 2017-19 biennium and $3.3 billion in the 2019-21 biennium.
Forecast increases from changes to the economic forecast were relatively small. Projected higher employment and personal income brought increases of $279 million in the 2017-19 biennium and $243 million in the 2019-21 biennium.
The preliminary estimate of GF-S revenue for the 2015-17 biennium is $3 million higher than forecasted in June.
The total forecast increase for the 2017-19 biennium was $2.4 billion and the
increase for the 2019-21 biennium was $3.5 billion.
Overview
Due to a surplus in revenue collections since the June forecast
and a slightly stronger state economic forecast, collections
excluding non-economic forecast changes are expected to
increase moderately. These increases, however, are greatly
outweighed by changes stemming from legislation passed in the
special legislative sessions subsequent to the June forecast.
These changes, enacted in response to a State Supreme Court
decision that found the state was inadequately funding basic
education, are expected to add over $5 billion in new revenue
over current and following biennia.
Table 3.1 summarizes the changes to the forecasts of GF-S
revenue for the 2015-17 through 2019-21 biennia. For the 2015-
17 biennium, which ended on June 30, 2017, collections from
revenue sources that are tracked monthly came in $7.3 million
higher than forecasted in June. A legislative change (an increase
in one transfer of funds out of the GF-S) subtracted $0.4 million.
The preliminary estimate of total revenue from other sources
was $4.0 million lower than forecasted, leading to a $2.9 million
The revenue forecast includes large increases due to legislative changes
GF-S forecast
change by biennium (millions): 15-17: +$3 17-19: +$2,359 19-21: +$3,521

Chapter 3 46
total change in estimated revenue for the biennium. For the
current biennium, revenue sources that are tracked monthly
came in $87.0 million higher than forecasted in June. Legislative
changes added $2,079.1 million. Changes to the economic
forecast resulted in a $192.5 million increase to projected
collections for the rest of the biennium. The total of these
components was a $2,358.6 million increase in projected
revenue for the current 2017-19 biennium. The forecast for the
2019-21 biennium has been increased by $3,521.3 million, with
a $3,278.4 million increase in forecasted revenue from legislative
changes and $242.8 million increase from economic factors. GF-
S revenue is now forecasted to total $38,311.3 million in the
2015-17 biennium, $43,261.7 million in the 2017-19 biennium,
and $47,396.4 million in the 2019-21 biennium.
Table 3.1: Revisions to the General Fund-State Forecast
(cash basis, millions of dollars)
2015-17 2017-19 2019-21
Biennium Biennium Biennium
Collection Experience $7.3 $87.0 NA
Non-Economic Change ($0.4) $2,079.1 $3,278.4
Forecast Change ($4.0) $192.5 $242.8
Total Change $2.9 $2,358.6 $3,521.3
As can be seen in Figure 3.1, the ratio of GF-S revenue collected
relative to state personal income has been increasing for two
years and is forecasted to increase for two more years. The ratio
of revenue to income has been on a downward trend since 1995,
broken only by the housing boom that raised the ratio from 2005
to mid-2008, and by temporary taxes and transfers of funds
from non-GF-S sources into the GF-S that again boosted the
ratio in fiscal years 2011 and 2013. The ratio increased slightly in
FY 2014 due to low income growth and then decreased slightly in
FY 2015. The ratio then increased in FY 2016 and 2017, largely
due to revenue increases stemming from legislative changes.
The newest legislative changes are expected to further boost the
ratio through FY 2019, after which it is expected to continue its
downward trend. Despite the increases, the ratio of revenue to
income in FY 2019 will still be below that of any fiscal year on
record prior to FY 2008.
GF-S forecast ($millions): 2015-17: $38,311 2017-19:
$43,262 2019-21: $47,396
Though the ratio of
collections to income is
expected to increase for several years, it will still be near historical lows

Chapter 3 47
Figure 3.1: GF-S Revenue (Current Definition) as a
Percentage of State Personal Income (Fiscal Years)
Source: ERFC, data through fiscal year 2017
The history of nominal and real GF-S revenue by biennium can
be found in Table 3.3. GF-S forecast changes by agency and
major revenue classification for the 2015-17 biennium can be
found in Table 3.5 (cash) and Table 3.6 (GAAP). Forecast
changes for the 2017-19 biennium can be found in Table 3.7
(cash) and Table 3.8 (GAAP). The GF-S forecast by fiscal year
and major source category through FY 2019 can be found in
Table 3.9.
Recent Collection Experience
Revenue collections from the Department of Revenue (DOR),
Department of Licensing, and Administrative Office of the Courts
are tracked monthly. In the period since the June 2017 forecast,
total revenue from the above sources came in $94.3 million
(2.1%) higher than expected (see Table 3.2). Revenue Act
collections reported by the DOR were $66.2 million (1.7%) above
the forecast. Revenue from other DOR tax sources was $26.6
million (3.8%) above the forecast.
Most of the positive variance in non-Revenue Act collections was
due to real estate excise taxes (REET) which came in $23.3
million (8.2%) higher than forecasted. Cigarette tax receipts
came in $6.0 million (5.9%) higher than forecasted and liquor
sales and liter tax receipts came in $0.3 million (0.4%) higher
than forecasted. Property tax receipts came in $1.4 million
(0.7%) higher than forecasted. Net refunds of unclaimed
property out of the GF-S were $4.5 million higher than
forecasted. All other DOR revenue sources came in $0.1 million
(0.2%) higher than forecasted. Revenue from the Administrative
Office of the Courts was $1.6 million (9.1%) higher than
forecasted.
4.5%
5.0%
5.5%
6.0%
6.5%
7.0%
7.5%
1960 1967 1974 1981 1988 1995 2002 2009 2016
Collections were $94 million
(2.1%) more than the June 2017 forecast
Forecast details are at the end of the chapter
GF-S revenue relative to state personal income has been on a
declining trend since 1995
Much of the
forecast variance was
due to real estate excise taxes

Chapter 3 48
Table 3.2: Pre-Forecast Collection Variance of Major
General Fund-State Taxes by Agency (relative to the June
2017 forecast, cash basis, millions of dollars)
Figure 3.2 shows seasonally adjusted Revenue Act receipts
excluding payments received under the tax amnesty program in
early 2011 and other large payments. It is also adjusted for
some changes in payment patterns. As shown in the figure,
collections have been on an upward trend since November 2009.
Growth was aided by a temporary increase in the business and
occupation tax rate paid by service industries that took effect in
May 2010. This temporary increase expired on July 1, 2013. As
can be seen in the figure, despite large swings in monthly
collections the three-month moving average continues on an
upward trend. Collections grew 5.8% year over year in the
August 11 – September 10 collections period after 5.6% growth
in the previous period. Growth on a quarterly basis shows
Figure 3.2: Revenue Act Collections*
600
700
800
900
1,000
1,100
1,200
1,300
2004 2006 2008 2010 2012 2014 2016
$Millions, SA
Revenue Act Revenue 3-Month Moving Average
Collection Percent of
Agency/Source Variance Estimate
Department of Revenue
Revenue Act $66.2 1.7%
Non-Revenue Act $26.6 3.8%
Subtotal $92.8 2.1%
Administrative Office of the Courts $1.6 9.1%
Total* $94.3 2.1% * Detail may not add to total due to rounding. Source: ERFC; Period: June 11 - September 10, 2017
Source: ERFC; Data through September 10, 2017 preliminary allocation *Adjusted for large payments/refunds and payment pattern change
Year-over-year growth in adjusted
Revenue Act collections has slowed in recent
months
Adjusted Revenue Act collections
were up 5.8% year over year in the most recent collection period and
up 5.6% in the previous
period
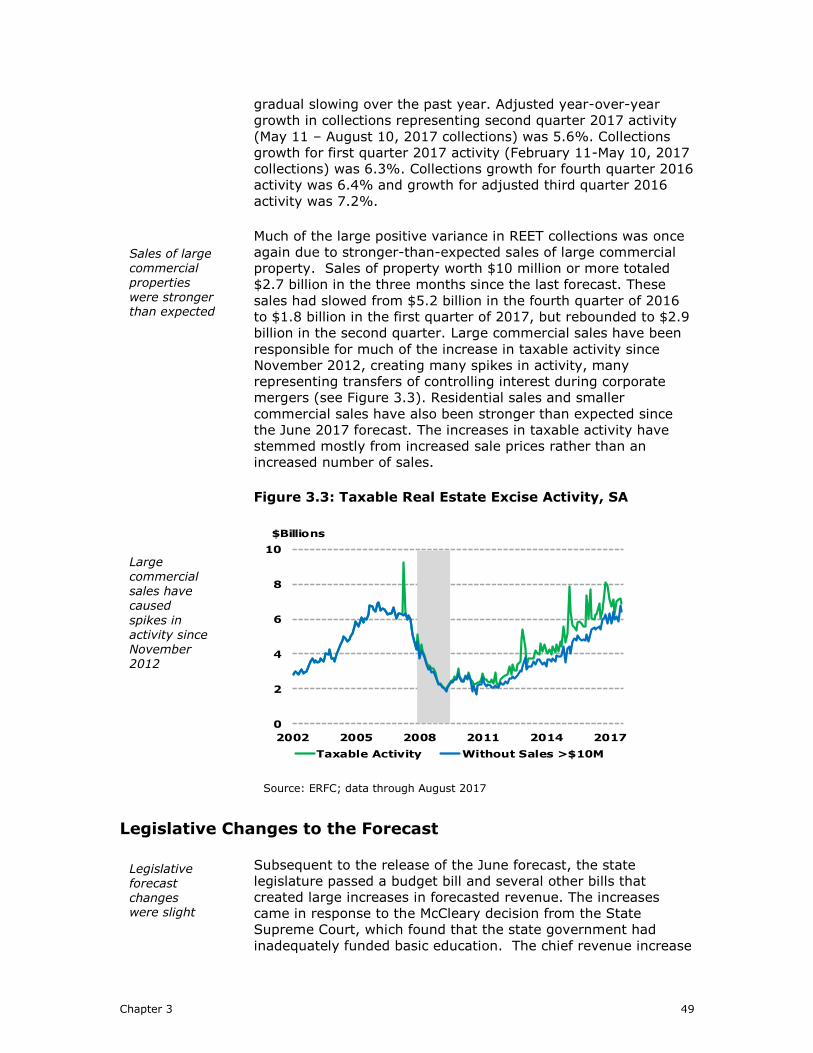
Chapter 3 49
gradual slowing over the past year. Adjusted year-over-year
growth in collections representing second quarter 2017 activity
(May 11 – August 10, 2017 collections) was 5.6%. Collections
growth for first quarter 2017 activity (February 11-May 10, 2017
collections) was 6.3%. Collections growth for fourth quarter 2016
activity was 6.4% and growth for adjusted third quarter 2016
activity was 7.2%.
Much of the large positive variance in REET collections was once
again due to stronger-than-expected sales of large commercial
property. Sales of property worth $10 million or more totaled
$2.7 billion in the three months since the last forecast. These
sales had slowed from $5.2 billion in the fourth quarter of 2016
to $1.8 billion in the first quarter of 2017, but rebounded to $2.9
billion in the second quarter. Large commercial sales have been
responsible for much of the increase in taxable activity since
November 2012, creating many spikes in activity, many
representing transfers of controlling interest during corporate
mergers (see Figure 3.3). Residential sales and smaller
commercial sales have also been stronger than expected since
the June 2017 forecast. The increases in taxable activity have
stemmed mostly from increased sale prices rather than an
increased number of sales.
Figure 3.3: Taxable Real Estate Excise Activity, SA
Source: ERFC; data through August 2017
Legislative Changes to the Forecast
Subsequent to the release of the June forecast, the state
legislature passed a budget bill and several other bills that
created large increases in forecasted revenue. The increases
came in response to the McCleary decision from the State
Supreme Court, which found that the state government had
inadequately funded basic education. The chief revenue increase
0
2
4
6
8
10
2002 2005 2008 2011 2014 2017
$Billions
Taxable Activity Without Sales >$10M
Legislative forecast changes were slight
Sales of large commercial properties were stronger than expected
Large
commercial sales have caused
spikes in activity since November 2012

Chapter 3 50
from these bills was an increase in the state’s property tax levy,
which will replace some revenue from local levies. The increased
levy, which will be in effect on January 1, 2018, is expected to
raise $1.6 billion in the current biennium and $2.5 billion in the
2019-21 biennium. The second largest source of expected
revenue is an expansion of the number of online sellers that are
expected to collect retail sales tax. This change is estimated to
bring in $341 million in the current biennium and $696 million in
the 2019-21 biennium. The third largest legislative revenue
increase is a repeal of the exemption of most sales of bottled
water from retail sales tax, which is expected to bring in $54.6
million in the current biennium and $62.3 million in the 2019-21
biennium. A summary of the legislative and budget-driven
revenue changes to the forecast can be found in Table 3.19.
Revenue Forecasts by Source
Department of Revenue
The Department of Revenue (DOR) collects and administers the
majority of Washington’s GF-S revenue, accounting for 95% of
total GF-S revenue in FY 2016. The largest tax sources
administered by the DOR are the retail sales tax, business and
occupation tax, property tax, use tax, cigarette tax and real
estate excise tax. The revenue forecasts discussed below can be
found in Tables 3.5-3.8.
The retail sales tax is the largest source of GF-S revenue,
accounting for 47.9% of GF-S revenue in FY 2017. The state’s
share of the tax is 6.5% of the sales price. While construction
labor, repair services, and some other services are taxed, the tax
does not apply to most services. Taxable sales as a share of
personal income have been declining. Their share fell sharply
during the recession and continued to fall through FY 2012. In
that year, 34.1% of personal income was spent on taxable items
and services, the lowest percentage on record. Increased
spending on construction and autos, along with legislative
changes to services and companies deemed taxable, caused the
share to grow through FY 2017, reaching 37.4% of personal
income. Legislation passed since the June 2017 forecast that
extends the tax to bottled water and certain online sales is
forecasted to cause the share to continue to increase through FY
2019. From FY 2019 on, however, the additional revenue will not
grow as quickly as personal income, causing the ratio of sales to
income to continue its downward trend. The historical and
forecasted relationship between taxable sales and income is
illustrated in Figure 3.4.
Taxes collected by DOR are
most of GF-S taxes
Retail sales
taxes are the largest source of GF-S revenue

Chapter 3 51
Figure 3.4: Taxable Sales* as Percentage of State
Personal Income
*Past tax base adjusted to represent current base. Shaded area indicates forecast Source: ERFC; Data through FY 2016, forecast through FY 2021
Strong growth in construction and auto sales brought taxable
retail sales growth of 8.1% in FY 2015. Legislative changes
coupled with continued growth in construction and auto sales
boosted growth in FY 2016 taxable activity to 8.4%. Slowing
construction growth and flat auto sales lowered growth in FY
2017 activity to 6.3%. Forecasted growth then slows to 5.0% in
FY 2018 due to a large slowdown in auto sales growth. Growth
then increases to 5.9% in FY 2019 as auto sales growth
increases slightly and the legislative extension of the tax onto
online sales nears its full reach. Growth then declines to 4.3% in
FY 2020 and 3.9% in FY 2021 (see Table 3.4) as auto sales,
construction and online sales growth settles down to lower
levels. Due to the lag between taxable activity and collections
and the presence of tax deferrals, credits, refunds, and
payments of past due taxes, the growth in actual collections
differs from the growth in taxable activity. Growth in collections
for FY 2016 was 8.8%. Collections growth is forecasted at 6.0%
in FY 2017 and FY 2018, 5.9% in FY 2019, 4.6% in FY 2020 and
4.0% in FY 2021.
The business and occupation (B&O) tax is the second largest
source of GF-S revenue, accounting for 19.4% of GF-S revenue
in FY 2017. It is a tax on the gross receipts of all businesses
operating in Washington. The state portion of the tax applies ten
different rates according to various classifications of business
activities. In FY 2016, the largest contributor to total state B&O
tax was the services sector, which had a gross tax rate of 1.5%
and represented an estimated 45% of B&O taxes due. The next
largest sector was retailing, which is taxed at 0.471% and
represented an estimated 25% of taxes due, followed by the
wholesaling sector, which is taxed at 0.484% and represented an
estimated 20% of taxes due.
30%
40%
50%
60%
1969 1974 1979 1984 1989 1994 1999 2004 2009 2014 2019
Business and Occupation taxes are the
second largest source of
GF-S revenue
Retail sales tax receipt growth
forecast: FY17: 6.0% FY18: 6.0% FY19: 5.9% FY20: 4.6%
FY21: 4.0%
The ratio of taxable sales to state personal income is on a declining
trend
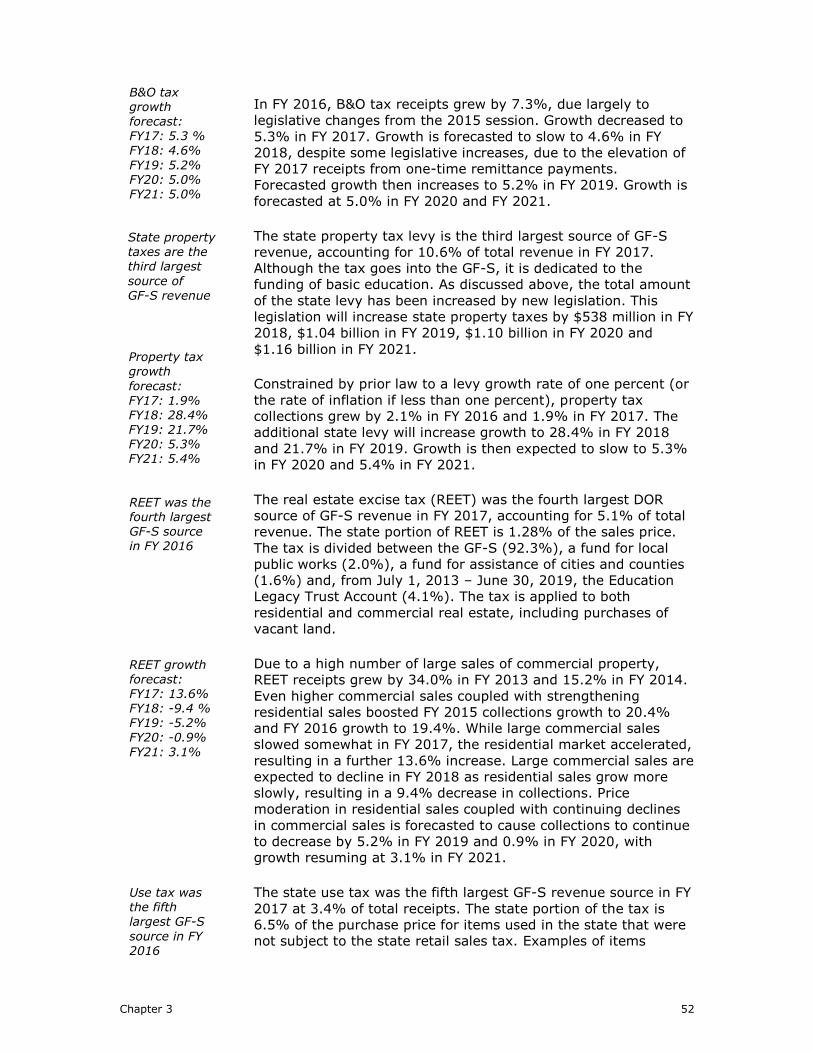
Chapter 3 52
In FY 2016, B&O tax receipts grew by 7.3%, due largely to
legislative changes from the 2015 session. Growth decreased to
5.3% in FY 2017. Growth is forecasted to slow to 4.6% in FY
2018, despite some legislative increases, due to the elevation of
FY 2017 receipts from one-time remittance payments.
Forecasted growth then increases to 5.2% in FY 2019. Growth is
forecasted at 5.0% in FY 2020 and FY 2021.
The state property tax levy is the third largest source of GF-S
revenue, accounting for 10.6% of total revenue in FY 2017.
Although the tax goes into the GF-S, it is dedicated to the
funding of basic education. As discussed above, the total amount
of the state levy has been increased by new legislation. This
legislation will increase state property taxes by $538 million in FY
2018, $1.04 billion in FY 2019, $1.10 billion in FY 2020 and
$1.16 billion in FY 2021.
Constrained by prior law to a levy growth rate of one percent (or
the rate of inflation if less than one percent), property tax
collections grew by 2.1% in FY 2016 and 1.9% in FY 2017. The
additional state levy will increase growth to 28.4% in FY 2018
and 21.7% in FY 2019. Growth is then expected to slow to 5.3%
in FY 2020 and 5.4% in FY 2021.
The real estate excise tax (REET) was the fourth largest DOR
source of GF-S revenue in FY 2017, accounting for 5.1% of total
revenue. The state portion of REET is 1.28% of the sales price.
The tax is divided between the GF-S (92.3%), a fund for local
public works (2.0%), a fund for assistance of cities and counties
(1.6%) and, from July 1, 2013 – June 30, 2019, the Education
Legacy Trust Account (4.1%). The tax is applied to both
residential and commercial real estate, including purchases of
vacant land.
Due to a high number of large sales of commercial property,
REET receipts grew by 34.0% in FY 2013 and 15.2% in FY 2014.
Even higher commercial sales coupled with strengthening
residential sales boosted FY 2015 collections growth to 20.4%
and FY 2016 growth to 19.4%. While large commercial sales
slowed somewhat in FY 2017, the residential market accelerated,
resulting in a further 13.6% increase. Large commercial sales are
expected to decline in FY 2018 as residential sales grow more
slowly, resulting in a 9.4% decrease in collections. Price
moderation in residential sales coupled with continuing declines
in commercial sales is forecasted to cause collections to continue
to decrease by 5.2% in FY 2019 and 0.9% in FY 2020, with
growth resuming at 3.1% in FY 2021.
The state use tax was the fifth largest GF-S revenue source in FY
2017 at 3.4% of total receipts. The state portion of the tax is
6.5% of the purchase price for items used in the state that were
not subject to the state retail sales tax. Examples of items
State property taxes are the third largest
source of GF-S revenue
Use tax was the fifth largest GF-S
source in FY 2016
B&O tax growth
forecast: FY17: 5.3 % FY18: 4.6%
FY19: 5.2% FY20: 5.0% FY21: 5.0%
REET was the fourth largest GF-S source in FY 2016
Property tax growth
forecast: FY17: 1.9% FY18: 28.4% FY19: 21.7% FY20: 5.3% FY21: 5.4%
REET growth forecast: FY17: 13.6% FY18: -9.4 % FY19: -5.2% FY20: -0.9%
FY21: 3.1%

Chapter 3 53
subject to the state use tax are goods purchased out-of-state;
online and mail-order purchases, where sales tax was not
collected; or purchases of used vehicles from private individuals.
The legislated elimination of certain tax exemptions, along with
several large one-time remittance payments, boosted use tax
growth to 7.1% in FY 2016. Growth decreased to 6.0% in FY
2017. Lower used car sales and declines in expected used car
prices are expected to cause collections to shrink by 0.9% in FY
2018 and grow at only 1.8% in FY 2019. Growth is then
expected to resume at more normal levels of 4.4% in FY 2020
and 4.8% in FY 2021.
Public utility taxes were the sixth largest DOR source of GF-S
revenue in FY 2017, bringing in 2.1% of total receipts. The tax
applies to the gross income of sales to consumers by public and
privately owned utilities and is in lieu of the B&O tax. The largest
source of public utility taxes is the 3.873% tax on the
distribution and generation of electrical power, followed by the
3.852% tax on the distribution of natural gas.
Public utility tax receipts grew by 4.5% in FY 2016. Lower
natural gas prices brought growth in receipts to 1.4% in FY
2017. A recovery in projected natural gas prices and increased
electricity prices bring expected growth of 8.0% in FY 2018.
Growth then slows to 4.6% in FY 2019, 3.0% in FY 2020 and
3.4% in FY 2021.
The state tax on cigarettes was the seventh largest DOR GF-S
revenue source in FY 2016 at 1.9% of total receipts. Prior to FY
2010, the tax made up a much smaller portion of GF-S revenue
because much of the tax was dedicated to non-GF-S accounts.
In FY 2010, all of the tax except the portion dedicated to the
Education Legacy Trust account was redirected to the GF-S, and
in FY 2011 all of the cigarette tax was redirected to the GF-S.
The current tax rate, which took effect May 1, 2010, is $3.025
per pack of 20 cigarettes.
The total number of taxed cigarettes has been on a downward
trend due to a continuing decline in the number of smokers.
Recently, the rate of decline has been increasing further due to
increased consumption of e-cigarettes, which are not subject to
the cigarette tax but are subject to retail sales taxes. Despite an
increase in tax enforcement established in the 2015 legislative
session, collections decreased by 1.8% in FY 2016. Collections
are forecasted to decrease by 3.5% in FY 2017, 2.1% in FY
2018, 2.2% in FY 2019, 2.1% in FY 2020 and 1.5% in FY 2021.
Cigarette tax growth forecast: FY17: -3.5% FY18: -2.1%
FY19: -2.2%
FY20: -2.1% FY21: -1.5%
Use tax growth forecast: FY17: 6.0% FY18: -0.9% FY19: 1.8%
FY20: 4.4%
FY21: 4.8%
The cigarette tax was the seventh
largest GF-S source in FY 2016
Public utility taxes were
the sixth largest GF-S source in FY 2016
Growth forecast: FY17: 1.4% FY18: 8.0% FY19: 4.6% FY20: 3.0%
FY21: 3.4%

Chapter 3 54
Forecasted Revenue from Cannabis-Related Sales
Initiative 502, approved by voters in the November 2012
election, legalized the sale and use of recreational cannabis and
cannabis products in Washington. The first legal sales of
cannabis products in state-licensed stores occurred in July 2014.
During the 2015 regular and special sessions, legislation was
passed that substantially altered the market rules set up by the
initiative. 2SSB 5052, passed during the regular session, brought
previously unregulated medical marijuana dispensaries into the
same regulatory regime as licensed recreational cannabis outlets.
This legislation was outlined in our June 2015 forecast
publication. Subsequent to the June 2015 forecast, 2E2SHB
2136, passed in the second special session, changed the
cannabis excise tax from a 25 percent tax collected from
growers, processors and retailers to a 37 percent tax on retail
sales only. The law also made changes to the distribution of tax
and fee revenue. Cannabis taxes and license fees are still
collected by the Liquor and Cannabis Board and are placed into a
dedicated fund with annual appropriations to various other
accounts including the GF-S.
Distributions of cannabis excise taxes to the GF-S totaled $15.3
million in the 2013-15 biennium. Forecasted GF-S distributions
and fees for the 2015-17 biennium totaled $147.6 million. GF-S
distributions are forecasted at $245.6 million in the 2017-19
biennium, an increase of $25.2 million from the June forecast,
and $267.6 million in the 2019-21 biennium, an increase of
$22.8 million. Details of the forecasted distributions from the
account can be found in Table 3.18.
The Office of Financial Management (Other Agencies)
The Office of Financial Management (OFM) is responsible for
preparing General Fund-State revenue and transfer forecasts for
all agencies excluding the Department of Revenue, the Liquor
and Cannabis Board, the Insurance Commissioner, the
Washington State Lottery, and the State Treasurer. Starting with
the current forecast cycle, the office has also added the
Department of Licensing to its list of covered agencies. The
office’s preliminary tally of final revenue for the 2015-17
biennium was $265.7 million, $0.7 less than expected in June.
$0.4 million of the shortfall was due to new legislation that
increased an existing transfer of funds out of the GF-S. The
office’s forecast for the 2017-19 biennium was increased $68.1
million to $325.9 million, due mainly to $67.0 million in
legislative changes. These changes included a delay of PUD
privilege tax distributions and decreases in outward transfers to
several sources. The forecast for the 2019-21 biennium was
increased $21.1 million to $163.9 million, due mainly to $21.8
Forecast change by biennium (millions): 15-17: -$0.7 17-19: $68.1
19-21: $21.1
Sales of cannabis products in state-licensed stores began in July 2014
Change in GF-S forecast of total cannabis-related revenue by biennium (millions):
15-17: $0.0 17-19: $25.2
19-21: $22.8

Chapter 3 55
million in legislative changes mainly involving decreased outward
transfers.
State Treasurer
The Office of the State Treasurer generates GF-S revenue by
investing state short-term cash reserves. The office’s preliminary
tally of total revenue for the 2015-17 biennium is $22.0 million,
$1.2 million more than forecasted in June. The office’s forecast
for the 2017-19 biennium has been decreased $15.1 million to
$25.4 million and the forecast for the 2019-21 biennium has
been decreased $21.0 million to $48.7 million. The forecast
reductions were due to a decrease in expected balances that
contribute earnings to the GF-S due to a large outward transfer
in FY 2017 that was previously expected to be reversed.
Insurance Commissioner
The Office of the Insurance Commissioner collects premium taxes
on most classes of insurance sold in Washington State. These
taxes are distributed to the GF-S and various accounts in support
of fire services. The office’s preliminary tally of total revenue for
the 2015-17 biennium is $1,087.0 million, $0.3 million less than
forecasted in June. The forecast for the 2017-19 biennium has
been increased $1.0 million to $1,169.9 million and the forecast
for the 2019-21 biennium has been increased $2.3 million to
$1,278.6 million.
Liquor and Cannabis Board
The Liquor and Cannabis Board (LCB) collects fees from
distributors and retailers on sales of spirits and surtaxes on sales
of beer and wine (sales and liter taxes on sprits are collected by
the DOR). The LCB is also responsible for the collection of excise
taxes and fees associated with the legalized sale and use of
recreational and medicinal cannabis discussed previously. The
initial tally of LCB GF-S revenue for the 2015-17 biennium is
$366.2 million, $4.7 million less than forecasted in June. The
forecast of revenue for the 2017-19 biennium has been increased
$21.4 million to $496.1 million and the forecast for the 2019-21
biennium has been increased $22.2 million to $537.1 million. The
forecast changes were a combination of changes to expected
fees and taxes associated with beer, wine, and liquor distribution
and the changes in expected distributions of cannabis excise
taxes to the GF-S discussed above.
Forecast change by biennium (millions):
15-17: $1.2 17-19: -$15.1 19-21: -$21.0
Forecast change by biennium (millions):
15-17: -$0.3 17-19: $1.0 19-21: $2.3
Forecast change by biennium (millions):
15-17: -$4.7 17-19: $21.4 19-21: $22.2

Chapter 3 56
Lottery Commission
While most of the proceeds from sales of lottery games go to the
Washington Opportunity Pathways Account (OPA), distributions
are also made to programs such as Problem Gambling, Economic
Development and the Stadium/Exhibition Center. Details of the
forecast of the distribution of Lottery earnings can be found in
Table 3.15 on a cash basis and Table 3.16 on a GAAP basis.
When total profits from all Washington-only games plus the
Powerball game exceed $102 million per year, the amount above
$102 million is transferred to the GF-S. The preliminary tally of
transfers into the GF-S for the 2015-17 biennium is unchanged
at $31.9 million. Forecasted transfers for the 2017-19 biennium
have been increased $5.4 million to $34.8 million and forecasted
transfers to the GF-S for the 2019-21 biennium have been
increased $1.0 million to $43.1 million.
The OPA receives all profits (excluding statutory transfers) from
Washington-only lottery games plus all profits from the Mega
Millions game. The preliminary tally of OPA revenue for the
2015-17 biennium is $263.5 million, $2.8 million less than
forecasted in June. The forecast for the 2017-19 biennium has
been increased $2.9 million to $259.1 million and the forecast for
the 2019-21 biennium has been increased $0.8 million to $257.4
million.
Administrative Office of the Courts
The Administrative Office of the Courts collects surcharges on
certain filing fees, fines, and infraction penalties and transfers
this revenue to the GF-S on a monthly basis. The preliminary
tally of transfers to the GF-S for the 2015-17 biennium is $155.3
million, $0.8 million more than forecasted in June. The forecast
for the 2017-19 biennium has been decreased $0.6 million to
$138.8 million and the forecast of transfers for the 2019-21
biennium has been decreased $1.7 million to $140.7 million.
Track Record for the 2015-17 Biennium
Table 3.10 summarizes the historical changes to the GF-S
revenue forecast for the 2015-17 biennium. The September
2012 forecast was the initial forecast for the biennium. The
September 2017 preliminary estimate of total revenue for the
biennium is $2.79 billion (7.9%) higher than the initial forecast.
Non-economic changes have increased the forecast by $499
million (1.4%). Excluding non-economic changes, the current
forecast is $2.29 billion (6.5%) higher than the initial forecast.
The June 2015 forecast, coupled with the $193 million in
legislative and budget-driven revenue changes passed in the
2015 special legislative sessions, was the basis for the initial
OPA forecast change by
biennium (millions): 15-17: -$2.8 17-19: $2.9 19-21: $0.8
The September 2017 estimate is $1.36 billion
(3.7%) higher than the forecast when
the initial biennial budget in 2015 was adopted
GF-S forecast
change by biennium (millions): 15-17: $0.0 17-19: $5.4
19-21: $1.0
Forecast change by biennium (millions): 15-17: $0.8
17-19: -$0.6 19-21: -$1.7
Chapter 3 57
budget for the 2015-17 biennium. The September 2017 forecast
is $1.36 billion (3.7%) higher than that sum.
Track Record for the 2017-19 Biennium
Table 3.11 summarizes the historical changes to the GF-S
revenue forecast for the 2017-19 biennium. The February 2014
forecast was the initial forecast for the biennium. The September
2017 forecast is $4.55 billion (11.8%) higher than the initial
forecast. Non-economic changes have increased the forecast by
$2.48 billion (6.4%). Excluding non-economic changes, the
current forecast is $2.07 billion (5.4%) higher than the initial
forecast.
The Relationship between the Cash and GAAP General Fund-
State Revenue Forecasts
Legislation enacted in 1987 requires that the state’s biennial
budget be in conformance with Generally Accepted Accounting
Principles (GAAP). It also requires a GF-S revenue forecast on
both a cash and GAAP basis. The GAAP forecasts of GF-S
revenue for the 2015-17 and 2017-19 biennia are presented in
Tables 3.6 and 3.8 and the GAAP forecast of Lottery revenue
transfers for both biennia is in Table 3.15. The primary difference
between the cash and GAAP forecasts is the timing of the receipt
of revenue. On a GAAP basis, revenue is credited to the biennium
in which it is earned even though it may not have been received.
The cash forecast, on the other hand, reflects expected cash
receipts during a fiscal period. The forecast on a GAAP, or
accrual, basis is primarily used for financial reporting. The cash
forecast is used for cash flow management and revenue tracking.
The cash forecast is also the forecast used in the state’s
budgetary balance sheet, which is the principal tool for assessing
the General Fund’s current surplus or deficit position. References
to the GF-S forecast in the text of this chapter refer to the cash
forecast unless otherwise noted. Likewise, figures from revenue
tables other than Tables 3.6, 3.8 and 3.16 are projected on a
cash basis.
Budgetary Balance Sheet for the 2015-17 Biennium
Table 3.12 shows the budgetary balance sheets for the 2015-17
and 2017-19 biennia as prepared by the Office of Financial
Management and the House and Senate fiscal committees. The
balance sheet shows not only projected GF-S spending and
resources but also total projected spending and resources for the
GF-S plus the other main non-transportation state-funded
accounts: the Education Legacy Trust Account (ELTA) and the
Washington Opportunity Pathways Account (OPA). As shown in
the table, the preliminary GF-S ending fund balance for the
GAAP forecasts are based on the period in which the revenue is
earned rather than received
The September 2017 forecast is $4.55 billion (11.8%) higher than the initial February 2014
forecast, due mainly to legislative changes
The forecast implies total GF-S reserves of $2.31 billion at the end
of the 2017-19 biennium and $2.35 billion in reserves for GF-S, ELTA
and OPA

Chapter 3 58
2015-17 biennium is 664.9 million and the total preliminary
ending balance for GF-S, ELTA and OPA is $719.2 million. Based
on the September 2017 revenue forecast and currently enacted
budgets, unrestricted GF-S reserves are projected to be $1,148.3
million at the end of the 2017-19 biennium and GF-S, ELTA and
OPA reserves are projected to be $1,185.4 million. In addition,
the Budget Stabilization Account is projected to have a balance
of $1,161.8 million, bringing total projected GF-S reserves to
$2,310.1 million. Projected combined reserves for the ELTA and
OPA are $37.1 million, for total projected reserves of $2,347.2
million for GF-S, ELTA and OPA at the end of the 2017-19
biennium.
Alternative Forecasts for the 2017-19 and 2019-21 Biennia
Chapter 2 outlines optimistic and pessimistic economic scenarios
relative to the baseline economic forecast. The forecast assigns a
probability of 60% to the baseline forecast, 15% to a scenario
based on the upside risks and 25% to a scenario based on the
downside risks. The revenue implications of these alternative
scenarios for the 2017-19 biennium are shown in Table 3.13 and
those of the 2019-21 biennium are shown in Table 3.14. For the
2017-19 biennium, the optimistic forecast generates $44,915.0
million in GF-S revenue, $1,653.3 million (3.8%) more than the
baseline scenario, while the pessimistic forecast produces
$41,307.9 million in revenue, $1,953.8 million (4.5%) less than
the baseline. For the 2019-21 biennium, the optimistic forecast
generates $51,217.3 million in GF-S revenue, $3,820.9 million
(8.1%) more than the baseline scenario, while the pessimistic
forecast produces $43,318.4 million in revenue, $4,078.0 million
(8.6%) less than the baseline.
Near General Fund Forecasts for the 2015-17–2019-21 Biennia
“Near General Fund” accounts are those included in the GF-S
plus the Education Legacy Trust Account (ELTA). The ELTA is
primarily funded by a tax on estates of over $2 million.
Legislation from the 2013 special session, however, added
revenue from public utility and real estate excise taxes which
had previously gone into non-GF-S accounts. Subsequent
legislation also added revenue from solid waste taxes beginning
in FY 2016. All of these added revenue sources will cease to be
transferred into the ELTA beginning in FY 2020. The preliminary
tally of Near General Fund revenue for the 2015-17 biennium is
$38,778.4 million, $3.6 million more than the June 2017
forecast. The forecast of Near General Fund revenue for the
2017-19 biennium is $43,784.7 million, $2,363.8 million more
than the June forecast, and the forecast for the 2019-21
biennium is $47,963.4 million, $3,738.5 million more than the
June forecast. The Near General Fund forecast and recent history
by fiscal year are presented in Table 3.17. The table also
Optimistic scenario (billions): 17-19: +$1.7 19-21: +$3.8
Pessimistic scenario: 17-19: -$2.0 19-21: -$4.0
Near General Fund Forecast (millions):
2015-17:
$38,778.4 2017-19: $43,784.7 2019-21:
$47,963.4

Chapter 3 59
includes projected revenue for the OPA and the sum of Near
General Fund plus OPA revenues by fiscal year.
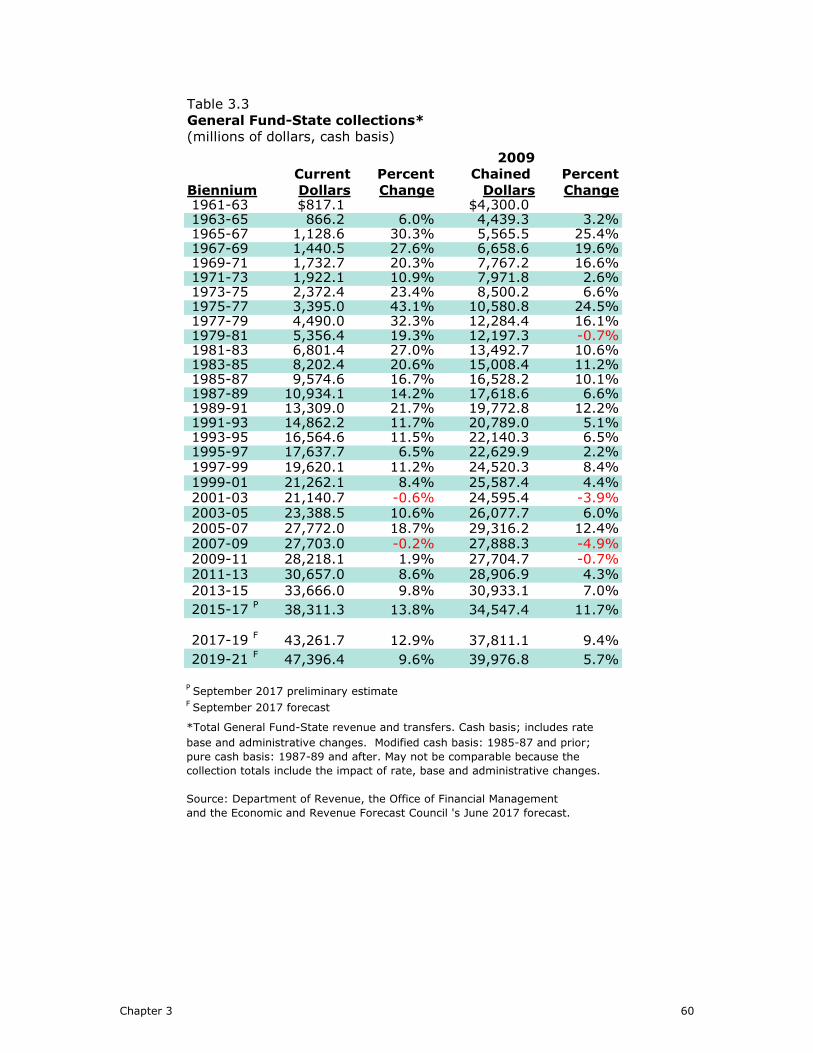
Table 3.3
General Fund-State collections*
(millions of dollars, cash basis)
2009
Current Percent Chained Percent
Biennium Dollars Change Dollars Change 1961-63 $817.1 $4,300.0 1963-65 866.2 6.0% 4,439.3 3.2% 1965-67 1,128.6 30.3% 5,565.5 25.4% 1967-69 1,440.5 27.6% 6,658.6 19.6% 1969-71 1,732.7 20.3% 7,767.2 16.6% 1971-73 1,922.1 10.9% 7,971.8 2.6% 1973-75 2,372.4 23.4% 8,500.2 6.6% 1975-77 3,395.0 43.1% 10,580.8 24.5% 1977-79 4,490.0 32.3% 12,284.4 16.1% 1979-81 5,356.4 19.3% 12,197.3 -0.7% 1981-83 6,801.4 27.0% 13,492.7 10.6% 1983-85 8,202.4 20.6% 15,008.4 11.2% 1985-87 9,574.6 16.7% 16,528.2 10.1% 1987-89 10,934.1 14.2% 17,618.6 6.6% 1989-91 13,309.0 21.7% 19,772.8 12.2% 1991-93 14,862.2 11.7% 20,789.0 5.1% 1993-95 16,564.6 11.5% 22,140.3 6.5% 1995-97 17,637.7 6.5% 22,629.9 2.2% 1997-99 19,620.1 11.2% 24,520.3 8.4% 1999-01 21,262.1 8.4% 25,587.4 4.4% 2001-03 21,140.7 -0.6% 24,595.4 -3.9% 2003-05 23,388.5 10.6% 26,077.7 6.0% 2005-07 27,772.0 18.7% 29,316.2 12.4% 2007-09 27,703.0 -0.2% 27,888.3 -4.9% 2009-11 28,218.1 1.9% 27,704.7 -0.7% 2011-13 30,657.0 8.6% 28,906.9 4.3%
2013-15 33,666.0 9.8% 30,933.1 7.0%
2015-17 P
38,311.3 13.8% 34,547.4 11.7%
2017-19 F
43,261.7 12.9% 37,811.1 9.4%
2019-21 F
47,396.4 9.6% 39,976.8 5.7%
P September 2017 preliminary estimate
F September 2017 forecast
*Total General Fund-State revenue and transfers. Cash basis; includes rate
base and administrative changes. Modified cash basis: 1985-87 and prior;
pure cash basis: 1987-89 and after. May not be comparable because the
collection totals include the impact of rate, base and administrative changes.
Source: Department of Revenue, the Office of Financial Management
and the Economic and Revenue Forecast Council 's June 2017 forecast.
Chapter 3 60

Table 3.4
Taxable retail sales*
(millions of dollars)
Fiscal Percent
Year Amount Change
1979 22,309 5.6%
1980 24,057 7.8%
1981 25,197 4.7%
1982 26,097 3.6%
1983 29,368 12.5%
1984 29,156 -0.7%
1985 30,687 5.3%
1986 32,158 4.8%
1987 34,647 7.7%
1988 37,452 8.1%
1989 41,429 10.6%
1990 47,183 13.9%
1991 49,812 5.6%
1992 53,189 6.8%
1993 55,319 4.0%
1994 59,009 6.7%
1995 61,927 4.9%
1996 62,817 1.4%
1997 66,748 6.3%
1998 72,059 8.0%
1999 77,197 7.1%
2000 83,335 8.0%
2001 85,633 2.8%
2002 84,418 -1.4%
2003 86,165 2.1%
2004 90,139 4.6%
2005 97,253 7.9%
2006 107,071 10.1%
2007 115,527 7.9%
2008 118,676 2.7%
2009 106,379 -10.4%
2010 99,983 -6.0%
2011 101,825 1.8%
2012 106,036 4.1%
2013 113,173 6.7%
2014 120,453 6.4%
2015 130,168 8.1%
2016 141,103 8.4%
2017P
149,999 6.3%
2018F
157,549 5.0%
2019F
166,822 5.9%
2020F
174,043 4.3%
2021F
180,809 3.9%
P September 2017 preliminary estimate
F September 2017 forecast
Source: ERFC
* Actual Base. Includes statutory and administrative changes to the
tax base. Historical fiscal year data are from quarterly taxable sales
reported by taxpayers on the state's Combined Excise tax return.
Reported totals affected by enacted legislation. Major base changes
include: exemption of off-premises food, beginning 1978:3 (fiscal
1979); extension of the sales tax base to off premises food (1982:2
to 1983:2); food again exempt 1983:3 (fiscal 1984); extension of
the sales tax base to candy, gum and bottled water (June 1 -
December 2, 2010); elimination of sales tax exemption for
residential phone service (July 1, 2013); elimination of sales tax
exemption for bottled water (July 1, 2017); extension of economic
nexus to certain remote sellers (January 1, 2018).
Chapter 3 61

Table 3.5
Comparison of the General Fund-State forecast by agency
2015-17 biennium; cash basis
(millions of dollars)
Non-Jun. 2017 Economic Forecast Sep. 2017 Total
Forecast by Agency Forecast1
Changes Revision Forecast2
Change
Department of Revenue
Retail Sales $18,425.4 $0.0 ($39.5) $18,385.9 ($39.5)
Business & Occupation 7,428.8 0.0 20.8 7,449.7 20.8
Use 1,296.2 0.0 13.7 1,310.0 13.7
Public Utility 804.0 0.0 2.8 806.8 2.8
Liquor Sales/Liter 514.3 0.0 0.9 515.2 0.9
Cigarette 766.3 0.0 3.0 769.3 3.0
Property (State Levy) 4,132.4 0.0 0.4 4,132.8 0.4
Real Estate Excise 1,884.6 0.0 6.5 1,891.0 6.5
Timber Excise 3.8 0.0 0.0 3.8 0.0
Other 1,120.7 0.0 (2.0) 1,118.6 (2.0)
Subtotal 36,376.5 0.0 6.6 36,383.1 6.6
Insurance Commissioner
Insurance Premiums 1,087.3 0.0 (0.3) 1,087.0 (0.3)
Liquor Control Board
Fees, Cannabis Excise Tax 313.3 0.0 (3.8) 309.5 (3.8)
Beer & Wine Surtax 57.6 0.0 (0.9) 56.7 (0.9)
Lottery Commission
Lottery Revenue 31.9 0.0 0.0 31.9 0.0
State Treasurer
Interest Earnings 20.8 0.0 1.2 22.0 1.2
Office of Financial Management**
Other Agencies 266.4 (0.4) (0.3) 265.7 (0.7)
Administrative Office of the Courts
Fines and Forfeitures 154.6 0.0 0.8 155.3 0.8
Total General Fund-State * $38,308.3 ($0.4) $3.3 $38,311.3 $2.9
1 Forecast for the 2015-17 biennium adopted by the Economic and Revenue Forecast Council June 20, 2017
2 Forecast for the 2015-17 biennium, adopted September 20, 2017
*Detail may not add to totals because of rounding.
**OFM forecast now includes revenue from the Department of Licensing.
Source: ERFC, Insurance Commissioner, Lottery Commission, Office of the
State Treasurer, Liquor and Cannabis Board, Office of Financial Management
Chapter 3 62

Table 3.6
Comparison of the General Fund-State forecast by agency
2015-17 biennium; GAAP basis
(millions of dollars)
Non-Jun. 2017 Economic Forecast Sep. 2017 Total
Forecast by Agency Forecast1
Changes Revision Forecast2
Change
Department of Revenue
Retail Sales $18,470.9 $0.0 ($90.3) $18,380.6 ($90.3)
Business & Occupation 7,450.0 0.0 0.6 7,450.6 0.6
Use 1,288.9 0.0 10.2 1,299.1 10.2
Public Utility 800.8 0.0 1.0 801.8 1.0
Liquor Sales/Liter 516.0 0.0 0.4 516.4 0.4
Cigarette 766.5 0.0 (35.3) 731.2 (35.3)
Property (State Levy) 4,133.3 0.0 (19.5) 4,113.8 (19.5)
Real Estate Excise 1,886.4 0.0 5.9 1,892.4 5.9
Timber Excise 3.5 0.0 0.5 4.0 0.5
Other 1,124.5 0.0 (4.4) 1,120.1 (4.4)
Subtotal 36,440.8 0.0 (130.9) 36,309.9 (130.9)
Insurance Commissioner
Insurance Premiums 1,087.3 0.0 (0.3) 1,087.0 (0.3)
Liquor Control Board
Fees, Cannabis Excise Tax 313.3 0.0 (3.8) 309.5 (3.8)
Beer & Wine Surtax 57.6 0.0 (0.9) 56.7 (0.9)
Lottery Commission
Lottery Revenue 43.9 0.0 4.8 48.7 4.8
State Treasurer
Interest Earnings 21.4 0.0 0.4 21.8 0.4
Office of Financial Management**
Other Agencies 266.4 (0.4) (0.3) 265.7 (0.7)
Administrative Office of the Courts
Fines and Forfeitures 154.6 0.0 0.8 155.3 0.8
Total General Fund-State * $38,385.2 ($0.4) ($130.1) $38,254.7 ($130.5)
1 Forecast for the 2015-17 biennium adopted by the Economic and Revenue Forecast Council June 20, 2017
2 Forecast for the 2015-17 biennium, adopted September 20, 2017
*Detail may not add to totals because of rounding.
**OFM forecast now includes revenue from the Department of Licensing.**OFM forecast now includes revenue from the Department of Licensing.**OFM forecast now includes revenue from the Department of Licensing.**OFM forecast now includes revenue from the Department of Licensing.**OFM forecast now includes revenue from the Department of Licensing.**OFM forecast now includes revenue from the Department of Licensing.
Source: ERFC, Insurance Commissioner, Lottery Commission, Office of the
State Treasurer, Liquor and Cannabis Board, Office of Financial Management
Chapter 3 63

Table 3.7
Comparison of the General Fund-State forecast by agency
2017-19 biennium; cash basis
(millions of dollars)
Non-Jun. 2017 Economic Forecast Sep. 2017 Total
Forecast by Agency Forecast1
Changes Revision Forecast2
Change
Department of Revenue
Retail Sales $20,123.2 395.9 $132.4 $20,651.5 $528.3
Business & Occupation 8,130.3 0.5 71.0 8,201.8 71.5
Use 1,324.0 6.7 17.6 1,348.3 24.3
Public Utility 905.3 (7.8) 0.2 897.8 (7.5)
Liquor Sales/Liter 540.0 0.0 4.2 544.2 4.2
Cigarette 730.5 0.0 1.7 732.2 1.7
Property (State Levy) 4,338.6 1,614.2 (13.7) 5,939.0 1,600.5
Real Estate Excise 1,734.3 0.0 39.8 1,774.2 39.8
Timber Excise 3.8 0.0 0.4 4.2 0.4
Other 962.6 0.0 15.0 977.7 15.0
Subtotal 38,792.6 2,009.5 268.7 41,070.8 2,278.2
Insurance Commissioner
Insurance Premiums 1,168.9 0.0 1.0 1,169.9 1.0
Liquor Control Board
Fees, Cannabis Excise Tax 417.2 1.7 21.0 440.0 22.7
Beer & Wine Surtax 57.5 0.0 (1.3) 56.2 (1.3)
Lottery Commission
Lottery Revenue 29.4 0.8 4.6 34.8 5.4
State Treasurer
Interest Earnings 40.5 0.0 (15.1) 25.4 (15.1)
Office of Financial Management**
Other Agencies 257.8 67.0 1.1 325.9 68.1
Administrative Office of the Courts
Fines and Forfeitures 139.3 0.0 (0.6) 138.8 (0.6)
Total General Fund-State * $40,903.2 $2,079.1 $279.5 $43,261.7 $2,358.6
1 Forecast for the 2017-19 biennium adopted by the Economic and Revenue Forecast Council June 20, 2017
2 Forecast for the 2017-19 biennium, adopted September 20, 2017
*Detail may not add to totals because of rounding.
**OFM forecast now includes revenue from the Department of Licensing.
Source: ERFC, Insurance Commissioner, Lottery Commission, Office of the
State Treasurer, Liquor Control Board, Office of Financial Management
Chapter 3 64

Table 3.8
Comparison of the General Fund-State forecast by agency
2017-19 biennium; GAAP basis
(millions of dollars)
Non-Jun. 2017 Economic Forecast Sep. 2017 Total
Forecast by Agency Forecast1
Changes Revision Forecast2
Change
Department of Revenue
Retail Sales $20,123.2 $395.9 $132.4 $20,651.5 $528.3
Business & Occupation 8,130.3 0.5 71.0 8,201.8 71.5
Use 1,324.0 6.7 17.6 1,348.3 24.3
Public Utility 905.3 (7.8) 0.2 897.8 (7.5)
Liquor Sales/Liter 540.0 0.0 4.2 544.2 4.2
Cigarette 730.5 0.0 1.7 732.2 1.7
Property (State Levy) 4,338.6 1,614.2 (15.1) 5,937.6 1,599.0
Real Estate Excise 1,734.3 0.0 29.8 1,764.2 29.8
Timber Excise 3.9 0.0 (0.1) 3.7 (0.1)
Other 962.6 0.0 15.0 977.6 15.0
Subtotal 38,792.7 2,009.5 256.7 41,058.9 2,266.2
Insurance Commissioner
Insurance Premiums 1,168.9 0.0 1.0 1,169.9 1.0
Liquor Control Board
Fees, Cannabis Excise Tax 417.2 1.7 21.0 440.0 22.7
Beer & Wine Surtax 57.5 0.0 (1.3) 56.2 (1.3)
Lottery Commission
Lottery Revenue 33.5 0.8 (0.2) 34.2 0.6
State Treasurer
Interest Earnings 41.6 0.0 (16.8) 24.9 (16.8)
Office of Financial Management**
Other Agencies 257.8 67.0 1.1 325.9 68.1
Administrative Office of the Courts
Fines and Forfeitures 139.3 0.0 (0.6) 138.8 (0.6)
Total General Fund-State * $40,908.5 $2,079.1 $261.0 $43,248.6 $2,340.1
1 Forecast for the 2017-19 biennium adopted by the Economic and Revenue Forecast Council June 20, 2017
2 Forecast for the 2017-19 biennium, adopted September 20, 2017
*Detail may not add to totals because of rounding.
**OFM forecast now includes revenue from the Department of Licensing.
Source: ERFC, Insurance Commissioner, Lottery Commission, Office of the State Treasurer, Liquor Control Board, Office of Financial Management
Chapter 3 65

Table 3.9
September 2017 General Fund-State history and forecast
2015-17 to 2019-21 biennia; cash basis
(Millions of Dollars)
Fiscal Fiscal 2015-17 Fiscal Fiscal 2017-19 Fiscal Fiscal 2019-21
Forecast by Source 2016 2017 Biennium 2018 2019 Biennium 2020 2021 Biennium
State Taxes
Retail sales** $8,927.3 $9,458.6 $18,385.9 $10,029.2 $10,622.3 $20,651.5 $11,106.7 $11,549.8 $22,656.4
Business & occupation 3,628.4 3,821.2 7,449.7 3,996.4 4,205.4 8,201.8 4,417.6 4,639.4 9,057.0
Use** 635.8 674.2 1,310.0 668.0 680.3 1,348.3 710.3 744.5 1,454.8
Public Utility 400.5 406.3 806.8 438.8 459.0 897.8 472.9 488.7 961.6
Liquor sales/liter 252.9 262.4 515.2 269.4 274.8 544.2 280.3 285.5 565.8
Beer & wine surtax 29.1 27.6 56.7 28.0 28.2 56.2 28.3 28.4 56.7
Cigarette 400.6 387.1 787.7 379.3 371.2 750.5 363.6 358.3 721.9
Tobacco products 51.6 52.4 104.1 54.1 54.7 108.7 55.3 56.0 111.3
Cannabis Excise Taxes 48.1 92.9 141.1 116.4 122.9 239.3 127.6 133.6 261.1
Property (state school levy) 2,047.1 2,085.7 4,132.8 2,678.4 3,260.6 5,939.0 3,435.0 3,619.0 7,053.9
Leasehold Excise Tax 32.9 33.0 65.9 31.5 31.8 63.3 32.0 32.3 64.4
Public utility district 51.2 53.9 105.1 54.8 55.6 110.4 56.3 57.1 113.4
Brokered Natural Gas 21.4 21.3 42.7 20.5 20.7 41.3 21.0 21.3 42.3
Real estate excise*** 885.1 1,005.9 1,891.0 910.9 863.3 1,774.2 855.5 882.2 1,737.7
Timber excise 2.8 0.9 3.8 2.2 2.0 4.2 2.1 2.2 4.2
Estate/inheritance 0.3 2.2 2.6 0.0 0.0 0.0 0.0 0.0 0.0
Boat excise 13.8 14.6 28.4 14.0 13.5 27.5 13.5 13.5 27.0
Insurance premiums 510.1 576.9 1,087.0 570.1 599.8 1,169.9 626.1 652.5 1,278.6
Penalties and interest on past due taxes 178.9 283.8 462.7 170.2 166.3 336.6 172.8 179.5 352.3
Other 56.6 56.5 113.1 56.1 34.2 90.3 34.8 35.4 70.2
Total Taxes 18,174.7 19,317.5 37,492.2 20,488.5 21,866.4 42,354.9 22,811.6 23,779.1 46,590.7
State Non-Tax Sources
Licenses, permits, fees 141.9 131.2 273.1 122.8 125.0 247.8 128.2 131.7 259.9
Liquor & Cannabis fees 81.7 86.8 168.5 96.8 103.9 200.6 107.6 111.7 219.3
Earnings on investments 7.3 14.7 22.0 9.5 15.9 25.4 22.7 26.0 48.7
Administrative Office of the Courts 80.8 74.5 155.3 69.7 69.1 138.8 69.8 70.9 140.7
Transfers of unclamied property 70.7 63.2 133.9 65.5 66.4 131.8 67.7 69.1 136.8
Other revenue & transfers 21.7 44.6 66.3 84.5 77.8 162.3 (0.0) 0.4 0.4
Total Non-Tax 404.0 415.1 819.1 448.8 458.0 906.8 395.9 409.9 805.7
Total General Fund-State * $18,578.7 $19,732.6 $38,311.3 $20,937.3 $22,324.4 $43,261.7 $23,207.5 $24,189.0 $47,396.4
* Detail may not add to totals due to rounding
**GFS portion after Initiative 900 transfer
***Includes penalties and interest
Chapter 3 66

Table 3.10
Track Record for the 2015-17 General Fund-State Cash Forecast
September 2012 through September 2017
Cash Basis - Millions of Dollars
Total
Non- General
Department Other Economic Total Fund-State
Date of Forecast of Revenue* Agencies Subtotal* Changes** Change Cash Basis
September 2012#
$34,102 $1,416 $35,518
Changes to Forecast
November 2012 (196) 33 (163) 0 (163) 35,355
March 2013 (92) 44 (49) 0 (49) 35,306
June 2013 56 2 58 (7)#1
51 35,357
September 2013 95 (2) 93 249#2
342 35,699
November 2013 (47) 3 (44) (41)#3
(85) 35,615
February 2014 5 26 31 51#4
82 35,697
June 2014 194 40 233 5#5
238 35,935
September 2014 168 (25) 143 0 143 36,078
November 2014 239 3 241 0 241 36,319
February 2015 108 22 129 0 129 36,449
June 2015 201 70 270 39#6
309 36,758
September 2015 80 60 139 193#7
333 37,091
November 2015 107 (8) 99 15#8
113 37,204
February 2016 (101) 33 (67) 0 (67) 37,137
June 2016 330 (32) 298 (5)#9
294 37,431
September 2016 327 8 334 0 334 37,765
November 2016 205 9 215 0 215 37,980
March 2017 210 38 247 0 247 38,227
June 2017 70 12 81 0 81 38,308
September 2017 7 (4) 3 0#10
3 38,311
Total change***:
From September 2012 1,964 330 2,293 499 2,793
Percent change 5.8 23.3 6.5 1.4 7.9
* Excludes legislative, judicial, statutorily required or other major non-economic changes.
** Includes legislative, judicial, statutorily required or other major non-economic changes.
*** Detail may not add to total due to rounding.
# First official forecast for the 2015-17 biennium.
#1 Transfer of GF-S funds to Child and Family Reinvestment Account
#2 Legislative and budget-driven revenue changes from 2013 second special session
#3 Re-classification of prior period adjustments as non-revenue resources
#4 Cannabis excise taxes and fees plus retail sales and B&O taxes on cannabis production and sales resulting from Initiative 502
#5 Sum of legislative and budget-driven revenue changes from the 2014 regular legislative session
#6 Legislative revenue changes from 2015 regular legislative session
#7 Legislative and budget driven revenue changes from 2015 special legislative sessions
#8 Sum of large expected audit payments
#9 Legislative and budget-driven revenue changes from the 2016 regular and first special legislative sessions plus $3.3 million AG settlement
#10 Legislative revenue changes from 2017 special legislative sessions since the June 2017 forecast
Chapter 3 67

Table 3.11
Track Record for the 2017-19 General Fund-State Cash Forecast
February 2014 through September 2017
Cash Basis - Millions of Dollars
Total
Non- General
Department Other Economic Total Fund-State
Date of Forecast of Revenue* Agencies Subtotal* Changes** Change Cash Basis#
February 2014##
$36,887 $1,823 $38,710
Changes to Forecast
June 2014 265 50 315 (1)#1
313 39,023
September 2014 227 (63) 164 0 164 39,188
November 2014 388 26 415 0 415 39,602
February 2015 126 28 154 0 154 39,757
June 2015 257 64 321 122#2
443 40,200
September 2015 4 47 52 286#3
338 40,538
November 2015 35 (5) 30 0 30 40,567
February 2016 (449) 7 (442) 0 (442) 40,125
June 2016 187 (53) 134 (8)#4
126 40,252
September 2016 135 (10) 125 0 125 40,377
November 2016 131 6 137 0 137 40,514
March 2017 281 22 303 0 303 40,817
June 2017 84 3 87 (1)#5
87 40,903
September 2017 269 11 279 2079#6
2,359 43,262
Total change***:
From February 2014 1,942 132 2,074 2,478 4,552
Percent change 5.3 7.2 5.4 6.4 11.8
* Excludes legislative, judicial, statutorily required or other major non-economic changes.
** Includes legislative, judicial, statutorily required or other major non-economic changes.
*** Detail may not add to total due to rounding.
# First official forecast for the 2017-19 biennium.
#1 Sum of legislative and budget-driven revenue changes from the 2014 regular legislative session
#2 Legislative revenue changes from 2015 regular legislative session
#3 Legislative and budget driven revenue changes from 2015 special legislative sessions
#4 Legislative revenue changes from the 2016 regular and first special legislative sessions
#5 Sum of legislative revenue changes from 2017 legislative sessions through June 20, 2017
#6 Sum of legislative and budget driven revenue changes from 2017 special legislative sessions since the June 2017 forecast
Chapter 3 68

Table 3.12
GFS ELTA and
OPA TOTAL GFS
ELTA and
OPA TOTAL
RESOURCES
Beginning Fund Balance 990.9 20.3 1,011.2 669.4 49.8 719.2
June 2017 Revenue Forecast 38,308.3 732.8 39,041.1 40,903.2 773.9 41,677.1
September 2017 Revenue Forecast change 2.9 (2.1) 0.8 279.5 8.1 287.6
Current Revenue Totals 38,311.3 730.7 39,041.9 41,182.6 782.1 41,964.7
Transfer to Budget Stabilization Account (1% of GSR) (383.2) (383.2) (409.0) (409.0)
Transfer to Budget Stabilization Account (EORG) (925.2) (925.2) - -
CAFR Adjustment (8.3) (10.0) (18.3) - - -
Other Enacted Fund Transfers 209.7 209.7 - -
Actual/Assumed Prior Period Adjustments 87.6 87.6 40.8 40.8
2017 Legislative session -
Revenue legislation and budget driven revenue 2,083.7 2,083.7
Additional 1% Transfer to BSA for increased revenue (20.7) (20.7)
Transfer to BSA (EORG) for increased revenue (898.3) (898.3)
Transfer from BSA (EORG) for increased revenue 898.3 898.3
Fund Transfers - FY 17 and 17-19 biennium (43.4) (43.4) 74.1 254.0 328.1
Governor's vetoes (4.6) (4.6)
Total Resources (including beginning fund balance) 38,239.4 741.0 38,980.3 43,616.2 1,085.9 44,702.1
EXPENDITURES
Enacted Budgets
2015-17 Biennium 37,754.4 699.1 38,453.5
2017 Supplemental (28.0) - (28.0)
2017-19 Budget - - - 42,659.6 1,048.8 43,708.4
Governor's vetoes 62.4 62.4
Actual/Assumed Reversions (218.8) (7.9) (226.7) (216.9) - (216.9)
Total Expenditures 37,570.0 691.1 38,261.1 42,442.8 1,048.8 43,491.5
RESERVES
Projected Ending Balance (GFS + ELTA + OPA) 669.4 49.8 719.2 1,173.5 37.1 1,210.6
Budget Stabilization Account
Budget Stabilization Account Beginning Balance 513.1 513.1 1,637.9 1,637.9
Plus Transfers from General Fund,Interest Earnings and Adjust 1,315.4 1,315.4 1,366.5 1,366.5
Less 2016 Appropriations and Reversions From BSA: Fires (152.5) (152.5) - -
Less 2017 Supplemental Appropriations (38.1) (38.1) - -
Less 17-19 Appropriations (944.2) (944.2)
Less Transfers out to GFS (EORG) for increased revenue - - (898.3) (898.3)
Projected Budget Stabilization Account Ending Balance 1,637.9 1,637.9 1,161.8 1,161.8
Total Reserves (Near General Fund plus Budget Stabilization) 2,307.2 49.8 2,357.0 2,335.3 37.1 2,372.5
Acronyms
GSR- General State Revenues
EORG- Extraordinary General State Revenues
CAFR- Comprehensive Annual Financial Report
2015-17 with Enacted Supplementals and 2017-19 Budget Balance SheetGeneral Fund-State (GFS), Education Legacy Trust Account (ELTA), Washington Opportunity Pathways Account (OPA)
and Budget Stabilization Account (BSA)
Dollars in Millions
2015-17 2017-19
House and Senate Fiscal Committees and the Office of Financial Management September 2017
Chapter 3 69
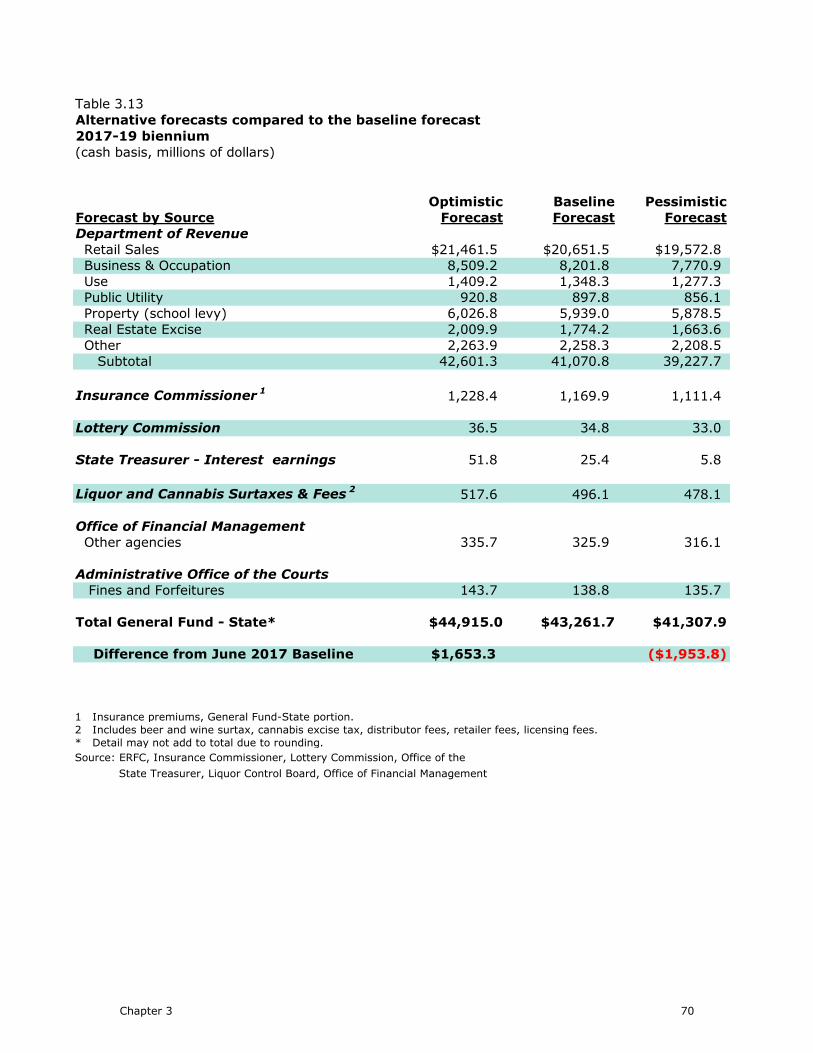
Table 3.13
Alternative forecasts compared to the baseline forecast
2017-19 biennium
(cash basis, millions of dollars)
Optimistic Baseline Pessimistic
Forecast by Source Forecast Forecast Forecast
Department of Revenue
Retail Sales $21,461.5 $20,651.5 $19,572.8
Business & Occupation 8,509.2 8,201.8 7,770.9
Use 1,409.2 1,348.3 1,277.3
Public Utility 920.8 897.8 856.1
Property (school levy) 6,026.8 5,939.0 5,878.5
Real Estate Excise 2,009.9 1,774.2 1,663.6
Other 2,263.9 2,258.3 2,208.5
Subtotal 42,601.3 41,070.8 39,227.7
Insurance Commissioner1
1,228.4 1,169.9 1,111.4
Lottery Commission 36.5 34.8 33.0
State Treasurer - Interest earnings 51.8 25.4 5.8
Liquor and Cannabis Surtaxes & Fees2
517.6 496.1 478.1
Office of Financial Management
Other agencies 335.7 325.9 316.1
Administrative Office of the Courts
Fines and Forfeitures 143.7 138.8 135.7
Total General Fund - State* $44,915.0 $43,261.7 $41,307.9
Difference from June 2017 Baseline $1,653.3 ($1,953.8)
1 Insurance premiums, General Fund-State portion.
2 Includes beer and wine surtax, cannabis excise tax, distributor fees, retailer fees, licensing fees.
* Detail may not add to total due to rounding.
Source: ERFC, Insurance Commissioner, Lottery Commission, Office of the
State Treasurer, Liquor Control Board, Office of Financial Management
Chapter 3 70

Table 3.14
Alternative forecasts compared to the baseline forecast
2019-21 biennium
(cash basis, millions of dollars)
Optimistic Baseline Pessimistic
Forecast by Source Forecast Forecast Forecast
Department of Revenue
Retail Sales $24,642.7 $22,656.4 $20,274.4
Business & Occupation 9,781.5 9,057.0 8,179.4
Use 1,549.5 1,454.8 1,316.5
Public Utility 1,010.1 961.6 878.1
Property (school levy) 7,309.6 7,053.9 6,902.4
Real Estate Excise 2,165.3 1,737.7 1,536.3
Other 2,383.3 2,262.9 2,158.8
Subtotal 48,842.0 45,184.4 41,246.0
Insurance Commissioner1
1,342.5 1,278.6 1,214.7
Lottery Commission 45.2 43.1 40.9
State Treasurer - Interest earnings 92.2 48.7 12.4
Liquor and Cannabis Surtaxes & Fees2
573.7 537.1 517.6
Office of Financial Management
Other agencies 168.8 163.9 159.0
Administrative Office of the Courts
Fines and Forfeitures 152.9 140.7 134.2
Total General Fund - State* $51,217.3 $47,396.4 $43,324.8
Difference from June 2017 Baseline $3,820.9 ($4,071.6)
1 Insurance premiums, General Fund-State portion.
2 Includes beer and wine surtax, cannabis excise tax, distributor fees, retailer fees, licensing fees.
* Detail may not add to total due to rounding.
Source: ERFC, Insurance Commissioner, Lottery Commission, Office of the
State Treasurer, Liquor Control Board, Office of Financial Management
Chapter 3 71

Table 3.15Lottery transfers by fundSeptember 2017 Forecast(cash basis, millions of dollars)
Exhibition Student School Problem Economic Opportunity Veteran's EducationLottery: Mariners Center & Achievement Construction Gambling Development Pathways VIP Legacy Trust
Total Transfers:* General Fund Stadium Stadium Account Account Account Account Account Account Account
2010 126.4 12.9 5.1 9.2 0.0 95.6 0.3 3.3 0.0 0.0 0.0 2011 137.2 8.6 5.3 9.6 0.0 9.4 0.3 4.5 99.5 0.0 0.0 2009-11 Biennium 263.6 21.5 10.4 18.8 0.0 105.0 0.5 7.9 99.5 0.0 0.0 2012 135.1 0.0 2.7 10.0 0.0 0.0 0.3 3.3 118.5 0.2 0.0 2013 139.7 0.0 0.0 10.4 0.0 0.0 0.3 3.5 125.5 0.0 0.0 2011-13 Biennium 274.8 0.0 2.7 20.4 0.0 0.0 0.6 6.9 244.0 0.2 0.0 2014 147.9 9.3 0.0 10.8 0.0 0.0 0.3 3.7 113.7 0.0 10.1 2015 143.1 0.6 0.0 11.2 0.0 0.0 0.3 4.7 120.2 0.0 6.1 2013-15 Biennium 291.0 9.9 0.0 22.0 0.0 0.0 0.6 8.4 233.9 0.0 16.1 2016 171.6 17.1 0.0 11.7 0.0 0.0 0.3 3.3 139.1 0.0 0.0 2017 157.2 14.8 0.0 12.2 0.0 0.0 0.3 4.6 124.3 0.0 0.0 2015-17 Biennium 328.8 31.9 0.0 23.8 0.0 0.0 0.7 7.9 263.5 0.0 0.0 2018 164.2 16.2 0.0 12.6 0.0 0.0 0.3 4.0 131.0 0.0 0.0 2019 164.2 18.5 0.0 13.1 0.0 0.0 0.3 4.0 128.1 0.0 0.0 2017-19 Biennium 328.4 34.8 0.0 25.8 0.0 0.0 0.7 8.0 259.1 0.0 0.0 2020 167.0 20.7 0.0 13.2 0.0 0.0 0.3 4.0 128.7 0.0 0.0 2021 169.6 22.3 0.0 14.2 0.0 0.0 0.4 4.0 128.7 0.0 0.0 2019-21 Biennium 336.6 43.1 0.0 27.4 0.0 0.0 0.7 8.0 257.4 0.0 0.0
Table 3.16Lottery transfers by fundSeptember 2017 Forecast(GAAP basis, millions of dollars)
Exhibition Student School Problem Economic Opportunity Veteran's EducationLottery: Mariners Center & Achievement Construction Gambling Development Pathways VIP Legacy Trust
Total Transfers:* General Fund Stadium Stadium Account Account Account Account Account Account Account
2010 129.4 12.9 5.1 9.2 0.0 97.4 0.3 4.6 0.0 0.0 0.0 2011 138.2 7.0 5.3 9.6 0.0 0.0 0.3 3.7 112.3 0.0 0.0 2009-11 Biennium 267.6 19.9 10.4 18.8 0.0 97.4 0.5 8.3 112.3 0.0 0.0 2012 138.0 0.0 2.7 10.0 0.0 0.0 0.3 3.0 121.8 0.2 0.0 2013 139.2 9.3 0.0 10.4 0.0 0.0 0.3 3.6 115.5 0.0 0.0 2011-13 Biennium 277.2 9.3 2.7 20.4 0.0 0.0 0.6 6.6 237.4 0.2 0.0 2014 147.7 0.6 0.0 10.8 0.0 0.0 0.3 4.0 121.9 0.0 10.1 2015 141.3 0.0 0.0 11.2 0.0 0.0 0.3 4.7 119.0 0.0 6.1 2013-15 Biennium 288.9 0.6 0.0 22.0 0.0 0.0 0.6 8.7 240.9 0.0 16.1 2016 175.5 31.9 0.0 11.7 0.0 0.0 0.3 2.8 128.7 0.0 0.0 2017 161.9 16.8 0.0 12.2 0.0 0.0 0.3 4.9 126.8 0.0 0.0 2015-17 Biennium 337.4 48.7 0.0 23.8 0.0 0.0 0.7 7.7 255.5 0.0 0.0 2018 159.5 15.7 0.0 12.6 0.0 0.0 0.3 4.0 126.9 0.0 0.0 2019 164.6 18.5 0.0 13.1 0.0 0.0 0.3 4.0 128.6 0.0 0.0 2017-19 Biennium 324.1 34.2 0.0 25.8 0.0 0.0 0.7 8.0 255.5 0.0 0.0 2020 167.7 21.0 0.0 13.7 0.0 0.0 0.3 4.0 128.7 0.0 0.0 2021 169.8 22.5 0.0 14.2 0.0 0.0 0.4 4.0 128.7 0.0 0.0 2019-21 Biennium 337.5 43.5 0.0 27.9 0.0 0.0 0.7 8.0 257.4 0.0 0.0
* Total Transfers are equal to total sales less total expenses (prizes, cost of sales, administration etc.)
Source: Lottery Commission, ERFC
Chapter 3 72

Table 3.17
General Fund-State, Education Legacy Trust Account and Opportunity Pathways Account
History and Forecast by Fiscal Year (Cash basis)
September 2017 - Millions of Dollars
Level % Chg. Level % Chg. Level % Chg. Level % Chg. Level % Chg.
History:
FY 1997 $9,449 5.8% $9,449 5.8% $9,449 5.8%
FY 1998 $10,057 6.4% $10,057 6.4% $10,057 6.4%
FY 1999 $10,414 3.6% $10,414 3.6% $10,414 3.6%
FY 2000 $11,068 6.3% $11,068 6.3% $11,068 6.3%
FY 2001 $11,560 4.4% $11,560 4.4% $11,560 4.4%
FY 2002 $11,632 0.6% $11,632 0.6% $11,632 0.6%
FY 2003 $11,721 0.8% $11,721 0.8% $11,721 0.8%
FY 2004 $12,358 5.4% $12,358 5.4% $12,358 5.4%
FY 2005 $13,036 5.5% $13,036 5.5% $13,036 5.5%
FY 2006 $14,318 9.8% $115 $14,432 10.7% $14,432 10.7%
FY 2007 $15,467 8.0% $266 132.2% $15,734 9.0% $15,734 9.0%
FY 2008 $15,659 1.2% $213 -20.1% $15,872 0.9% $15,872 0.9%
FY 2009 $14,158 -9.6% $224 5.4% $14,382 -9.4% $14,382 -9.4%
FY 2010 $13,571 -4.1% $157 -29.9% $13,728 -4.6% $13,728 -4.6%
FY 2011 $14,648 7.9% $112 -29.0% $14,759 7.5% $99 $14,859 8.2%
FY 2012 $14,874 1.5% $114 2.3% $14,988 1.6% $118 19.1% $15,107 1.7%
FY 2013 $15,783 6.1% $101 -11.5% $15,884 6.0% $126 5.9% $16,009 6.0%
FY 2014 $16,383 3.8% $197 95.3% $16,580 4.4% $114 -9.4% $16,694 4.3%
FY 2015 $17,283 5.5% $207 5.0% $17,491 5.5% $120 5.7% $17,611 5.5%
FY 2016 $18,579 7.5% $215 3.6% $18,793 7.4% $139 15.7% $18,933 7.5%
Forecast:
FY 2017 $19,733 6.2% $252 17.5% $19,985 6.3% $124 -10.6% $20,109 6.2%
FY 2018 $20,937 6.1% $248 -1.9% $21,185 6.0% $131 5.3% $21,316 6.0%
FY 2019 $22,324 6.6% $275 11.2% $22,600 6.7% $128 -2.2% $22,728 6.6%
FY 2020 $23,207 4.0% $280 1.7% $23,488 3.9% $129 0.4% $23,616 3.9%
FY 2021 $24,189 4.2% $287 2.4% $24,476 4.2% $129 0.0% $24,605 4.2%
Biennial Totals
05-07 Biennium $29,785 17.3% $381 NA $30,166 18.8% $0 NA $30,166 18.8%
07-09 Biennium $29,817 0.1% $437 14.8% $30,254 0.3% $0 NA $30,254 0.3%
09-11 Biennium $28,218 -5.4% $269 -38.5% $28,487 -5.8% $99 NA $28,586 -5.5%
11-13 Biennium $30,657 8.6% $215 -19.9% $30,872 8.4% $244 145.2% $31,116 8.8%
13-15 Biennium $33,666 9.8% $405 88.0% $34,071 10.4% $234 -4.1% $34,305 10.2%
15-17 Biennium $38,311 13.8% $467 15.4% $38,778 13.8% $263 12.6% $39,042 13.8%
17-19 Biennium $43,262 12.9% $523 11.9% $43,785 12.9% $259 -1.7% $44,044 12.8%
19-21 Biennium $47,396 9.6% $567 8.4% $47,963 9.5% $257 -0.7% $48,221 9.5%
*Education legacy trust fund excluding FY 14 and FY 15 lottery fund transfers. Includes pension stabilization fund interest in FY 08 and FY 09.
Pathways Account Total GF-S plus
(OPA) ELTA and OPA
WA Opportunity
Total GF-S
plus ELTA
Education LegacyGeneral Fund-State (GF-S)
(current defintion) Trust Fund* (ELTA)
Chapter 3 73

Table 3.18
Forecasted distribution of excise tax and license fees from cannabis sales
September 2017
Thousands of dollars
Fiscal year
Total of
cannabis
excise taxes
plus license
fees
Administrative
expenses and
pre-
distribution
allotments
Total to
distribute
DSHS
substance
abuse program
Dept. of
Health
cannabis
education
program
UW/WSU
research
Basic Health
Plan Trust
Account
Health Care
Authority
community
health
centers
OSPI dropout
prevention
General
Fund-State*
2015 $67,486 $22,074 $45,412 $5,166 $0 $0 $22,706 $2,271 $0 $15,269
2016 $168,051 $8,551 $159,500 $12,814 $7,500 $345 $79,750 $7,791 $251 $51,049
2017 $300,635 $9,201 $291,434 $27,786 $7,500 $345 $145,717 $12,979 $511 $96,596
2018 $361,731 $11,472 $350,259 $27,786 $9,761 $365 $175,130 $17,513 $513 $119,192
2019 $376,925 $10,668 $366,257 $27,786 $9,766 $365 $183,128 $18,313 $516 $126,383
2020 $386,724 $10,668 $376,056 $27,786 $9,766 $365 $188,028 $18,803 $516 $130,792
2021 $400,052 $10,668 $389,384 $27,786 $9,766 $365 $194,692 $19,469 $516 $136,790
Biennial totals
2013-15 $67,486 $22,074 $45,412 $5,166 $0 $0 $22,706 $2,271 $0 $15,269
2015-17 $468,686 $17,752 $450,934 $40,600 $15,000 $690 $225,467 $20,770 $762 $147,645
2017-19 $738,656 $22,140 $716,516 $55,572 $19,527 $730 $358,258 $35,826 $1,029 $245,574
2019-21 $786,776 $21,336 $765,440 $55,572 $19,532 $730 $382,720 $38,272 $1,032 $267,582
*Before distributions to local governments
Distribution of remaining funds
Chapter 3 74

Table 3.19
Revenue Legislation and Budget Driven Revenues
Passed in 2017 Special Legislative Sessions After the June 2017 Forecast
(Millions of dollars)
General Fund-StateBill ID and Description FY 18 FY 19 2017-19 FY 20 FY 21 2019-21 FY 22 FY 23 2021-23
Budget Driven Revenue less Governor's vetoes
Liquor control board-liquor 0.133 -0.427 -0.294 0.442 1.344 1.786 0.000
Liquor control board-marijuana 0.949 1.070 2.019 1.070 1.070 2.140 0.000
Lottery 0.315 0.512 0.827 0.139 0.512 0.651 0.000
Habitat conservation -0.485 -0.892 -1.377 -0.892 -0.892 -1.784 0.000
Marijuana distribution change 9.000 9.000 18.000 0.000 0.000 0.000 0.000
Vessel renewal notices 0.023 0.023 0.046 0.023 0.023 0.046 0.000
Tobacco arbitration settlement 15.000 15.000 0.000 0.000
Total budget driven revenue 9.935 24.286 34.221 0.782 2.057 2.839 0.000
HB 2163 Revenue
Extend economic nexus online RST 83.700 256.800 340.500 327.9 367.600 695.5 400.6 436.7 837.3
Extend economic nexus to online B&O 4.400 7.700 12.100 10.9 11.600 22.5 12.4 13.2 25.6
Repeal bottled water sales tax exemption 24.500 30.100 54.600 30.8 31.500 62.3 32.2 33 65.2
Self produced fuel exemption 1.500 5.200 6.700 8.7 12.200 20.9 13.9 13.9 27.8
Streamlined sales tax payments 9.554 14.451 24.005 20.139 21.814 41.953 0
Public utility districts 30.100 0.435 30.535 0.414 0.397 0.811 0
Total HB 2163 153.754 314.686 468.440 398.853 445.111 843.964 459.1 496.8 955.9
HB 2242 Basic Education
Property tax 541.000 1,073.200 1,614.200 1,184.800 1,308.900 2,493.700 1,384.700 1,420.200 2804.900
SB 5977 Revenue less Governor's vetoes
5135-Main street -0.500 -0.500 -1.000 -1.000 -2.000 -1.000 -1.000 -2.000
5188-Natural disasters -0.021 -0.021 -0.042 -0.020 -0.020 -0.040 -0.020 -0.020 -0.040
5260-Solar silcon manuf tax -0.397 -1.400 -1.797 -2.400 -2.500 -4.900 -2.600 -2.700 -5.300
5409-Historic auto museums tax -0.139 -0.139 -0.278 -0.140 -0.140 -0.280 -0.140 -0.140
5642-Job creation and econ dev pilot -0.542 -1.300 -1.842 -1.300 -1.300 -2.600 -1.300 -1.300 -2.600
5786-B&O exemption certain fertilizers -0.263 -0.288 -0.551 -0.300 -0.300 -0.600 -0.300 -0.300 -0.600
5205-Martial arts -0.084 -0.151 -0.235 -0.160 -0.160 -0.320 -0.160 -0.160 -0.320
5916-Semiconductor tax preferences -1.703 -1.703 -3.500 -3.500 -7.000 -3.500 -3.500 -7.000
1527-Motion picture competitiveness -3.500 -3.500 -7.000 -3.500 -3.500 -7.000 -3.500 -3.500 -7.000
5768-LET credit for universities 0.000 0.000 0.000 0.000 0.000
Total SB 5977 -4.946 -9.002 -13.948 -12.320 -12.420 -24.740 -12.520 -12.480 -25.000
HB 1716 Labor & Industries
L& I Construction registration acct -9.589 -9.589 -19.178 -9.589 -9.589 -19.178 -9.589 -9.589 -19.178
SB 5939 Solar
Renewable Energy Incentives 0.604 -5.245 -4.641 -7.659 -10.507 -18.166 -15.178 -16.804 -31.982
Summary (GF-S) FY 18 FY 19 2017-19 FY 20 FY 21 2019-21
Legislation less vetoes 680.823 1,364.050 2,044.873 1,554.085 1,721.495 3,275.580
Budget Driven less vetoes 9.935 24.286 34.221 0.782 2.057 2.839
Total 690.758 1388.336 2079.094 1554.867 1723.552 3278.419
Education Legacy Trust AccountBill ID and Description FY 18 FY 19 2017-19 FY 20 FY 21 2019-21
HB 1677 local infrastructure funding
2453-extend PWWA redirection to ELTA 105.676 108.600 214.276
Governor's Vetoes FY 18 FY 19 2017-19 FY 20 FY 21 2019-21
RTA Fee -2.229 -5.512 -7.741 -5.698 -5.891 -11.589
B&O Manufacturing Tax Rate 2.900 2.900 22.100 38.900 61.000
Budget-Driven Revenue - LCB 0.250 0.250 0.000
Total Governor's vetoes -1.979 -2.612 -4.591 16.402 33.009 49.411
Chapter 3 75

This page left intentionally blank.
Detail Components of the Washington State Economic and Revenue Forecast Calendar Years
Note: The economic data discussed in these tables were current at the time the forecast was prepared. Many concepts have changed since then due to new releases and data revisions.

This page left intentionally blank.
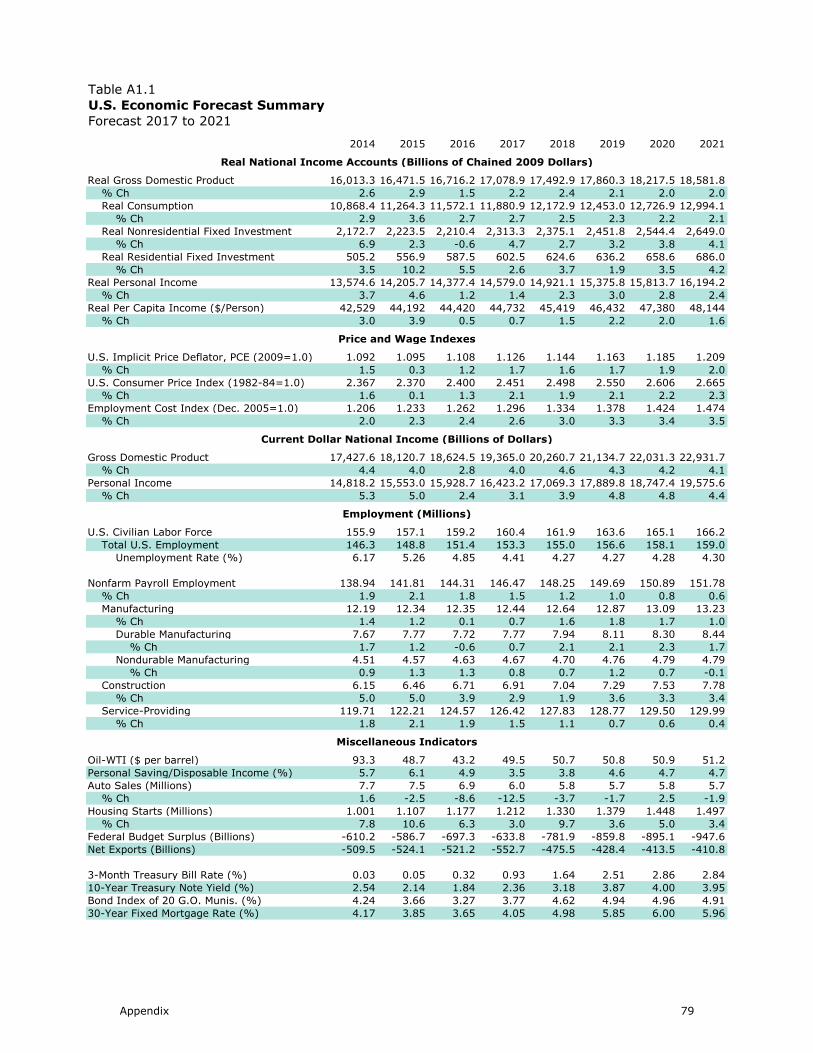
Table A1.1
U.S. Economic Forecast Summary
Forecast 2017 to 2021
2014 2015 2016 2017 2018 2019 2020 2021
Real National Income Accounts (Billions of Chained 2009 Dollars)
Real Gross Domestic Product 16,013.3 16,471.5 16,716.2 17,078.9 17,492.9 17,860.3 18,217.5 18,581.8
% Ch 2.6 2.9 1.5 2.2 2.4 2.1 2.0 2.0
Real Consumption 10,868.4 11,264.3 11,572.1 11,880.9 12,172.9 12,453.0 12,726.9 12,994.1
% Ch 2.9 3.6 2.7 2.7 2.5 2.3 2.2 2.1
Real Nonresidential Fixed Investment 2,172.7 2,223.5 2,210.4 2,313.3 2,375.1 2,451.8 2,544.4 2,649.0
% Ch 6.9 2.3 -0.6 4.7 2.7 3.2 3.8 4.1
Real Residential Fixed Investment 505.2 556.9 587.5 602.5 624.6 636.2 658.6 686.0
% Ch 3.5 10.2 5.5 2.6 3.7 1.9 3.5 4.2
Real Personal Income 13,574.6 14,205.7 14,377.4 14,579.0 14,921.1 15,375.8 15,813.7 16,194.2
% Ch 3.7 4.6 1.2 1.4 2.3 3.0 2.8 2.4
Real Per Capita Income ($/Person) 42,529 44,192 44,420 44,732 45,419 46,432 47,380 48,144
% Ch 3.0 3.9 0.5 0.7 1.5 2.2 2.0 1.6
Price and Wage Indexes
U.S. Implicit Price Deflator, PCE (2009=1.0) 1.092 1.095 1.108 1.126 1.144 1.163 1.185 1.209
% Ch 1.5 0.3 1.2 1.7 1.6 1.7 1.9 2.0
U.S. Consumer Price Index (1982-84=1.0) 2.367 2.370 2.400 2.451 2.498 2.550 2.606 2.665
% Ch 1.6 0.1 1.3 2.1 1.9 2.1 2.2 2.3
Employment Cost Index (Dec. 2005=1.0) 1.206 1.233 1.262 1.296 1.334 1.378 1.424 1.474
% Ch 2.0 2.3 2.4 2.6 3.0 3.3 3.4 3.5
Current Dollar National Income (Billions of Dollars)
Gross Domestic Product 17,427.6 18,120.7 18,624.5 19,365.0 20,260.7 21,134.7 22,031.3 22,931.7
% Ch 4.4 4.0 2.8 4.0 4.6 4.3 4.2 4.1
Personal Income 14,818.2 15,553.0 15,928.7 16,423.2 17,069.3 17,889.8 18,747.4 19,575.6
% Ch 5.3 5.0 2.4 3.1 3.9 4.8 4.8 4.4
Employment (Millions)
U.S. Civilian Labor Force 155.9 157.1 159.2 160.4 161.9 163.6 165.1 166.2
Total U.S. Employment 146.3 148.8 151.4 153.3 155.0 156.6 158.1 159.0
Unemployment Rate (%) 6.17 5.26 4.85 4.41 4.27 4.27 4.28 4.30
Nonfarm Payroll Employment 138.94 141.81 144.31 146.47 148.25 149.69 150.89 151.78
% Ch 1.9 2.1 1.8 1.5 1.2 1.0 0.8 0.6
Manufacturing 12.19 12.34 12.35 12.44 12.64 12.87 13.09 13.23
% Ch 1.4 1.2 0.1 0.7 1.6 1.8 1.7 1.0
Durable Manufacturing 7.67 7.77 7.72 7.77 7.94 8.11 8.30 8.44
% Ch 1.7 1.2 -0.6 0.7 2.1 2.1 2.3 1.7
Nondurable Manufacturing 4.51 4.57 4.63 4.67 4.70 4.76 4.79 4.79
% Ch 0.9 1.3 1.3 0.8 0.7 1.2 0.7 -0.1
Construction 6.15 6.46 6.71 6.91 7.04 7.29 7.53 7.78
% Ch 5.0 5.0 3.9 2.9 1.9 3.6 3.3 3.4
Service-Providing 119.71 122.21 124.57 126.42 127.83 128.77 129.50 129.99
% Ch 1.8 2.1 1.9 1.5 1.1 0.7 0.6 0.4
Miscellaneous Indicators
Oil-WTI ($ per barrel) 93.3 48.7 43.2 49.5 50.7 50.8 50.9 51.2
Personal Saving/Disposable Income (%) 5.7 6.1 4.9 3.5 3.8 4.6 4.7 4.7
Auto Sales (Millions) 7.7 7.5 6.9 6.0 5.8 5.7 5.8 5.7
% Ch 1.6 -2.5 -8.6 -12.5 -3.7 -1.7 2.5 -1.9
Housing Starts (Millions) 1.001 1.107 1.177 1.212 1.330 1.379 1.448 1.497
% Ch 7.8 10.6 6.3 3.0 9.7 3.6 5.0 3.4
Federal Budget Surplus (Billions) -610.2 -586.7 -697.3 -633.8 -781.9 -859.8 -895.1 -947.6
Net Exports (Billions) -509.5 -524.1 -521.2 -552.7 -475.5 -428.4 -413.5 -410.8
3-Month Treasury Bill Rate (%) 0.03 0.05 0.32 0.93 1.64 2.51 2.86 2.84
10-Year Treasury Note Yield (%) 2.54 2.14 1.84 2.36 3.18 3.87 4.00 3.95
Bond Index of 20 G.O. Munis. (%) 4.24 3.66 3.27 3.77 4.62 4.94 4.96 4.91
30-Year Fixed Mortgage Rate (%) 4.17 3.85 3.65 4.05 4.98 5.85 6.00 5.96
Appendix 79

Table A1.2
U.S. Economic Forecast Summary
Forecast 2017 to 2021
2016:1 2016:2 2016:3 2016:4 2017:1 2017:2 2017:3 2017:4
Real National Income Accounts (Billions of Chained 2009 Dollars)
Real Gross Domestic Product 16,571.6 16,663.5 16,778.1 16,851.4 16,903.2 17,030.0 17,138.9 17,243.3
% Ch , Annual Rate 0.6 2.2 2.8 1.8 1.2 3.0 2.6 2.5
Real Consumption 11,430.5 11,537.7 11,618.1 11,702.1 11,758.0 11,854.4 11,919.1 11,992.0
% Ch , Annual Rate 1.8 3.8 2.8 2.9 1.9 3.3 2.2 2.5
Real Nonresidential Fixed Investment 2,187.5 2,205.3 2,224.0 2,224.9 2,263.6 2,301.7 2,334.1 2,353.9
% Ch , Annual Rate -4.0 3.3 3.4 0.2 7.1 6.9 5.8 3.4
Real Residential Fixed Investment 593.7 586.5 579.8 589.8 605.5 595.4 600.1 608.9
% Ch , Annual Rate 13.4 -4.8 -4.5 7.1 11.1 -6.5 3.2 5.9
Real Personal Income 14,321.0 14,391.1 14,435.2 14,362.1 14,479.0 14,575.1 14,604.5 14,657.4
% Ch , Annual Rate -1.1 2.0 1.2 -2.0 3.3 2.7 0.8 1.5
Real Per Capita Income ($/Person) 44,366 44,506 44,553 44,255 44,550 44,769 44,769 44,841
% Ch , Annual Rate -1.7 1.3 0.4 -2.7 2.7 2.0 0.0 0.6
Price and Wage Indexes
U.S. Implicit Price Deflator, PCE (2009=1.0) 1.100 1.106 1.110 1.116 1.122 1.123 1.128 1.133
% Ch , Annual Rate 0.6 2.1 1.7 2.0 2.2 0.3 1.9 1.9
U.S. Consumer Price Index (1982-84=1.0) 2.380 2.394 2.404 2.422 2.441 2.439 2.453 2.469
% Ch , Annual Rate 0.1 2.3 1.8 3.0 3.1 -0.3 2.3 2.5
Employment Cost Index (Dec. 2005=1.0) 1.251 1.260 1.266 1.272 1.283 1.290 1.300 1.309
% Ch , Annual Rate 2.6 2.9 1.9 1.9 3.5 2.2 3.1 3.0
Current Dollar National Income (Billions of Dollars)
Gross Domestic Product 18,325.2 18,538.0 18,729.1 18,905.5 19,057.7 19,246.7 19,468.2 19,687.2
% Ch , Annual Rate 0.8 4.7 4.2 3.8 3.3 4.0 4.7 4.6
Personal Income 15,751.0 15,910.1 16,028.0 16,025.7 16,245.2 16,363.9 16,473.5 16,610.2
% Ch , Annual Rate -0.5 4.1 3.0 -0.1 5.6 3.0 2.7 3.4
Employment (Millions)
U.S. Civilian Labor Force 158.8 158.8 159.5 159.6 160.0 160.0 160.5 160.9
Total U.S. Employment 151.0 151.1 151.7 152.0 152.5 153.1 153.5 154.0
Unemployment Rate (%) 4.93 4.87 4.90 4.70 4.67 4.37 4.35 4.27
Nonfarm Payroll Employment 143.44 143.95 144.66 145.17 145.71 146.20 146.77 147.20
% Ch , Annual Rate 1.7 1.4 2.0 1.4 1.5 1.3 1.6 1.2
Manufacturing 12.37 12.35 12.34 12.33 12.37 12.40 12.47 12.52
% Ch , Annual Rate 0.6 -0.8 -0.1 -0.4 1.4 1.0 2.1 1.6
Durable Manufacturing 7.75 7.72 7.71 7.70 7.72 7.74 7.80 7.83
% Ch , Annual Rate -0.1 -1.6 -0.7 -0.4 1.3 1.0 3.0 1.7
Nondurable Manufacturing 4.62 4.63 4.64 4.63 4.65 4.66 4.67 4.68
% Ch , Annual Rate 1.9 0.4 1.0 -0.4 1.6 1.0 0.6 1.3
Construction 6.67 6.69 6.71 6.77 6.85 6.88 6.92 6.97
% Ch , Annual Rate 5.3 1.6 1.1 3.2 5.3 1.6 2.5 2.7
Service-Providing 123.69 124.24 124.94 125.41 125.80 126.21 126.66 126.99
% Ch , Annual Rate 1.8 1.8 2.3 1.5 1.3 1.3 1.4 1.1+
Miscellaneous Indicators
Oil-WTI ($ per barrel) 33.2 45.4 44.9 49.3 51.9 48.3 47.9 49.7
Personal Saving/Disposable Income (%) 5.7 5.3 4.8 3.6 3.9 3.7 3.3 3.2
Auto Sales (Millions) 7.1 6.8 6.8 6.8 6.2 6.0 5.8 6.0
% Ch , Annual Rate -16.0 -14.2 0.5 -1.5 -28.6 -14.7 -11.0 12.3
Housing Starts (Millions) 1.153 1.158 1.150 1.248 1.238 1.165 1.198 1.249
% Ch , Annual Rate 10.7 1.5 -2.7 39.0 -3.4 -21.4 11.6 18.3
Federal Budget Surplus (Billions) -707.5 -688.5 -679.1 -714.0 -652.8 -632.5 -627.2 -622.8
Net Exports (Billions) -526.2 -501.6 -492.8 -564.3 -582.8 -566.8 -529.8 -531.4
3-Month Treasury Bill Rate (%) 0.29 0.26 0.30 0.43 0.59 0.89 1.06 1.18
10-Year Treasury Note Yield (%) 1.92 1.75 1.56 2.13 2.44 2.26 2.26 2.49
Bond Index of 20 G.O. Munis. (%) 3.36 3.26 2.90 3.57 3.88 3.70 3.56 3.92
30-Year Fixed Mortgage Rate (%) 3.74 3.59 3.45 3.81 4.17 3.99 3.93 4.13
Appendix 80

Table A1.2 (continued)
U.S. Economic Forecast Summary
Forecast 2017 to 2021
2018:1 2018:2 2018:3 2018:4 2019:1 2019:2 2019:3 2019:4
Real National Income Accounts (Billions of Chained 2009 Dollars)
Real Gross Domestic Product 17,343.1 17,446.4 17,544.6 17,637.7 17,736.8 17,820.6 17,898.6 17,985.1
% Ch , Annual Rate 2.3 2.4 2.3 2.1 2.3 1.9 1.8 1.9
Real Consumption 12,067.3 12,140.6 12,208.9 12,275.1 12,350.5 12,420.4 12,487.4 12,553.6
% Ch , Annual Rate 2.5 2.5 2.3 2.2 2.5 2.3 2.2 2.1
Real Nonresidential Fixed Investment 2,351.3 2,362.9 2,382.3 2,403.9 2,424.0 2,443.3 2,459.5 2,480.2
% Ch , Annual Rate -0.4 2.0 3.3 3.7 3.4 3.2 2.7 3.4
Real Residential Fixed Investment 615.6 620.9 629.4 632.5 632.8 633.9 637.1 641.0
% Ch , Annual Rate 4.5 3.5 5.6 2.0 0.2 0.7 2.1 2.4
Real Personal Income 14,774.0 14,863.7 14,965.3 15,081.4 15,213.7 15,321.8 15,433.3 15,534.5
% Ch , Annual Rate 3.2 2.5 2.8 3.1 3.6 2.9 2.9 2.6
Real Per Capita Income ($/Person) 45,107 45,290 45,509 45,770 46,080 46,315 46,560 46,773
% Ch , Annual Rate 2.4 1.6 1.9 2.3 2.7 2.1 2.1 1.8
Price and Wage Indexes
U.S. Implicit Price Deflator, PCE (2009=1.0) 1.137 1.142 1.146 1.151 1.156 1.161 1.166 1.172
% Ch , Annual Rate 1.4 1.6 1.6 1.6 1.7 1.7 1.8 1.9
U.S. Consumer Price Index (1982-84=1.0) 2.479 2.492 2.504 2.517 2.530 2.543 2.556 2.571
% Ch , Annual Rate 1.7 2.1 2.0 2.0 2.1 2.1 2.2 2.3
Employment Cost Index (Dec. 2005=1.0) 1.319 1.329 1.339 1.350 1.361 1.372 1.383 1.395
% Ch , Annual Rate 3.0 3.0 3.2 3.2 3.3 3.3 3.3 3.3
Current Dollar National Income (Billions of Dollars)
Gross Domestic Product 19,915.3 20,153.4 20,378.5 20,595.4 20,824.1 21,028.5 21,232.6 21,453.6
% Ch , Annual Rate 4.7 4.9 4.5 4.3 4.5 4.0 3.9 4.2
Personal Income 16,799.2 16,969.4 17,153.1 17,355.5 17,581.6 17,783.4 17,994.7 18,199.4
% Ch , Annual Rate 4.6 4.1 4.4 4.8 5.3 4.7 4.8 4.6
Employment (Millions)
U.S. Civilian Labor Force 161.3 161.6 162.1 162.5 162.9 163.4 163.8 164.2
Total U.S. Employment 154.4 154.8 155.1 155.6 156.0 156.4 156.8 157.1
Unemployment Rate (%) 4.28 4.26 4.28 4.27 4.26 4.26 4.28 4.29
Nonfarm Payroll Employment 147.60 148.06 148.49 148.86 149.25 149.58 149.84 150.10
% Ch , Annual Rate 1.1 1.2 1.2 1.0 1.1 0.9 0.7 0.7
Manufacturing 12.55 12.63 12.67 12.71 12.78 12.83 12.90 12.97
% Ch , Annual Rate 1.0 2.5 1.4 1.4 2.0 1.7 2.2 2.1
Durable Manufacturing 7.87 7.93 7.96 8.00 8.04 8.08 8.13 8.19
% Ch , Annual Rate 1.8 3.1 1.8 1.8 2.1 1.9 2.6 2.7
Nondurable Manufacturing 4.68 4.70 4.71 4.71 4.73 4.75 4.77 4.78
% Ch , Annual Rate -0.3 1.5 0.6 0.7 1.8 1.4 1.4 1.1
Construction 6.99 7.01 7.04 7.11 7.19 7.26 7.32 7.39
% Ch , Annual Rate 1.2 1.0 2.1 3.6 4.7 4.0 3.7 3.4
Service-Providing 127.33 127.68 128.03 128.28 128.53 128.73 128.85 128.98
% Ch , Annual Rate 1.1 1.1 1.1 0.8 0.8 0.6 0.4 0.4
Miscellaneous Indicators
Oil-WTI ($ per barrel) 50.5 50.8 50.8 50.8 50.8 50.8 50.8 50.8
Personal Saving/Disposable Income (%) 3.7 3.7 3.9 4.1 4.4 4.5 4.6 4.7
Auto Sales (Millions) 6.0 5.8 5.7 5.7 5.7 5.7 5.7 5.8
% Ch , Annual Rate -0.9 -12.2 -5.1 -2.2 -1.8 -0.3 3.5 4.9
Housing Starts (Millions) 1.316 1.322 1.331 1.352 1.353 1.370 1.387 1.403
% Ch , Annual Rate 23.2 1.8 2.8 6.3 0.5 5.1 5.0 4.7
Federal Budget Surplus (Billions) -752.0 -774.9 -794.4 -806.3 -849.6 -864.5 -860.4 -864.9
Net Exports (Billions) -513.0 -485.7 -459.1 -444.0 -434.7 -432.5 -427.3 -419.2
3-Month Treasury Bill Rate (%) 1.37 1.49 1.73 1.97 2.15 2.41 2.63 2.85
10-Year Treasury Note Yield (%) 2.88 3.08 3.30 3.45 3.60 3.79 4.03 4.07
Bond Index of 20 G.O. Munis. (%) 4.35 4.60 4.73 4.79 4.86 4.91 4.98 5.00
30-Year Fixed Mortgage Rate (%) 4.58 4.86 5.11 5.37 5.52 5.80 6.01 6.06
Appendix 81

Table A1.2 (continued)
U.S. Economic Forecast Summary
Forecast 2017 to 2021
2020:1 2020:2 2020:3 2020:4 2021:1 2021:2 2021:3 2021:4
Real National Income Accounts (Billions of Chained 2009 Dollars)
Real Gross Domestic Product 18,072.8 18,175.8 18,265.7 18,355.7 18,445.1 18,536.4 18,627.9 18,718.1
% Ch , Annual Rate 2.0 2.3 2.0 2.0 2.0 2.0 2.0 2.0
Real Consumption 12,621.8 12,694.9 12,762.5 12,828.4 12,894.9 12,961.8 13,026.2 13,093.5
% Ch , Annual Rate 2.2 2.3 2.1 2.1 2.1 2.1 2.0 2.1
Real Nonresidential Fixed Investment 2,505.2 2,529.9 2,557.0 2,585.4 2,613.8 2,639.0 2,661.5 2,681.8
% Ch , Annual Rate 4.1 4.0 4.4 4.5 4.5 3.9 3.5 3.1
Real Residential Fixed Investment 646.0 653.3 662.9 672.0 677.1 682.6 690.0 694.5
% Ch , Annual Rate 3.2 4.6 6.0 5.6 3.1 3.3 4.4 2.6
Real Personal Income 15,660.9 15,770.4 15,867.9 15,955.7 16,063.4 16,154.7 16,237.3 16,321.5
% Ch , Annual Rate 3.3 2.8 2.5 2.2 2.7 2.3 2.1 2.1
Real Per Capita Income ($/Person) 47,060 47,297 47,496 47,666 47,894 48,074 48,226 48,383
% Ch , Annual Rate 2.5 2.0 1.7 1.4 1.9 1.5 1.3 1.3
Price and Wage Indexes
U.S. Implicit Price Deflator, PCE (2009=1.0) 1.177 1.183 1.188 1.194 1.200 1.206 1.212 1.218
% Ch , Annual Rate 1.9 1.9 1.9 1.9 2.0 2.0 2.0 2.1
U.S. Consumer Price Index (1982-84=1.0) 2.585 2.599 2.613 2.628 2.643 2.658 2.673 2.688
% Ch , Annual Rate 2.3 2.2 2.2 2.3 2.3 2.2 2.3 2.3
Employment Cost Index (Dec. 2005=1.0) 1.406 1.418 1.430 1.442 1.454 1.467 1.481 1.494
% Ch , Annual Rate 3.3 3.4 3.4 3.4 3.5 3.6 3.7 3.7
Current Dollar National Income (Billions of Dollars)
Gross Domestic Product 21,685.0 21,924.2 22,146.4 22,369.4 22,598.3 22,818.9 23,042.0 23,267.7
% Ch , Annual Rate 4.4 4.5 4.1 4.1 4.2 4.0 4.0 4.0
Personal Income 18,435.6 18,650.6 18,853.8 19,049.4 19,272.6 19,476.5 19,674.2 19,878.8
% Ch , Annual Rate 5.3 4.7 4.4 4.2 4.8 4.3 4.1 4.2
Employment (Millions)
U.S. Civilian Labor Force 164.6 165.0 165.3 165.6 165.8 166.0 166.3 166.5
Total U.S. Employment 157.5 157.9 158.3 158.5 158.7 158.9 159.1 159.3
Unemployment Rate (%) 4.29 4.28 4.27 4.27 4.28 4.29 4.30 4.32
Nonfarm Payroll Employment 150.37 150.94 151.05 151.21 151.43 151.67 151.90 152.11
% Ch, Annual Rate 0.7 1.5 0.3 0.4 0.6 0.6 0.6 0.6
Manufacturing 13.02 13.06 13.12 13.17 13.19 13.22 13.24 13.26
% Ch, Annual Rate 1.7 1.3 1.8 1.5 0.8 0.7 0.7 0.6
Durable Manufacturing 8.23 8.27 8.32 8.37 8.40 8.42 8.45 8.48
% Ch, Annual Rate 2.3 1.9 2.5 2.2 1.4 1.2 1.4 1.2
Nondurable Manufacturing 4.79 4.79 4.80 4.80 4.80 4.79 4.79 4.78
% Ch, Annual Rate 0.6 0.3 0.6 0.3 -0.2 -0.4 -0.4 -0.5
Construction 7.44 7.50 7.56 7.62 7.68 7.75 7.82 7.89
% Ch, Annual Rate 3.0 3.0 3.3 3.4 3.3 3.5 3.9 3.4
Service-Providing 129.14 129.61 129.60 129.65 129.77 129.93 130.06 130.19
% Ch, Annual Rate 0.5 1.5 0.0 0.1 0.4 0.5 0.4 0.4
Miscellaneous Indicators
Oil-WTI ($ per barrel) 50.8 50.8 50.9 51.0 51.1 51.2 51.3 51.5
Personal Saving/Disposable Income (%) 4.8 4.8 4.7 4.6 4.8 4.7 4.7 4.7
Auto Sales (Millions) 5.8 5.8 5.9 5.9 5.8 5.8 5.7 5.7
% Ch, Annual Rate 2.3 2.7 1.3 -0.7 -2.9 -3.5 -3.5 -4.0
Housing Starts (Millions) 1.421 1.439 1.460 1.470 1.486 1.496 1.504 1.504
% Ch, Annual Rate 5.0 5.3 6.0 2.6 4.4 2.6 2.2 0.1
Federal Budget Surplus (Billions) -901.7 -907.7 -887.4 -883.8 -932.7 -944.3 -951.1 -962.4
Net Exports (Billions) -415.1 -412.9 -412.4 -413.5 -415.9 -414.1 -409.8 -403.5
3-Month Treasury Bill Rate (%) 2.86 2.86 2.86 2.85 2.85 2.85 2.84 2.84
10-Year Treasury Note Yield (%) 4.03 4.01 3.99 3.97 3.96 3.95 3.95 3.95
Bond Index of 20 G.O. Munis. (%) 4.99 4.97 4.95 4.94 4.92 4.91 4.90 4.90
30-Year Fixed Mortgage Rate (%) 6.04 6.01 5.98 5.97 5.95 5.95 5.96 5.96
Appendix 82

Table A1.3
Washington Economic Forecast Summary
Forecast 2017 to 2021
2014 2015 2016 2017 2018 2019 2020 2021
Real Income (Billions of Chained 2009 Dollars)
Real Personal Income 325.834 339.898 351.108 365.409 375.922 389.999 403.496 415.482
% Ch 5.2 4.3 3.3 4.1 2.9 3.7 3.5 3.0
Real Wage and Salary Disb. 166.465 175.191 184.223 194.240 199.378 205.645 211.418 217.357
% Ch 4.9 5.2 5.2 5.4 2.6 3.1 2.8 2.8
Real Nonwage Income 159.369 164.707 166.884 171.169 176.544 184.354 192.078 198.124
% Ch 5.5 3.3 1.3 2.6 3.1 4.4 4.2 3.1
Real Per Capita Income ($/Person) 46,164 47,444 48,169 49,277 49,902 51,011 52,053 52,898
% Ch 3.9 2.8 1.5 2.3 1.3 2.2 2.0 1.6
Price and Wage Indexes
U.S. Implicit Price Deflator, PCE (2009=1.0) 1.092 1.095 1.108 1.126 1.144 1.163 1.185 1.209
% Ch 1.5 0.3 1.2 1.7 1.6 1.7 1.9 2.0
Seattle Cons. Price Index (1982-84=1.0) 2.460 2.494 2.550 2.623 2.677 2.735 2.797 2.863
% Ch 1.8 1.4 2.3 2.9 2.1 2.1 2.3 2.3
Average Nonfarm Annual Wage 57,225 58,747 60,704 63,402 64,739 66,841 69,096 71,664
% Ch 4.2 2.7 3.3 4.4 2.1 3.2 3.4 3.7
Avg. Hourly Earnings-Mfg. ($/Hour) 25.16 25.52 26.42 27.32 28.20 29.03 29.92 30.90
% Ch 3.4 1.4 3.5 3.4 3.2 3.0 3.1 3.3
Current Dollar Income (Billions of Dollars)
Personal Income 355.677 372.125 388.989 411.623 430.047 453.767 478.354 502.238
% Ch 6.8 4.6 4.5 5.8 4.5 5.5 5.4 5.0
Disposable Personal Income 312.818 325.758 341.120 360.782 378.299 398.602 417.899 437.633
% Ch 6.6 4.1 4.7 5.8 4.9 5.4 4.8 4.7
Per Capita Income ($/Person) 50,391 51,942 53,365 55,508 57,086 59,351 61,709 63,943
% Ch 5.4 3.1 2.7 4.0 2.8 4.0 4.0 3.6
Employment (Thousands)
Washington Civilian Labor Force 3,487.9 3,544.8 3,641.6 3,710.5 3,787.1 3,858.7 3,924.3 3,979.9
Total Washington Employment 3,275.3 3,345.5 3,443.4 3,539.4 3,620.4 3,690.5 3,754.0 3,807.3
Unemployment Rate (%) 6.10 5.62 5.44 4.61 4.40 4.36 4.34 4.34
Nonfarm Payroll Employment 3,056.8 3,145.7 3,242.3 3,335.0 3,405.4 3,461.3 3,508.7 3,547.4
% Ch 2.5 2.9 3.1 2.9 2.1 1.6 1.4 1.1
Manufacturing 288.8 291.8 289.9 284.5 286.3 290.7 294.9 298.5
% Ch 0.7 1.1 -0.7 -1.8 0.6 1.5 1.4 1.2
Durable Manufacturing 210.0 211.1 207.4 200.8 201.4 203.9 206.6 209.6
% Ch 0.2 0.5 -1.7 -3.2 0.3 1.2 1.4 1.4
Aerospace 94.2 94.0 90.9 83.8 80.1 78.5 77.9 77.9
% Ch -1.9 -0.2 -3.3 -7.9 -4.4 -2.0 -0.8 0.0
Nondurable Manufacturing 78.8 80.8 82.4 83.7 84.9 86.8 88.2 88.9
% Ch 2.3 2.5 2.1 1.6 1.4 2.2 1.6 0.8
Construction 159.7 173.3 186.5 201.0 206.5 208.3 209.4 209.6
% Ch 7.2 8.5 7.6 7.8 2.7 0.9 0.5 0.1
Service-Providing 2,602.1 2,674.2 2,759.7 2,843.4 2,906.3 2,956.0 2,998.1 3,032.8
% Ch 2.4 2.8 3.2 3.0 2.2 1.7 1.4 1.2
Software Publishers 55.6 55.9 58.8 61.4 61.9 62.4 62.9 63.5
% Ch 3.3 0.5 5.2 4.4 0.9 0.7 0.8 1.0
Housing Indicators (Thousands)
Housing Units Authorized by Bldg. Permit 33.898 40.374 44.077 43.026 43.357 41.893 42.083 42.020
% Ch 2.8 19.1 9.2 -2.4 0.8 -3.4 0.5 -0.2
Single-Family 17.905 19.797 22.463 23.070 25.209 25.599 26.050 26.344
% Ch -2.7 10.6 13.5 2.7 9.3 1.5 1.8 1.1
Multi-Family 15.993 20.577 21.614 19.956 18.148 16.294 16.033 15.676
% Ch 9.8 28.7 5.0 -7.7 -9.1 -10.2 -1.6 -2.2
30-Year Fixed Mortgage Rate (%) 4.17 3.85 3.65 4.05 4.98 5.85 6.00 5.96
Appendix 83

Table A1.4
Washington Economic Forecast Summary
Forecast 2017 to 2021
2016:1 2016:2 2016:3 2016:4 2017:1 2017:2 2017:3 2017:4
Real Income (Billions of Chained 2009 Dollars)
Real Personal Income 347.026 349.981 352.904 354.519 362.421 365.291 366.169 367.755
% Ch, Annual Rate 4.5 3.4 3.4 1.8 9.2 3.2 1.0 1.7
Real Wage and Salary Disb. 181.906 183.847 185.723 185.417 192.602 194.439 194.570 195.347
% Ch, Annual Rate 7.9 4.3 4.1 -0.7 16.4 3.9 0.3 1.6
Real Nonwage Income 165.120 166.134 167.181 169.102 169.819 170.852 171.599 172.408
% Ch, Annual Rate 0.9 2.5 2.5 4.7 1.7 2.5 1.8 1.9
Real Per Capita Income ($/Person) 47,929 48,129 48,309 48,310 49,181 49,363 49,271 49,292
% Ch, Annual Rate 2.8 1.7 1.5 0.0 7.4 1.5 -0.7 0.2
Price and Wage Indexes
U.S. Implicit Price Deflator, PCE (2009=1.0) 1.100 1.106 1.110 1.116 1.122 1.123 1.128 1.133
% Ch, Annual Rate 0.6 2.1 1.7 2.0 2.2 0.3 1.9 1.9
Seattle Cons. Price Index (1982-84=1.0) 2.527 2.541 2.557 2.575 2.608 2.617 2.624 2.642
% Ch, Annual Rate 2.3 2.3 2.5 3.0 5.1 1.5 1.0 2.8
Average Nonfarm Annual Wage 60,080 60,593 61,139 61,004 63,172 63,402 63,404 63,632
% Ch, Annual Rate 3.8 3.5 3.7 -0.9 15.0 1.5 0.0 1.4
Avg. Hourly Earnings-Mfg. ($/Hour) 26.06 26.39 26.71 26.53 26.93 27.05 27.55 27.73
% Ch, Annual Rate 3.4 5.1 5.0 -2.7 6.2 1.8 7.7 2.6
Current Dollar Income (Billions of Dollars)
Personal Income 381.664 386.905 391.825 395.563 406.607 410.103 413.031 416.750
% Ch, Annual Rate 5.2 5.6 5.2 3.9 11.6 3.5 2.9 3.7
Disposable Personal Income 334.925 339.467 343.331 346.759 356.078 359.599 362.100 365.351
% Ch, Annual Rate 6.6 5.5 4.6 4.1 11.2 4.0 2.8 3.6
Per Capita Income ($/Person) 52,713 53,207 53,637 53,903 55,177 55,419 55,576 55,859
% Ch, Annual Rate 3.4 3.8 3.3 2.0 9.8 1.8 1.1 2.1
Employment (Thousands)
Washington Civilian Labor Force 3,605.2 3,631.1 3,656.5 3,673.8 3,685.9 3,692.0 3,722.9 3,741.2
Total Washington Employment 3,403.1 3,429.6 3,458.6 3,482.5 3,505.4 3,523.8 3,553.5 3,574.7
Unemployment Rate (%) 5.61 5.55 5.41 5.21 4.90 4.56 4.55 4.45
Nonfarm Payroll Employment 3,207.3 3,234.2 3,254.3 3,273.5 3,305.1 3,327.1 3,345.2 3,362.7
% Ch, Annual Rate 4.2 3.4 2.5 2.4 3.9 2.7 2.2 2.1
Manufacturing 292.5 291.8 289.1 286.0 286.0 284.5 284.0 283.6
% Ch, Annual Rate 0.5 -0.9 -3.6 -4.3 0.0 -2.0 -0.8 -0.6
Durable Manufacturing 210.3 209.0 206.9 203.4 202.4 201.2 200.2 199.3
% Ch, Annual Rate -1.0 -2.4 -4.0 -6.7 -1.9 -2.4 -2.0 -1.8
Aerospace 93.0 92.0 90.7 88.0 86.6 84.6 82.8 81.1
% Ch, Annual Rate -2.0 -4.1 -5.5 -11.5 -6.1 -9.0 -8.3 -7.8
Nondurable Manufacturing 82.2 82.8 82.2 82.6 83.5 83.3 83.8 84.3
% Ch, Annual Rate 4.4 2.7 -2.7 1.8 4.7 -1.0 2.2 2.5
Construction 182.3 184.9 187.3 191.5 197.7 200.9 201.4 204.0
% Ch, Annual Rate 16.5 5.9 5.4 9.2 13.6 6.6 0.9 5.3
Service-Providing 2,726.2 2,751.2 2,771.6 2,789.9 2,815.3 2,835.5 2,853.8 2,869.0
% Ch, Annual Rate 3.8 3.7 3.0 2.7 3.7 2.9 2.6 2.2
Software Publishers 57.5 58.4 59.3 60.0 60.8 61.0 61.9 61.9
% Ch, Annual Rate 4.8 6.4 6.6 4.2 5.4 1.8 5.8 0.3
Housing Indicators (Thousands)
Housing Units Authorized by Bldg. Permit 38.878 45.489 40.012 51.930 40.797 43.879 43.557 43.869
% Ch, Annual Rate 16.4 87.4 -40.1 183.7 -61.9 33.8 -2.9 2.9
Single-Family 22.671 23.001 21.495 22.685 21.976 22.467 23.650 24.186
% Ch, Annual Rate 25.5 5.9 -23.7 24.1 -11.9 9.2 22.8 9.4
Multi-Family 16.206 22.488 18.517 29.245 18.821 21.413 19.907 19.683
% Ch, Annual Rate 5.0 270.7 -54.0 522.1 -82.8 67.5 -25.3 -4.4
30-Year Fixed Mortgage Rate (%) 3.74 3.59 3.45 3.81 4.17 3.99 3.93 4.13
Appendix 84

Table A1.4 (continued)
Washington Economic Forecast Summary
Forecast 2017 to 2021
2018:1 2018:2 2018:3 2018:4 2019:1 2019:2 2019:3 2019:4
Real Income (Billions of Chained 2009 Dollars)
Real Personal Income 371.248 374.127 377.390 380.922 384.897 388.324 391.775 394.999
% Ch, Annual Rate 3.9 3.1 3.5 3.8 4.2 3.6 3.6 3.3
Real Wage and Salary Disb. 197.048 198.587 200.169 201.707 203.460 204.991 206.367 207.760
% Ch, Annual Rate 3.5 3.2 3.2 3.1 3.5 3.0 2.7 2.7
Real Nonwage Income 174.200 175.541 177.221 179.215 181.436 183.333 185.408 187.239
% Ch, Annual Rate 4.2 3.1 3.9 4.6 5.1 4.2 4.6 4.0
Real Per Capita Income ($/Person) 49,568 49,759 50,002 50,280 50,617 50,883 51,152 51,393
% Ch, Annual Rate 2.3 1.6 2.0 2.2 2.7 2.1 2.1 1.9
Price and Wage Indexes
U.S. Implicit Price Deflator, PCE (2009=1.0) 1.137 1.142 1.146 1.151 1.156 1.161 1.166 1.172
% Ch, Annual Rate 1.4 1.6 1.6 1.6 1.7 1.7 1.8 1.9
Seattle Cons. Price Index (1982-84=1.0) 2.656 2.671 2.684 2.698 2.712 2.727 2.742 2.758
% Ch, Annual Rate 2.1 2.2 2.1 2.1 2.1 2.1 2.2 2.3
Average Nonfarm Annual Wage 64,047 64,486 64,959 65,465 66,014 66,560 67,113 67,676
% Ch, Annual Rate 2.6 2.8 3.0 3.2 3.4 3.3 3.4 3.4
Avg. Hourly Earnings-Mfg. ($/Hour) 27.92 28.10 28.29 28.50 28.71 28.93 29.14 29.36
% Ch, Annual Rate 2.7 2.6 2.8 2.9 3.0 3.0 3.0 3.0
Current Dollar Income (Billions of Dollars)
Personal Income 422.138 427.129 432.560 438.362 444.802 450.711 456.796 462.759
% Ch, Annual Rate 5.3 4.8 5.2 5.5 6.0 5.4 5.5 5.3
Disposable Personal Income 371.247 375.825 380.683 385.440 391.304 396.195 401.058 405.851
% Ch, Annual Rate 6.6 5.0 5.3 5.1 6.2 5.1 5.0 4.9
Per Capita Income ($/Person) 56,362 56,809 57,312 57,862 58,495 59,057 59,642 60,209
% Ch, Annual Rate 3.7 3.2 3.6 3.9 4.4 3.9 4.0 3.9
Employment (Thousands)
Washington Civilian Labor Force 3,759.8 3,777.6 3,796.0 3,814.9 3,832.5 3,850.2 3,867.6 3,884.5
Total Washington Employment 3,593.3 3,611.6 3,629.0 3,647.7 3,665.4 3,682.5 3,698.9 3,715.1
Unemployment Rate (%) 4.43 4.39 4.40 4.38 4.36 4.36 4.36 4.36
Nonfarm Payroll Employment 3,380.6 3,398.0 3,414.3 3,428.5 3,443.1 3,456.2 3,467.1 3,478.9
% Ch, Annual Rate 2.1 2.1 1.9 1.7 1.7 1.5 1.3 1.4
Manufacturing 284.4 286.1 287.0 287.8 289.1 290.1 291.3 292.3
% Ch, Annual Rate 1.2 2.4 1.2 1.2 1.8 1.4 1.6 1.3
Durable Manufacturing 200.1 201.3 201.9 202.4 203.0 203.5 204.2 204.8
% Ch, Annual Rate 1.7 2.3 1.2 1.1 1.2 1.0 1.3 1.1
Aerospace 80.7 80.3 79.9 79.5 79.1 78.7 78.3 77.9
% Ch, Annual Rate -2.0 -2.0 -2.0 -2.0 -2.0 -2.0 -2.0 -2.0
Nondurable Manufacturing 84.3 84.8 85.1 85.4 86.1 86.6 87.1 87.5
% Ch, Annual Rate 0.0 2.6 1.4 1.4 3.2 2.4 2.2 1.9
Construction 206.0 206.3 206.7 207.0 207.7 208.2 208.2 208.9
% Ch, Annual Rate 4.1 0.5 0.7 0.6 1.4 1.0 0.0 1.2
Service-Providing 2,883.9 2,899.5 2,914.4 2,927.4 2,940.0 2,951.5 2,961.3 2,971.4
% Ch, Annual Rate 2.1 2.2 2.1 1.8 1.7 1.6 1.3 1.4
Software Publishers 61.9 61.9 61.9 62.1 62.2 62.3 62.4 62.5
% Ch, Annual Rate -0.3 -0.1 0.2 1.0 0.7 0.7 0.9 0.8
Housing Indicators (Thousands)
Housing Units Authorized by Bldg. Permit 44.325 43.674 42.930 42.499 42.134 41.951 41.784 41.703
% Ch, Annual Rate 4.2 -5.7 -6.6 -4.0 -3.4 -1.7 -1.6 -0.8
Single-Family 24.879 25.131 25.346 25.479 25.511 25.535 25.612 25.737
% Ch, Annual Rate 12.0 4.1 3.5 2.1 0.5 0.4 1.2 2.0
Multi-Family 19.446 18.543 17.584 17.020 16.622 16.415 16.173 15.966
% Ch, Annual Rate -4.7 -17.3 -19.1 -12.2 -9.0 -4.9 -5.8 -5.0
30-Year Fixed Mortgage Rate (%) 4.58 4.86 5.11 5.37 5.52 5.80 6.01 6.06
Appendix 85

Table A1.4 (continued)
Washington Economic Forecast Summary
Forecast 2017 to 2021
2020:1 2020:2 2020:3 2020:4 2021:1 2021:2 2021:3 2021:4
Real Income (Billions of Chained 2009 Dollars)
Real Personal Income 398.682 402.135 405.152 408.016 411.334 414.206 416.856 419.530
% Ch, Annual Rate 3.8 3.5 3.0 2.9 3.3 2.8 2.6 2.6
Real Wage and Salary Disb. 209.162 210.764 212.157 213.587 215.178 216.637 218.098 219.517
% Ch, Annual Rate 2.7 3.1 2.7 2.7 3.0 2.7 2.7 2.6
Real Nonwage Income 189.520 191.371 192.995 194.429 196.157 197.569 198.758 200.013
% Ch, Annual Rate 5.0 4.0 3.4 3.0 3.6 2.9 2.4 2.6
Real Per Capita Income ($/Person) 51,694 51,965 52,180 52,374 52,627 52,822 52,988 53,157
% Ch, Annual Rate 2.4 2.1 1.7 1.5 1.9 1.5 1.3 1.3
Price and Wage Indexes
U.S. Implicit Price Deflator, PCE (2009=1.0) 1.177 1.183 1.188 1.194 1.200 1.206 1.212 1.218
% Ch, Annual Rate 1.9 1.9 1.9 1.9 2.0 2.0 2.0 2.1
Seattle Cons. Price Index (1982-84=1.0) 2.774 2.789 2.805 2.821 2.838 2.854 2.871 2.888
% Ch, Annual Rate 2.3 2.3 2.3 2.3 2.4 2.3 2.3 2.4
Average Nonfarm Annual Wage 68,248 68,732 69,381 70,024 70,685 71,326 71,989 72,657
% Ch, Annual Rate 3.4 2.9 3.8 3.8 3.8 3.7 3.8 3.8
Avg. Hourly Earnings-Mfg. ($/Hour) 29.58 29.81 30.04 30.27 30.51 30.76 31.02 31.29
% Ch, Annual Rate 3.0 3.1 3.1 3.1 3.3 3.3 3.4 3.5
Current Dollar Income (Billions of Dollars)
Personal Income 469.318 475.580 481.389 487.127 493.513 499.378 505.093 510.969
% Ch, Annual Rate 5.8 5.4 5.0 4.9 5.3 4.8 4.7 4.7
Disposable Personal Income 410.940 415.738 420.158 424.762 430.395 435.170 440.012 444.955
% Ch, Annual Rate 5.1 4.8 4.3 4.5 5.4 4.5 4.5 4.6
Per Capita Income ($/Person) 60,853 61,456 61,999 62,529 63,141 63,683 64,204 64,743
% Ch, Annual Rate 4.3 4.0 3.6 3.5 4.0 3.5 3.3 3.4
Employment (Thousands)
Washington Civilian Labor Force 3,900.7 3,917.2 3,932.7 3,946.7 3,960.2 3,973.2 3,986.4 3,999.7
Total Washington Employment 3,730.4 3,747.1 3,762.3 3,776.2 3,789.1 3,801.2 3,813.3 3,825.4
Unemployment Rate (%) 4.37 4.34 4.33 4.32 4.32 4.33 4.34 4.36
Nonfarm Payroll Employment 3,488.8 3,507.6 3,514.7 3,523.6 3,533.1 3,542.8 3,552.2 3,561.6
% Ch, Annual Rate 1.1 2.2 0.8 1.0 1.1 1.1 1.1 1.1
Manufacturing 293.3 294.2 295.4 296.5 297.3 298.1 298.9 299.8
% Ch, Annual Rate 1.5 1.2 1.6 1.5 1.1 1.0 1.1 1.2
Durable Manufacturing 205.5 206.2 207.0 207.9 208.5 209.2 210.0 210.7
% Ch, Annual Rate 1.5 1.2 1.6 1.7 1.3 1.3 1.5 1.5
Aerospace 77.9 77.9 77.9 77.9 77.9 77.9 77.9 77.9
% Ch, Annual Rate 0.0 0.0 0.0 0.0 0.0 0.0 0.0 0.0
Nondurable Manufacturing 87.8 88.0 88.4 88.6 88.8 88.9 89.0 89.1
% Ch, Annual Rate 1.4 1.1 1.6 1.2 0.7 0.5 0.4 0.4
Construction 208.6 209.2 209.6 210.0 209.8 209.7 209.5 209.4
% Ch, Annual Rate -0.5 1.1 0.8 0.7 -0.3 -0.3 -0.2 -0.2
Service-Providing 2,980.4 2,997.8 3,003.3 3,010.7 3,019.5 3,028.7 3,037.3 3,045.9
% Ch, Annual Rate 1.2 2.4 0.7 1.0 1.2 1.2 1.1 1.1
Software Publishers 62.7 62.8 63.0 63.1 63.3 63.4 63.6 63.7
% Ch, Annual Rate 0.8 0.8 0.9 0.9 1.0 1.0 1.0 1.0
Housing Indicators (Thousands)
Housing Units Authorized by Bldg. Permit 41.824 42.027 42.234 42.247 42.207 42.104 41.992 41.776
% Ch, Annual Rate 1.2 2.0 2.0 0.1 -0.4 -1.0 -1.1 -2.0
Single-Family 25.823 25.996 26.150 26.231 26.307 26.381 26.379 26.307
% Ch, Annual Rate 1.3 2.7 2.4 1.2 1.2 1.1 0.0 -1.1
Multi-Family 16.001 16.031 16.084 16.016 15.900 15.723 15.613 15.468
% Ch, Annual Rate 0.9 0.7 1.3 -1.7 -2.9 -4.4 -2.8 -3.7
30-Year Fixed Mortgage Rate (%) 6.04 6.01 5.98 5.97 5.95 5.95 5.96 5.96
Appendix 86

Table A2.1
U.S. Nonagricultural Employment by Industry (Millions)
Forecast 2017 to 2021
2014 2015 2016 2017 2018 2019 2020 2021
Nonfarm Payroll Employment 138.94 141.81 144.31 146.47 148.25 149.69 150.89 151.78 % Ch 1.9 2.1 1.8 1.5 1.2 1.0 0.8 0.6 Manufacturing 12.19 12.34 12.35 12.44 12.64 12.87 13.09 13.23 % Ch 1.4 1.2 0.1 0.7 1.6 1.8 1.7 1.0 Durable Manufacturing 7.67 7.77 7.72 7.77 7.94 8.11 8.30 8.44 % Ch 1.7 1.2 -0.6 0.7 2.1 2.1 2.3 1.7 Wood Products 0.37 0.38 0.39 0.40 0.42 0.43 0.45 0.48 % Ch 5.2 2.9 2.5 1.2 4.8 4.4 4.4 6.1 Primary and Fabricated Metals 1.85 1.85 1.80 1.83 1.87 1.92 1.99 2.04 % Ch 1.4 0.0 -2.7 1.2 2.2 3.0 3.7 2.2 Computer and Electronic Products 1.05 1.05 1.05 1.04 1.09 1.11 1.11 1.11 % Ch -1.5 0.4 -0.5 -0.6 4.6 2.4 -0.1 -0.1 Machinery and Electrical Equipment 1.50 1.50 1.46 1.48 1.52 1.57 1.60 1.62 % Ch 1.8 0.0 -2.7 1.2 2.7 3.0 1.8 1.5 Transportation Equipment 1.56 1.60 1.62 1.62 1.61 1.61 1.67 1.71 % Ch 3.3 2.9 1.3 0.0 -0.8 -0.1 3.9 2.0 Other Durables 1.34 1.37 1.39 1.40 1.44 1.46 1.47 1.48 % Ch 1.7 2.4 1.4 1.2 2.2 1.8 0.7 0.6 Nondurable Manufacturing 4.51 4.57 4.63 4.67 4.70 4.76 4.79 4.79 % Ch 0.9 1.3 1.3 0.8 0.7 1.2 0.7 -0.1 Food Manufacturing 1.48 1.51 1.55 1.59 1.62 1.67 1.69 1.71 % Ch 0.7 1.8 2.8 2.5 1.9 2.6 1.4 1.0 Paper and Paper Products 0.37 0.37 0.37 0.37 0.37 0.37 0.37 0.37 % Ch -1.2 -0.2 -0.5 -0.1 0.2 0.3 0.6 0.0 Other Nondurables 2.65 2.69 2.70 2.70 2.71 2.72 2.73 2.71 % Ch 1.3 1.2 0.7 0.0 0.1 0.5 0.3 -0.7 Natural Resources and Mining 0.89 0.81 0.68 0.71 0.75 0.77 0.77 0.78 % Ch 3.2 -8.7 -16.6 4.5 5.5 2.5 0.9 0.6 Construction 6.15 6.46 6.71 6.91 7.04 7.29 7.53 7.78 % Ch 5.0 5.0 3.9 2.9 1.9 3.6 3.3 3.4 Trade, Transportation, and Utilities 26.38 26.88 27.24 27.38 27.36 27.36 27.27 27.10 % Ch 2.0 1.9 1.3 0.5 -0.1 0.0 -0.3 -0.6 Wholesale Trade 5.81 5.85 5.87 5.92 5.95 5.99 6.01 6.02 % Ch 1.4 0.7 0.2 0.9 0.4 0.7 0.2 0.3 Retail Trade 15.35 15.60 15.83 15.84 15.75 15.70 15.62 15.46 % Ch 1.9 1.6 1.4 0.1 -0.6 -0.3 -0.5 -1.0 Trans., Warehousing, and Utilities 5.21 5.43 5.54 5.62 5.66 5.67 5.65 5.63 % Ch 3.2 4.1 2.2 1.3 0.7 0.2 -0.4 -0.3 Information 2.73 2.75 2.77 2.73 2.70 2.71 2.76 2.84 % Ch 0.8 0.9 0.8 -1.6 -1.1 0.2 2.2 2.7 Publishing Industries 0.73 0.73 0.73 0.72 0.69 0.67 0.65 0.64 % Ch -0.8 0.0 0.5 -1.3 -4.7 -3.0 -2.5 -1.9 Other Information 2.00 2.02 2.04 2.01 2.01 2.04 2.11 2.20 % Ch 1.4 1.2 0.9 -1.7 0.2 1.4 3.7 4.1 Financial Activities 7.98 8.12 8.28 8.44 8.53 8.55 8.56 8.59 % Ch 1.1 1.8 2.0 1.9 1.1 0.2 0.1 0.4 Professional and Business Services 19.06 19.63 20.13 20.74 21.50 22.36 22.94 23.45 % Ch 2.9 3.0 2.6 3.0 3.7 4.0 2.6 2.2 Education and Health Services 21.44 22.02 22.62 23.13 23.48 23.54 23.56 23.67 % Ch 1.7 2.7 2.7 2.3 1.5 0.2 0.1 0.5 Leisure and Hospitality 14.69 15.15 15.61 15.93 16.16 16.15 16.19 16.22 % Ch 3.1 3.1 3.0 2.0 1.4 -0.1 0.2 0.2 Other Services 5.57 5.62 5.69 5.76 5.76 5.68 5.60 5.55 % Ch 1.5 1.0 1.1 1.3 0.0 -1.3 -1.5 -1.0 Federal Government 2.73 2.76 2.80 2.81 2.76 2.72 2.82 2.65 % Ch -1.4 0.8 1.5 0.4 -1.7 -1.7 3.8 -5.8 State and Local Government 19.14 19.27 19.43 19.50 19.58 19.70 19.80 19.91 % Ch 0.3 0.7 0.8 0.4 0.4 0.6 0.5 0.6
Appendix 87
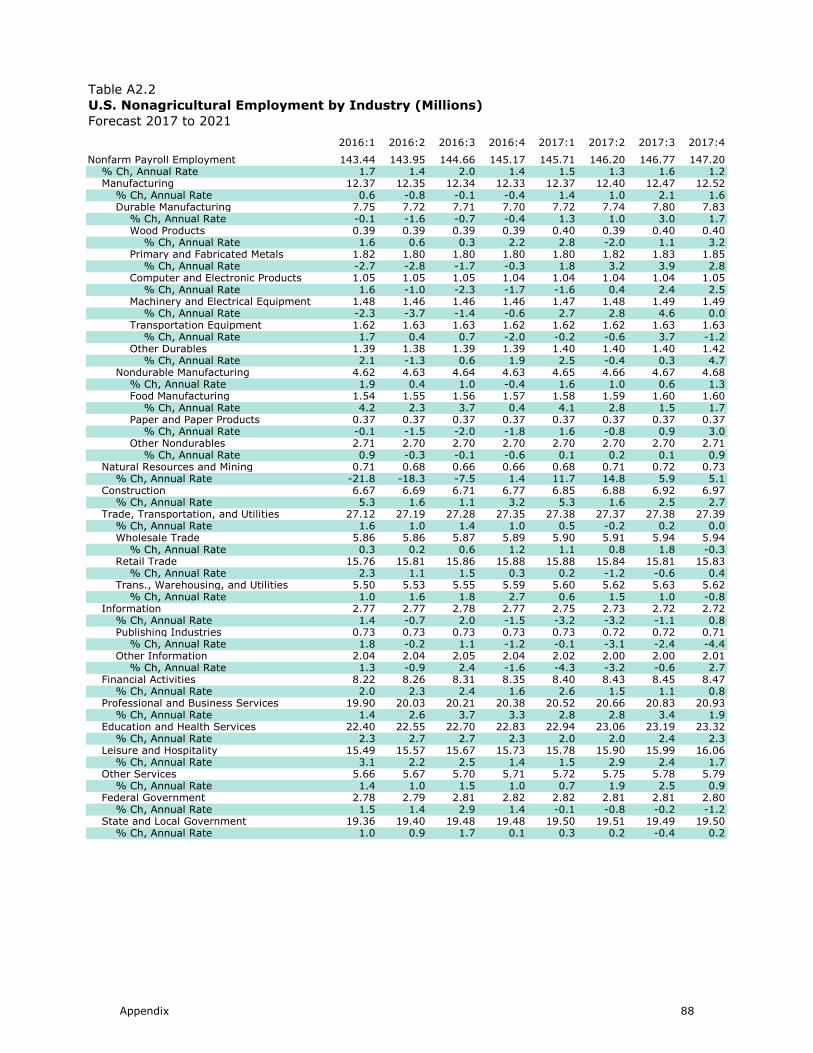
Table A2.2
U.S. Nonagricultural Employment by Industry (Millions)
Forecast 2017 to 2021
2016:1 2016:2 2016:3 2016:4 2017:1 2017:2 2017:3 2017:4
Nonfarm Payroll Employment 143.44 143.95 144.66 145.17 145.71 146.20 146.77 147.20 % Ch, Annual Rate 1.7 1.4 2.0 1.4 1.5 1.3 1.6 1.2 Manufacturing 12.37 12.35 12.34 12.33 12.37 12.40 12.47 12.52 % Ch, Annual Rate 0.6 -0.8 -0.1 -0.4 1.4 1.0 2.1 1.6 Durable Manufacturing 7.75 7.72 7.71 7.70 7.72 7.74 7.80 7.83 % Ch, Annual Rate -0.1 -1.6 -0.7 -0.4 1.3 1.0 3.0 1.7 Wood Products 0.39 0.39 0.39 0.39 0.40 0.39 0.40 0.40 % Ch, Annual Rate 1.6 0.6 0.3 2.2 2.8 -2.0 1.1 3.2 Primary and Fabricated Metals 1.82 1.80 1.80 1.80 1.80 1.82 1.83 1.85 % Ch, Annual Rate -2.7 -2.8 -1.7 -0.3 1.8 3.2 3.9 2.8 Computer and Electronic Products 1.05 1.05 1.05 1.04 1.04 1.04 1.04 1.05 % Ch, Annual Rate 1.6 -1.0 -2.3 -1.7 -1.6 0.4 2.4 2.5 Machinery and Electrical Equipment 1.48 1.46 1.46 1.46 1.47 1.48 1.49 1.49 % Ch, Annual Rate -2.3 -3.7 -1.4 -0.6 2.7 2.8 4.6 0.0 Transportation Equipment 1.62 1.63 1.63 1.62 1.62 1.62 1.63 1.63 % Ch, Annual Rate 1.7 0.4 0.7 -2.0 -0.2 -0.6 3.7 -1.2 Other Durables 1.39 1.38 1.39 1.39 1.40 1.40 1.40 1.42 % Ch, Annual Rate 2.1 -1.3 0.6 1.9 2.5 -0.4 0.3 4.7 Nondurable Manufacturing 4.62 4.63 4.64 4.63 4.65 4.66 4.67 4.68 % Ch, Annual Rate 1.9 0.4 1.0 -0.4 1.6 1.0 0.6 1.3 Food Manufacturing 1.54 1.55 1.56 1.57 1.58 1.59 1.60 1.60 % Ch, Annual Rate 4.2 2.3 3.7 0.4 4.1 2.8 1.5 1.7 Paper and Paper Products 0.37 0.37 0.37 0.37 0.37 0.37 0.37 0.37 % Ch, Annual Rate -0.1 -1.5 -2.0 -1.8 1.6 -0.8 0.9 3.0 Other Nondurables 2.71 2.70 2.70 2.70 2.70 2.70 2.70 2.71 % Ch, Annual Rate 0.9 -0.3 -0.1 -0.6 0.1 0.2 0.1 0.9 Natural Resources and Mining 0.71 0.68 0.66 0.66 0.68 0.71 0.72 0.73 % Ch, Annual Rate -21.8 -18.3 -7.5 1.4 11.7 14.8 5.9 5.1 Construction 6.67 6.69 6.71 6.77 6.85 6.88 6.92 6.97 % Ch, Annual Rate 5.3 1.6 1.1 3.2 5.3 1.6 2.5 2.7 Trade, Transportation, and Utilities 27.12 27.19 27.28 27.35 27.38 27.37 27.38 27.39 % Ch, Annual Rate 1.6 1.0 1.4 1.0 0.5 -0.2 0.2 0.0 Wholesale Trade 5.86 5.86 5.87 5.89 5.90 5.91 5.94 5.94 % Ch, Annual Rate 0.3 0.2 0.6 1.2 1.1 0.8 1.8 -0.3 Retail Trade 15.76 15.81 15.86 15.88 15.88 15.84 15.81 15.83 % Ch, Annual Rate 2.3 1.1 1.5 0.3 0.2 -1.2 -0.6 0.4 Trans., Warehousing, and Utilities 5.50 5.53 5.55 5.59 5.60 5.62 5.63 5.62 % Ch, Annual Rate 1.0 1.6 1.8 2.7 0.6 1.5 1.0 -0.8 Information 2.77 2.77 2.78 2.77 2.75 2.73 2.72 2.72 % Ch, Annual Rate 1.4 -0.7 2.0 -1.5 -3.2 -3.2 -1.1 0.8 Publishing Industries 0.73 0.73 0.73 0.73 0.73 0.72 0.72 0.71 % Ch, Annual Rate 1.8 -0.2 1.1 -1.2 -0.1 -3.1 -2.4 -4.4 Other Information 2.04 2.04 2.05 2.04 2.02 2.00 2.00 2.01 % Ch, Annual Rate 1.3 -0.9 2.4 -1.6 -4.3 -3.2 -0.6 2.7 Financial Activities 8.22 8.26 8.31 8.35 8.40 8.43 8.45 8.47 % Ch, Annual Rate 2.0 2.3 2.4 1.6 2.6 1.5 1.1 0.8 Professional and Business Services 19.90 20.03 20.21 20.38 20.52 20.66 20.83 20.93 % Ch, Annual Rate 1.4 2.6 3.7 3.3 2.8 2.8 3.4 1.9 Education and Health Services 22.40 22.55 22.70 22.83 22.94 23.06 23.19 23.32 % Ch, Annual Rate 2.3 2.7 2.7 2.3 2.0 2.0 2.4 2.3 Leisure and Hospitality 15.49 15.57 15.67 15.73 15.78 15.90 15.99 16.06 % Ch, Annual Rate 3.1 2.2 2.5 1.4 1.5 2.9 2.4 1.7 Other Services 5.66 5.67 5.70 5.71 5.72 5.75 5.78 5.79 % Ch, Annual Rate 1.4 1.0 1.5 1.0 0.7 1.9 2.5 0.9 Federal Government 2.78 2.79 2.81 2.82 2.82 2.81 2.81 2.80 % Ch, Annual Rate 1.5 1.4 2.9 1.4 -0.1 -0.8 -0.2 -1.2 State and Local Government 19.36 19.40 19.48 19.48 19.50 19.51 19.49 19.50 % Ch, Annual Rate 1.0 0.9 1.7 0.1 0.3 0.2 -0.4 0.2
Appendix 88

Table A2.2 (continued)
U.S. Nonagricultural Employment by Industry (Millions)
Forecast 2017 to 2021
2018:1 2018:2 2018:3 2018:4 2019:1 2019:2 2019:3 2019:4
Nonfarm Payroll Employment 147.60 148.06 148.49 148.86 149.25 149.58 149.84 150.10 % Ch, Annual Rate 1.1 1.2 1.2 1.0 1.1 0.9 0.7 0.7 Manufacturing 12.55 12.63 12.67 12.71 12.78 12.83 12.90 12.97 % Ch, Annual Rate 1.0 2.5 1.4 1.4 2.0 1.7 2.2 2.1 Durable Manufacturing 7.87 7.93 7.96 8.00 8.04 8.08 8.13 8.19 % Ch, Annual Rate 1.8 3.1 1.8 1.8 2.1 1.9 2.6 2.7 Wood Products 0.41 0.41 0.42 0.42 0.43 0.43 0.44 0.44 % Ch, Annual Rate 6.9 8.6 4.8 4.7 4.4 3.1 3.8 3.5 Primary and Fabricated Metals 1.85 1.86 1.87 1.88 1.89 1.91 1.93 1.95 % Ch, Annual Rate 1.6 2.2 0.9 1.6 3.8 3.6 4.5 4.2 Computer and Electronic Products 1.07 1.09 1.10 1.11 1.11 1.11 1.12 1.12 % Ch, Annual Rate 7.2 6.8 4.2 3.6 1.7 1.2 0.8 0.4 Machinery and Electrical Equipment 1.50 1.52 1.53 1.54 1.55 1.56 1.57 1.58 % Ch, Annual Rate 2.1 4.6 3.7 2.6 3.4 2.4 2.8 2.5 Transportation Equipment 1.62 1.62 1.61 1.60 1.60 1.60 1.61 1.63 % Ch, Annual Rate -2.4 -0.5 -1.7 -1.2 -1.2 0.0 3.0 4.6 Other Durables 1.42 1.43 1.44 1.45 1.46 1.46 1.46 1.47 % Ch, Annual Rate 1.6 2.4 2.4 2.6 2.1 1.2 0.8 0.4 Nondurable Manufacturing 4.68 4.70 4.71 4.71 4.73 4.75 4.77 4.78 % Ch, Annual Rate -0.3 1.5 0.6 0.7 1.8 1.4 1.4 1.1 Food Manufacturing 1.61 1.62 1.63 1.64 1.65 1.66 1.67 1.68 % Ch, Annual Rate 0.8 3.3 1.9 2.1 3.9 2.4 2.0 1.6 Paper and Paper Products 0.37 0.37 0.37 0.37 0.37 0.37 0.37 0.37 % Ch, Annual Rate -2.2 0.5 0.1 -0.5 0.3 0.7 1.0 0.8 Other Nondurables 2.70 2.71 2.71 2.71 2.71 2.72 2.72 2.73 % Ch, Annual Rate -0.8 0.6 -0.1 0.0 0.7 0.8 1.1 0.8 Natural Resources and Mining 0.73 0.75 0.75 0.76 0.76 0.76 0.77 0.77 % Ch, Annual Rate 4.6 6.6 3.2 2.8 2.5 1.4 1.3 1.2 Construction 6.99 7.01 7.04 7.11 7.19 7.26 7.32 7.39 % Ch, Annual Rate 1.2 1.0 2.1 3.6 4.7 4.0 3.7 3.4 Trade, Transportation, and Utilities 27.37 27.35 27.35 27.36 27.39 27.38 27.36 27.33 % Ch, Annual Rate -0.2 -0.3 0.0 0.2 0.4 -0.2 -0.2 -0.5 Wholesale Trade 5.93 5.94 5.96 5.97 5.99 5.99 5.99 6.00 % Ch, Annual Rate -0.5 0.5 1.4 1.2 0.8 0.5 0.1 0.1 Retail Trade 15.80 15.76 15.73 15.72 15.73 15.71 15.70 15.67 % Ch, Annual Rate -0.7 -1.1 -0.8 -0.2 0.3 -0.5 -0.3 -0.8 Trans., Warehousing, and Utilities 5.64 5.66 5.66 5.67 5.67 5.67 5.67 5.66 % Ch, Annual Rate 1.3 1.2 0.5 0.5 0.1 0.0 -0.4 -0.5 Information 2.68 2.70 2.71 2.71 2.70 2.69 2.70 2.72 % Ch, Annual Rate -6.1 2.5 1.5 0.6 -1.1 -1.3 0.7 3.5 Publishing Industries 0.70 0.69 0.68 0.68 0.67 0.67 0.66 0.66 % Ch, Annual Rate -6.3 -6.0 -4.7 -1.7 -2.9 -3.0 -2.3 -2.6 Other Information 1.98 2.01 2.03 2.03 2.03 2.03 2.04 2.06 % Ch, Annual Rate -6.1 5.7 3.7 1.4 -0.5 -0.8 1.7 5.6 Financial Activities 8.51 8.53 8.53 8.55 8.55 8.55 8.55 8.54 % Ch, Annual Rate 1.9 0.7 0.3 0.7 0.4 -0.1 -0.2 -0.1 Professional and Business Services 21.13 21.39 21.63 21.85 22.10 22.30 22.46 22.60 % Ch, Annual Rate 3.9 4.9 4.7 4.0 4.6 3.8 2.9 2.6 Education and Health Services 23.40 23.48 23.51 23.52 23.51 23.54 23.54 23.56 % Ch, Annual Rate 1.3 1.4 0.5 0.2 -0.2 0.5 0.0 0.3 Leisure and Hospitality 16.13 16.14 16.19 16.20 16.18 16.16 16.14 16.14 % Ch, Annual Rate 1.6 0.5 1.1 0.2 -0.4 -0.5 -0.5 -0.1 Other Services 5.79 5.76 5.75 5.73 5.72 5.70 5.67 5.64 % Ch, Annual Rate -0.5 -1.6 -1.0 -1.0 -1.1 -1.5 -1.8 -2.2 Federal Government 2.79 2.77 2.75 2.73 2.73 2.72 2.71 2.70 % Ch, Annual Rate -1.2 -2.9 -3.1 -2.2 -1.1 -1.1 -1.1 -1.1 State and Local Government 19.53 19.56 19.61 19.63 19.65 19.69 19.72 19.75 % Ch, Annual Rate 0.6 0.6 1.0 0.4 0.4 0.9 0.6 0.6
Appendix 89

Table A2.2 (continued)
U.S. Nonagricultural Employment by Industry (Millions)
Forecast 2017 to 2021
2020:1 2020:2 2020:3 2020:4 2021:1 2021:2 2021:3 2021:4
Nonfarm Payroll Employment 150.37 150.94 151.05 151.21 151.43 151.67 151.90 152.11 % Ch, Annual Rate 0.7 1.5 0.3 0.4 0.6 0.6 0.6 0.6 Manufacturing 13.02 13.06 13.12 13.17 13.19 13.22 13.24 13.26 % Ch, Annual Rate 1.7 1.3 1.8 1.5 0.8 0.7 0.7 0.6 Durable Manufacturing 8.23 8.27 8.32 8.37 8.40 8.42 8.45 8.48 % Ch, Annual Rate 2.3 1.9 2.5 2.2 1.4 1.2 1.4 1.2 Wood Products 0.44 0.45 0.46 0.46 0.47 0.48 0.48 0.49 % Ch, Annual Rate 3.4 5.0 6.6 7.1 6.2 5.6 5.7 5.7 Primary and Fabricated Metals 1.97 1.98 2.00 2.02 2.02 2.03 2.04 2.05 % Ch, Annual Rate 3.7 3.0 3.5 3.0 1.6 1.5 2.0 2.2 Computer and Electronic Products 1.12 1.11 1.11 1.11 1.11 1.11 1.11 1.11 % Ch, Annual Rate -0.2 -1.2 -0.8 -0.3 -0.2 0.3 0.6 0.6 Machinery and Electrical Equipment 1.59 1.59 1.60 1.60 1.61 1.62 1.62 1.63 % Ch, Annual Rate 1.7 0.7 1.4 1.6 1.5 1.6 1.8 1.8 Transportation Equipment 1.65 1.66 1.68 1.70 1.70 1.71 1.71 1.70 % Ch, Annual Rate 4.3 4.2 5.0 3.3 1.6 1.0 0.1 -1.1 Other Durables 1.47 1.47 1.47 1.48 1.48 1.48 1.48 1.48 % Ch, Annual Rate 0.7 0.4 1.0 0.9 0.5 0.2 0.7 0.8 Nondurable Manufacturing 4.79 4.79 4.80 4.80 4.80 4.79 4.79 4.78 % Ch, Annual Rate 0.6 0.3 0.6 0.3 -0.2 -0.4 -0.4 -0.5 Food Manufacturing 1.68 1.69 1.69 1.70 1.70 1.70 1.71 1.71 % Ch, Annual Rate 1.2 0.9 1.4 1.2 0.9 0.8 0.8 0.7 Paper and Paper Products 0.37 0.37 0.37 0.38 0.37 0.37 0.37 0.37 % Ch, Annual Rate 0.5 0.4 0.7 0.4 -0.3 -0.4 -0.4 -0.2 Other Nondurables 2.73 2.73 2.73 2.73 2.72 2.71 2.71 2.70 % Ch, Annual Rate 0.2 -0.1 0.0 -0.3 -0.9 -1.1 -1.2 -1.2 Natural Resources and Mining 0.77 0.77 0.77 0.77 0.78 0.78 0.78 0.78 % Ch, Annual Rate 0.8 0.4 0.4 0.7 0.7 0.6 0.6 0.8 Construction 7.44 7.50 7.56 7.62 7.68 7.75 7.82 7.89 % Ch, Annual Rate 3.0 3.0 3.3 3.4 3.3 3.5 3.9 3.4 Trade, Transportation, and Utilities 27.31 27.28 27.27 27.23 27.18 27.13 27.08 27.03 % Ch, Annual Rate -0.3 -0.4 -0.2 -0.5 -0.8 -0.6 -0.8 -0.8 Wholesale Trade 6.00 6.00 6.01 6.01 6.02 6.02 6.02 6.02 % Ch, Annual Rate 0.3 0.1 0.4 0.2 0.4 0.2 0.1 0.1 Retail Trade 15.66 15.63 15.61 15.58 15.52 15.48 15.44 15.39 % Ch, Annual Rate -0.4 -0.6 -0.5 -0.9 -1.5 -1.0 -1.2 -1.1 Trans., Warehousing, and Utilities 5.65 5.65 5.64 5.64 5.64 5.63 5.62 5.61 % Ch, Annual Rate -0.5 -0.6 -0.2 -0.3 -0.1 -0.4 -0.6 -0.6 Information 2.74 2.75 2.77 2.79 2.81 2.83 2.85 2.86 % Ch, Annual Rate 2.8 1.7 2.5 2.6 3.1 3.0 2.6 2.2 Publishing Industries 0.65 0.65 0.65 0.64 0.64 0.64 0.64 0.63 % Ch, Annual Rate -2.6 -2.5 -2.1 -2.1 -1.7 -1.8 -1.8 -1.8 Other Information 2.09 2.10 2.12 2.15 2.17 2.19 2.21 2.23 % Ch, Annual Rate 4.6 3.0 3.9 4.1 4.6 4.4 3.9 3.3 Financial Activities 8.55 8.55 8.56 8.57 8.59 8.59 8.59 8.58 % Ch, Annual Rate 0.1 0.0 0.5 0.7 0.6 0.2 0.0 -0.3 Professional and Business Services 22.73 22.87 23.01 23.15 23.27 23.39 23.52 23.65 % Ch, Annual Rate 2.3 2.5 2.6 2.3 2.1 2.0 2.3 2.2 Education and Health Services 23.56 23.54 23.56 23.58 23.63 23.66 23.67 23.71 % Ch, Annual Rate 0.0 -0.2 0.2 0.4 0.8 0.4 0.3 0.6 Leisure and Hospitality 16.16 16.18 16.20 16.22 16.21 16.22 16.23 16.22 % Ch, Annual Rate 0.5 0.4 0.7 0.5 -0.4 0.4 0.1 0.0 Other Services 5.62 5.60 5.59 5.58 5.57 5.56 5.54 5.52 % Ch, Annual Rate -1.4 -1.2 -1.0 -0.9 -0.6 -0.9 -1.3 -1.4 Federal Government 2.70 3.05 2.83 2.69 2.66 2.66 2.65 2.65 % Ch, Annual Rate -0.1 61.6 -25.6 -18.6 -3.7 -1.0 -0.8 -0.8 State and Local Government 19.77 19.79 19.81 19.84 19.87 19.90 19.93 19.96 % Ch, Annual Rate 0.5 0.4 0.5 0.5 0.6 0.7 0.7 0.6
Appendix 90

Table A2.3
Washington Nonagricultural Employment by Industry (Thousands)
Forecast 2017 to 2021
2014 2015 2016 2017 2018 2019 2020 2021
Nonfarm Payroll Employment 3,056.8 3,145.7 3,242.3 3,335.0 3,405.4 3,461.3 3,508.7 3,547.4 % Ch 2.5 2.9 3.1 2.9 2.1 1.6 1.4 1.1 Manufacturing 288.8 291.8 289.9 284.5 286.3 290.7 294.9 298.5 % Ch 0.7 1.1 -0.7 -1.8 0.6 1.5 1.4 1.2 Durable Manufacturing 210.0 211.1 207.4 200.8 201.4 203.9 206.6 209.6 % Ch 0.2 0.5 -1.7 -3.2 0.3 1.2 1.4 1.4 Wood Products 13.4 13.3 13.1 12.9 13.1 13.4 13.7 14.1 % Ch 3.0 -1.0 -1.5 -1.7 2.0 2.0 2.0 3.6 Primary and Fabricated Metals 25.6 25.7 25.2 25.8 26.7 27.6 29.0 29.8 % Ch 2.5 0.5 -2.1 2.2 3.6 3.5 4.9 2.7 Computer and Electronic Products 20.0 19.9 20.1 20.0 21.6 22.6 22.8 23.0 % Ch -1.0 -0.3 0.7 -0.5 8.4 4.5 0.7 0.8 Machinery and Electrical Equipment 20.8 20.8 20.4 20.7 22.1 23.9 25.4 27.0 % Ch 4.9 -0.3 -1.5 1.3 6.8 8.1 6.4 6.0 Aerospace 94.2 94.0 90.9 83.8 80.1 78.5 77.9 77.9 % Ch -1.9 -0.2 -3.3 -7.9 -4.4 -2.0 -0.8 0.0 Other Transportation Equip. 9.7 10.1 10.1 9.8 9.4 9.2 9.1 8.9 % Ch -0.7 4.7 -0.8 -2.1 -4.1 -2.6 -1.3 -2.4 Other Durables 26.2 27.3 27.6 27.8 28.3 28.6 28.8 29.0 % Ch 2.1 3.9 1.4 0.7 1.7 1.2 0.6 0.7 Nondurable Manufacturing 78.8 80.8 82.4 83.7 84.9 86.8 88.2 88.9 % Ch 2.3 2.5 2.1 1.6 1.4 2.2 1.6 0.8 Food Manufacturing 36.4 36.8 37.5 37.7 38.0 39.0 39.4 39.5 % Ch 2.0 1.2 1.9 0.5 0.7 2.7 1.0 0.3 Paper and Paper Products 8.0 8.0 7.8 7.9 7.8 7.8 7.7 7.7 % Ch -1.2 0.0 -3.5 1.4 -0.8 -0.6 -0.3 -1.0 Other Nondurables 34.4 35.9 37.2 38.1 39.1 40.0 41.1 41.8 % Ch 3.4 4.4 3.6 2.6 2.6 2.3 2.6 1.6 Natural Resources and Mining 6.2 6.3 6.3 6.1 6.2 6.3 6.4 6.4 % Ch 1.7 1.8 -1.1 -1.8 1.4 1.9 0.7 0.7 Construction 159.7 173.3 186.5 201.0 206.5 208.3 209.4 209.6 % Ch 7.2 8.5 7.6 7.8 2.7 0.9 0.5 0.1 Trade, Transportation, and Utilities 569.3 587.9 607.2 628.8 639.9 648.7 653.5 655.3 % Ch 3.4 3.3 3.3 3.6 1.8 1.4 0.7 0.3 Wholesale Trade 129.9 132.0 133.1 136.2 138.8 140.9 142.0 142.9 % Ch 2.4 1.6 0.9 2.3 1.9 1.5 0.8 0.6 Retail Trade 342.1 355.0 369.8 385.8 393.3 399.4 403.1 403.9 % Ch 3.6 3.8 4.2 4.3 2.0 1.5 0.9 0.2 Trans., Warehousing, and Utilities 97.3 100.9 104.3 106.8 107.8 108.4 108.4 108.5 % Ch 4.0 3.8 3.3 2.4 0.9 0.6 0.0 0.1 Information 109.8 114.0 120.6 124.4 125.0 126.4 129.5 133.2 % Ch 3.4 3.8 5.8 3.1 0.5 1.1 2.5 2.9 Software Publishers 55.6 55.9 58.8 61.4 61.9 62.4 62.9 63.5 % Ch 3.3 0.5 5.2 4.4 0.9 0.7 0.8 1.0 Other Publishing Industries 6.6 6.2 5.9 5.5 4.8 4.4 3.9 3.6 % Ch -4.9 -6.6 -4.0 -6.9 -12.7 -9.6 -9.3 -8.8 Other Information 47.6 51.9 55.9 57.4 58.2 59.7 62.7 66.1 % Ch 4.8 9.1 7.5 2.8 1.4 2.5 5.0 5.5 Financial Activities 145.3 147.6 150.6 155.8 158.5 158.4 157.9 157.6 % Ch 1.1 1.6 2.0 3.5 1.7 -0.1 -0.3 -0.1 Professional and Business Services 372.3 389.2 403.1 416.6 435.5 457.1 472.9 487.3 % Ch 3.0 4.5 3.6 3.4 4.5 5.0 3.5 3.1 Education and Health Services 444.0 448.5 463.6 475.7 488.4 495.8 501.9 509.1 % Ch 1.6 1.0 3.4 2.6 2.7 1.5 1.2 1.4 Leisure and Hospitality 297.0 309.9 323.4 334.7 341.9 345.6 349.4 352.9 % Ch 3.4 4.4 4.4 3.5 2.1 1.1 1.1 1.0 Other Services 113.9 115.1 117.7 121.3 123.1 124.2 125.0 126.0 % Ch 2.3 1.1 2.3 3.0 1.5 0.9 0.6 0.8 Federal Government 71.3 73.2 74.5 75.5 74.9 74.3 76.6 73.6 % Ch -0.5 2.6 1.9 1.2 -0.7 -0.8 3.1 -3.9 State and Local Government 479.3 488.8 499.1 510.8 519.1 525.6 531.4 537.7 % Ch 1.6 2.0 2.1 2.4 1.6 1.3 1.1 1.2
Appendix 91

Table A2.4
Washington Nonagricultural Employment by Industry (Thousands)
Forecast 2017 to 2021
2016:1 2016:2 2016:3 2016:4 2017:1 2017:2 2017:3 2017:4
Nonfarm Payroll Employment 3,207.3 3,234.2 3,254.3 3,273.5 3,305.1 3,327.1 3,345.2 3,362.7 % Ch, Annual Rate 4.2 3.4 2.5 2.4 3.9 2.7 2.2 2.1 Manufacturing 292.5 291.8 289.1 286.0 286.0 284.5 284.0 283.6 % Ch, Annual Rate 0.5 -0.9 -3.6 -4.3 0.0 -2.0 -0.8 -0.6 Durable Manufacturing 210.3 209.0 206.9 203.4 202.4 201.2 200.2 199.3 % Ch, Annual Rate -1.0 -2.4 -4.0 -6.7 -1.9 -2.4 -2.0 -1.8 Wood Products 13.2 13.1 13.2 13.0 13.0 12.9 12.8 12.8 % Ch, Annual Rate -1.6 -0.9 0.5 -5.4 1.3 -3.4 -3.5 0.9 Primary and Fabricated Metals 25.5 25.3 25.1 24.9 25.2 25.5 26.1 26.3 % Ch, Annual Rate -2.8 -4.5 -2.6 -2.3 4.8 3.5 10.0 4.0 Computer and Electronic Products 20.1 20.1 20.2 19.9 19.5 19.9 20.1 20.4 % Ch, Annual Rate 1.3 0.8 0.7 -5.3 -7.1 6.9 6.1 4.5 Machinery and Electrical Equipment 20.5 20.5 20.4 20.4 20.4 20.6 20.9 21.0 % Ch, Annual Rate -1.1 -0.6 -1.8 -0.8 0.6 3.7 5.5 3.5 Aerospace 93.0 92.0 90.7 88.0 86.6 84.6 82.8 81.1 % Ch, Annual Rate -2.0 -4.1 -5.5 -11.5 -6.1 -9.0 -8.3 -7.8 Other Transportation Equip. 10.2 10.2 9.9 9.9 9.9 9.9 9.8 9.7 % Ch, Annual Rate -3.2 -1.6 -8.1 -2.4 1.5 -1.0 -2.1 -5.8 Other Durables 27.8 27.9 27.5 27.4 27.7 27.9 27.7 27.9 % Ch, Annual Rate 3.6 1.0 -5.6 -1.7 5.4 3.2 -3.0 2.9 Nondurable Manufacturing 82.2 82.8 82.2 82.6 83.5 83.3 83.8 84.3 % Ch, Annual Rate 4.4 2.7 -2.7 1.8 4.7 -1.0 2.2 2.5 Food Manufacturing 37.7 37.9 37.0 37.5 38.1 37.7 37.5 37.6 % Ch, Annual Rate 7.7 2.3 -9.2 6.0 6.6 -4.8 -2.1 1.3 Paper and Paper Products 7.8 7.8 7.8 7.7 7.8 7.9 7.9 7.9 % Ch, Annual Rate -8.4 1.2 -1.5 -1.8 5.5 3.7 -2.2 2.3 Other Nondurables 36.8 37.1 37.5 37.3 37.6 37.8 38.4 38.8 % Ch, Annual Rate 3.9 3.5 4.1 -1.5 2.7 1.9 7.5 3.8 Natural Resources and Mining 6.3 6.3 6.3 6.1 6.1 6.2 6.1 6.2 % Ch, Annual Rate 1.1 2.0 -5.2 -10.4 1.4 5.2 -5.7 4.0 Construction 182.3 184.9 187.3 191.5 197.7 200.9 201.4 204.0 % Ch, Annual Rate 16.5 5.9 5.4 9.2 13.6 6.6 0.9 5.3 Trade, Transportation, and Utilities 598.0 605.6 610.7 614.5 623.5 627.4 630.4 633.8 % Ch, Annual Rate 3.7 5.2 3.5 2.5 6.0 2.5 1.9 2.1 Wholesale Trade 132.5 133.1 133.2 133.7 135.3 135.9 136.6 137.2 % Ch, Annual Rate 0.8 1.6 0.5 1.4 4.8 1.8 2.3 1.8 Retail Trade 363.0 368.6 372.5 375.1 381.9 384.7 386.9 389.6 % Ch, Annual Rate 6.1 6.3 4.3 2.9 7.4 2.9 2.3 2.9 Trans., Warehousing, and Utilities 102.5 103.9 105.1 105.7 106.4 106.9 106.9 106.9 % Ch, Annual Rate -0.9 5.8 4.3 2.4 2.6 2.0 0.1 -0.1 Information 118.0 119.8 121.6 123.0 123.6 124.2 124.6 125.0 % Ch, Annual Rate 3.6 6.4 6.1 4.6 1.9 2.2 1.2 1.4 Software Publishers 57.5 58.4 59.3 60.0 60.8 61.0 61.9 61.9 % Ch, Annual Rate 4.8 6.4 6.6 4.2 5.4 1.8 5.8 0.3 Other Publishing Industries 6.0 6.0 5.9 5.8 5.8 5.6 5.4 5.3 % Ch, Annual Rate -2.5 -4.3 -3.9 -3.3 -3.1 -14.2 -10.4 -11.1 Other Information 54.4 55.5 56.4 57.2 57.0 57.6 57.3 57.8 % Ch, Annual Rate 3.1 7.8 6.7 6.0 -1.2 4.4 -2.4 4.0 Financial Activities 148.9 150.0 151.5 151.9 154.2 155.3 156.6 157.1 % Ch, Annual Rate 2.3 2.8 4.1 1.0 6.2 3.0 3.2 1.4 Professional and Business Services 399.2 402.9 404.5 405.6 411.3 415.3 418.3 421.4 % Ch, Annual Rate 4.3 3.7 1.6 1.2 5.6 3.9 3.0 3.0 Education and Health Services 458.6 462.0 465.5 468.3 471.2 473.1 477.1 481.2 % Ch, Annual Rate 5.1 2.9 3.1 2.5 2.4 1.6 3.5 3.5 Leisure and Hospitality 319.4 322.3 324.6 327.4 330.5 333.9 336.4 338.1 % Ch, Annual Rate 4.8 3.6 2.9 3.5 3.8 4.1 3.0 2.1 Other Services 116.6 117.8 117.6 118.7 120.1 121.1 121.6 122.2 % Ch, Annual Rate 4.4 4.2 -0.9 4.0 4.7 3.4 1.8 1.9 Federal Government 74.2 74.5 74.5 75.0 75.2 75.6 75.5 75.5 % Ch, Annual Rate 1.4 1.6 0.3 2.5 1.2 2.3 -0.5 -0.3 State and Local Government 493.3 496.5 501.0 505.4 505.8 509.5 513.2 514.6 % Ch, Annual Rate 2.7 2.6 3.7 3.6 0.3 3.0 2.9 1.1
Appendix 92

Table A2.4 (continued)
Washington Nonagricultural Employment by Industry (Thousands)
Forecast 2017 to 2021
2018:1 2018:2 2018:3 2018:4 2019:1 2019:2 2019:3 2019:4
Nonfarm Payroll Employment 3,380.6 3,398.0 3,414.3 3,428.5 3,443.1 3,456.2 3,467.1 3,478.9 % Ch, Annual Rate 2.1 2.1 1.9 1.7 1.7 1.5 1.3 1.4 Manufacturing 284.4 286.1 287.0 287.8 289.1 290.1 291.3 292.3 % Ch, Annual Rate 1.2 2.4 1.2 1.2 1.8 1.4 1.6 1.3 Durable Manufacturing 200.1 201.3 201.9 202.4 203.0 203.5 204.2 204.8 % Ch, Annual Rate 1.7 2.3 1.2 1.1 1.2 1.0 1.3 1.1 Wood Products 12.9 13.1 13.2 13.3 13.3 13.4 13.4 13.5 % Ch, Annual Rate 4.2 5.7 2.3 2.3 2.0 0.9 1.5 1.2 Primary and Fabricated Metals 26.5 26.7 26.7 26.8 27.1 27.4 27.8 28.2 % Ch, Annual Rate 2.8 3.1 0.5 1.5 4.4 4.4 5.8 5.8 Computer and Electronic Products 20.9 21.5 21.9 22.2 22.4 22.6 22.7 22.8 % Ch, Annual Rate 11.9 11.3 7.3 6.4 3.5 2.7 2.2 1.5 Machinery and Electrical Equipment 21.4 21.9 22.4 22.8 23.3 23.7 24.1 24.6 % Ch, Annual Rate 6.6 10.5 9.0 7.5 8.7 7.2 7.9 7.4 Aerospace 80.7 80.3 79.9 79.5 79.1 78.7 78.3 77.9 % Ch, Annual Rate -2.0 -2.0 -2.0 -2.0 -2.0 -2.0 -2.0 -2.0 Other Transportation Equip. 9.6 9.5 9.4 9.3 9.2 9.2 9.2 9.2 % Ch, Annual Rate -5.0 -3.9 -3.5 -3.8 -3.9 -0.6 0.0 -1.4 Other Durables 28.1 28.3 28.4 28.5 28.6 28.6 28.7 28.7 % Ch, Annual Rate 2.3 2.3 1.6 1.4 1.2 0.8 0.6 0.5 Nondurable Manufacturing 84.3 84.8 85.1 85.4 86.1 86.6 87.1 87.5 % Ch, Annual Rate 0.0 2.6 1.4 1.4 3.2 2.4 2.2 1.9 Food Manufacturing 37.6 37.9 38.1 38.3 38.7 39.0 39.1 39.2 % Ch, Annual Rate 0.0 3.7 1.6 1.9 4.7 2.5 1.8 1.3 Paper and Paper Products 7.8 7.8 7.8 7.8 7.8 7.8 7.8 7.8 % Ch, Annual Rate -3.3 -0.4 -0.8 -1.6 -0.6 -0.2 0.1 -0.2 Other Nondurables 38.9 39.1 39.2 39.4 39.6 39.9 40.2 40.5 % Ch, Annual Rate 0.7 2.0 1.6 1.6 2.5 2.8 3.1 2.9 Natural Resources and Mining 6.2 6.2 6.2 6.3 6.3 6.3 6.4 6.4 % Ch, Annual Rate 2.5 0.0 1.8 3.4 2.4 1.4 1.3 1.1 Construction 206.0 206.3 206.7 207.0 207.7 208.2 208.2 208.9 % Ch, Annual Rate 4.1 0.5 0.7 0.6 1.4 1.0 0.0 1.2 Trade, Transportation, and Utilities 636.4 638.6 641.0 643.6 646.3 648.0 649.6 650.7 % Ch, Annual Rate 1.7 1.4 1.5 1.6 1.7 1.1 1.0 0.7 Wholesale Trade 137.8 138.4 139.2 139.9 140.4 140.8 141.0 141.3 % Ch, Annual Rate 1.6 1.8 2.4 1.9 1.4 1.2 0.6 0.9 Retail Trade 391.3 392.5 393.9 395.6 397.6 398.9 400.2 401.0 % Ch, Annual Rate 1.8 1.2 1.4 1.7 2.1 1.2 1.3 0.8 Trans., Warehousing, and Utilities 107.3 107.7 107.9 108.1 108.3 108.4 108.4 108.4 % Ch, Annual Rate 1.6 1.4 0.9 0.8 0.5 0.4 0.1 0.0 Information 124.0 124.8 125.4 125.8 125.9 125.9 126.4 127.5 % Ch, Annual Rate -3.3 2.5 1.9 1.4 0.3 0.1 1.5 3.4 Software Publishers 61.9 61.9 61.9 62.1 62.2 62.3 62.4 62.5 % Ch, Annual Rate -0.3 -0.1 0.2 1.0 0.7 0.7 0.9 0.8 Other Publishing Industries 5.1 4.9 4.7 4.6 4.5 4.4 4.3 4.2 % Ch, Annual Rate -14.7 -14.4 -12.5 -6.9 -9.3 -9.7 -8.7 -9.4 Other Information 57.0 58.0 58.8 59.1 59.2 59.2 59.7 60.7 % Ch, Annual Rate -5.4 7.1 5.1 2.5 0.6 0.2 2.9 7.1 Financial Activities 158.2 158.5 158.6 158.7 158.7 158.5 158.2 158.0 % Ch, Annual Rate 2.7 0.8 0.2 0.4 0.0 -0.5 -0.8 -0.4 Professional and Business Services 426.6 432.7 438.7 444.1 450.1 455.2 459.5 463.5 % Ch, Annual Rate 4.9 5.9 5.7 5.0 5.5 4.7 3.8 3.5 Education and Health Services 484.4 487.6 489.9 491.8 493.1 495.2 496.6 498.4 % Ch, Annual Rate 2.7 2.7 1.9 1.5 1.1 1.7 1.2 1.4 Leisure and Hospitality 339.9 341.1 342.7 343.8 344.5 345.2 345.8 346.7 % Ch, Annual Rate 2.1 1.5 1.8 1.3 0.9 0.8 0.8 1.0 Other Services 122.6 122.9 123.3 123.6 123.9 124.2 124.3 124.5 % Ch, Annual Rate 1.4 0.9 1.1 1.1 1.0 0.8 0.6 0.4 Federal Government 75.4 75.1 74.7 74.4 74.4 74.3 74.2 74.2 % Ch, Annual Rate -0.3 -1.9 -2.0 -1.2 -0.3 -0.4 -0.4 -0.4 State and Local Government 516.4 518.1 520.2 521.7 523.1 525.0 526.5 528.0 % Ch, Annual Rate 1.4 1.4 1.6 1.1 1.1 1.4 1.2 1.1
Appendix 93

Table A2.4 (continued)
Washington Nonagricultural Employment by Industry (Thousands)
Forecast 2017 to 2021
2020:1 2020:2 2020:3 2020:4 2021:1 2021:2 2021:3 2021:4
Nonfarm Payroll Employment 3,488.8 3,507.6 3,514.7 3,523.6 3,533.1 3,542.8 3,552.2 3,561.6 % Ch, Annual Rate 1.1 2.2 0.8 1.0 1.1 1.1 1.1 1.1 Manufacturing 293.3 294.2 295.4 296.5 297.3 298.1 298.9 299.8 % Ch, Annual Rate 1.5 1.2 1.6 1.5 1.1 1.0 1.1 1.2 Durable Manufacturing 205.5 206.2 207.0 207.9 208.5 209.2 210.0 210.7 % Ch, Annual Rate 1.5 1.2 1.6 1.7 1.3 1.3 1.5 1.5 Wood Products 13.5 13.6 13.7 13.9 14.0 14.1 14.2 14.3 % Ch, Annual Rate 1.1 2.5 4.0 4.4 3.6 3.1 3.2 3.2 Primary and Fabricated Metals 28.5 28.8 29.2 29.4 29.6 29.7 29.8 30.0 % Ch, Annual Rate 4.9 4.2 4.7 4.0 1.7 1.6 2.2 2.5 Computer and Electronic Products 22.8 22.8 22.8 22.8 22.8 22.9 23.0 23.1 % Ch, Annual Rate 0.6 -0.9 -0.2 0.5 0.7 1.4 1.9 2.0 Machinery and Electrical Equipment 24.9 25.2 25.6 26.0 26.4 26.7 27.2 27.6 % Ch, Annual Rate 6.2 4.8 5.8 6.1 5.9 6.1 6.4 6.5 Aerospace 77.9 77.9 77.9 77.9 77.9 77.9 77.9 77.9 % Ch, Annual Rate 0.0 0.0 0.0 0.0 0.0 0.0 0.0 0.0 Other Transportation Equip. 9.1 9.1 9.1 9.0 9.0 8.9 8.8 8.7 % Ch, Annual Rate -1.6 -1.3 -1.5 -2.0 -2.4 -2.9 -3.3 -3.4 Other Durables 28.7 28.8 28.8 28.9 28.9 29.0 29.0 29.0 % Ch, Annual Rate 0.5 0.4 1.0 1.0 0.7 0.5 0.5 0.4 Nondurable Manufacturing 87.8 88.0 88.4 88.6 88.8 88.9 89.0 89.1 % Ch, Annual Rate 1.4 1.1 1.6 1.2 0.7 0.5 0.4 0.4 Food Manufacturing 39.3 39.3 39.4 39.5 39.5 39.5 39.5 39.5 % Ch, Annual Rate 0.6 0.2 1.0 0.7 0.3 0.1 0.0 -0.1 Paper and Paper Products 7.7 7.7 7.7 7.7 7.7 7.7 7.6 7.6 % Ch, Annual Rate -0.4 -0.6 -0.2 -0.5 -1.4 -1.4 -1.5 -1.2 Other Nondurables 40.7 41.0 41.2 41.4 41.6 41.7 41.8 42.0 % Ch, Annual Rate 2.6 2.4 2.4 2.0 1.4 1.2 1.1 1.3 Natural Resources and Mining 6.4 6.4 6.4 6.4 6.4 6.4 6.4 6.4 % Ch, Annual Rate 0.7 0.0 0.4 0.6 1.1 0.7 0.7 0.7 Construction 208.6 209.2 209.6 210.0 209.8 209.7 209.5 209.4 % Ch, Annual Rate -0.5 1.1 0.8 0.7 -0.3 -0.3 -0.2 -0.2 Trade, Transportation, and Utilities 651.9 653.0 654.2 654.9 655.0 655.4 655.4 655.5 % Ch, Annual Rate 0.8 0.7 0.7 0.4 0.1 0.2 0.0 0.1 Wholesale Trade 141.6 141.9 142.2 142.4 142.7 142.9 143.0 143.1 % Ch, Annual Rate 0.7 0.8 0.9 0.7 0.7 0.5 0.3 0.4 Retail Trade 402.0 402.8 403.6 404.0 403.8 404.0 404.0 404.0 % Ch, Annual Rate 1.0 0.8 0.8 0.4 -0.2 0.2 0.0 0.0 Trans., Warehousing, and Utilities 108.4 108.4 108.4 108.5 108.5 108.5 108.5 108.5 % Ch, Annual Rate -0.1 0.0 0.2 0.2 0.2 0.0 -0.1 -0.1 Information 128.4 129.0 129.9 130.8 131.8 132.8 133.8 134.6 % Ch, Annual Rate 2.9 2.1 2.7 2.8 3.1 3.1 2.8 2.5 Software Publishers 62.7 62.8 63.0 63.1 63.3 63.4 63.6 63.7 % Ch, Annual Rate 0.8 0.8 0.9 0.9 1.0 1.0 1.0 1.0 Other Publishing Industries 4.1 4.0 3.9 3.8 3.7 3.6 3.6 3.5 % Ch, Annual Rate -9.5 -9.6 -8.9 -9.0 -8.3 -8.8 -8.8 -9.0 Other Information 61.6 62.2 63.1 63.9 64.8 65.8 66.6 67.4 % Ch, Annual Rate 6.0 4.3 5.3 5.5 6.0 5.8 5.2 4.6 Financial Activities 157.9 157.8 157.8 158.0 158.0 157.8 157.6 157.2 % Ch, Annual Rate -0.4 -0.2 0.1 0.3 0.0 -0.4 -0.7 -0.9 Professional and Business Services 467.1 470.9 474.9 478.6 482.1 485.5 489.1 492.7 % Ch, Annual Rate 3.1 3.3 3.4 3.1 2.9 2.8 3.0 3.0 Education and Health Services 499.8 500.9 502.5 504.3 506.5 508.3 509.9 511.8 % Ch, Annual Rate 1.1 0.9 1.3 1.4 1.8 1.4 1.3 1.5 Leisure and Hospitality 347.8 348.8 350.0 351.0 351.6 352.5 353.3 354.0 % Ch, Annual Rate 1.2 1.2 1.3 1.2 0.7 1.1 0.9 0.8 Other Services 124.7 124.9 125.1 125.4 125.7 125.9 126.1 126.2 % Ch, Annual Rate 0.7 0.7 0.8 0.8 0.9 0.7 0.6 0.5 Federal Government 73.6 81.8 76.8 74.2 73.7 73.6 73.5 73.5 % Ch, Annual Rate -2.9 52.5 -22.3 -12.9 -2.8 -0.4 -0.3 -0.2 State and Local Government 529.3 530.6 532.1 533.6 535.2 536.9 538.6 540.3 % Ch, Annual Rate 1.0 1.0 1.1 1.1 1.2 1.3 1.3 1.2
Appendix 94
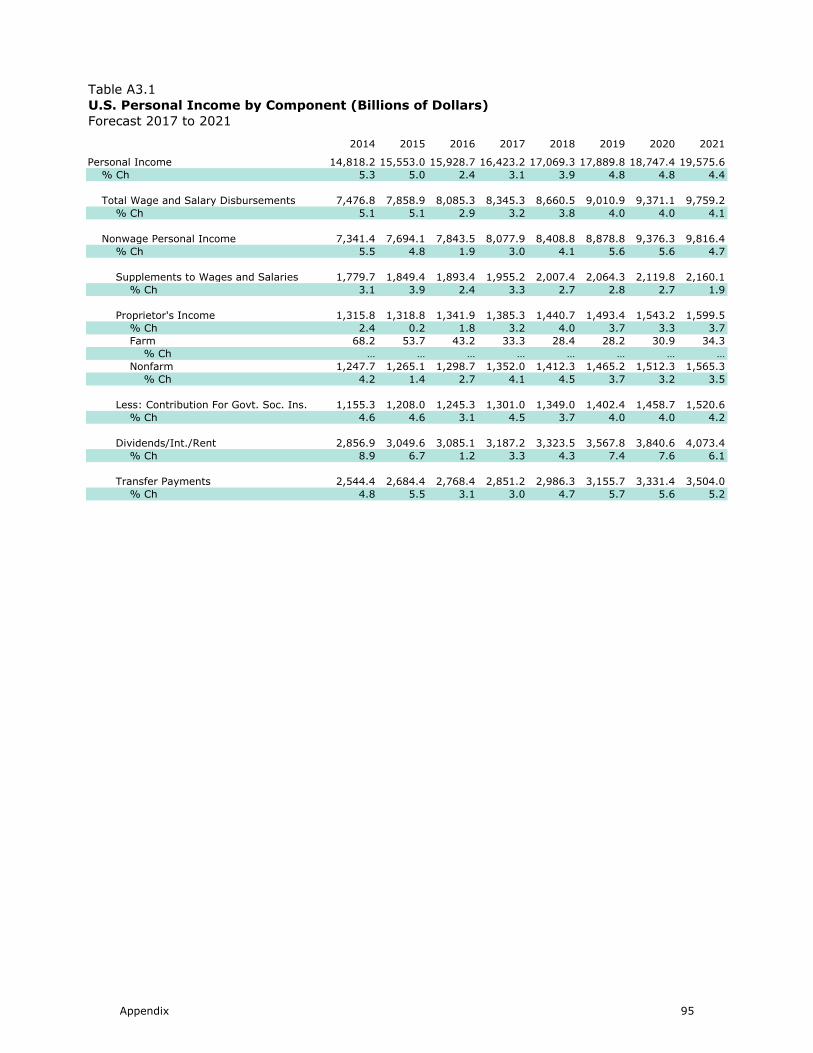
Table A3.1
U.S. Personal Income by Component (Billions of Dollars)
Forecast 2017 to 2021
2014 2015 2016 2017 2018 2019 2020 2021
Personal Income 14,818.2 15,553.0 15,928.7 16,423.2 17,069.3 17,889.8 18,747.4 19,575.6
% Ch 5.3 5.0 2.4 3.1 3.9 4.8 4.8 4.4
Total Wage and Salary Disbursements 7,476.8 7,858.9 8,085.3 8,345.3 8,660.5 9,010.9 9,371.1 9,759.2
% Ch 5.1 5.1 2.9 3.2 3.8 4.0 4.0 4.1
Nonwage Personal Income 7,341.4 7,694.1 7,843.5 8,077.9 8,408.8 8,878.8 9,376.3 9,816.4
% Ch 5.5 4.8 1.9 3.0 4.1 5.6 5.6 4.7
Supplements to Wages and Salaries 1,779.7 1,849.4 1,893.4 1,955.2 2,007.4 2,064.3 2,119.8 2,160.1
% Ch 3.1 3.9 2.4 3.3 2.7 2.8 2.7 1.9
Proprietor's Income 1,315.8 1,318.8 1,341.9 1,385.3 1,440.7 1,493.4 1,543.2 1,599.5
% Ch 2.4 0.2 1.8 3.2 4.0 3.7 3.3 3.7
Farm 68.2 53.7 43.2 33.3 28.4 28.2 30.9 34.3
% Ch … … … … … … … …
Nonfarm 1,247.7 1,265.1 1,298.7 1,352.0 1,412.3 1,465.2 1,512.3 1,565.3
% Ch 4.2 1.4 2.7 4.1 4.5 3.7 3.2 3.5
Less: Contribution For Govt. Soc. Ins. 1,155.3 1,208.0 1,245.3 1,301.0 1,349.0 1,402.4 1,458.7 1,520.6
% Ch 4.6 4.6 3.1 4.5 3.7 4.0 4.0 4.2
Dividends/Int./Rent 2,856.9 3,049.6 3,085.1 3,187.2 3,323.5 3,567.8 3,840.6 4,073.4
% Ch 8.9 6.7 1.2 3.3 4.3 7.4 7.6 6.1
Transfer Payments 2,544.4 2,684.4 2,768.4 2,851.2 2,986.3 3,155.7 3,331.4 3,504.0
% Ch 4.8 5.5 3.1 3.0 4.7 5.7 5.6 5.2
Appendix 95

Table A3.2
U.S. Personal Income by Component (Billions of Dollars)
Forecast 2017 to 2021
2016:1 2016:2 2016:3 2016:4 2017:1 2017:2 2017:3 2017:4
Personal Income 15,751.0 15,910.1 16,028.0 16,025.7 16,245.2 16,363.9 16,473.5 16,610.2
% Ch, Annual Rate -0.5 4.1 3.0 -0.1 5.6 3.0 2.7 3.4
Total Wage and Salary Disbursements 7,964.9 8,090.2 8,178.1 8,107.8 8,232.1 8,323.1 8,377.5 8,448.7
% Ch, Annual Rate -3.2 6.4 4.4 -3.4 6.3 4.5 2.6 3.4
Nonwage Personal Income 7,786.1 7,819.9 7,849.9 7,917.9 8,013.1 8,040.8 8,096.0 8,161.5
% Ch, Annual Rate 2.4 1.7 1.5 3.5 4.9 1.4 2.8 3.3
Supplements to Wages and Salaries 1,873.7 1,889.4 1,903.4 1,907.1 1,934.3 1,950.0 1,963.0 1,973.6
% Ch, Annual Rate -0.4 3.4 3.0 0.8 5.8 3.3 2.7 2.2
Proprietor's Income 1,327.6 1,339.5 1,346.0 1,354.5 1,380.3 1,374.8 1,385.0 1,401.2
% Ch, Annual Rate 0.7 3.6 2.0 2.6 7.8 -1.6 3.0 4.8
Farm 46.8 46.7 41.4 37.8 41.9 33.0 30.2 28.1
% Ch, Annual Rate … … … … … … … …
Nonfarm 1,280.8 1,292.8 1,304.6 1,316.7 1,338.4 1,341.8 1,354.8 1,373.1
% Ch, Annual Rate 2.1 3.8 3.7 3.8 6.8 1.0 3.9 5.5
Less: Contribution For Govt. Soc. Ins. 1,227.5 1,245.4 1,258.2 1,250.2 1,284.1 1,297.6 1,306.1 1,316.4
% Ch, Annual Rate -1.4 5.9 4.2 -2.5 11.3 4.3 2.6 3.2
Dividends/Int./Rent 3,072.5 3,076.1 3,081.4 3,110.4 3,150.9 3,175.9 3,198.4 3,223.6
% Ch, Annual Rate 1.8 0.5 0.7 3.8 5.3 3.2 2.9 3.2
Transfer Payments 2,739.9 2,760.2 2,777.4 2,795.9 2,831.9 2,837.7 2,855.7 2,879.5
% Ch, Annual Rate 4.3 3.0 2.5 2.7 5.3 0.8 2.6 3.4
Appendix 96

Table A3.2 (continued)
U.S. Personal Income by Component (Billions of Dollars)
Forecast 2017 to 2021
2018:1 2018:2 2018:3 2018:4 2019:1 2019:2 2019:3 2019:4
Personal Income 16,799.2 16,969.4 17,153.1 17,355.5 17,581.6 17,783.4 17,994.7 18,199.4
% Ch, Annual Rate 4.6 4.1 4.4 4.8 5.3 4.7 4.8 4.6
Total Wage and Salary Disbursements 8,533.8 8,617.1 8,702.2 8,789.0 8,882.4 8,968.7 9,053.2 9,139.3
% Ch, Annual Rate 4.1 4.0 4.0 4.1 4.3 3.9 3.8 3.9
Nonwage Personal Income 8,265.4 8,352.3 8,450.9 8,566.6 8,699.2 8,814.6 8,941.5 9,060.0
% Ch, Annual Rate 5.2 4.3 4.8 5.6 6.3 5.4 5.9 5.4
Supplements to Wages and Salaries 1,988.5 2,001.4 2,013.3 2,026.5 2,044.4 2,057.5 2,070.8 2,084.3
% Ch, Annual Rate 3.1 2.6 2.4 2.7 3.6 2.6 2.6 2.6
Proprietor's Income 1,416.9 1,436.7 1,447.7 1,461.4 1,475.7 1,488.7 1,498.9 1,510.4
% Ch, Annual Rate 4.5 5.7 3.1 3.8 4.0 3.6 2.8 3.1
Farm 28.1 29.1 28.4 28.1 27.7 27.4 28.4 29.1
% Ch, Annual Rate … … … … … … … …
Nonfarm 1,388.8 1,407.6 1,419.3 1,433.3 1,448.0 1,461.2 1,470.5 1,481.3
% Ch, Annual Rate 4.6 5.5 3.4 4.0 4.2 3.7 2.6 3.0
Less: Contribution For Govt. Soc. Ins. 1,333.0 1,343.9 1,354.1 1,365.0 1,387.5 1,397.4 1,407.0 1,417.6
% Ch, Annual Rate 5.2 3.3 3.1 3.3 6.8 2.9 2.8 3.1
Dividends/Int./Rent 3,257.1 3,288.4 3,342.6 3,405.8 3,465.5 3,529.4 3,605.1 3,671.3
% Ch, Annual Rate 4.2 3.9 6.8 7.8 7.2 7.6 8.9 7.6
Transfer Payments 2,936.0 2,969.7 3,001.5 3,037.8 3,101.1 3,136.5 3,173.7 3,211.7
% Ch, Annual Rate 8.1 4.7 4.4 4.9 8.6 4.6 4.8 4.9
Appendix 97

Table A3.2 (continued)
U.S. Personal Income by Component (Billions of Dollars)
Forecast 2017 to 2021
2020:1 2020:2 2020:3 2020:4 2021:1 2021:2 2021:3 2021:4
Personal Income 18,435.6 18,650.6 18,853.8 19,049.4 19,272.6 19,476.5 19,674.2 19,878.8
% Ch, Annual Rate 5.3 4.7 4.4 4.2 4.8 4.3 4.1 4.2
Total Wage and Salary Disbursements 9,230.7 9,325.8 9,417.5 9,510.3 9,610.1 9,708.3 9,808.4 9,909.9
% Ch, Annual Rate 4.1 4.2 4.0 4.0 4.3 4.1 4.2 4.2
Nonwage Personal Income 9,204.9 9,324.9 9,436.2 9,539.1 9,662.5 9,768.3 9,865.8 9,968.9
% Ch, Annual Rate 6.5 5.3 4.9 4.4 5.3 4.5 4.1 4.2
Supplements to Wages and Salaries 2,104.0 2,115.3 2,125.8 2,133.9 2,148.7 2,155.5 2,163.5 2,172.6
% Ch, Annual Rate 3.8 2.2 2.0 1.5 2.8 1.3 1.5 1.7
Proprietor's Income 1,520.8 1,536.3 1,551.6 1,564.0 1,577.0 1,592.2 1,607.0 1,621.9
% Ch, Annual Rate 2.8 4.1 4.1 3.2 3.4 3.9 3.8 3.8
Farm 29.3 30.6 31.9 31.8 32.9 34.1 34.9 35.2
% Ch, Annual Rate … … … … … … … …
Nonfarm 1,491.5 1,505.7 1,519.8 1,532.2 1,544.1 1,558.1 1,572.1 1,586.7
% Ch, Annual Rate 2.8 3.9 3.8 3.3 3.2 3.7 3.6 3.7
Less: Contribution For Govt. Soc. Ins. 1,441.9 1,453.0 1,463.6 1,476.1 1,503.1 1,514.6 1,526.3 1,538.2
% Ch, Annual Rate 7.0 3.1 2.9 3.5 7.5 3.1 3.1 3.1
Dividends/Int./Rent 3,742.6 3,812.0 3,874.0 3,933.8 3,993.7 4,051.2 4,099.2 4,149.6
% Ch, Annual Rate 8.0 7.6 6.7 6.3 6.2 5.9 4.8 5.0
Transfer Payments 3,279.5 3,314.3 3,348.4 3,383.5 3,446.3 3,484.0 3,522.5 3,563.0
% Ch, Annual Rate 8.7 4.3 4.2 4.3 7.6 4.4 4.5 4.7
Appendix 98
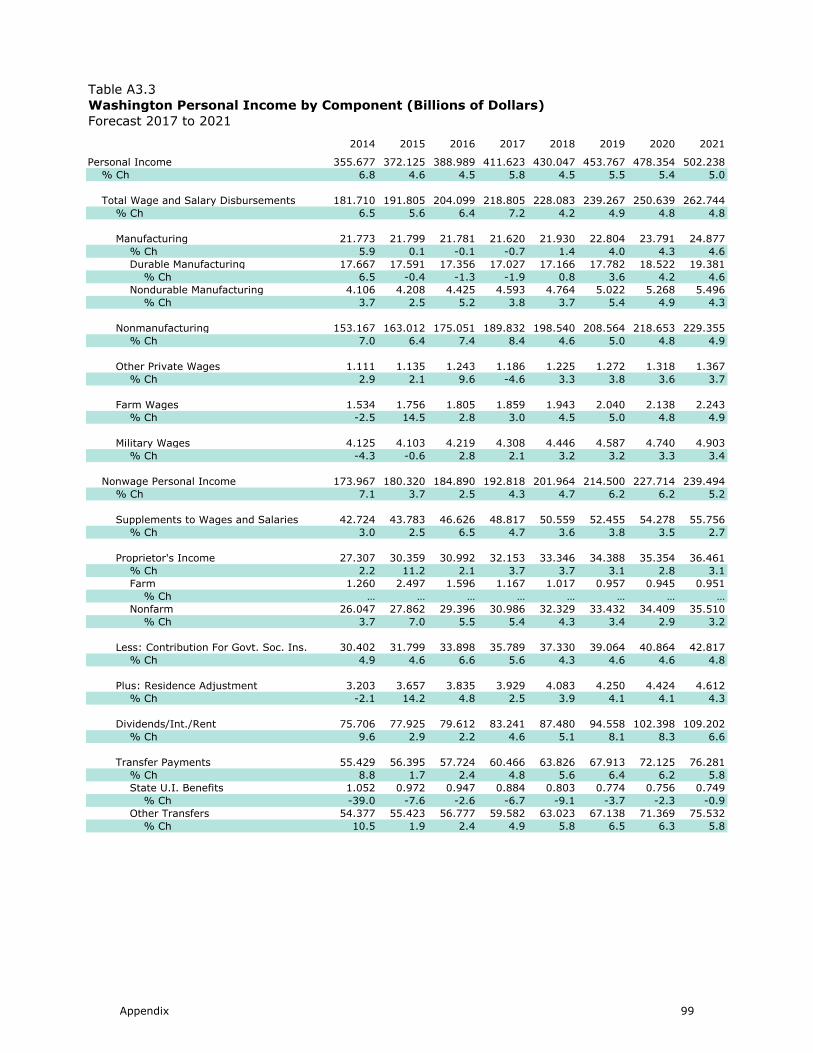
Table A3.3
Washington Personal Income by Component (Billions of Dollars)
Forecast 2017 to 2021
2014 2015 2016 2017 2018 2019 2020 2021
Personal Income 355.677 372.125 388.989 411.623 430.047 453.767 478.354 502.238
% Ch 6.8 4.6 4.5 5.8 4.5 5.5 5.4 5.0
Total Wage and Salary Disbursements 181.710 191.805 204.099 218.805 228.083 239.267 250.639 262.744
% Ch 6.5 5.6 6.4 7.2 4.2 4.9 4.8 4.8
Manufacturing 21.773 21.799 21.781 21.620 21.930 22.804 23.791 24.877
% Ch 5.9 0.1 -0.1 -0.7 1.4 4.0 4.3 4.6
Durable Manufacturing 17.667 17.591 17.356 17.027 17.166 17.782 18.522 19.381
% Ch 6.5 -0.4 -1.3 -1.9 0.8 3.6 4.2 4.6
Nondurable Manufacturing 4.106 4.208 4.425 4.593 4.764 5.022 5.268 5.496
% Ch 3.7 2.5 5.2 3.8 3.7 5.4 4.9 4.3
Nonmanufacturing 153.167 163.012 175.051 189.832 198.540 208.564 218.653 229.355
% Ch 7.0 6.4 7.4 8.4 4.6 5.0 4.8 4.9
Other Private Wages 1.111 1.135 1.243 1.186 1.225 1.272 1.318 1.367
% Ch 2.9 2.1 9.6 -4.6 3.3 3.8 3.6 3.7
Farm Wages 1.534 1.756 1.805 1.859 1.943 2.040 2.138 2.243
% Ch -2.5 14.5 2.8 3.0 4.5 5.0 4.8 4.9
Military Wages 4.125 4.103 4.219 4.308 4.446 4.587 4.740 4.903
% Ch -4.3 -0.6 2.8 2.1 3.2 3.2 3.3 3.4
Nonwage Personal Income 173.967 180.320 184.890 192.818 201.964 214.500 227.714 239.494
% Ch 7.1 3.7 2.5 4.3 4.7 6.2 6.2 5.2
Supplements to Wages and Salaries 42.724 43.783 46.626 48.817 50.559 52.455 54.278 55.756
% Ch 3.0 2.5 6.5 4.7 3.6 3.8 3.5 2.7
Proprietor's Income 27.307 30.359 30.992 32.153 33.346 34.388 35.354 36.461
% Ch 2.2 11.2 2.1 3.7 3.7 3.1 2.8 3.1
Farm 1.260 2.497 1.596 1.167 1.017 0.957 0.945 0.951
% Ch … … … … … … … …
Nonfarm 26.047 27.862 29.396 30.986 32.329 33.432 34.409 35.510
% Ch 3.7 7.0 5.5 5.4 4.3 3.4 2.9 3.2
Less: Contribution For Govt. Soc. Ins. 30.402 31.799 33.898 35.789 37.330 39.064 40.864 42.817
% Ch 4.9 4.6 6.6 5.6 4.3 4.6 4.6 4.8
Plus: Residence Adjustment 3.203 3.657 3.835 3.929 4.083 4.250 4.424 4.612
% Ch -2.1 14.2 4.8 2.5 3.9 4.1 4.1 4.3
Dividends/Int./Rent 75.706 77.925 79.612 83.241 87.480 94.558 102.398 109.202
% Ch 9.6 2.9 2.2 4.6 5.1 8.1 8.3 6.6
Transfer Payments 55.429 56.395 57.724 60.466 63.826 67.913 72.125 76.281
% Ch 8.8 1.7 2.4 4.8 5.6 6.4 6.2 5.8
State U.I. Benefits 1.052 0.972 0.947 0.884 0.803 0.774 0.756 0.749
% Ch -39.0 -7.6 -2.6 -6.7 -9.1 -3.7 -2.3 -0.9
Other Transfers 54.377 55.423 56.777 59.582 63.023 67.138 71.369 75.532
% Ch 10.5 1.9 2.4 4.9 5.8 6.5 6.3 5.8
Appendix 99

Table A3.4
Washington Personal Income by Component (Billions of Dollars)
Forecast 2017 to 2021
2016:1 2016:2 2016:3 2016:4 2017:1 2017:2 2017:3 2017:4
Personal Income 381.664 386.905 391.825 395.563 406.607 410.103 413.031 416.750
% Ch, Annual Rate 5.2 5.6 5.2 3.9 11.6 3.5 2.9 3.7
Total Wage and Salary Disbursements 200.063 203.243 206.206 206.883 216.084 218.292 219.471 221.373
% Ch, Annual Rate 8.6 6.5 6.0 1.3 19.0 4.1 2.2 3.5
Manufacturing 21.571 21.892 21.998 21.662 22.105 21.499 21.455 21.421
% Ch, Annual Rate -4.4 6.1 1.9 -6.0 8.4 -10.5 -0.8 -0.6
Durable Manufacturing 17.187 17.475 17.550 17.212 17.537 16.941 16.854 16.776
% Ch, Annual Rate -7.5 6.9 1.7 -7.5 7.8 -12.9 -2.0 -1.9
Nondurable Manufacturing 4.384 4.417 4.448 4.450 4.568 4.558 4.600 4.646
% Ch, Annual Rate 9.6 3.0 2.8 0.2 11.1 -0.9 3.8 4.0
Nonmanufacturing 171.123 174.081 176.965 178.036 186.684 189.444 190.643 192.558
% Ch, Annual Rate 9.8 7.1 6.8 2.4 20.9 6.0 2.6 4.1
Other Private Wages 1.354 1.246 1.217 1.156 1.175 1.185 1.187 1.195
% Ch, Annual Rate 140.7 -28.2 -9.1 -18.7 6.9 3.4 0.7 2.5
Farm Wages 1.787 1.799 1.811 1.823 1.835 1.855 1.864 1.881
% Ch, Annual Rate 2.1 2.7 2.7 2.7 2.7 4.5 1.9 3.6
Military Wages 4.228 4.224 4.215 4.207 4.284 4.307 4.321 4.318
% Ch, Annual Rate 8.1 -0.3 -0.8 -0.8 7.5 2.2 1.3 -0.3
Nonwage Personal Income 181.601 183.662 185.618 188.679 190.523 191.811 193.560 195.377
% Ch, Annual Rate 1.6 4.6 4.3 6.8 4.0 2.7 3.7 3.8
Supplements to Wages and Salaries 45.985 46.453 46.638 47.427 48.131 48.683 49.083 49.373
% Ch, Annual Rate 13.8 4.1 1.6 6.9 6.1 4.7 3.3 2.4
Proprietor's Income 30.500 30.771 31.150 31.546 31.876 31.925 32.235 32.575
% Ch, Annual Rate -6.1 3.6 5.0 5.2 4.3 0.6 3.9 4.3
Farm 1.654 1.649 1.631 1.449 1.286 1.181 1.123 1.076
% Ch, Annual Rate … … … … … … … …
Nonfarm 28.846 29.122 29.519 30.096 30.590 30.744 31.112 31.500
% Ch, Annual Rate 6.2 3.9 5.6 8.1 6.7 2.0 4.9 5.1
Less: Contribution For Govt. Soc. Ins. 33.454 33.791 33.989 34.357 35.207 35.696 35.985 36.269
% Ch, Annual Rate 13.8 4.1 2.4 4.4 10.3 5.7 3.3 3.2
Plus: Residence Adjustment 3.749 3.832 3.887 3.870 3.869 3.916 3.948 3.984
% Ch, Annual Rate -1.5 9.1 5.9 -1.8 -0.1 5.0 3.2 3.8
Dividends/Int./Rent 78.248 79.230 79.908 81.062 82.007 82.862 83.640 84.456
% Ch, Annual Rate 2.5 5.1 3.5 5.9 4.7 4.2 3.8 4.0
Transfer Payments 56.572 57.166 58.024 59.132 59.848 60.120 60.639 61.259
% Ch, Annual Rate 2.3 4.3 6.1 7.9 4.9 1.8 3.5 4.2
State U.I. Benefits 0.965 0.942 0.966 0.915 0.903 0.898 0.898 0.836
% Ch, Annual Rate -1.8 -9.0 10.6 -19.7 -5.0 -2.2 0.0 -24.8
Other Transfers 55.608 56.224 57.058 58.217 58.945 59.222 59.741 60.422
% Ch, Annual Rate 2.4 4.5 6.1 8.4 5.1 1.9 3.6 4.6
Appendix 100

Table A3.4 (continued)
Washington Personal Income by Component (Billions of Dollars)
Forecast 2017 to 2021
2018:1 2018:2 2018:3 2018:4 2019:1 2019:2 2019:3 2019:4
Personal Income 422.138 427.129 432.560 438.362 444.802 450.711 456.796 462.759
% Ch, Annual Rate 5.3 4.8 5.2 5.5 6.0 5.4 5.5 5.3
Total Wage and Salary Disbursements 224.059 226.720 229.431 232.123 235.127 237.925 240.617 243.400
% Ch, Annual Rate 4.9 4.8 4.9 4.8 5.3 4.8 4.6 4.7
Manufacturing 21.606 21.839 22.036 22.238 22.468 22.688 22.918 23.141
% Ch, Annual Rate 3.5 4.4 3.7 3.7 4.2 4.0 4.1 3.9
Durable Manufacturing 16.927 17.099 17.244 17.392 17.547 17.699 17.862 18.021
% Ch, Annual Rate 3.7 4.1 3.5 3.5 3.6 3.5 3.7 3.6
Nondurable Manufacturing 4.678 4.740 4.792 4.846 4.922 4.989 5.056 5.120
% Ch, Annual Rate 2.8 5.4 4.4 4.6 6.4 5.6 5.5 5.2
Nonmanufacturing 194.911 197.286 199.752 202.211 204.827 207.356 209.773 212.300
% Ch, Annual Rate 5.0 5.0 5.1 5.0 5.3 5.0 4.7 4.9
Other Private Wages 1.207 1.219 1.232 1.243 1.256 1.267 1.278 1.289
% Ch, Annual Rate 4.2 4.1 4.0 3.8 4.2 3.7 3.4 3.5
Farm Wages 1.906 1.930 1.955 1.979 2.005 2.029 2.052 2.076
% Ch, Annual Rate 5.4 5.3 5.2 5.0 5.4 4.8 4.6 4.7
Military Wages 4.430 4.444 4.457 4.452 4.571 4.585 4.597 4.595
% Ch, Annual Rate 10.8 1.3 1.1 -0.4 11.1 1.2 1.0 -0.1
Nonwage Personal Income 198.079 200.409 203.129 206.239 209.675 212.786 216.180 219.359
% Ch, Annual Rate 5.6 4.8 5.5 6.3 6.8 6.1 6.5 6.0
Supplements to Wages and Salaries 49.894 50.354 50.779 51.210 51.808 52.242 52.664 53.107
% Ch, Annual Rate 4.3 3.7 3.4 3.4 4.8 3.4 3.3 3.4
Proprietor's Income 32.884 33.262 33.483 33.755 34.042 34.304 34.492 34.715
% Ch, Annual Rate 3.8 4.7 2.7 3.3 3.5 3.1 2.2 2.6
Farm 1.047 1.029 1.005 0.986 0.970 0.956 0.952 0.948
% Ch, Annual Rate … … … … … … … …
Nonfarm 31.837 32.232 32.478 32.768 33.072 33.348 33.539 33.767
% Ch, Annual Rate 4.3 5.1 3.1 3.6 3.8 3.4 2.3 2.7
Less: Contribution For Govt. Soc. Ins. 36.794 37.159 37.506 37.860 38.557 38.898 39.220 39.580
% Ch, Annual Rate 5.9 4.0 3.8 3.8 7.6 3.6 3.4 3.7
Plus: Residence Adjustment 4.024 4.062 4.102 4.144 4.188 4.229 4.270 4.312
% Ch, Annual Rate 4.0 3.9 4.0 4.1 4.4 4.0 3.9 3.9
Dividends/Int./Rent 85.494 86.476 88.061 89.887 91.620 93.463 95.620 97.527
% Ch, Annual Rate 5.0 4.7 7.5 8.6 7.9 8.3 9.6 8.2
Transfer Payments 62.578 63.414 64.210 65.103 66.573 67.445 68.353 69.279
% Ch, Annual Rate 8.9 5.5 5.1 5.7 9.3 5.3 5.5 5.5
State U.I. Benefits 0.822 0.799 0.801 0.791 0.776 0.772 0.775 0.773
% Ch, Annual Rate -6.5 -10.8 1.1 -5.2 -7.2 -1.8 1.2 -1.0
Other Transfers 61.756 62.615 63.409 64.312 65.797 66.673 67.578 68.506
% Ch, Annual Rate 9.1 5.7 5.2 5.8 9.6 5.4 5.5 5.6
Appendix 101

Table A3.4 (continued)
Washington Personal Income by Component (Billions of Dollars)
Forecast 2017 to 2021
2020:1 2020:2 2020:3 2020:4 2021:1 2021:2 2021:3 2021:4
Personal Income 469.318 475.580 481.389 487.127 493.513 499.378 505.093 510.969
% Ch, Annual Rate 5.8 5.4 5.0 4.9 5.3 4.8 4.7 4.7
Total Wage and Salary Disbursements 246.220 249.258 252.078 255.000 258.167 261.184 264.263 267.362
% Ch, Annual Rate 4.7 5.0 4.6 4.7 5.1 4.8 4.8 4.8
Manufacturing 23.397 23.645 23.922 24.198 24.462 24.730 25.012 25.303
% Ch, Annual Rate 4.5 4.3 4.8 4.7 4.4 4.5 4.7 4.7
Durable Manufacturing 18.218 18.410 18.623 18.839 19.047 19.261 19.490 19.724
% Ch, Annual Rate 4.5 4.3 4.7 4.7 4.5 4.6 4.8 4.9
Nondurable Manufacturing 5.179 5.236 5.300 5.360 5.415 5.468 5.523 5.579
% Ch, Annual Rate 4.7 4.5 5.0 4.6 4.2 4.0 4.1 4.1
Nonmanufacturing 214.705 217.439 219.929 222.538 225.274 227.967 230.706 233.473
% Ch, Annual Rate 4.6 5.2 4.7 4.8 5.0 4.9 4.9 4.9
Other Private Wages 1.300 1.313 1.324 1.336 1.349 1.360 1.373 1.385
% Ch, Annual Rate 3.6 3.9 3.5 3.6 3.9 3.6 3.6 3.6
Farm Wages 2.100 2.126 2.151 2.176 2.203 2.229 2.256 2.283
% Ch, Annual Rate 4.8 5.1 4.7 4.8 5.1 4.8 4.9 4.8
Military Wages 4.719 4.734 4.752 4.753 4.880 4.897 4.916 4.918
% Ch, Annual Rate 11.2 1.3 1.5 0.1 11.1 1.4 1.6 0.2
Nonwage Personal Income 223.097 226.323 229.311 232.127 235.346 238.195 240.830 243.607
% Ch, Annual Rate 7.0 5.9 5.4 5.0 5.7 4.9 4.5 4.7
Supplements to Wages and Salaries 53.722 54.124 54.474 54.791 55.325 55.594 55.891 56.213
% Ch, Annual Rate 4.7 3.0 2.6 2.3 4.0 2.0 2.2 2.3
Proprietor's Income 34.916 35.217 35.512 35.769 36.019 36.313 36.605 36.907
% Ch, Annual Rate 2.3 3.5 3.4 2.9 2.8 3.3 3.3 3.3
Farm 0.943 0.945 0.948 0.943 0.946 0.951 0.954 0.954
% Ch, Annual Rate … … … … … … … …
Nonfarm 33.974 34.273 34.564 34.825 35.073 35.362 35.652 35.954
% Ch, Annual Rate 2.5 3.6 3.4 3.1 2.9 3.3 3.3 3.4
Less: Contribution For Govt. Soc. Ins. 40.311 40.686 41.026 41.433 42.258 42.627 43.003 43.380
% Ch, Annual Rate 7.6 3.8 3.4 4.0 8.2 3.5 3.6 3.6
Plus: Residence Adjustment 4.356 4.402 4.446 4.491 4.539 4.587 4.636 4.685
% Ch, Annual Rate 4.2 4.2 4.1 4.1 4.3 4.3 4.3 4.4
Dividends/Int./Rent 99.568 101.562 103.361 105.102 106.848 108.532 109.966 111.462
% Ch, Annual Rate 8.6 8.3 7.3 6.9 6.8 6.5 5.4 5.6
Transfer Payments 70.847 71.704 72.543 73.407 74.873 75.795 76.735 77.720
% Ch, Annual Rate 9.4 4.9 4.8 4.8 8.2 5.0 5.1 5.2
State U.I. Benefits 0.777 0.759 0.749 0.739 0.739 0.744 0.752 0.763
% Ch, Annual Rate 2.0 -8.9 -5.0 -5.3 -0.1 2.8 4.2 5.9
Other Transfers 70.070 70.945 71.794 72.668 74.134 75.051 75.983 76.957
% Ch, Annual Rate 9.5 5.1 4.9 5.0 8.3 5.0 5.1 5.2
Appendix 102
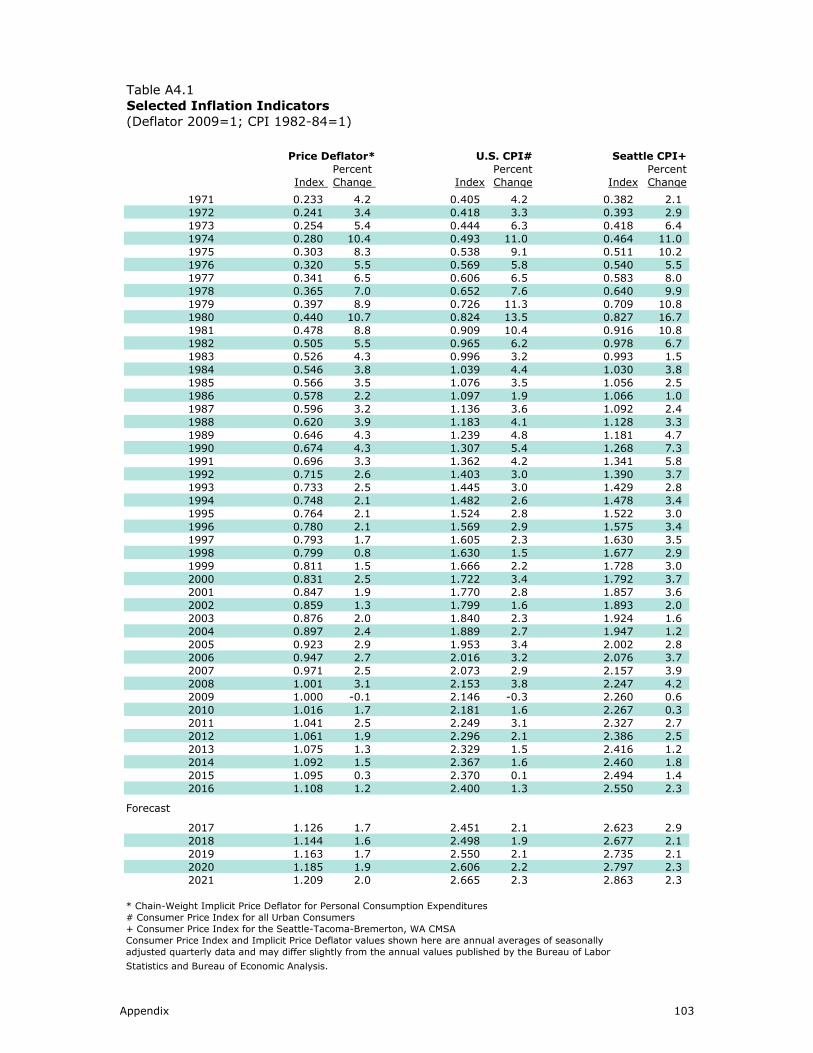
Table A4.1
Selected Inflation Indicators
(Deflator 2009=1; CPI 1982-84=1)
Price Deflator* U.S. CPI# Seattle CPI+
Percent Percent Percent
Index Change Index Change Index Change
1971 0.233 4.2 0.405 4.2 0.382 2.1
1972 0.241 3.4 0.418 3.3 0.393 2.9
1973 0.254 5.4 0.444 6.3 0.418 6.4
1974 0.280 10.4 0.493 11.0 0.464 11.0
1975 0.303 8.3 0.538 9.1 0.511 10.2
1976 0.320 5.5 0.569 5.8 0.540 5.5
1977 0.341 6.5 0.606 6.5 0.583 8.0
1978 0.365 7.0 0.652 7.6 0.640 9.9
1979 0.397 8.9 0.726 11.3 0.709 10.8
1980 0.440 10.7 0.824 13.5 0.827 16.7
1981 0.478 8.8 0.909 10.4 0.916 10.8
1982 0.505 5.5 0.965 6.2 0.978 6.7
1983 0.526 4.3 0.996 3.2 0.993 1.5
1984 0.546 3.8 1.039 4.4 1.030 3.8
1985 0.566 3.5 1.076 3.5 1.056 2.5
1986 0.578 2.2 1.097 1.9 1.066 1.0
1987 0.596 3.2 1.136 3.6 1.092 2.4
1988 0.620 3.9 1.183 4.1 1.128 3.3
1989 0.646 4.3 1.239 4.8 1.181 4.7
1990 0.674 4.3 1.307 5.4 1.268 7.3
1991 0.696 3.3 1.362 4.2 1.341 5.8
1992 0.715 2.6 1.403 3.0 1.390 3.7
1993 0.733 2.5 1.445 3.0 1.429 2.8
1994 0.748 2.1 1.482 2.6 1.478 3.4
1995 0.764 2.1 1.524 2.8 1.522 3.0
1996 0.780 2.1 1.569 2.9 1.575 3.4
1997 0.793 1.7 1.605 2.3 1.630 3.5
1998 0.799 0.8 1.630 1.5 1.677 2.9
1999 0.811 1.5 1.666 2.2 1.728 3.0
2000 0.831 2.5 1.722 3.4 1.792 3.7
2001 0.847 1.9 1.770 2.8 1.857 3.6
2002 0.859 1.3 1.799 1.6 1.893 2.0
2003 0.876 2.0 1.840 2.3 1.924 1.6
2004 0.897 2.4 1.889 2.7 1.947 1.2
2005 0.923 2.9 1.953 3.4 2.002 2.8
2006 0.947 2.7 2.016 3.2 2.076 3.7
2007 0.971 2.5 2.073 2.9 2.157 3.9
2008 1.001 3.1 2.153 3.8 2.247 4.2
2009 1.000 -0.1 2.146 -0.3 2.260 0.6
2010 1.016 1.7 2.181 1.6 2.267 0.3
2011 1.041 2.5 2.249 3.1 2.327 2.7
2012 1.061 1.9 2.296 2.1 2.386 2.5
2013 1.075 1.3 2.329 1.5 2.416 1.2
2014 1.092 1.5 2.367 1.6 2.460 1.8
2015 1.095 0.3 2.370 0.1 2.494 1.4
2016 1.108 1.2 2.400 1.3 2.550 2.3
Forecast
2017 1.126 1.7 2.451 2.1 2.623 2.9
2018 1.144 1.6 2.498 1.9 2.677 2.1
2019 1.163 1.7 2.550 2.1 2.735 2.1
2020 1.185 1.9 2.606 2.2 2.797 2.3
2021 1.209 2.0 2.665 2.3 2.863 2.3
* Chain-Weight Implicit Price Deflator for Personal Consumption Expenditures
# Consumer Price Index for all Urban Consumers
+ Consumer Price Index for the Seattle-Tacoma-Bremerton, WA CMSA
Consumer Price Index and Implicit Price Deflator values shown here are annual averages of seasonally
adjusted quarterly data and may differ slightly from the annual values published by the Bureau of Labor
Statistics and Bureau of Economic Analysis.
Appendix 103

Table A4.2
Chain-Weighted Price Indices
(2009=100)
Services Food Fuels Gasoline
Percent Percent Percent PercentIndex Change Index Change Index Change Index Change
1971 17.9 5.5 22.8 2.3 7.4 6.4 14.0 0.71972 18.7 4.2 23.9 4.8 7.5 0.6 14.2 1.31973 19.6 4.8 26.9 12.7 8.6 14.6 15.5 9.61974 21.3 8.5 31.0 15.2 13.6 58.9 21.0 35.11975 23.1 8.6 33.3 7.5 14.8 8.5 22.4 6.71976 24.7 6.9 34.0 1.9 15.9 7.3 23.3 4.21977 26.6 7.5 36.0 5.9 17.9 13.2 24.7 5.81978 28.6 7.8 39.4 9.6 19.0 5.7 25.8 4.31979 31.0 8.4 43.3 9.8 26.2 37.9 34.5 34.01980 34.2 10.3 46.9 8.4 36.7 40.4 47.9 38.81981 37.7 10.2 50.3 7.1 44.9 22.3 53.3 11.3
1982 40.6 7.8 51.6 2.6 44.1 -1.9 50.6 -5.11983 43.2 6.2 52.2 1.1 40.6 -7.8 48.9 -3.31984 45.4 5.2 53.7 3.0 41.5 2.2 48.2 -1.51985 47.7 5.0 54.3 1.1 39.9 -3.9 48.6 0.81986 49.6 4.1 55.6 2.4 31.2 -21.7 38.2 -21.51987 51.1 2.9 57.4 3.2 32.1 2.6 39.6 3.81988 53.5 4.8 59.1 3.0 32.0 0.0 40.0 0.81989 56.0 4.6 62.2 5.3 34.0 6.0 43.7 9.21990 58.5 4.5 65.2 4.9 40.9 20.4 49.7 13.81991 60.7 3.8 67.3 3.1 38.9 -4.8 49.1 -1.31992 62.8 3.5 67.8 0.8 37.3 -4.1 48.9 -0.41993 65.0 3.5 68.7 1.4 37.1 -0.7 48.4 -1.01994 66.8 2.7 69.9 1.7 36.4 -1.8 48.6 0.5
1995 68.6 2.7 71.4 2.2 36.1 -0.9 49.4 1.61996 70.5 2.7 73.6 3.1 40.9 13.3 52.4 6.11997 72.4 2.8 75.0 1.9 41.0 0.2 52.4 0.01998 73.9 2.1 75.9 1.3 36.3 -11.4 45.6 -12.91999 75.4 2.0 77.2 1.6 36.9 1.7 49.6 8.92000 77.5 2.8 79.0 2.3 54.1 46.6 63.4 27.82001 79.9 3.1 81.3 2.9 53.1 -2.0 61.2 -3.62002 82.0 2.6 82.5 1.5 47.3 -10.8 57.5 -6.02003 84.5 3.1 84.1 1.9 57.2 20.9 67.0 16.52004 87.1 3.0 86.7 3.1 66.6 16.4 78.8 17.62005 89.9 3.3 88.2 1.7 88.6 33.0 95.8 21.62006 93.0 3.4 89.7 1.7 100.7 13.7 108.0 12.82007 96.0 3.2 93.2 3.9 107.7 6.9 117.1 8.42008 98.9 3.1 98.9 6.1 146.0 35.6 136.6 16.6
2009 100.0 1.1 100.0 1.2 100.0 -31.5 100.0 -26.82010 101.7 1.7 100.3 0.3 117.0 17.0 118.2 18.22011 103.5 1.8 104.3 4.0 148.8 27.2 149.3 26.32012 105.8 2.2 106.7 2.3 150.7 1.3 154.7 3.62013 108.3 2.3 107.8 1.1 148.9 -1.2 149.7 -3.22014 110.9 2.5 109.8 1.8 148.2 -0.5 145.5 -2.82015 113.1 1.9 111.0 1.1 105.3 -29.0 107.0 -26.52016 115.9 2.5 109.9 -0.9 87.7 -16.7 95.3 -10.9
Forecast
2017 118.5 2.3 110.0 0.1 100.7 14.9 106.1 11.4
2018 121.1 2.2 111.6 1.4 106.6 5.8 105.2 -0.8
2019 123.9 2.3 113.3 1.6 109.6 2.8 106.1 0.8
2020 127.1 2.6 115.4 1.9 113.3 3.3 107.7 1.5
2021 130.4 2.6 117.6 1.8 117.3 3.5 109.6 1.8
Appendix 104

Table A5.1
Washington Resident Population and Components of Change*
(Thousands)
Percent Net
Population Change Change Births Deaths Migration
1970 3413.2 16.2 0.5 59.9 30.0 -13.7
1971 3436.3 23.1 0.7 60.0 29.8 -7.1
1972 3430.3 -6.0 -0.2 53.1 30.4 -28.7
1973 3444.3 14.0 0.4 47.7 30.4 -3.3
1974 3508.7 64.4 1.9 48.2 29.9 46.1
1975 3567.9 59.2 1.7 50.1 30.3 39.4
1976 3634.9 67.0 1.9 51.4 30.2 45.8
1977 3715.4 80.5 2.2 54.2 29.1 55.4
1978 3836.2 120.8 3.3 57.3 30.4 93.9
1979 3979.2 143.0 3.7 60.2 30.2 113.0
1980 4132.2 153.0 3.8 65.4 31.3 118.9
1981 4229.3 97.1 2.4 68.2 31.8 60.8
1982 4276.5 47.3 1.1 70.1 31.7 8.9
1983 4307.2 30.7 0.7 69.5 32.5 -6.2
1984 4354.1 46.8 1.1 68.5 33.2 11.6
1985 4415.8 61.7 1.4 69.1 34.0 26.6
1986 4462.2 46.4 1.1 70.2 34.0 10.2
1987 4527.1 64.9 1.5 69.3 34.4 30.0
1988 4616.9 89.8 2.0 71.0 36.0 54.8
1989 4728.1 111.2 2.4 73.0 36.0 74.2
1990 4866.7 138.6 2.9 76.4 36.2 98.5
1991 5000.4 133.7 2.7 79.1 36.6 91.2
1992 5091.1 90.8 1.8 80.2 37.2 47.7
1993 5188.0 96.9 1.9 79.1 39.4 57.1
1994 5291.6 103.6 2.0 78.2 39.5 64.9
1995 5396.6 105.0 2.0 77.5 40.0 67.5
1996 5483.1 86.5 1.6 77.0 41.2 50.7
1997 5579.1 96.0 1.8 78.0 42.6 60.6
1998 5685.5 106.3 1.9 78.8 41.6 69.1
1999 5792.2 106.8 1.9 79.8 43.1 70.1
2000 5894.1 101.9 1.8 79.9 43.7 65.8
2001 5970.5 76.3 1.3 80.7 43.9 39.5
2002 6059.7 89.2 1.5 79.3 44.9 54.9
2003 6126.9 67.2 1.1 79.1 44.7 32.9
2004 6208.5 81.6 1.3 81.0 46.0 46.7
2005 6298.8 90.3 1.5 81.8 45.6 54.0
2006 6420.2 121.4 1.9 83.2 45.3 83.5
2007 6525.1 104.9 1.6 87.8 46.2 63.3
2008 6608.2 83.1 1.3 89.6 47.9 41.5
2009 6672.3 64.0 1.0 89.8 48.1 22.3
2010 6724.5 52.3 0.8 88.4 47.7 11.5
2011 6767.9 43.4 0.6 86.4 48.8 5.8
2012 6817.8 49.9 0.7 87.1 49.2 12.0
2013 6882.4 64.6 0.9 87.3 51.1 28.5
2014 6968.2 85.8 1.2 87.0 50.7 49.5
2015 7061.4 93.2 1.3 88.5 52.8 57.6
2016 7183.7 122.3 1.7 90.0 54.6 86.9
Forecast
2017 7299.9 116.2 1.6 91.6 55.9 80.5
2018 7410.6 110.7 1.5 93.2 56.5 74.0
2019 7511.9 101.3 1.4 94.4 57.4 64.2
2020 7604.0 92.1 1.2 95.4 58.3 55.1
2021 7690.7 86.7 1.1 96.0 59.3 50.0
* As of April 1 of Each Year
Source: Office of Financial Management
Appendix 105

Table A5.2
Washington Population*
(Thousands)
2012 2013 2014 2015 2016 2017 2018 2019 2020 2021
Total Population 6817.8 6882.4 6968.2 7061.4 7183.7 7299.9 7410.6 7511.9 7604.0 7690.7 Percent Change 0.7 0.9 1.2 1.3 1.7 1.6 1.5 1.4 1.2 1.1
Age 17 and Under 1572.6 1577.2 1588.4 1602.8 1625.8 1647.3 1667.2 1685.4 1703.9 1721.0 Percent of Total 23.1 22.9 22.8 22.7 22.6 22.6 22.5 22.4 22.4 22.4
Age 6-18 1137.5 1141.1 1151.0 1162.2 1178.6 1193.0 1207.1 1219.0 1229.1 1241.3 Percent of Total 16.7 16.6 16.5 16.5 16.4 16.3 16.3 16.2 16.2 16.1
Age 18 and Over 5245.2 5305.2 5379.8 5458.7 5557.9 5652.5 5743.4 5826.4 5900.1 5969.6 Percent of Total 76.9 77.1 77.2 77.3 77.4 77.4 77.5 77.6 77.6 77.6
Age 21 and Over 4965.3 5029.2 5107.4 5187.1 5283.8 5375.1 5462.7 5543.8 5618.6 5689.9 Percent of Total 72.8 73.1 73.3 73.5 73.6 73.6 73.7 73.8 73.9 74.0
Age 20-34 1413.1 1426.9 1445.8 1458.8 1482.6 1502.6 1519.7 1534.6 1544.2 1551.6 Percent of Total 20.7 20.7 20.7 20.7 20.6 20.6 20.5 20.4 20.3 20.2
Age 18-64 4349.5 4365.7 4396.9 4431.0 4484.6 4531.8 4571.2 4603.1 4623.7 4641.6 Percent of Total 63.8 63.4 63.1 62.7 62.4 62.1 61.7 61.3 60.8 60.4
Age 65 and Over 895.6 939.5 982.8 1027.7 1073.3 1120.7 1172.2 1223.4 1276.5 1328.1 Percent of Total 13.1 13.7 14.1 14.6 14.9 15.4 15.8 16.3 16.8 17.3
* As of April 1 of Each Year
Source: Office of Financial Management
Actual Forecast
Appendix 106

Table A6.1
Summary of National and State Indicators
Indicator Latest Data Indication*
U.S. Leading Index August 2017 +
U.S. Real GDP Growth 2nd quarter 2017 +
U.S. ISM Index August 2017 +
U.S. Employment YOY%Δ August 2017 –
U.S. Unemployment Rate August 2017 –
U.S. Consumer Confidence September 2017 –
U.S. Consumer Sentiment September 2017 –
U.S. Light Vehicle Sales August 2017 –
U.S. CPI YOY%Δ August 2017 –
U.S. Home Prices YOY%Δ July 2017 +
S&P 500 Index September 2017 +
WA Leading Index August 2017 +
WA ISM-WW Index August 2017 +
WA Employment YOY%Δ August 2017 –
WA Aerospace Empl. YOY%Δ August 2017 –
WA Unemployment Rate August 2017 –
WA Help Wanted Index August 2017 –
WA Business Cycle Indicator August 2017 +
WA Initial Unemploy. Claims August 2017 –
WA Housing Permits August 2017 +
WA Weekly Hours in Mfg. August 2017 +
WA New Vehicle Registration August 2017 +
WA In-Migration August 2017 –
WA Exports-Total YOY%Δ 2nd quarter 2017 +
WA Exports- w/o Trans. Equip. YOY%Δ 2nd quarter 2017 +
Seattle CPI YOY%Δ August 2017 +
Seattle Home Prices YOY%Δ July 2017 +
WA Construction Activity Index August 2017 +
*Change from the previous reading
Appendix 107

Table A6.2
Washington Business Indicators
Historical Data
WA Index U.S. Index WA State WA State WA State WA Purchasing U.S. Purchasing
of Leading of Leading Business Cycle Construction Help Wanted Management Management
Indicators Indicators Indicator Index Index Index Index
2014:01 115.8 113.7 44.4 94.9 118.2 63.5 51.8
2014:02 115.5 114.3 43.0 93.1 118.5 68.7 54.3
2014:03 116.3 115.4 43.8 93.8 118.6 63.6 54.4
2014:04 117.1 115.8 45.9 97.1 120.6 53.7 55.3
2014:05 117.2 116.5 46.7 95.7 118.7 59.6 55.6
2014:06 118.4 117.2 47.0 97.4 121.0 67.0 55.7
2014:07 118.6 118.4 48.7 97.4 121.3 50.1 56.4
2014:08 118.8 118.5 49.0 98.1 121.6 62.9 58.1
2014:09 118.4 119.2 49.1 98.4 114.3 60.3 56.1
2014:10 119.1 119.9 49.1 101.0 119.0 57.6 57.9
2014:11 119.8 120.5 51.4 101.7 128.0 63.1 57.6
2014:12 119.5 121.0 51.8 102.8 122.0 53.3 55.1
2015:01 119.2 121.2 53.0 98.6 127.6 66.6 53.5
2015:02 120.4 120.9 57.7 108.6 137.2 65.9 52.9
2015:03 119.9 121.5 57.7 100.4 138.8 64.1 51.5
2015:04 120.1 122.2 58.3 99.5 135.7 60.4 51.5
2015:05 120.4 122.8 58.5 98.1 139.0 60.3 52.8
2015:06 120.7 122.9 58.8 99.6 136.0 51.4 53.5
2015:07 120.4 122.8 59.9 99.8 141.0 53.6 52.7
2015:08 120.1 122.8 59.2 99.6 139.1 48.0 51.1
2015:09 118.6 122.6 58.3 94.6 126.6 48.0 50.2
2015:10 119.9 123.2 59.9 99.8 132.4 46.1 50.1
2015:11 120.1 123.7 60.4 100.4 134.3 50.0 48.6
2015:12 119.6 123.3 63.0 98.5 130.7 54.5 48.0
2016:01 119.4 123.0 64.6 100.6 128.7 57.2 48.2
2016:02 119.6 123.0 66.0 101.7 124.9 55.4 49.7
2016:03 120.6 123.0 64.3 104.8 128.9 55.7 51.7
2016:04 121.3 123.6 64.5 103.4 130.9 50.8 50.7
2016:05 122.3 123.4 67.2 106.2 148.2 49.2 51.0
2016:06 122.1 122.9 67.6 104.2 151.3 49.1 52.8
2016:07 122.3 123.5 68.5 103.0 156.3 50.8 52.3
2016:08 122.3 123.4 67.3 102.7 153.1 47.7 49.4
2016:09 122.1 123.7 67.8 102.3 143.4 51.4 51.7
2016:10 122.1 123.9 69.6 100.1 152.3 53.1 52.0
2016:11 122.0 124.1 71.1 102.0 148.8 53.3 53.5
2016:12 121.6 124.7 72.0 102.2 149.2 47.3 54.5
2017:01 122.3 125.4 71.3 100.4 152.5 54.2 56.0
2017:02 121.6 125.9 70.1 99.9 140.1 48.6 57.7
2017:03 122.7 126.4 72.9 101.2 143.4 59.2 57.2
2017:04 123.5 126.7 71.3 107.3 143.3 59.2 54.8
2017:05 123.6 127.1 73.2 100.5 149.2 45.0 54.9
2017:06 124.2 127.9 72.0 103.4 145.4 50.0 57.8
2017:07 124.4 128.3 71.9 104.6 139.5 47.0 56.3
2017:08 124.8 128.8 72.9 105.6 135.1 58.2 58.8
Appendix 108

* Bureau of Labor Statistics, WA State Employment Security, ERFC Kalman Filtered Data * Source: Bureau of Labor Statistics, ERFC
* Source: Bureau of Labor Statistics * Source: ERFC
Figure A7.1: Washington State Economic Indicators
Unemployment Rate, S.A.
January 1980 to August 2017
Washington Aircraft and Parts Employment
January 1958 to August 2017
Washington Business Cycle Indicator
January 1968 to August 2017
Year-over-Year Employment Growth
January 1980 to August 2017
-6
-4
-2
0
2
4
6
8
1980 1984 1988 1992 1996 2000 2004 2008 2012 2016
Percent Washington U.S.
2
4
6
8
10
12
14
1980 1984 1988 1992 1996 2000 2004 2008 2012 2016
Percent Washington U.S.
0
20
40
60
80
100
120
140
1958 1965 1972 1979 1986 1993 2000 2007 2014
Thousands
0
10
20
30
40
50
60
70
80
90
100
1967 1972 1977 1982 1987 1992 1997 2002 2007 2012 2017
Average = 50
* Shaded areas correspond with national recessions.
Appendix 109
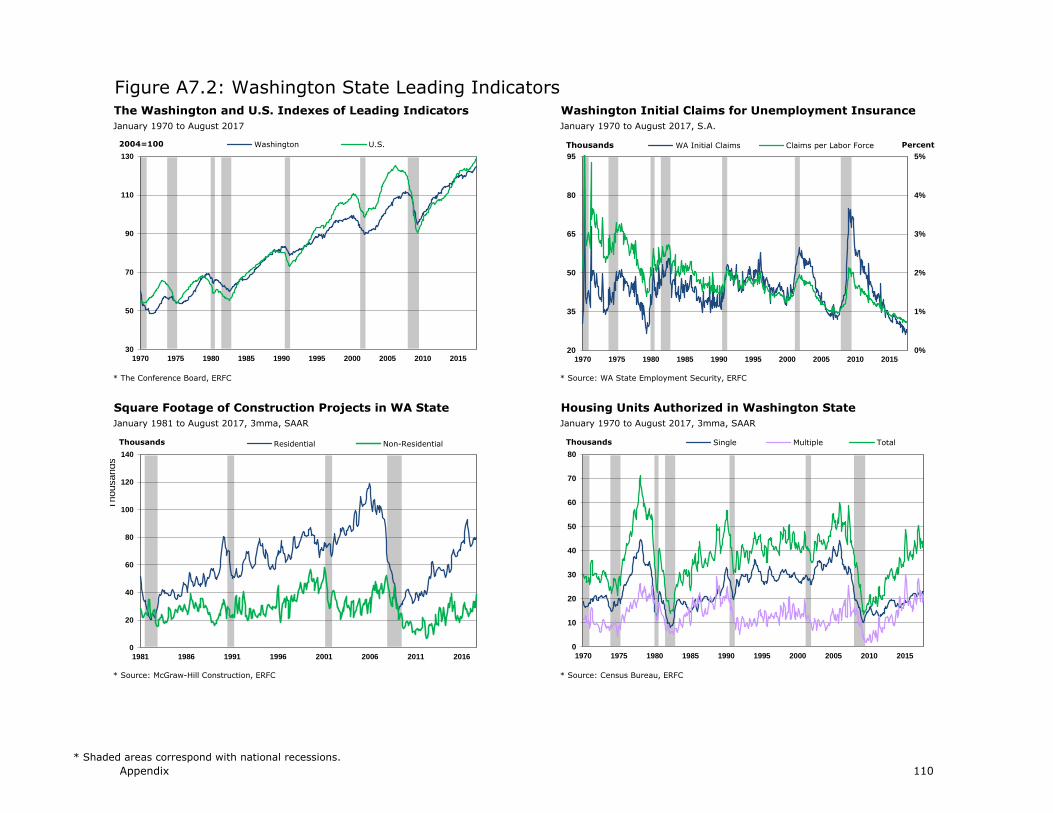
* The Conference Board, ERFC * Source: WA State Employment Security, ERFC
* Source: McGraw-Hill Construction, ERFC * Source: Census Bureau, ERFC
Figure A7.2: Washington State Leading Indicators
Square Footage of Construction Projects in WA State
January 1981 to August 2017, 3mma, SAAR
Washington Initial Claims for Unemployment Insurance
January 1970 to August 2017, S.A.
Housing Units Authorized in Washington State
January 1970 to August 2017, 3mma, SAAR
The Washington and U.S. Indexes of Leading Indicators
January 1970 to August 2017
30
50
70
90
110
130
1970 1975 1980 1985 1990 1995 2000 2005 2010 2015
2004=100 Washington U.S.
0
20
40
60
80
100
120
140
1981 1986 1991 1996 2001 2006 2011 2016
Thousands
Thousands Residential Non-Residential
0%
1%
2%
3%
4%
5%
20
35
50
65
80
95
1970 1975 1980 1985 1990 1995 2000 2005 2010 2015
PercentThousands WA Initial Claims Claims per Labor Force
0
10
20
30
40
50
60
70
80
1970 1975 1980 1985 1990 1995 2000 2005 2010 2015
Thousands Single Multiple Total
* Shaded areas correspond with national recessions.
Appendix 110

* Bureau of Labor Statistics, ERFC * Source: WA State Department of Licensing, ERFC
* Source: WA State Department of Licensing, ERFC * Source: Institute for Supply Management, ISM-WW, ERFC
Figure A7.3: Other State Economic Indicators
New Car and Truck Registrations in Washington
September 1970 to August 2017, 3-Month Moving Average, S.A.
Washington Driver's License In-Migration
January 1988 to August 2017, 12-Month Moving Average
Institute for Supply Management Index
March 1982 to August 2017, 3-Month Moving Average, S.A.
Average Weekly Hours in Manufacturing
June 1969 to August 2017, 6-Mo. Moving Average, S.A.
37
38
39
40
41
42
43
44
1969 1974 1979 1984 1989 1994 1999 2004 2009 2014
Hours Washington U.S.
8
10
12
14
16
18
20
22
24
26
28
1970 1975 1980 1985 1990 1995 2000 2005 2010 2015
Thousands
7
9
11
13
15
17
19
1988 1991 1994 1997 2000 2003 2006 2009 2012 2015
Thousands
25
30
35
40
45
50
55
60
65
70
75
1982 1986 1990 1994 1998 2002 2006 2010 2014
Index Value Washington U.S.
* Shaded areas correspond with national recessions.
Appendix 111

* Source: Bureau of Economic Analysis * Source: WISER
* Source: The Conference Board * Source: ERFC
Figure A7.4: Other Economic Indicators
U.S. Economic Indicators
January 1969 to August 2017
Washington State Export Composition
1998Q1 to 2017Q2, Year-over-year percent change
National Stock Indexes
January 1, 1996 to September 18, 2017
Quarterly U.S. Real GDP Growth
1970Q1 to 2017Q2, SAAR
20
40
60
80
100
120
140
1969 1974 1979 1984 1989 1994 1999 2004 2009 2014
2004=100 Leading Coincident Lagging
0
50
100
150
200
250
300
350
400
450
500
1996 1998 2000 2002 2004 2006 2008 2010 2012 2014 2016
Per. Ch since 1/1/96 S&P 500 NASDAQ DJIA
-10
-5
0
5
10
15
20
1970 1975 1980 1985 1990 1995 2000 2005 2010 2015
Percent
-60
-30
0
30
60
90
120
1998 2000 2002 2004 2006 2008 2010 2012 2014 2016
Percent Total Transportation Equipment Other
* Shaded areas correspond with national recessions.
Appendix 112

* Federal Reserve * Source: The Conference Board, University of Michigan
* Source: Bureau of Labor Statistics * Source: Case Shiller, ERFC
Figure A7.4: Other Economic Indicators (continued…)
Seattle vs U.S. CPI (All Urban Consumers)
December 1998 to August 2017
Consumer Confidence
March 1978 to September 2017
Case Shiller Home Price Index
January 2001 to July 2017, SA
Federal Funds Target Rate
January 1, 1990 to September 27, 2017
0
1
2
3
4
5
6
7
8
9
1990 1993 1996 1999 2002 2005 2008 2011 2014 2017
Percent
25
50
75
100
125
150
1978 1983 1988 1993 1998 2003 2008 2013
Index Conference Board Confidence U of Michigan Sentiment
-25
-20
-15
-10
-5
0
5
10
15
20
25
2001 2003 2005 2007 2009 2011 2013 2015 2017
Y-O-Y Percent Ch Seattle Composite 20
-3
-2
-1
0
1
2
3
4
5
6
7
1998 2000 2002 2004 2006 2008 2010 2012 2014 2016
Y-O-Y Percent Ch Seattle US
* Shaded areas correspond with national recessions.
Appendix 113

This page left intentionally blank.
Glossary Biennium: The state’s two years budget cycle. Cash Basis: Cash receipts received during a period. The Forecast Council forecasts revenues on a Cash and GAAP (Generally Accepted Accounting Principles) basis.
CPI: The Consumer Price Index for All Urban Consumers. The Bureau of Labor Statistics (BLS) updates the CPI monthly, surveying over 60,000 goods in 85 urban areas. Tax Elasticity: A measure of how tax revenues respond to changes in personal income. If tax revenue elasticity is greater than one, a one percent change in personal income will be associated with more than a one percent increase in tax revenues. If elasticity is less than one, a one percent increase
in personal income will be associated with less than a one percent increase in tax revenues. Fiscal Year: The state’s budget year. Washington State’s fiscal year runs from July 1 through June
30. Fiscal year 2016, for example, ran from July 1, 2015 through June 30, 2016. GAAP Basis: Generally Accepted Accounting Principles measure revenue in the period during which they accrue rather than the period in which they are received.
General Fund: Accounts for all financial resources and transactions not accounted for in another fund. General Fund-State (GF-S) Revenue: Resources from state sources only, excludes federal monies. The general fund is the principal state fund supporting the operation of the state. Implicit Price Deflator, PCE (IPD): The IPD for consumption is a by-product of the National
Income and Product Accounts. It is derived by dividing current dollar (nominal) consumer expenditures by constant dollar (real) consumer expenditures. Mortgage Rate: The average interest rate on 30-year conventional loan (as reported by Freddie Mac).
Near General Fund: All accounts included in the General Fund - State plus the Education Legacy
Trust Account. Non-Wage Income: Personal income other than from wages and salaries. The major components are: proprietor’s income, transfer payments, and dividends, interest and rent. Real GDP: Gross Domestic Production adjusted for the price level.
Revenue Act: Revenue Act taxes consist of the retail sales tax, use tax, business and occupation tax, public utility tax and tobacco products tax, plus penalty and interest payments associated with those taxes. Personal Income: Income from wages and salaries; other labor income; proprietor’s income; dividends, interest and rent; transfer payments; and a residence adjustment. It is reduced by
employee contributions for social insurance.
Seasonally Adjusted: Adjusted for normal seasonal variations. Monthly statistics, such as the unemployment rate, are seasonally adjusted to make month-to-month comparisons possible. Seasonally Adjusted Annual Rate: A rate for a given period that is typically less than one year, but that is computed as if the rate were for a full year and seasonally adjusted.
Nonfarm Payroll Employment: Civilian non-farm payroll employees. The self-employed, farm workers, members of the armed forces, private household employees, and workers on strike are excluded.
Glossary 115


