35
Washington State Performance Plan (SPP) Indicator Summary 2021

Washington State Performance Plan (SPP) Indicator Summary 2021
Table of Contents Table of Contents .......................................................................................................................................................................................... 2
Indicator B1: Graduating with a regular high school diploma ..................................................................................................... 3
Indicator B2: Exiting high school by dropping out ........................................................................................................................... 5
Indicator B3: Participation and proficiency on statewide assessments .................................................................................... 8
Indicator B4: Suspension and expulsion ............................................................................................................................................ 10
Indicator B5: K-12 Least Restrictive Environment .......................................................................................................................... 12
Indicator B6: Early Childhood Least Restrictive Environment .................................................................................................... 14
Indicator B7: Early Childhood Outcomes .......................................................................................................................................... 16
Percent of preschool children aged 3 through 5 with IEPs who demonstrate improved:............................... 16
A.Positive social-emotional skills (including social relationships); ........................................................................... 16
B.Acquisition & use of knowledge & skills (including early language/communication & early literacy) .. 16
C.Use of appropriate behaviors to meet their needs .................................................................................................... 16
Indicator B8: Parent Involvement ......................................................................................................................................................... 18
Indicator B9/B10: Disproportionate representation...................................................................................................................... 20
Indicator B11: Child Find: Timely Eligibility Determinations ...................................................................................................... 22
Indicator B12: Child Find: Timely Transition from Part C to Part B .......................................................................................... 24
Indicator B13: Secondary Transition IEP Components ................................................................................................................. 26
Indicator B14: Post-School Outcomes ............................................................................................................................................... 28
Indicator B15: Resolution Sessions ...................................................................................................................................................... 30
Indicator B16: Mediations ....................................................................................................................................................................... 31
Indicator B17: State Systemic Improvement Plan (SSIP) ............................................................................................................. 32
LEGAL NOTICE ........................................................................................................................................................................................... 34

Indicator Technical Assistance Guide 3 | P a g e
Indicator B1: Graduating with a regular high school diploma Measurement: Percent of youth with Individualized Education Programs (IEPs) graduating from high school with a regular diploma in four years.
Indicator Goal: The goal of Indicator B1 is to improve the graduation rate of students with disabilities. Washington has a gap between the graduation rate of students with and without disabilities. This document can help determine if there is a graduation gap in a district and to identify resources that can help to close that gap.
Indicator Connections: To graduate, students must remain in school (see Indicator B2: Dropout Rate). Creating and implementing a strong transition plan with appropriate supports for students (see Indicator B13: Transition IEP Components) may help to create a strong foundation for students to reach the goal of being college, career, and life ready (see Indicator B14: Post-School Outcomes).
ENTERING/ACCESSING YOUR DATA Indicator Access Points Submission Timelines
Data for this indicator comes from OSPI’s statewidedata system (the Comprehensive Education Data and Research System, or CEDARS) Element C09 – School Withdrawal Code.
Students included in this report are students who were enrolled on July 1 through June 30 of the reporting period. Data are extracted from CEDARS after they are finalized from the prior school year. For the SPP submitted February 2022, the 2019-20 data will be used.
ANALYZING YOUR DATA Calculation Guide
How CEDARS Data are Calculated is located after Indicator B14 of this document. Table 1 displays how CEDARS data are summarized for this indicator.
Calculation Example Using State Data Basis of Exit (State Data) SY1617 SY1718 SY1819 SY1920
Graduated with Regular High School Diploma 5692 5880 6588 6529 Reached Maximum Age 12 23 28 30 Dropped Out 2782 2904 3042 2275 % of Exiters who Graduated with Regular High School Diploma 67.1% 66.8% 68.2% 73.9%
IMPROVING YOUR RESULTS What factors led to students completing high school in four years? Were similar strategies and
procedures in place for all students with disabilities?
Is the most appropriate curriculum for each student being implemented? How can districts work with younger students to ensure that the proper course of study is being

Indicator Technical Assistance Guide 4 | P a g e
followed and necessary credits are being earned toward graduation?
FREQUENTLY ASKED QUESTIONS • Are my district’s data accurate? Your data are taken from the information the district entered
into CEDARS. Remember: SPP/APR Graduation data is always one year behind. The 2020-2021 report includes 2019-2020 graduates.
• What are the graduation requirements for earning a high school diploma? Refer to OSPI’s Graduation webpage which includes information on graduation requirements for each class/cohort.
• What about students who receive transition services beyond age 18? A student’s IEP team may determine that it is in the best interest of the student to continue with services and therefore, not graduate as part of the cohort.
RESOURCES • OSPI Graduation Webpage
• Quality Indicators for Secondary Transition (QuIST) self-assessment tool
• Center for Change in Transition Services (CCTS, a State Needs Project)

Indicator Technical Assistance Guide 5 | P a g e
Indicator B2: Exiting high school by dropping out Measurement: Percent of students with IEPs exiting high school by dropping out.
Indicator Goal: The goal of Indicator B2 is to decrease the dropout rate of students with disabilities. Washington recognizes that students with disabilities have a higher dropout rate than their nondisabled peers. This document can help determine if there is a dropout gap between students with disabilities and their non-disabled peers in a district, and to identify resources that can help to close that gap.
Indicator Connections: Research shows a strong link between suspension (see Indicator B4) and student dropout rates. Also, creating and implementing a strong transition plan with appropriate supports for students (see Indicator B13: Transition), will help to create a strong foundation for students to reach the goal of being prepared for college, career, and life (see Indicator B14: Post High School Outcomes). Graduation (see Indicator B1) will more likely occur when students are provided motivation to remain in school.
ENTERING/ACCESSING YOUR DATA Indicator Access Points Submission Timelines
Results for this indicator come from CEDARS Element C09 – School Withdrawal Code.
Students included in this report are students who were enrolled on July 1 through June 30 of the reporting period. Data are extracted from CEDARS after they are finalized from the prior school year. For the SPP submitted February 2022, the 2019-20 data will be used.
ANALYZING YOUR DATA Calculation Guide
DHow CE ARS Data are Calculated is located after Indicator B14 of this document. Table 1 displays how CEDARS data are summarized for this indicator.
Calculation Example Using State Data Basis of Exit (State Data) SY1617 SY1718 SY1819 SY1920
Graduated with Regular High School Diploma 5692 5880 6588 6529 Reached Maximum Age 12 23 28 30 Dropped Out 2782 2904 3042 2275 % of Exiters Who Dropped Out 32.8% 33.0% 31.5% 25.8%
IMPROVING YOUR RESULTS Check for accuracy of data. Review CEDARS enrollment and special education records for accuracy. Determine reasons connected to students who dropped out (e.g., was an appropriate course of
study developed and followed)?
Determine if the IEP transition plan was not only implemented but revisited and adjusted when the IEP

Indicator Technical Assistance Guide 6 | P a g e
team deemed necessary.
Does the district monitor attendance records carefully? Does the district have a system for tracking access to services during suspension/expulsion?
FREQUENTLY ASKED QUESTIONS • Are my district’s data accurate? Your data are taken from the information the district entered
into CEDARS. Remember: SPP/APR Graduation data is always one year behind. The 2020-2021 report includes 2019-2020 graduates.
• How do we keep students from dropping out of school? Visit the National Dropout Prevention Center for Students with Disabilities for information on effective dropout prevention strategies, model programs, and research articles.
RESOURCES • National Dropout Prevention Center for Students with Disabilities
• Positive Behavioral Interventions and Supports
• Quality Indicators for Secondary Transition (QuIST) self-assessment tool
• Center for Change in Transition Services (CCTS, a State Needs Project)

Indicator Technical Assistance Guide 7 | P a g e
Table 1: How CEDARS Data are Calculated for Indicators B1 and B2, pre-population of Indicator B14 Students reported with the following school withdrawal codes will be included in the calculation of these indicators:
CEDARS Element C09
Withdrawal Status Code
Ind 1 N/D
Ind 2N/D Withdrawal Status Description
G0 N/D D Graduated with a regular High School DiplomaGA N/D D Graduated with Associates Degree GB N/D D Graduated with an International Baccalaureate High School Diploma
GM N/D D Graduated with both a regular High School Diploma (issued from district) and an Associate’s Degree
C1 D N/D Confirmed receipt of General Education Development (GED) certificate
C2 N/D D Graduated with a High School Diploma with modifications identified in student’s
Individualized Education Program (IEP) D1 D N/D Expelled or suspended and did not return D2 D N/D Attended 4 years or more and did not graduate (student drops or ages out) D3 D N/D Lack of academic progress or poor grades D4 D N/D School not for me D5 D N/D Married or needs to support family D6 D N/D Pregnant or had baby D7 D N/D Offered training or chose to work D8 D N/D Chose to stay home D9 D N/D Drugs or alcohol related D0 D N/D Other (dropped out, but reason unknown) DM D N/D Student exited school for medical reasons, is not receiving educational services U1 D N/D Unknown U2 D N/D Enrolled in prior year, but no show this year U3 D N/D Transfer reported by student (not confirmed)
CEDARS Element K09
Exit Reason
Code
Ind1 N/
Ind 2N/D Exit Reason Description
2 D D Aged Out (student obtained age 21 during current reporting school year)
N=used in numerator, D=used in denominator
Indicator Technical Assistance Guide 8 | P a g e
Indicator B3: Participation and proficiency on statewide assessments Measurement: A. Participation rate for children with IEPs.
B. Proficiency rate for children with IEPs against grade level academic achievement standards.
C. Proficiency rate for children with IEPs against alternate academic achievement standards. D. Gap in proficiency rates for children with IEPs and all students against grade level academic achievement
standards.
Indicator Goal: The goal of Indicator 3 is to improve the Math and ELA proficiency of students with IEPs on the statewide assessment.
Indicator Connections: A higher rate of participation should result in more accurate proficiency data for students with IEPs (see Indicator 3B: Participation). Suspension & Expulsion (see Indicators 4A & 4B) of students with IEPs could affect a student’s level of proficiency. Participation in the least restrictive environment (see Indicator 5: LRE) could also impact a student’s level of proficiency.
ENTERING/ACCESSING YOUR DATA Indicator Access Points Testing Window
Currently enrolled student records are identified through CEDARS (Element C10: IsPrimarySchool='Y'),or in the case of a student with only a non-primary record, the non-primary school enrollment is extracted and sent.
Online: March 7 – June 3, 2022 Paper/Pencil: April 11 – May 20, 2022
ANALYZING YOUR DATA Calculation Guide/Example
A=# of students with IEPs participating in a statewide assessment. B=# of students with IEPs enrolled during the testing window. C=# of students with IEPs scoring proficient or above against grade level standards. D=# of students with IEPs scoring proficient or above against alternative academic achievement
standards. E=# of students with IEPs who received a valid proficiency score for the regular assessment. F=# of students with IEPs who received a valid proficiency score for the alternate assessment.

Indicator Technical Assistance Guide 9 | P a g e
Calculation Guide/Example A=Alternate Assessment 853 +Medical Exemption = 2 + Reg Assess with Accommodations =3344 +
Reg Assess w/out Accommodations = 8589 B=13481 C=2376 D=552 E=10731 F=835
Calculation Example Using State Data Basis of Exit (State Data) SY1819
Ind 3A: (A ÷ B) X 100 = participation rate. 94.9% Ind 3B: (C ÷ E) X 100 = proficiency rate regular assessment 22.1% Ind 3C: (D÷ F) X 100 = proficiency rate alternate assessment. 66.1% Ind 3D: C-Proficiency for ALL students proficient against grade level standards = proficiency rate gap.
30.6%
IMPROVING YOUR RESULTS How does the district ensure that students with IEPs have access to appropriate curriculum and
instruction? Could LRE placement be affecting a student’s ELA and math proficiency? How are IEP teams identifying accommodations that might be needed on state assessments, and
how does the district ensure students receive those accommodations?
FREQUENTLY ASKED QUESTIONS • Are my district’s data accurate? Your data are taken from the information a district entered into
CEDARS. (Currently enrolled student records are identified through CEDARS (Element C10: IsPrimarySchool='Y'), or in the case of a student with only a non-primary record, the non-primary school enrollment is extracted and sent.)
• Where can I see my district’s assessment results? State, district, and school-level state assessment data are found on OSPI’s Report Card.
• How do IEP teams determine what state assessment a student should receive and what accommodations are needed? The IEP Team Guidelines for Statewide Accountability Assessments provides guidance to IEP teams on their authority related to decisions around accountability assessments and to help guide IEP teams in determining the appropriate assessment options for students.
RESOURCES • IEP Team Guidelines for Statewide Accountability Assessments
• OSPI’s Report Card
Indicator Technical Assistance Guide 10 | P a g e
Indicator B4: Suspension and expulsion Measurement: B4A: Percent of districts identified by the State as having a significant discrepancy in the rates of out-of-school suspensions and expulsions for students with IEPs for greater than 10 days (consecutive or accumulated) in a school year.
B4B: Percent of districts that have: (a) a significant discrepancy, by race or ethnicity, in the rate of out-of-school suspensions and expulsions of students with IEPs of greater than 10 days (consecutive or accumulated) in a school year; and (b) policies, procedures, or practices that contribute to the significant discrepancy and do not comply with requirements relating to the development and implementation of IEPs, the use of positive behavioral interventions and supports, and procedural safeguards.
INDICATOR GOALS:
Indicator Goal: The goal of Indicator B4A is to reduce the percent of districts that have a significant discrepancy in the rates of out-of-school suspensions and expulsions of students with IEPs of greater than 10 days in a school year.
The goal of Indicator B4B is to reduce the percent of districts that have a significant discrepancy, by race/ethnicity, in the rates of out-of-school suspensions and expulsions of students with IEPs of greater than 10 days in a school year and to ensure that the discrepancy is not the result of non-compliant policies, procedures, or practices.
Indicator Connections: A student’s academic achievement (see Indicator B3) and graduation rate (see Indicator B1) are directly related to their exposure to the general curriculum. When students are suspended from school, they are losing access to the general curriculum and falling further behind academically. Also, research shows a strong link between suspension and student dropout rates (see Indicator B2).
ENTERING/ACCESSING YOUR DATA Indicator Access Points Submission Timelines
Data for these indicators come primarily from CEDARS File R – Student Exclusionary Discipline File R.
Students included in this indicator are those with disciplinary incidents during the reporting school year. Data are extracted from CEDARS after they arefinalized, usually mid-August. For the SPP submitted February 2022, the 2019-20 data will be used.
ANALYZING YOUR DATA Calculation Guide
A=(B4A) # of students with IEPs suspended/expelled in the district with > 10 school days in the school year B=(B4B) # of Students with IEPs per race/ethnicity group suspended/ expelled in the district >10 school days
during the school year C=District’s November Federal Child Count B4A: (A ÷ C) x 100 = suspension rate for students with IEPs overall

Indicator Technical Assistance Guide 11 | P a g e
Calculation Guide B4B: (B ÷ C) x 100 = suspension rate for each race/ethnicity group
Significant Discrepancy: Currently**, a district is determined to have a significant discrepancy for students with IEPs overall, or within one of the seven federal race/ethnicity groups, if the district’s suspension rate for any group exceeds the single state bar (i.e., the state’s suspension rate for students with IEPs plus 25).
**OSPI is currently exploring other methods for calculating and determining a significant discrepancy.
Calculation Example Calculation Example 4A
28 students with IEPs suspended or expelled >10 school days during the year. 340 Total November Federal Child Count (28 ÷ 340) x 100 = 8.23%
Calculation Example 4B
5 Native American Students with IEPs suspended or expelled >10 school days during the year. 45 Total November Federal Child Count of Students identified as American Indian/Alaska Native (5 ÷ 45) x 100 = 1.47%
Indicator B4B is a compliance indicator requiring 0% of districts have a significant discrepancy in suspension/expulsion rates by race/ethnicity that is the result of non-compliant policies, procedures, or practices. If there are non-compliant policies, procedures, or practices contributing to the discrepancy, the district will be determined out of compliance and a corrective action will be issued.
IMPROVING YOUR RESULTS Review your district’s policies, practices, and procedures regarding suspension/ expulsion. Has
the process been followed? Does the district have discipline policies, procedures, or practices (e.g., zero tolerance) that may
be contributing to an increased number of students with disabilities, or students of a specific race/ethnicity group, being suspended/expelled?
What training does staff need to positively and proactively handle behavioral concerns?
FREQUENTLY ASKED QUESTIONS • Are my district’s data accurate? Your district’s CEDARS data should be reviewed throughout the
school year. Within CEDARS navigate to the Reports Tab and then select Record Loaded. In the search criteria make sure to select to appropriate school year and then in the File drop menu, choose File R. You will be able to review the incidents currently loaded in CEDARS.
Additionally, district staff are asked to review disciplinary incidents specifically for students with IEPs. These data are available in the Behavior and Weapons application in the Education Data System (EDS). This application usually opens in mid-May. Staff will have until August 1st to review and correct data.
RESOURCES • Disciplinary Incidents of Students with IEPs: Application User Guide
• Disproportionality Self-Study Tools

Indicator Technical Assistance Guide 12 | P a g e
Indicator B5: K-12 Least Restrictive Environment Measurement: Percent of children with IEPs aged 6 through 21 regardless of grade level, and age 5 not in Preschool, who are served:
A. Inside the regular class 80% or more of the day;
B. Inside the regular class less than 40% of the day;
C. In separate schools, residential facilities, or homebound/hospital placements.
Indicator Goal: The goal of Indicator B5 is to determine whether students with IEPs are appropriately placed in the least restrictive educational environment.
Indicator Connections: When students with IEPs receive instruction in the least restrictive environment, they are more likely to succeed on the statewide assessment (see Indicator B3), to graduate (see Indicator B1), and less likely to dropout (see Indicator B2).
ENTERING/ACCESSING YOUR DATA Indicator Access Points Submission Timelines
The source data for these indicators are primarily from CEDARS District Student File B, Student’s Attributes and Programs File I and Student Special Education Programs File K. The data are then populated into the Special Education November Federal Child Count Application for district staff to review and certify.
Students included in this indicator are those who are eligible on November 1 (or the first business day of November). Data are extracted from the Special Education November Federal Child Count Application, due in Mid-December.
ANALYZING YOUR DATA Calculation Guide
B5A: # of students with IEPs aged 6 through 21 regardless of grade level and age 5 not PK served inside the regular class 80% or more of the day / Total students with IEPs aged 5 who are enrolled in kindergarten and all grades aged 6 through 21
B5B: # of students with IEPs aged 6 through 21 regardless of grade level and age 5 not PK served inside the regular class less than 40% of the day / Total students with IEPs aged 5 who are enrolled in kindergarten and all grades aged 6 through 21
B5C: # of students with IEPs aged 6 through 21 regardless of grade level and age 5 not PK served in separate schools, residential facilities, or homebound/hospital placements / Total students with IEPs aged 5 who are enrolled in kindergarten and all grades aged 6 through 21

Indicator Technical Assistance Guide 13 | P a g e
Calculation Example
Calculation Example B5A 50 Students with IEPs aged 6 through 21 regardless of grade level and age 5 not PK served inside the regular class 80% or more of the day 75 Total students with IEPs aged 6 through 21 regardless of grade level and age 5 not PK
(50 ÷ 75) x 100 = 66.67%
Calculation Example B5B 15 students with IEPs aged 6 through 21 regardless of grade level and age 5 not PK served inside the regular class
less than 40% of the day 75 Total students with IEPs aged 6 through 21 regardless of grade level and age 5 not PK (15 ÷ 75) x 100 = 20.00 %
Calculation Example B5C
10 # of students with IEPs aged 6 through 21 regardless of grade level and age 5 not PK served in separate schools, residential facilities, or homebound/hospital placements 75 Total students with IEPs aged 6 through 21 regardless of grade level and age 5 not PK (10 ÷ 75) x 100 = 13.33%
IMPROVING YOUR RESULTS Review your district’s policies, practices, and procedures regarding least restrictive environment. Are
students being placed in the least restrictive educational settings?
What training does staff need to place students in the least restrictive environment?
Does the district have a continuum of placement options, kindergarten through age 21, for IEP teams to consider?
FREQUENTLY ASKED QUESTIONS • Are my district’s data accurate? Your district’s CEDARS data should be reviewed throughout the
school year. Within EDS navigate to the Special Education November Federal Child Count Application and make sure you are verifying that the correct students are populating the application before certifying your child count. Additionally, check your CEDARS errors as many errors will keep students from populating the child count application.
RESOURCES • Inclusionary Practices Professional Development Project
• November Federal Special Education Child Count Guide
• Preschool LRE Decision Tree
• LRE Calculator
Indicator Technical Assistance Guide 14 | P a g e
Indicator B6: Early Childhood Least Restrictive Environment
Measurement: Percent of children age 5 in grade level Preschool, and ages 3 and 4 regardless of grade level, who are attending a:
A. Regular early childhood program and receiving the majority of special education and related services in the regular early childhood program;
B. Separate special education class, separate school or residential facility;
C. Receiving special education and related services in the home.
Indicator Goal: The goal of Indicator B6 is to ensure preschool children with IEPs are provided disability services in the Least Restrictive Environment (LRE). This can be attained by increasing the number of children attending a regular Early Childhood program and decreasing the number of children attending a separate special education class, separate school, residential facility, or receiving services in another location.
Indicator Connections: Children with disabilities who have access to inclusive early childhood programs will improve childhood outcomes (see Indicator B7), participation in timely transition practices (see Indicator B12), and the fostering of parent involvement (see Indicator B8).
ENTERING/ACCESSING YOUR DATA Indicator Access Points Submission Timelines
n
hen opul
The source data for this indicator are primarily from CEDARS District Student File B, Stude t’s Attributes and Programs File I and Student Special Education Programs File K. Those data are t p ated into Special Education November Federal Child Count Application for district staff to review and certify.
Students included in this indicator are those who are eligible on November 1 (or the first business day of November). Data are extracted from the Special Education November Federal Child Count Application, due in mid-December.
ANALYZING YOUR DATA Calculation Guide
B6A: # of children age 5 and grade level PK and ages 3 and 4 regardless of grade level with IEPs attending a regular early childhood program and receiving the majority of special education and related services in the regular early childhood program / Total # of children age 5 and grade level PK and ages 3 and 4 regardless of grade level with IEPs
B6B: # of children age 5 and grade level PK and ages 3 and 4 regardless of grade level with IEPs attending a separate special education class, separate school or residential facility / Total # of children age 5 and grade level PK and ages 3 and 4 regardless of grade level with IEPs

Indicator Technical Assistance Guide 15 | P a g e
Calculation Guide B6C: # of children age 5 and grade level PK and ages 3 and 4 regardless of grade level with IEPs receiving special education and related services in the home / Total # of children age 5 and grade level PK and ages 3 and 4 regardless of grade level with IEPs
Calculation Example
Calculation Example B6A15 Children age 5 and grade level PK and ages 3 and 4 with IEPs attending a regular early childhood program and receiving the majority of special education and related services in the regular early childhood program 50 Total students with IEPs age 5 and grade level PK and ages 3 and 4 regardless of grade level(15 ÷ 50) x 100 = 30.0%
Calculation Example B6B
12 Children age 5 and grade level PK and ages 3 and 4 with IEPs attending a separate special education class, separate school or residential facility 50 Children age 5 and grade level PK and ages 3 and 4 with IEPs (12 ÷ 50) x 100 = 24.0 %
Calculation Example B6C
8 children with IEPs age 5 and grade level PK and ages 3 and 4 with IEPs receiving special education and related services in the home 50 Children age 5 and grade level PK and ages 3 and 4 with IEPs (8 ÷ 50) x 100 = 16.0%
IMPROVING YOUR RESULTS Review your district’s policies, practices, and procedures regarding least restrictive environment. Are
students being placed in the correct educational settings?
What training does staff need to place students in the least restrictive environment?
Does the district have a continuum of placement options for preschool students ages 3-5 for IEP teams to consider?
FREQUENTLY ASKED QUESTIONS • Are my district’s data accurate? Your district’s CEDARS data should be reviewed throughout the
school year. Within EDS navigate to the November Federal Child Count application and make sure you are verifying that the correct students are populating the application before certifying your child count. Additionally, check your CEDARS errors as many errors will keep students from populating the child count application.
RESOURCES • Inclusionary Practices Professional Development Project
• November Federal Special Education Child Count Guide
• Preschool LRE Decision Tree
• LRE Calculator

Indicator Technical Assistance Guide 16 | P a g e
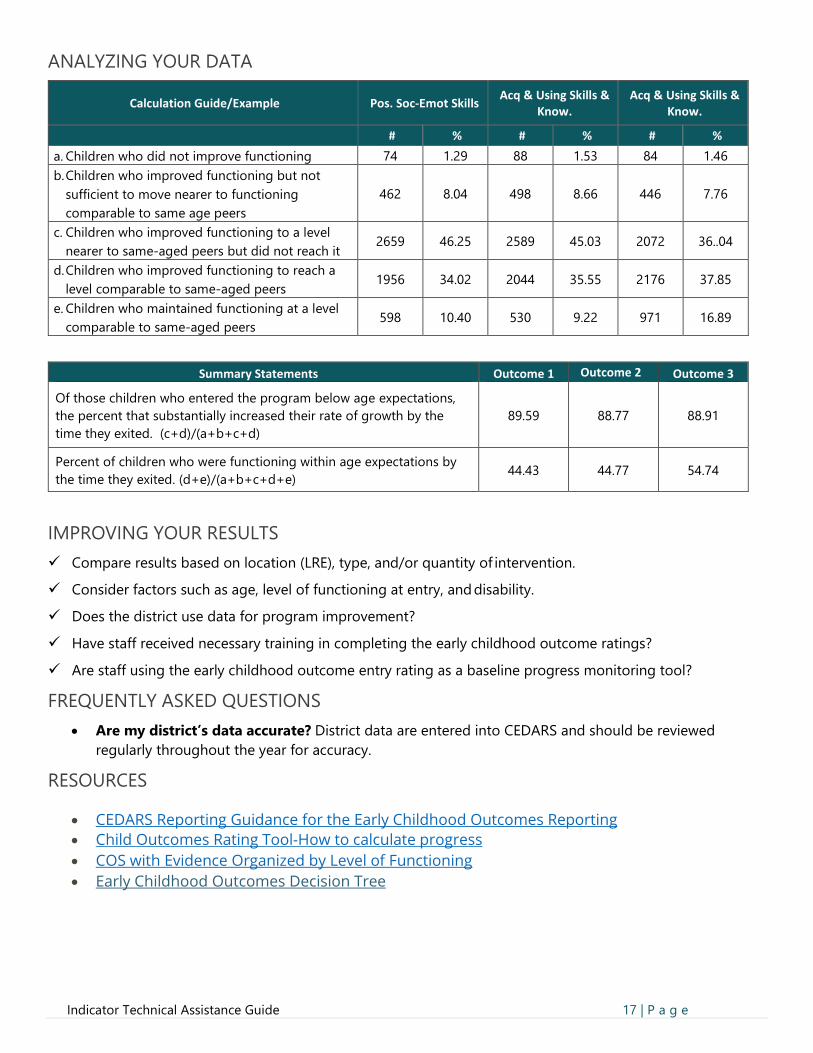
Indicator B7: Early Childhood Outcomes Measurement: Percent of preschool children aged 3 through 5 with IEPs who demonstrate improved:
A. Positive social-emotional skills (including social relationships);
B. Acquisition & use of knowledge & skills (including early language/communication & early literacy); and
C. Use of appropriate behaviors to meet their needs Summary Statement 1: Of those preschool children who entered the preschool program below age expectations in each Outcome, the percent who substantially increased their rate of growth by the time they turned 6 years of age or exited the program.
Summary Statement 2: The percent of preschool children who were functioning within age expectations in each Outcome by the time they turned 6 years of age or exited the program.
Indicator Goal: The goal of Indicator B7 is to track the functioning of children at entry and exit in the three outcome areas listed above (A through C) in order to determine quality of services to children and families and ultimately identify areas of program improvement.
Indicator Connections: By improving functioning in the three outcomes, participation in inclusive high-quality early childhood programs (see Indicator B6) could be improved. Additionally, a child with improved functioning would have demonstrated impacts for reducing suspensions and expulsions (see Indicator B4) and increasing collaboration between the family and school (see Indicator B8).
ENTERING/ACCESSING YOUR DATA
Indicator Access Points Submission Timelines The IEP Team will assess students with IEPs in PK programs at entry into the program in the three areas outlined above and then again when the student exits the PK program for students with IEPs. The source data for these indicators are primarily from CEDARS District Student File B, Student Attributes and Programs File I and Student Special Education Programs File K. Those data are then populated into a Tableau Dashboard for district to review for accuracy and completeness.
Data are submitted over the course of the school year. At the end of the school year the data are populated into a Tableau Dashboard for districts to review for accuracy. After the review period the data are extracted and used in a variety of reporting requirements, including this indicator.
Indicator Technical Assistance Guide 17 | P a g e
ANALYZING YOUR DATA
Calculation Guide/Example Pos. Soc-Emot Skills Acq & Using Skills & Know.
Acq & Using Skills & Know.
# % # % # % a. Children who did not improve functioning 74 1.29
88 1.53 84 1.46 b. Children who improved functioning but not
sufficient to move nearer to functioning comparable to same age peers
462 8.04 498 8.66 446 7.76
c. Children who improved functioning to a level nearer to same-aged peers but did not reach it
2659 46.25 2589 45.03 2072 36..04
d. Children who improved functioning to reach a level comparable to same-aged peers
1956 34.02 2044 35.55 2176 37.85
e. Children who maintained functioning at a level comparable to same-aged peers
598 10.40 530 9.22 971 16.89
Summary Statements Outcome 1 Outcome 2 Outcome 3
Of those children who entered the program below age expectations, the percent that substantially increased their rate of growth by the time they exited. (c+d)/(a+b+c+d)
89.59 88.77 88.91
Percent of children who were functioning within age expectations by the time they exited. (d+e)/(a+b+c+d+e) 44.43 44.77 54.74
IMPROVING YOUR RESULTS Compare results based on location (LRE), type, and/or quantity of intervention.
Consider factors such as age, level of functioning at entry, and disability.
Does the district use data for program improvement?
Have staff received necessary training in completing the early childhood outcome ratings?
Are staff using the early childhood outcome entry rating as a baseline progress monitoring tool?
FREQUENTLY ASKED QUESTIONS • Are my district’s data accurate? District data are entered into CEDARS and should be reviewed
regularly throughout the year for accuracy.
RESOURCES
• CEDARS Reporting Guidance for the Early Childhood Outcomes Reporting• Child Outcomes Rating Tool-How to calculate progress• COS with Evidence Organized by Level of Functioning• Early Childhood Outcomes Decision Tree

Indicator Technical Assistance Guide 18 | P a g e
Indicator B8: Parent Involvement Measurement: Percent of parents with a child receiving special education services who report that schools facilitated parent involvement as a means of improving services and results for children with disabilities.
Indicator Goal: The goal of Indicator B8 is to improve services and results of students with IEPs by facilitating parent involvement.
Indicator Connections: When parents are engaged and informed in the decisions about the services being provided, students with IEPs are more likely to remain in school (see Indicator B2), reduce suspension and expulsions (see Indicator B4), and ultimately graduate (see Indicator B1).
ENTERING/ACCESSING YOUR DATA Indicator Access Points Submission Timelines
Information is currently** collected through a 26-question paper or online survey completed by parents of students with IEPs in districts who are participating in a Systems Analysis monitoring review. The paper surveys are available in 12 languages.
**OSPI is engaging in activities to explore the development of a new parent survey tool and process.
Surveys are distributed directly to parents, collected, and scored by the Social and Economic Sciences Research Center at Washington State University.
ANALYZING YOUR DATA Calculation Guide
(A ÷ B) x 100 = % of parents responding with a standard score of 600 or more
A = # of respondent parents of students with IEPs reporting that districts facilitated parent involvement as a means of improving services and result for their child with an IEP (parents responding with a standard score of 600 or more)
B = Total number of respondent parents of students with IEPs
Calculation Example
25 parents responded that the district facilitated parent involvement (i.e., responded with a score of 600 or more) 40 parents of students with IEPs responded (25÷ 40) x 100= 62.5% of parents responded positively
Indicator Technical Assistance Guide 19 | P a g e
IMPROVING YOUR RESULTS Review the results for each item on the survey report provided by OSPI to determine specific concerns.
Strive to increase response rate to provide a clearer picture of parental satisfaction.
FREQUENTLY ASKED QUESTIONS • Are my district’s data accurate? Your district’s data are taken from the completed parent surveys.
RESOURCES • National Center for Parent Information and Resources
• Improving Relationships and Results: Building Family/School Partnerships

Indicator Technical Assistance Guide 20 | P a g e
Indicator B9/B10: Disproportionate representation Measurement: B9: Percent of districts with disproportionate representation of racial and ethnic groups in special education and related services that is the result of inappropriate identification.
B10: Percent of districts with disproportionate representation of racial and ethnic groups in specific disability categories that is the result of inappropriate identification.
Indicator Goal: The goal of Indicators B9 and B10 is to reduce the over-representation of specific race/ethnic groups in a district’s special education program that is the result of inappropriate identification of students. Indicator B9 focuses on the disproportionate representation of racial and ethnic groups in special education overall. Indicator B10 focuses on the disproportionate representation of racial and ethnic groups across six specific disability categories.
Indicator Connections: When a district embraces the cultural diversity found within its borders (see Indicators B9 & B10), the district may be more likely to include parents in identifying students in need of evaluation, completing the evaluation in a timely manner (see Indicator B11: Child Find), and incorporating parent involvement in creating and carrying out the IEP (see Indicator B8: Parent Involvement).
ENTERING/ACCESSING YOUR DATA
Indicator Access Points Indicator Access Points Submission Timelines
The source data for these indicators are primarily from CEDARS District Student File B, Student’s Attributes and Programs File I and Student Special Education Programs File K. Those data are then populated into Special Education November Federal Child Count Application for district staff to review and certify.
Comparison data are also from CEDARS based on student’s enrolled on the first business day in October.
Students included in this indicator are those who are eligible on November 1 (or the first business day of November). Data are extracted from the Special Education November Federal Child Count Application, due in Mid-December.
Comparison data are extracted from the OSPI Data Portal.
ANALYZING YOUR DATA Calculation Guide
Step 1: Calculate the risk for the students with IEPs in a specific race/ethnic group: Total number of students with IEPs in race/ethnic group divided by total enrolled in race/ethnic group
Step 2: Calculate the risk for students with IEPs in all other race/ethnic groups: Total number of students with IEPs in all other race/ethnic group divided by total enrolled in all other race/ethnic groups

Indicator Technical Assistance Guide 21 | P a g e
Calculation Guide Step 3: Calculate the risk ratio:
Result of Step 1/Result of Step 2
Disproportionality: If district is over a 2.0 risk ratio or higher for 3 consecutive years in the same area with a minimum cell size of 10 or more students in the group of interest, and the overrepresentation was found to be a result of inappropriate identification.
Calculation Example
Race/Ethnicity Child Count Child Count Risk District Enroll Comparison
Risk Risk Ratio
Native American 80 0.40 200 0.29 1.39 Asian 1 0.50 2 0.31 1.62 Black 50 0.71 70 0.28 2.55
Hispanic 0 0 0.31 White 80 0.27 300
0.33 0.82
Total 121 0.24 503 0.37 0.65
If the risk ratio of students who are identified as Black continues to have a risk ratio above 2.0 for three consecutive years, then the district would be identified as having disproportionality was a result of inappropriate identification.
IMPROVING YOUR RESULTS Have you surveyed your staff, students, and community regarding cultural bias that may exist within your
district? Have you noticed a trend of any specific race/ethnic group being more frequently referred for
special education identification? Does this trend differ by school building or grade level?
FREQUENTLY ASKED QUESTIONS • How do I view my district’s data for B9 and B10? Indicator data for all districts in Washington are
found on the Performance District Data Profiles.
RESOURCES • Disproportionality Self-Study Tools
• OSPI’s Evaluation Review Form
Indicator Technical Assistance Guide 22 | P a g e
Indicator B11: Child Find: Timely Eligibility Determinations Measurement: Percent of children who were evaluated within 35 school days of receiving parental consent for initial evaluation.
Indicator Goal: The goal of Indicator B11 is to improve efforts to locate and serve students with IEPs by ensuring that 100% of children with parental consent to evaluate are evaluated, and eligibility determined, within 35 school days.
Indicator Connections: Districts establish processes and procedures pertaining to the timely identification, location, and evaluations for all children having or suspected of having a disability. During the initial evaluation process, students are assessed using appropriate evaluations, procedures, and instruments (see Indicators B9 & B10). Parent and professional collaboration are used to promote active participation (see Indicator B8). Timely evaluations are needed to support efficient and effective transitions for children transitioning from Part C to Part B (see Indicator B12).
ENTERING/ACCESSING YOUR DATA
Indicator Access Points Submission Timelines The source data for this indicator is primarily from CEDARS File U, Initial Evaluation and Eligibility Timelines. Those data are then populated into a Tableau Dashboard for district to review for accuracy and completeness.
Data are submitted over the course of the school year. At the end of the school year, the data are populated into a Tableau Dashboard for districts to review for accuracy. After the review period the data are extracted and used in a variety of reporting requirements, including this indicator.
ANALYZING YOUR DATA Calculation Guide
A. # of children for whom parental consent to evaluate was received. B. # of children whose evaluations were completed within 35 school days. C. # of children accounted for under an allowable exception.
Account for children included in (a), but not included in (b) or (c). Indicate the range of days beyond the timeline when the evaluation was completed and any reasons for the delays.
Percent = [(b+c) divided by (a)] times 100.
Calculation Example
((20,819 + 1,582) ÷ 22,544) x 100 = 99.37
This is a compliance indicator requiring 100% of initial evaluations completed within 35 school days. If not, districts will be determined out of compliance and a corrective action will be issued.
Indicator Technical Assistance Guide 23 | P a g e
IMPROVING YOUR RESULTS Determine district processes and procedures that need to be addressed to assure the timelines are
being met, for example, counting the 35 school days accurately.
Review policies and procedures and provide training for all staff regularly. Create and continuously update a calendar that includes all timeline dates along with other important
IEP-related dates.
FREQUENTLY ASKED QUESTIONS • When counting the 35 school days, does the day the district receives the parent’s consent count
as day zero or day one? The day that the district receives the parent’s consent would be considered day zero when counting the 35 days. Remember, though, that 35 school days is the longest amount of time a district has to complete the evaluation and determine eligibility. Evaluations may be completed sooner than 35 school days.
• What if there are unforeseen circumstances that affect the timely completion of the evaluation? State special education regulations permit the district and parent to agree to extend an evaluation timeline. The agreement must be documented by the district, including the reason(s) for extending the timeline.
RESOURCES OSPI’s Evaluation Review Form
OSPI’s A Guide to Assessment in Early Learning: Infancy to Age Eight

Indicator Technical Assistance Guide 24 | P a g e
Indicator B12: Child Find: Timely Transition from Part C to Part B Measurement: Percent of children referred by Part C prior to age 3, who are found eligible for Part B, and who have an IEP developed and implemented by their third birthday.
Indicator Goal: The goal of Indicator B12 is to guarantee seamless transitions for children and families as they move from Part C to Part B so they can access appropriate service in a timely manner.
Indicator Connections: Through the process of ensuring seamless transitions for children and families as they move from Part C to B, families and districts can collaborate (see Indicator B8), timely evaluations can increase (see Indicator B11), and children can access high quality inclusive environments (see Indicator B6) and thus improve outcomes (see Indicator B7).
ENTERING/ACCESSING YOUR DATA
Indicator Access Points Submission Timelines The source data for this indicator is primarily from CEDARS File U, Initial Evaluation and Eligibility Timelines. Those data are then populated into a Tableau Dashboard for district to review for accuracy and completeness.
Data are submitted over the course of the school year. At the end of the school year the data are populated into a Tableau Dashboard for districts to review for accuracy. After the review period the data are extracted and used in a variety of reporting requirements, including this indicator.
ANALYZING YOUR DATA Calculation Guide
A. # of children who have been served in Part C and referred to Part B for Part B eligibility determination. B. # of those referred determined to be NOT eligible and whose eligibility was determined prior to their third
birthdays. C. # of those found eligible who have an IEP developed and implemented by their third birthdays. D. # of children for whom parent refusal to provide consent caused delays in evaluation or initial services or to
whom exceptions under 34 CFR§300.301(d) applied. E. # of children determined to be eligible for early intervention services under Part C less than 90 days before
their third birthdays.
Account for children included in (A), but not included in (B), (C), (D), (E). Indicate the range of days beyond the third birthday when eligibility was determined and, if eligible when the IEP was developed, and any reasons for the delays.
Percent = [(C) divided by (A-(B+D+E))] times 100.
Calculation Example
2,887 ÷ (3,931- (685+274+24) = 97.9
This is a compliance indicator requiring 100% of children transitioning from Part C to Part B have their

Indicator Technical Assistance Guide 25 | P a g e
eligibility determination completed (if found not eligible) or an IEP developed (if found eligible) by the child’s third birthday. If not, districts will be determined out of compliance and a corrective action will be issued.
IMPROVING YOUR RESULTS Are district procedures in place and followed for evaluating students turning age 3, including
during the summer? How is the district receiving notice from Part C at least 90 days prior to the student turning 3? How is the district actively engaged in the transition planning conference for children deemed
potentially eligible for Part B of IDEA? How is the district supporting the transition planning process for those that are not deemed potentially eligible for Part B?
How is the district communicating with families of children throughout the transition process? Create and continuously update a calendar that includes all timeline dates along with other important
IEP-related dates.
FREQUENTLY ASKED QUESTIONS • Are my district’s data accurate? District data are entered into CEDARS and should be reviewed
regularly throughout the year for accuracy.
RESOURCES • OSPI’s Evaluation Review Form
• OSPI’s A Guide to Assessment in Early Learning: Infancy to Age Eight
• ESIT’s LateServices-ProvisionDocumentation.pdf (wa.gov)
• Early Childhood Transition from Part C to Part B Timeline Requirements (www.k12.wa.us)

Indicator Technical Assistance Guide 26 | P a g e
Indicator B13: Secondary Transition IEP Components Measurement: Percent of youth (aged 16 and above) with an IEP that includes all of the required secondary transition components including:
• Age-appropriate transition assessment;
• Measurable post-secondary goals for education/training, employment, and if appropriate, independent living skills;
• Transition services, including course(s) of study, to help the student reach their post-secondary goals;
• Evidence that the student was invited to participate in the transition IEP meeting;
• Evidence that representatives of an outside agency were invited to participate in the IEP meeting (with parent/adult student consent) if the agency would be providing/paying for an IEP transition service.
Indicator Goal: The goal of Indicator B13 is to monitor the percent of youth (16 and above) with an IEP that includes an appropriate transition plan. Indicator B13 is composed of a variety of factors that districts should focus on to improve a student’s experience as they transition to post-secondary success. A good transition should be focused around the individual student and include independent living (when appropriate), education/training, and employment.
Indicator Connections: When a strong transition plan is in place, it is a foundation that can help students reach the goal of college, career, and life readiness (see Indicator B14). Graduation (see Indicator B1) is also more likely to occur when post-secondary goals are established within a transition plan, and dropout rates (see Indicator B2) will diminish.
ENTERING/ACCESSING YOUR DATA
Indicator Access Points Submission Timelines These data are currently** collected from the State’s monitoring activities, which include on-site visits, off-site desk reviews, and files submitted for Safety Net reimbursement. During the monitoring review, a comprehensive student file review is conducted which includes IEPs of students turning 16 and above to determine whether the required elements are appropriately documented in the IEP: **In the 2022-23 school year, a new statewide data collection for Indicator B13 will be implemented within CEDARS.
Student IEPs are submitted to OSPI by districts prior to a Systems Analysis desk review or on-site visit, and annually each spring for Safety Net reimbursement.

Indicator Technical Assistance Guide 27 | P a g e
ANALYZING YOUR DATA
Calculation Guide # Transition IEPs Compliant ÷ # Total Transition Files Reviewed * 100 = % Compliant
Calculation Example
(1,159 ÷ 1,195) * 100 = 96.99%
This is a compliance indicator requiring 100% of secondary transition IEPs have all of the required components. If not, the district will be determined out of compliance and a corrective action will be issued.
IMPROVING YOUR RESULTS Are a variety of age-appropriate transition assessment tools available for teams to use when
developing High School and Beyond Plans (HSBPs) and IEP transition plans?
Are transition IEPs aligned with HSBPs? What is the process for inviting outside agencies to the IEP meeting when they will be providing an
IEP service?
FREQUENTLY ASKED QUESTIONS • What are effective methods for age-appropriate transition assessment that can assist teams in
determining the student’s strengths, needs, preferences, and interests? The Center for Change in Transition (CCTS) website includes several modules related to identifying appropriate age-appropriate transition assessments.
• Is there a checklist that teams can use to make sure the IEP contains all of the required transition components? OSPI’s IEP Review Form is a checklist that includes the transition requirements.
• What are best practices for aligning HSBPs and IEP transition plans? See OSPI’s Guidelines for Aligning High School and Beyond Plans and IEP Transition Plans for more information on aligning these plans to minimize duplication and to facilitate a student’s seamless transition from school to postsecondary activities.
RESOURCES • Guidelines for Aligning High School and Beyond Plans and IEP Transition Plans
• Center for Change in Transition Services (CCTS, a State Needs Project)

Indicator Technical Assistance Guide 28 | P a g e
Indicator B14: Post-School Outcomes Measurement: Percent of youth who are no longer in high school, had an IEP in effect at the time they left school, and, within one year of leaving high school, were:
A. Enrolled in higher education, or
B. Enrolled in higher education or competitively employed, or
C. Enrolled in higher education, other postsecondary education or training program, competitively employed, or in other employment.
Indicator Connections: The goal of Indicator B14 is to evaluate the post-secondary outcomes of youth one year after leaving high school. The youth evaluated in this indicator are those who are no longer are in high school and had an active IEP in effect at the time they left school.
Indicator Connections: Because Indicator B14 is the culminating measure of the success of a district’s goal of preparing students with IEPs to be ready for college, career, and life, all of the other indicators contribute to the success of Indicator B14.
ENTERING/ACCESSING YOUR DATA
Indicator Access Points Submission Timelines
The pre-populated list of students for these indicators come from CEDARS Element C09 – School Withdrawal Code. District staff verify this data and modify as appropriate. After that, district staff conduct phone surveys with the former student or their family to gather the data for this indicator. Survey results are entered into the Center for Change in Transition Services (CCTS’s) Indicator B14 data collection platform.
June 1 through November 1, annually
ANALYZING YOUR DATA Calculation Guide
er ed. 14A. (A ÷ B) x 100 = % enrolled in high14B. [(A + C) ÷ B] x 100 = % in enrolled higher ed. and competitively employed 14C. [(A + C + D + E) ÷ B] x 100 = % in enrolled higher ed., some other post-secondary education or training
program., competitively employed, or other employment A= # of exiter respondents enrolled in higher education B= total # of exiter respondents C= # of exiter respondents competitively employed D= # of exiter respondents enrolled in some other postsecondary education or training program E= # of exiter respondents in some other employment Respondents are surveyed one year after exiting high school.
Indicator Technical Assistance Guide 29 | P a g e
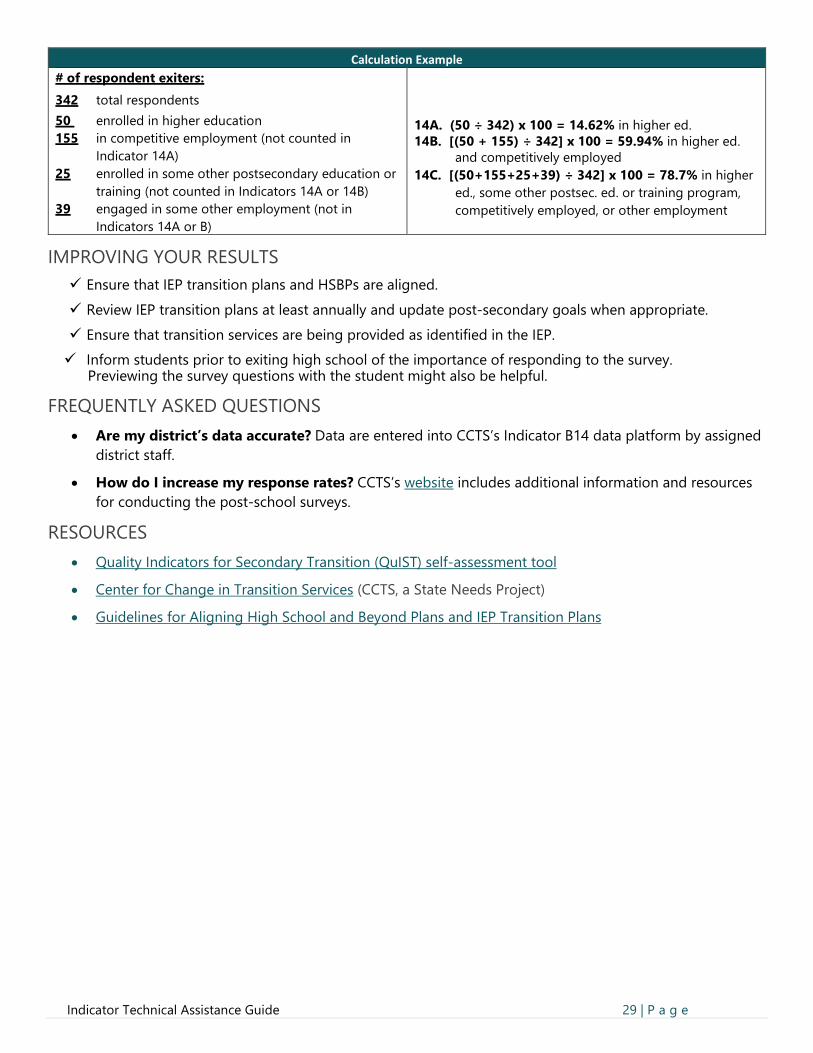
Calculation Example # of respondent exiters: 342 total respondents 50 enrolled in higher education 155 in competitive employment (not counted in
Indicator 14A) 25 enrolled in some other postsecondary education or
training (not counted in Indicators 14A or 14B) 39 engaged in some other employment (not in
Indicators 14A or B)
14A. (50 ÷ 342) x 100 = 14.62% in higher ed. 14B. [(50 + 155) ÷ 342] x 100 = 59.94% in higher ed.
and competitively employed 14C. [(50+155+25+39) ÷ 342] x 100 = 78.7% in higher
ed., some other postsec. ed. or training program, competitively employed, or other employment
IMPROVING YOUR RESULTS Ensure that IEP transition plans and HSBPs are aligned. Review IEP transition plans at least annually and update post-secondary goals when appropriate. Ensure that transition services are being provided as identified in the IEP. Inform students prior to exiting high school of the importance of responding to the survey.
Previewing the survey questions with the student might also be helpful.
FREQUENTLY ASKED QUESTIONS • Are my district’s data accurate? Data are entered into CCTS’s Indicator B14 data platform by assigned
district staff.
• How do I increase my response rates? CCTS’s website includes additional information and resources for conducting the post-school surveys.
RESOURCES • Quality Indicators for Secondary Transition (QuIST) self-assessment tool
• Center for Change in Transition Services (CCTS, a State Needs Project)
• Guidelines for Aligning High School and Beyond Plans and IEP Transition Plans

Indicator Technical Assistance Guide 30 | P a g e
Indicator B15: Resolution Sessions Measurement: Percent of hearing requests that went to resolution sessions that were resolved through resolution session settlement agreements.
Indicator Goal: The goal of Indicator B15 is to try to increase the number of hearing requests that are resolved through a resolution session. Due process hearing timelines will start after the resolution session process occurs, or if parties agree to waive the resolution process.
ENTERING/ACCESSING YOUR DATA
Indicator Access Points Submission Timelines
The source data for this indicator are primarily from OSPI Special Education Division’s tracking database.
Data are from hearing requests received from July 1 through June 30, annually.
ANALYZING YOUR DATA Calculation Guide
# Written Settlement agreements reached through resolution meetings ÷ # Resolution meetings
Calculation Example (19 ÷70) x 100 = 27.14%
IMPROVING YOUR RESULTS Are district procedures in place to schedule a resolution session once a due process hearing is filed?
Does the district have a practice of participating in resolution sessions instead of waiving them?
FREQUENTLY ASKED QUESTIONS • Are my district’s data accurate? If you have questions, check with the dispute resolution team.
RESOURCES • OSPI’s Dispute Resolution Due Process Hearing Webpage

Indicator Technical Assistance Guide 31 | P a g e
Indicator B16: Mediations Measurement: Percent of mediations held that resulted in mediation agreements.
Indicator Goal: The goal of Indicator B16 is to increase the percent of mediations that result in mediation agreements.
ENTERING/ACCESSING YOUR DATA
Indicator Access Points Submission Timelines The source data for this indicator are primarily from Sound Options, LLC tracking database.
Data are from mediation requests received from July 1 through June 30, annually.
ANALYZING YOUR DATA Calculation Guide
# Mediation agreements related to Due Process Hearings + # Mediation agreements not related to Due Process Hearings ÷ # Mediations held
Calculation Example
((6 + 29) ÷ 43) x 100 = 81.4%
IMPROVING YOUR RESULTS Does the district have a practice of participating in mediation when requested by a parent?
Would district staff regularly participating in mediations benefit from conflict engagement training?
FREQUENTLY ASKED QUESTIONS • Are my district’s data accurate? If you have questions, check with Sound Options Group.
RESOURCES • OSPI’s Mediation Webpage
• Sound Options Group Webpage
Indicator Technical Assistance Guide 32 | P a g e
Indicator B17: State Systemic Improvement Plan (SSIP) Measurement: The State Identified Measurable Result (SiMR) will be based upon the Social-Emotional performance gap between entering kindergarteners with disabilities and their typically developing peers found eligible for special education services based upon the WaKIDS fall assessment data.
Indicator Goal: The SSIP is a comprehensive, ambitious, achievable, multi-year (Phase I-III) report on the analysis, implementation, and evaluation processes, for improving results for children with disabilities.
Indicator Connections: This indicator touches all indicators of the State Performance Plan (SPP) since its purpose is to determine if preschool students with IEPs will be at the same level as their non-disabled peers once they are in kindergarten.
ENTERING/ACCESSING YOUR DATA
Indicator Access Points Submission Timelines The primary source data for this indicator is the Washington Kindergarten Inventory of Developing Skills (WaKids). Secondary data sources include the Parent Survey, Teaching Pyramid Observation Tool (TPOT), the Behavior Incident Report (BIR), Teaching Strategies GOLD (TSG) spring exit PreK data, B6 LRE data, B7 COS data.
Data for this indicator is from the WaKIDS fall entrance assessment.
ANALYZING YOUR DATA
Additional data metrics will be collected throughout the calendar year.
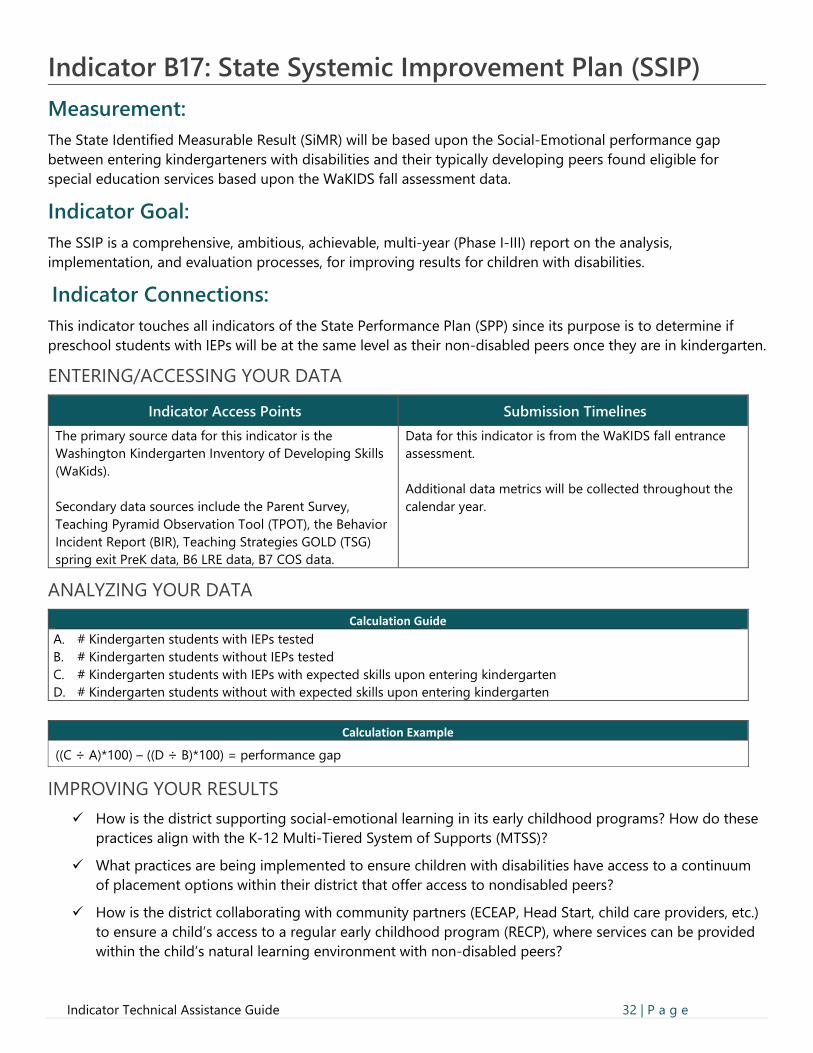
Calculation Guide A. # Kindergarten students with IEPs tested B. # Kindergarten students without IEPs tested C. # Kindergarten students with IEPs with expected skills upon entering kindergarten D. # Kindergarten students without with expected skills upon entering kindergarten
Calculation Example
((C ÷ A)*100) – ((D ÷ B)*100) = performance gap
IMPROVING YOUR RESULTS How is the district supporting social-emotional learning in its early childhood programs? How do these
practices align with the K-12 Multi-Tiered System of Supports (MTSS)?
What practices are being implemented to ensure children with disabilities have access to a continuum of placement options within their district that offer access to nondisabled peers?
How is the district collaborating with community partners (ECEAP, Head Start, child care providers, etc.) to ensure a child’s access to a regular early childhood program (RECP), where services can be provided within the child’s natural learning environment with non-disabled peers?

Indicator Technical Assistance Guide 33 | P a g e
FREQUENTLY ASKED QUESTIONS • How is the SiMR determined? The SSIP State Design Team, made up of a variety of early childhood
partners, reviews annual state and federal data to determine areas of strength and need. Based upon their findings, a proposal is presented to the Special Education Advisory Council (SEAC) for approval, then shared with the U.S. Department of Education, Office of Special Education Programs.
RESOURCES • State Systemic Improvement Plan - Phase III WA State Evaluation Report Year 5 (www.k12.wa.us)
• One-Pager One Column (www.k12.wa.us)
• ECTA Center: State Systemic Improvement Plan (SSIP)

LEGAL NOTICE
Alternate material licenses with different levels of user permission are clearly indicated next to the specific content in the materials.
This resource may contain links to websites operated by third parties. These links are provided for your convenience only and do not constitute or imply any endorsement or monitoring by OSPI.
If this work is adapted, note the substantive changes and re-title, removing any Washington Office of Superintendent of Public Instruction logos. Provide the following attribution:
“This resource was adapted from original materials provided by the Office of Superintendent of Public Instruction. Original materials may be accessed at Special Education Data Collection | OSPI (www.k12.wa.us).
Please make sure that permission has been received to use all elements of this publication (images, charts, text, etc.) that are not created by OSPI staff, grantees, or contractors. This permission should be displayed as an attribution statement in the manner specified by the copyright holder. It should be made clear that the element is one of the “except where otherwise noted” exceptions to the OSPI open license.
For additional information, please visit the OSPI Interactive Copyright and Licensing Guide.
OSPI provides equal access to all programs and services without discrimination based on sex, race, creed, religion, color, national origin, age, honorably discharged veteran or military status, sexual orientation including gender expression or identity, the presence of any sensory, mental, or physical disability, or the use of a trained dog guide or service animal by a person with a disability. Questions and complaints of alleged discrimination should be directed to the Equity and Civil Rights Director at 360-725-6162 or P.O. Box 47200 Olympia, WA 98504-7200.
. Except where otherwise noted, this work by the Office of Superintendent of Public Instruction is licensed under a Creative Commons Attribution License

Chris Reykdal | State Superintendent Office of Superintendent of Public Instruction Old Capitol Building | P.O. Box 47200 Olympia, WA 98504-7200
All students prepared for post-secondary pathways, careers, and civic engagement.


