by Susan M. Skillman, MS C. Holly A. Andrilla, MS Linda Tieman, RN, MN, FACHE Andrea U. McCook, MBA This project was funded by the Washington Center for Nursing through Department of Health Grant #N14191. The authors would like to thank Martha Reeves for her work on the design and production of this report, and Anne Basye for her editorial input. UNIVERSITY OF WASHINGTON SCHOOL OF MEDICINE DEPARTMENT OF FAMILY MEDICINE Final Report #134 Washington State Registered Nurse Supply and Demand Projections: 2011-2031 December 2011
Transcript
by
Susan M. Skillman, MSC. Holly A. Andrilla, MS
Linda Tieman, RN, MN, FACHEAndrea U. McCook, MBA
This project was funded by the Washington Center for Nursing through Department of Health Grant #N14191.
The authors would like to thank Martha Reeves for her work on the design and production of this report, and Anne Basye for her editorial input.
UNIVERSITY OF WASHINGTON
SCHOOL OF MEDICINE
DEPARTMENT OF FAMILY MEDICINE
Final Report #134
Washington State Registered Nurse
Supply and Demand Projections: 2011-2031
December 2011
2
ABOUT THE WORKFORCE CENTERThe WWAMI Center for Health Workforce Studies is located at the University of Washington Department of Family Medicine. The major goals of the Center are to conduct high-quality health workforce research; provide methodological expertise to local, state, regional, and national policy makers; build an accessible knowledge base on workforce methodology, issues, and findings; and provide wide dissemination of project results in easily understood and practical form to facilitate appropriate state and federal workforce policies.
The Center brings together researchers from medicine, nursing, dentistry, public health, the allied health professions, pharmacy, and social work to perform applied research on the distribution, supply, and requirements of health care providers, with emphasis on state workforce issues in underserved rural and urban areas of the WWAMI region. Workforce issues related to provider and patient diversity, provider clinical care and competence, and the cost and effectiveness of practice are emphasized.
The WWAMI Center for Health Workforce Studies and Rural Health Research Center Final Report Series is a means of distributing prepublication articles and other working papers to colleagues in the field. Your comments on these papers are welcome and should be addressed directly to the authors. Questions about the WWAMI Center for Health Workforce Studies should be addressed to:
Mark P. Doescher, MD, MSPH, DirectorSusan Skillman, MS, Deputy DirectorUniversity of WashingtonDepartment of Family MedicineBox 354982Seattle, WA 98195-4982Phone: (206) 685-6679Fax: (206) 616-4768E-mail: [email protected] site: http://depts.washington.edu/uwchws/
ABOUT THE AUTHORSSUSAN M. SKILLMAN, MS, is the Deputy Director of the WWAMI Center for Health Workforce Studies and the WWAMI Rural Health Research Center, Department of Family Medicine, University of Washington School of Medicine.
C. HOLLY A. ANDRILLA, MS, is a Biostatistician at the WWAMI Center for Health Workforce Studies and the WWAMI Rural Health Research Center, Department of Family Medicine, University of Washington School of Medicine.
LINDA TIEMAN, RN, MN, FACHE, is the Executive Director of the Washington Center for Nursing.
ANDREA U. MCCOOK, MBA, is a Project Director at the Washington Center for Nursing.
CONTENTSExecutive Summary .............................................. 3Introduction ........................................................... 5The Supply of RNs in Washington ........................ 6The Demand for RNs in Washington ...................11Projections of RN Supply and Demand: 2011 to 2031 ....................................................... 12Limitations .......................................................... 14
Conclusion and Discussion ................................ 14References ......................................................... 15Appendix A. Estimates of the Rates of Death and Out-Migration Among RNs with Washington Licenses ......................................... 17Appendix B. Estimates of RN Supply and Demand in Washington From 2011 to 2031 Under Four Scenarios ............................... 18
3
Washington State Registered Nurse Supply and Demand Projections: 2011-2031
SUSAN M. SKILLMAN, MSC. HOLLY A. ANDRILLA, MS
LINDA TIEMAN, RN, MN, FACHEANDREA U. MCCOOK, MBA
EXECUTIVE SUMMARYBACKGROUNDIt will be a challenge to maintain a registered nurse (RN) workforce in Washington State that will meet the needs of the state’s population in the coming decades. Multiple factors are converging that will increase pressure on the state to produce, recruit, and retain RNs:
• The current RN workforce is aging and many will soon be retiring.
• Washington’s population is growing, with the most rapid growth among the elderly.
• The federal Patient Protection and Affordable Care Act (PPACA) will provide more previously uninsured Washington residents access to health insurance.
• Chronic disease rates are increasing.
• The economic downturn threatens education programs in the state.
To help plan for these trends, this study examines Washington State’s RN workforce in 2011 and provides estimates of RN supply and demand change to 2031 based on four scenarios of RN education capacity. The report’s purpose is to provide a planning tool to help guide decision-making about the education and employment of the RN workforce.
DATA SOURCESData for RN supply projections come from the 2011 Washington State database of licensed RNs, the Washington State Nursing Care Quality
Assurance Commission, the National Council Licensure Examination for Registered Nurses (NCLEX), HRSA’s National Sample Survey of Registered Nurses, National Vital Statistics, and Washington State’s 2007 survey of licensed RNs in Washington. RN demand data come from the Washington State Employment Security Department, Labor Market and Economic Analysis Branch.
METHODSThis study’s workforce projection model estimates annual entrants and exits to licensed RN supply across two decades and subtracts the fraction estimated to not be employed in nursing to obtain an estimate of the number of practicing RNs for each year. These numbers are compared with annual estimates of RN demand in the state and to the number of licensed RNs per 100,000 state population in 2011.
FINDINGSProjected demand for practicing RNs begins at 55,070 in 2011 and reaches 89,186 in 2031. The four scenarios used to project RN supply each start in 2011 with 55,044 practicing RNs and alter the RN education capacity from nursing schools in the state:
• Baseline Scenario 1, which maintains RN graduates from in-state schools who work in Washington at the 2011 level, projects there will be 70,736 practicing RNs in 2031.
• Scenario 2, which incorporates a 10% decrease in graduations, yields 68,059 practicing RNs in 2031.
4
• Scenario 3, which incorporates a 10% increase in graduations, yields 73,414 practicing RNs in 2031.
• Scenario 4, which increases graduation numbers by 10% in 2016 and by 20% in 2021, yields 77,075 practicing RNs in 2031.
All four RN supply scenarios meet or exceed the number of licensed RNs needed to maintain the 2011 per capita benchmark over the next two decades, indicating RN supply will keep pace with population growth. But RN demand is projected to increase faster than population growth, due to the added health care needs of more elderly, chronically ill, and insured individuals. All of the scenarios presented in this report, even those that increase education output, project practicing RN supply to fall short of demand by 2017 or earlier. By 2031, supply is projected to be short of demand by as many as 21,000 practicing RNs.
CONCLUSIONS AND DISCUSSIONThe four scenarios explored in this report provide somewhat different, but realistic, views of possible changes in the size of Washington’s RN supply over time. The near-term and longer-term messages that surface are:
• Short-term (five-year) RN supply appears to align with demand in Washington.
• RN demand will outpace supply in Washington over the next decade.
• RN supply appears likely to fall far short of demand in Washington in 20 years, unless
demand adapts to the available workforce supply.
• Future RN demand will be driven by more than population growth. The demands of a more elderly and chronically ill state population, as well as wider access to health care through the PPACA, contribute to the steep rise in projected demand for RNs to 2031.
As with any forecast, reliability is greater in the short term and uncertainty increases over time. But it appears clear that RN shortages will soon appear and strategies are needed—such as increasing education capacity and identifying new models of care that emphasize prevention and optimize use of resources—that will bring RN supply into better alignment with the increasing need for health care among the state’s population.
Better data resources are needed to track workforce trends in Washington, including identifying how many health professionals are practicing, where, and in what specialties. Such data would increase the accuracy of future projections. Many states collect these data when professionals are licensed and at renewal.
Strategies to avert future RN shortages will be supported by an innovative nursing education environment in Washington that has demonstrated commitment to producing nurses with the knowledge and skills to teach, monitor, and manage care across health care settings and who can update that knowledge over the course of their careers.
5
Washington State Registered Nurse Supply and Demand Projections: 2011-2031
SUSAN M. SKILLMAN, MSC. HOLLY A. ANDRILLA, MS
LINDA TIEMAN, RN, MN, FACHEANDREA U. MCCOOK, MBA
of the state.”5 Chronic disease affects people of all ages, but susceptibility to heart disease, cancer, stroke, and diabetes increases with age. Increasing demand for chronic disease-related health care as Washington’s population grows and ages will likely increase demand for a larger RN workforce prepared to deliver the needed health care.
The economic downturn threatens education programs in the state. Washington State’s budget shortfalls have led to cuts in higher education budgets that curtail growth and in some cases reduce education capacity. In addition, increases in student tuition cause nursing education to be out of the reach of some students. The average cost to attend college in the state’s four-year schools has risen 94% and 54% at community and technical colleges since 2007.6
In order to plan for these changes and better understand the factors that affect changes in the size and composition of the RN workforce, this study examines Washington State’s RN workforce in 2011 and estimates how that supply is likely to change over the coming two decades, to 2031. It updates Washington State RN supply and demand projections conducted in 2007.7 The updated projections make use of recent data about the state’s RN workforce and present scenarios that take into account the economic constraints affecting RN supply and demand.
Specifically, this study:
• Describes the sources of data that can be used to estimate RN supply size and changes over time,
• Identifies the policy and environmental factors that influence RN supply and demand in Washington State, and
• Projects changes in RN supply, demand, and relevant benchmarks for RNs in the state over two decades.
The report’s purpose is to provide a planning tool to help guide decision-making about the education and employment of the RN workforce. It offers a range of
INTRODUCTIONIt will be a challenge to maintain a registered nurse (RN) workforce in Washington State that will meet the needs of the state’s population in the coming decades. Multiple factors are converging that will increase pressure on the state to produce, recruit, and retain RNs:
The current RN workforce is aging and many will soon be retiring. The average age of Washington’s RNs in 2011 was 48.9 years,1 and 39.3% (26,480) were age 55 or older. Even if these nurses delay their retirement for a few years because of financial pressures caused by the current economic downturn, they nonetheless will retire sometime over the next two decades. Replacing this large number of retiring RNs will require considerable effort and attention.
Washington’s population is growing, with the most rapid growth among the elderly. While Washington State’s overall population is expected to grow by 26% or 1.7 million people between 2010 and 2030, nearly half of this increase will take place among people age 65 and older, a group expected to increase in size by 103%.2 With nearly one out of five Washington residents expected to be age 65 or older by 2030, demand for health care services will greatly increase.
The federal Patient Protection and Affordable Care Act (PPACA) will provide more previously uninsured Washington residents access to health insurance.3 Washington’s Insurance Commissioner estimates that under the PPACA, the percentage of Washingtonians without health insurance will drop to 6% from a high of about 13% in 2013. This will come from expansion of Medicaid to cover nearly 355,000 more state residents, and another 460,000 will be eligible for subsidies to help gain access to health insurance.4 Greater demand for health care by more insured Washington residents will increase demand for RNs.
Chronic disease rates are increasing. According to “The Health of Washington State, 2007,” “chronic disease is a major public health problem in most parts
6
results that allow exploration of several “what if...?” options from which policy can be developed. These projections are not meant to be precise predictions of future RN supply and demand, but do provide our best estimates of the impact of a range of policy scenarios (specifically, changes in education output) on the state’s RN workforce. These projections are based on a combination of the best available data about Washington’s RN workforce and reasonable judgment about the future direction of the state’s economy and nursing work environments.
THE SUPPLY OF RNS IN WASHINGTONOur projections take into account nine major factors that increase or decrease each year’s supply of RNs who are available to fill nursing jobs in Washington:
Entrants to the state RN supply:• Graduates from Washington nursing schools.• National Council Licensure Examination for RNs
(NCLEX) pass rates.• Foreign-educated RNs beginning practice in the
United States in Washington.• In-migration from other states, including new
graduates.• Re-activation of licensure after license expiration.
Exits from the state RN supply:• Deaths.• License expirations due to individuals leaving
nursing careers and age-related retirements.• Out-migration to other states.
Practicing RN supply:• Licensed RNs employed in nursing.
Figure 1 shows the relationship of these factors to RN supply. We examined each factor at length and assessed potential data sources to use for the estimates. Following are descriptions of each component of Washington’s RN supply.
Figure 1. Conceptual Model of Factors Affecting State RN Supply in One Year
RNs Working
in Nursing
(Supply of
Practicing RNs)
Graduates from WA
nursing schools NCLEX pass rateNumber of
licensed RNs in
previous year
In-migration from other
states
New foreign-educated
RNs
Re-activation of license
after expiration
Out-migration
to other states
Deaths
License expiration due
to age-related retirement
and leaving practice
Actively Licensed RNs
Adjustment: percent of
licensed RNs who are
working
Entrants
Exits
7
they were between the ages of 18 and 75 (inclusive), excluding some age outliers that were likely data-entry errors. The overall number of RNs in Washington, their average age, percent age 55 or older, and percent male are shown in Table 1. Table 2 shows the distribution of RNs by age group. Information about RN race/ethnicity is not available from RN licensing and renewal records.
ENTRANTS TO THE STATE’S SUPPLY OF LICENSED RNSNew RNs from Washington’s Nursing Schools: The Washington State Nursing Care Quality Assurance Commission (NCQAC) maintains annual statistics on graduates from nursing schools in Washington State, and distinguishes those graduating from pre-licensure programs (new RNs) from those graduating from post-licensure programs (RNs who have obtained higher
BASELINE SUPPLY OF RNS LICENSED IN WASHINGTONOur projection of RN supply builds upon the 2011 database of actively licensed RNs from the Washington Department of Health, Health Professions Quality Assurance Division. “Active status” represents an RN whose license is up to date and who has the legal authority from the state to work as an RN, but does NOT indicate whether or not the nurse is actually practicing in or outside the state. The state does not collect information about whether or not licensees are practicing, or where they practice.
In March 2011, there were 80,615 RNs with active licenses in Washington from the ages of 18 through 75. Of these, 67,379 (83.6%) had addresses in Washington State (see Table 1). We excluded RNs who had mailing addresses outside of the state, reducing our baseline supply to 67,379 RNs. While we may be undercounting RNs who commute into Washington for work, this is likely compensated by including RNs who live in Washington but work in an adjoining state, which occurs in border urban areas such as Spokane, Washington/Coeur d’Alene, Idaho, and Portland, Oregon/Vancouver, Washington. For purposes of these analyses, we presumed the inflow and outflow occur at equal rates. Restricting our analysis to those RNs with a Washington address also prevents counting RNs who hold licenses in Washington as well as other states and who are not currently living and working in Washington State.
We also decided to include advanced registered nurse practitioners (ARNPs) in the RN supply. ARNPs are required to hold RN licenses as well as ARNP licenses. Our analyses of ARNP licensing files showed that in 2011 there were 3,955 ARNPs with Washington addresses among the licensed RNs in Washington (5.9% of all RNs with Washington addresses).8 ARNPs are not separated from the RN workforce in other important data sources we used for the projections, such as the National Sample Survey of Registered Nurses (NSSRN), conducted every four years by the HRSA.9 While ARNPs and RNs often fill different roles, in order to compare our estimates with those from other data sources, we chose to retain the ARNPs within the Washington RN supply.
Washington’s RN licensing data also include the licensee’s birthdate and gender. Birthdate helps estimate entrants and exits to RN supply, as RNs age. The gender variable can track the progress of continuing efforts to bring more men into this female-dominated profession. We limited the age of nurses in the analysis data set to those whose birthdates indicated
Table 1. RNs with Active Licenses in Washington*: 2011
Number of RNs
Number with active licenses in Washington State 67,379
Mean age 48.9
Percent age 55 years or older 39.3%
Percent male 9.4%
* With addresses in Washington State.Data source: Washington State Department of Health, Health Professions Licensing Data System.
Table 2. Number of Licensed RNs in Washington*, by Age Group (2011)
Age Category
Number of Licensed RNs
Estimated Percent Among Licensed RNs
<30 5,528 8.2%
30-34 6,073 9.0%
35-39 6,224 9.2%
40-44 6,623 9.8%
45-49 7,256 10.8%
50-54 9,166 13.6%
55-59 11,580 17.2%
60-64 8,631 12.8%
65+ 6,298 9.3%
Total 67,379 100.0%
* With addresses in Washington State.Data source: Washington State Department of Health, Health Professions Licensing Data System.
8
another country. Through this process, we estimated that 30 new foreign-educated RNs entered Washington between 2007 and 2008.
Rate of Change Over Time: Past history may not be a good predictor of future trends for this variable, due to reductions in RN vacancy rates and changes in the political climate for immigration and the availability of visas. Once we obtained a baseline 2008 estimate of the number of foreign-trained nurses, we added this number to the base supply projection every year from 2011 through 2031. Our projection does not increase the number of foreign-educated RNs who in-migrate each year, but future iterations of this projection model can be adjusted to explore scenarios that add more or fewer foreign-educated RNs each year.
In-Migration from Other States: The 2008 NSSRN asked respondents the location of their principal nursing position at the time of the survey and one year prior. We included as in-migrants the estimated number of RNs who were not working in Washington one year prior but did work in the state at the time of the survey, including RNs who graduated from nursing schools in other states but became licensed for the first time in Washington. We excluded those whom we determined to be new foreign-educated RNs (as described above) because we were accounting for them separately in our projection. The numbers, by age group, of the 2,402 in-migrants we estimated from 2007 to 2008, are shown in Table 4.
Rate of Change Over Time: Nursing shortages in other states could drive salaries sufficiently high that an RN may be less tempted to move to Washington; conversely, shortages in Washington, higher salaries, and quality-of-life factors could attract more RNs into the state. Because we could not predict whether in-migrants are likely to increase or decrease in the future,
nursing education). Our projections included only pre-licensure graduates from in-state nursing schools as entrants to the state’s RN workforce, and among these only the RNs who took and passed the required NCLEX in Washington. In 2010, there were 2,229 RN graduates from Washington schools who took and passed the NCLEX (732 with a Bachelor of Science in Nursing [BSNs] and 1,497 with an Associate Degree in Nursing [ADNs]), so we added this number of pre-licensure graduates to the base year (2011) of our RN licensed supply projections.
To determine age distribution, we examined the 2008 NSSRN findings and identified respondents who completed their initial RN degree (ADN and BSN) in May 2007 or later. We then assigned the same distribution of ages by nursing degree type to the new RN entrants in our supply model.
Rate of Change Over Time: Table 3 shows trends in pre-licensure graduates since the 2001-2002 academic year. The number of RN graduates in 2008-2009 (2,883) is more than twice that in 2001-2002 (1,173), an increase due, in part, to focused efforts by stakeholders to respond to nurse shortages. The economic crisis in the United States since 2008 has dampened expectations for similar future growth. Therefore, our base scenario assumes no growth in education capacity over the two decades and adds the same number of new RN graduates who will have passed the NCLEX in each subsequent year of the projection.
Foreign-Educated RNs Entering the United States: From the NSSRN’s weighted 2008 Washington State sample, we identified RNs who resided in the state at the time of the survey but indicated they resided elsewhere one year prior. Among those, we identified the number who obtained their initial RN degree in
Table 3. Pre-Licensure RN Graduates by Degree in Washington State
Academic Year
Associate Degree in
Nursing (ADN)
Bachelor of Science in Nursing (BSN) and
Masters RN Entry (ME)
Total Pre-licensure RN Graduates
Increase from Prior
Year
2001-2002 799 374 1,173
2002-2003 853 432 1,285 112
2003-2004 922 453 1,375 90
2004-2005 1,179 605 1,784 409
2005-2006 1,449 666 2,115 331
2006-2007 1,419 1,058 2,477 362
2007-2008 1,695 1,058 2,753 276
2008-2009 1,696 1,187 2,883 130
Data source: State Board of Community and Technical Colleges and Integrated Post-secondary Education Data System (IPEDS).
9
EXITS FROM THE STATE’S SUPPLY OF LICENSED RNSAs shown in Figure 1, the three main factors causing RNs to leave the state’s workforce are:
• Death,
• Out-migration to other states, and
• Retirement (leaving nursing because of age or other reason for separation from the nursing workforce).
Estimating the impact of each factor on future RN supply is complex. Licensing records do not indicate which factor caused the RN’s license to expire. In our previous projections of state RN supply, we estimated each parameter using the best available sources of data and applied it to our model separately. As a result, our previous projections relied on statistics from the NSSRN and National Vital Statistics Reports to estimate exits from Washington’s RN supply. For this update, we examined the total RN license expirations in Washington in 2010 and applied age-specific rates of expiration to each year of the projections without making separate estimates for each type
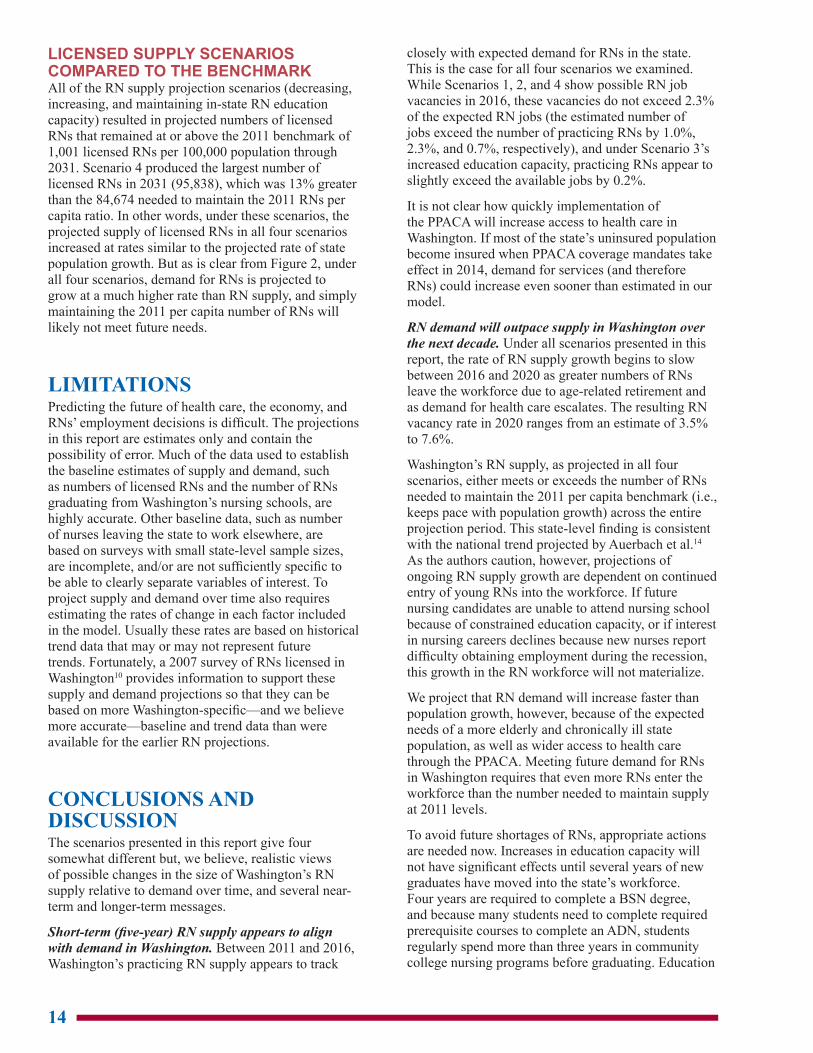
of exit (see Table 6). The two different approaches yield similar results. To understand the relative impact of these reasons for RN license expirations, Appendix A provides estimates of the rates of death and out-migration in Washington’s RN supply using the best source of data for each parameter. Retirement is presumed to be reflected in the exits from RN supply that are not due to death or out-migration.
our projections use the same estimated number of in-migrants (2,402) in each year of the projection.
Re-activation of Licensure after License Expiration: To estimate the number of RNs who re-activated their Washington licenses after allowing them to expire, we compared all records from the September 2008 state licensing data with expired-license status with the active licenses from the licensing records 2.5 years later. RNs who had active licenses in the most recent license records but whose licenses had been expired in the 2008 data file were considered “re-activated.” In 2011 there were 927 re-activated nurses between the age of 18 and 75. Because our comparison spanned 2.5 years, we divided the 927 by 2.5 to obtain an estimate of 371, or 0.55% of the total licensed nurse population, as the number of annual license re-activations. The estimated number of re-activated RN licenses, by age group, in 2011 is shown in Table 5.
Rate of Change Over Time: After identifying the ages of the RNs with re-activated licenses, we calculated the proportion of the licensed workforce that reactivated using five-year age categories. We then added a proportionate number of RNs of the same ages to subsequent years of the RN supply projection for each projection year. This resulted in an increase in the number of estimated re-activations in each year of the projection, ranging from 371 in 2011 to 460 in 2031.
Table 4. Estimates of Licensed RNs Migrating into Washington from Other
States, by Age Group (2011)
Age Category
Estimated Number of RNs Migrating
into State
Estimated Percent of RNs In-migrating Among Total
RNs in Age Group
<30 752 13.6%
30-34 265 4.4%
35-39 221 3.6%
40-44 383 5.8%
45-49 268 3.7%
50-54 295 3.2%
55-59 124 1.1%
60-64 94 1.1%
65+ 0 0.0%
Total 2,402 3.6%
Data sources: Washington State Department of Health, Health Professions Licensing Data System; 2008 National Sample Survey of Registered Nurses.
Table 5. Net Re-activated Washington State RN Licenses,
by Age Group (2011)
Age Category
Number of Reactivations
Estimated Percent of RNs Reactivating Among Total
RNs in Group
<30 3 0.1%
30-34 16 0.3%
35-39 33 0.5%
40-44 41 0.6%
45-49 50 0.7%
50-54 65 0.7%
55-59 87 0.8%
60-64 53 0.6%
65+ 23 0.4%
Total 371 0.6%
Data source: Washington State Department of Health, Health Professions Licensing Data System.
10
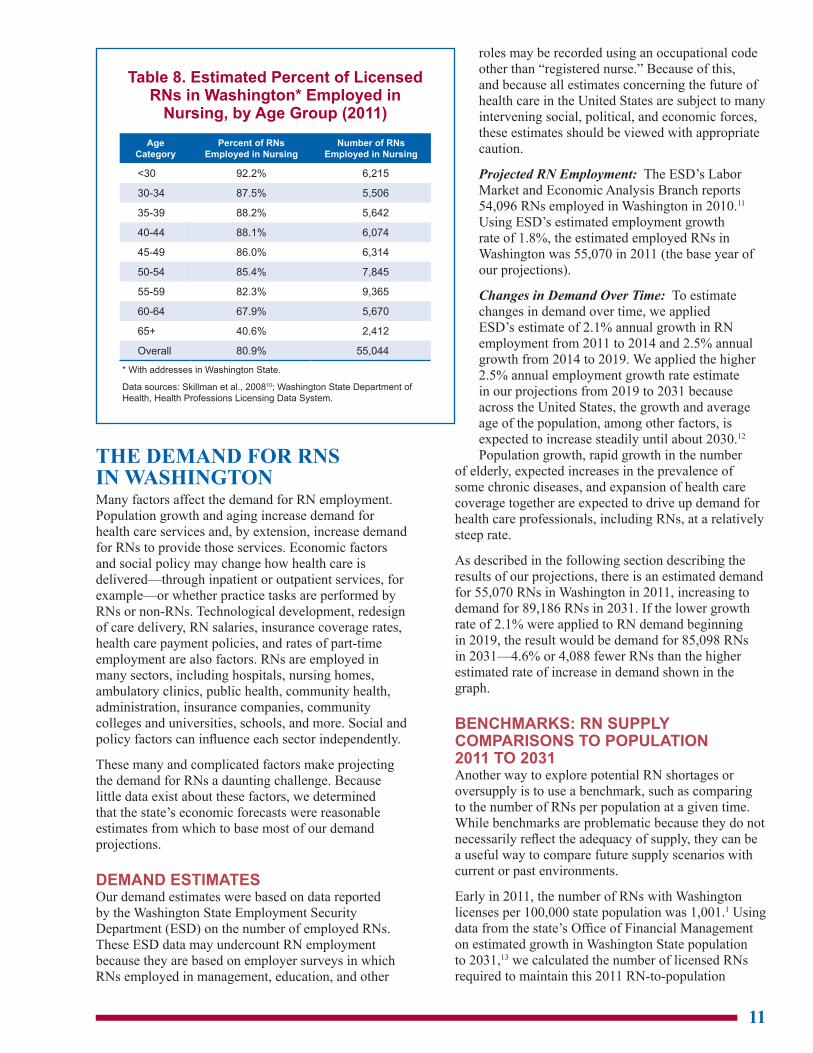
can be compared with demand estimates each year, and thereby project future RN shortages or surpluses.a We reduced the overall licensed supply number to the proportion estimated to be employed in nursing in each year of the projections. The 2007 survey of Washington’s RNs showed that 80.9% of those with addresses in-state were practicing as a registered nurse.10 This percent varies greatly by age group (see Table 8). We used these age-specific percentages of licensed RNs who indicated they were practicing as an RN to estimate the percent of licensed RNs employed in nursing.
Rate of Change Over Time: We applied the percent of RNs employed in nursing by five-year age group to each year of our projections. The total percent of RNs who will be employed in nursing varies from 81.7% in 2011 to 79.8% in 2021 to 80.8% in 2031.
Rate of Change Over Time: We calculated a single estimate of the combined proportion of total RN license expirations because of death, out-migration, or retirement, by age. For each subsequent year of the projection we reduced supply by the same age-specific proportion. Table 7 shows the estimated number of exits from Washington’s licensed RN supply in the base model projection (#1—described below). Because the number of nurses in each age category changes over time, the result is an estimated 2,856 people whose RN licenses expired in 2011 (4.2%), and by 2031 an estimated 4,089 (4.7%) RNs whose Washington licenses expire.
DISTINGUISHING THE PRACTICING RN SUPPLY FROM THE LICENSED RN SUPPLYIn a separate step, we adjusted the licensed RN supply numbers to show the estimated proportion of RNs with active licenses who are employed in nursing. Practice status must be estimated because it is not available from Washington State license records. This adjustment let us estimate the working RN supply that
_________________________
a While we recognize that many nurses do not work full time, we have not incorporated a full-time/part-time component in our projections. The data for demand estimates, described below, are at the individual and not FTE level and estimate the number of individual RNs needed in the state across time. The supply estimates for our projections therefore remain at the individual level in order to be comparable to the demand estimates.
Table 7. Estimated Number of Expired* RN Licenses in
Washington† (and Percent of Total Licenses) by Year, 2011-2031‡
YearNumber of
Expired Licenses Percent
2011 2,856 4.2%
2012 2,926 4.3%
2013 3,050 4.4%
2014 3,177 4.4%
2015 3,293 4.5%
2016 3,408 4.5%
2017 3,523 4.6%
2018 3,635 4.7%
2019 3,728 4.7%
2020 3,817 4.8%
2021 3,907 4.8%
2022 3,977 4.8%
2023 4,022 4.8%
2024 4,065 4.9%
2025 4,093 4.9%
2026 4,115 4.8%
2027 4,120 4.8%
2028 4,120 4.8%
2029 4,110 4.8%
2030 4,091 4.7%
2031 4,089 4.7%
* Representing a combined estimate of deaths, out-migration, and retirement.† With addresses in Washington State.‡ In-state RN graduates retained at 2011 levels.
Table 6. Estimated Expired Washington State RN Licenses, by Age Group
(2011)*
Age Category
Number of Expired Licenses
Estimated Percent of RNs with Expired Licenses
Among Total RNs in Group
<30 239 4.3%
30-34 301 5.0%
35-39 255 4.1%
40-44 242 3.7%
45-49 214 2.9%
50-54 270 2.9%
55-59 366 3.2%
60-64 352 4.1%
65+ 617 9.8%
Total 2,856 4.2%
* Representing a combined estimate of deaths, out-migration, and retirement.
Data source: Washington State Department of Health, Health Professions Licensing Data System.
11
THE DEMAND FOR RNS IN WASHINGTONMany factors affect the demand for RN employment. Population growth and aging increase demand for health care services and, by extension, increase demand for RNs to provide those services. Economic factors and social policy may change how health care is delivered—through inpatient or outpatient services, for example—or whether practice tasks are performed by RNs or non-RNs. Technological development, redesign of care delivery, RN salaries, insurance coverage rates, health care payment policies, and rates of part-time employment are also factors. RNs are employed in many sectors, including hospitals, nursing homes, ambulatory clinics, public health, community health, administration, insurance companies, community colleges and universities, schools, and more. Social and policy factors can influence each sector independently.
These many and complicated factors make projecting the demand for RNs a daunting challenge. Because little data exist about these factors, we determined that the state’s economic forecasts were reasonable estimates from which to base most of our demand projections.
DEMAND ESTIMATESOur demand estimates were based on data reported by the Washington State Employment Security Department (ESD) on the number of employed RNs. These ESD data may undercount RN employment because they are based on employer surveys in which RNs employed in management, education, and other
roles may be recorded using an occupational code other than “registered nurse.” Because of this, and because all estimates concerning the future of health care in the United States are subject to many intervening social, political, and economic forces, these estimates should be viewed with appropriate caution.
Projected RN Employment: The ESD’s Labor Market and Economic Analysis Branch reports 54,096 RNs employed in Washington in 2010.11 Using ESD’s estimated employment growth rate of 1.8%, the estimated employed RNs in Washington was 55,070 in 2011 (the base year of our projections).
Changes in Demand Over Time: To estimate changes in demand over time, we applied ESD’s estimate of 2.1% annual growth in RN employment from 2011 to 2014 and 2.5% annual growth from 2014 to 2019. We applied the higher 2.5% annual employment growth rate estimate in our projections from 2019 to 2031 because across the United States, the growth and average age of the population, among other factors, is expected to increase steadily until about 2030.12 Population growth, rapid growth in the number
of elderly, expected increases in the prevalence of some chronic diseases, and expansion of health care coverage together are expected to drive up demand for health care professionals, including RNs, at a relatively steep rate.
As described in the following section describing the results of our projections, there is an estimated demand for 55,070 RNs in Washington in 2011, increasing to demand for 89,186 RNs in 2031. If the lower growth rate of 2.1% were applied to RN demand beginning in 2019, the result would be demand for 85,098 RNs in 2031—4.6% or 4,088 fewer RNs than the higher estimated rate of increase in demand shown in the graph.
BENCHMARKS: RN SUPPLY COMPARISONS TO POPULATION 2011 TO 2031Another way to explore potential RN shortages or oversupply is to use a benchmark, such as comparing to the number of RNs per population at a given time. While benchmarks are problematic because they do not necessarily reflect the adequacy of supply, they can be a useful way to compare future supply scenarios with current or past environments.
Early in 2011, the number of RNs with Washington licenses per 100,000 state population was 1,001.1 Using data from the state’s Office of Financial Management on estimated growth in Washington State population to 2031,13 we calculated the number of licensed RNs required to maintain this 2011 RN-to-population
Table 8. Estimated Percent of Licensed RNs in Washington* Employed in
Nursing, by Age Group (2011)
Age Category
Percent of RNs Employed in Nursing
Number of RNs Employed in Nursing
<30 92.2% 6,215
30-34 87.5% 5,506
35-39 88.2% 5,642
40-44 88.1% 6,074
45-49 86.0% 6,314
50-54 85.4% 7,845
55-59 82.3% 9,365
60-64 67.9% 5,670
65+ 40.6% 2,412
Overall 80.9% 55,044
* With addresses in Washington State.
Data sources: Skillman et al., 200810; Washington State Department of Health, Health Professions Licensing Data System.
12
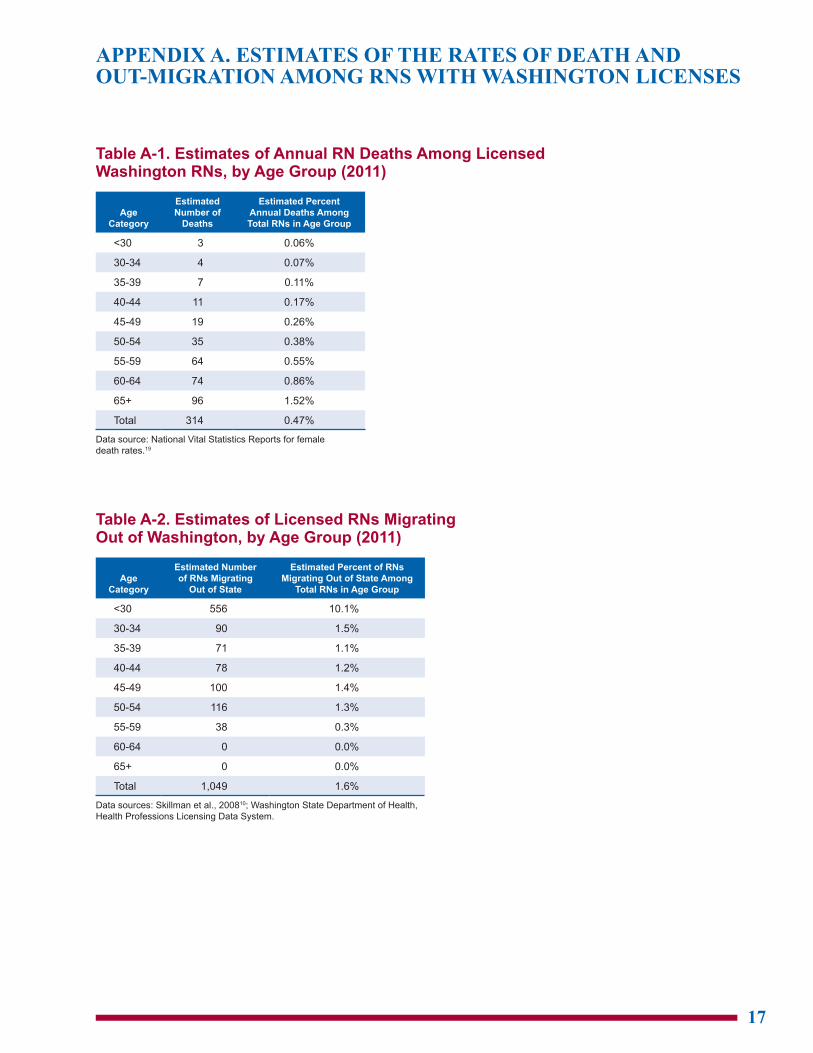
The result is that under Baseline Scenario 1:
• Demand for working RNs would begin to exceed available practicing RN supply in 2015,
• In 2020, there would be a shortage of 3,793 RNs to meet demand, representing a 5.6% vacancy rate, and
• By 2031, the RN supply-demand gap would reach 18,450 RNs: a 20.7% vacancy rate.
SCENARIO 2: 10% FEWER RN GRADUATESScenario 2 shows how RN supply would change over time if the number of new RN graduates in the state who pass the NCLEX in Washington decreased beginning in 2013 by 10% from the 2011 levels: from 1,497 to 1,347 ADN graduates and 732 to 659 pre-licensure BSN graduates. In this scenario, the supply of practicing RNs is estimated to increase from 55,044 in 2011 to 68,059 in 2031. The data represented by this scenario can be found in Appendix B, Table B-2.
The result is that under Scenario 2:
• Demand for working RNs would begin to exceed estimated available supply in 2014,
• In 2020, there would be a shortage of 5,186 RNs to meet demand, representing a 7.6% vacancy rate, and
• By 2031, the RN supply-demand gap would reach 21,128 RNs: a 23.7% vacancy rate.
SCENARIO 3: 10% MORE RN GRADUATESScenario 3 shows how RN supply would change over time if the number of new RN graduates in the state who pass the NCLEX in Washington increased beginning in 2013 by 10% from the 2011 levels: to 1,647 ADN graduates and 805 pre-licensure BSN graduates. In this scenario, the supply of practicing RNs begins at 55,044 in 2011 and reaches 73,414 in 2031. The data represented by this scenario can be found in Appendix B, Table B-3.
The result is that under Scenario 3:
• Demand for working RNs would exceed available supply in 2017,
• In 2020, there would be a shortage of 2,399 RNs to meet demand, representing a 3.5% vacancy rate, and
• By 2031, the RN supply-demand gap would reach 15,772 RNs: a 17.7% vacancy rate.
ratio. In addition to comparing supply with estimated demand in the following scenarios, we compared our projections of future licensed RN supply to a benchmark of the number of RNs that would be needed to maintain the 2011 RN supply-to-population ratio.
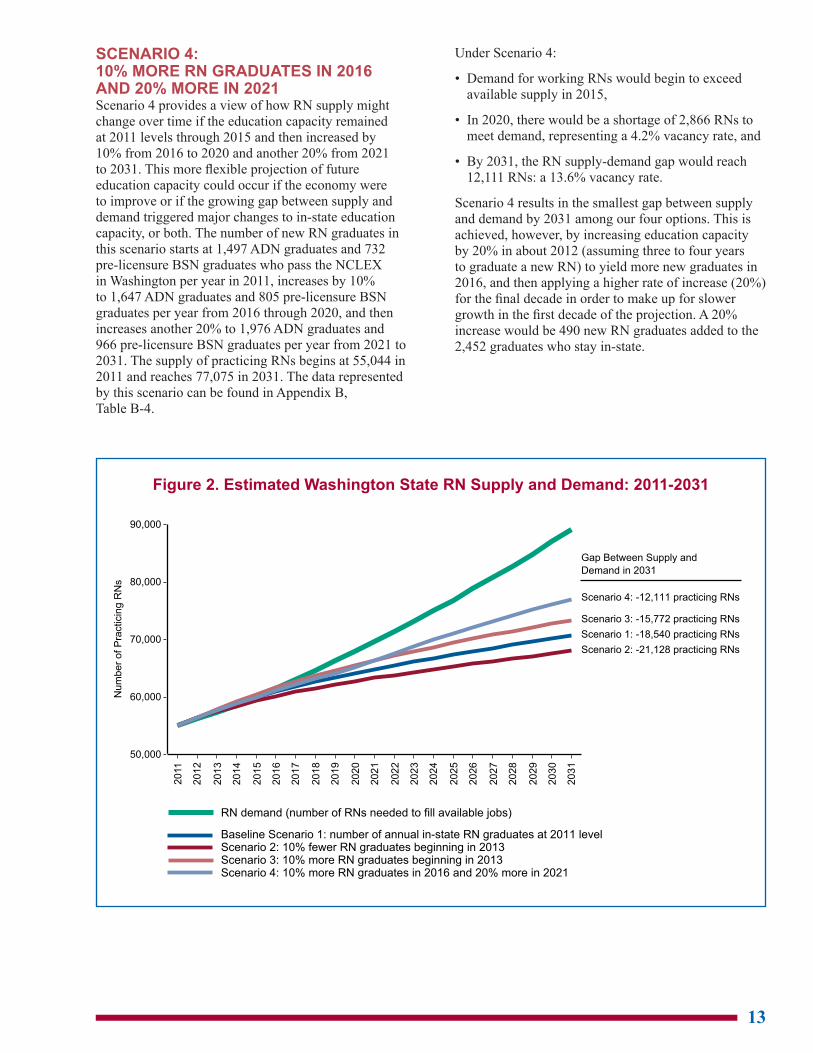
PROJECTIONS OF RN SUPPLY AND DEMAND: 2011 TO 2031Our four scenarios—one baseline and three alternatives—explore how changes in policy and RN characteristics might alter RN supply and demand for Washington from 2011 to 2031. Because increases and decreases in funding for state schools impact state nursing education capacity, and because the number of new RN graduates in-state greatly affects RN supply size, we based our alternate projection models on different estimates of nursing education capacity in Washington. Figure 2 compares the estimated number of practicing RNs to our estimate of RN demand. Readers should note that the number of practicing RNs is generally the most relevant supply comparison to the demand estimates.
Because the number of RN licenses will always exceed the number of RNs employed in nursing in the state at any given time, comparing licensed RN supply to demand estimates would underestimate any RN gap or overestimate a surplus. A benchmark, such as the number of RNs needed to maintain the ratio of licensed RNs to 100,000 state population in 2011, does not indicate whether the projected number of licensed RNs will be more than, less than, or about the right number to meet demand. It can, however, show how the RN supply is projected to change relative to changes in the size of the state’s population.
BASELINE SCENARIO 1: NUMBER OF IN-STATE RN GRADUATES MAINTAINED AT 2011 LEVELFor the baseline scenario of projections of Washington RNs, we held constant the number of new RN graduates from all RN pre-licensure education programs (excluding ADN to BSN program graduates) in the state each year who pass the NCLEX in Washington (our estimate of the number of in-state graduates who become licensed annually in the state) throughout the 2011 to 2031 time period, while incorporating the rates of change in supply as described above. In this scenario, the annual number of new RN graduates who stay in the state would remain at 2011 levels (1,497 ADN graduates and 732 pre-licensure BSN graduates), and the supply of practicing RNs begins at 55,044 in 2011 and reaches 70,736 in 2031. The data represented by this scenario can be found in Appendix B, Table B-1.
13
Under Scenario 4:
• Demand for working RNs would begin to exceed available supply in 2015,
• In 2020, there would be a shortage of 2,866 RNs to meet demand, representing a 4.2% vacancy rate, and
• By 2031, the RN supply-demand gap would reach 12,111 RNs: a 13.6% vacancy rate.
Scenario 4 results in the smallest gap between supply and demand by 2031 among our four options. This is achieved, however, by increasing education capacity by 20% in about 2012 (assuming three to four years to graduate a new RN) to yield more new graduates in 2016, and then applying a higher rate of increase (20%) for the final decade in order to make up for slower growth in the first decade of the projection. A 20% increase would be 490 new RN graduates added to the 2,452 graduates who stay in-state.
SCENARIO 4: 10% MORE RN GRADUATES IN 2016 AND 20% MORE IN 2021Scenario 4 provides a view of how RN supply might change over time if the education capacity remained at 2011 levels through 2015 and then increased by 10% from 2016 to 2020 and another 20% from 2021 to 2031. This more flexible projection of future education capacity could occur if the economy were to improve or if the growing gap between supply and demand triggered major changes to in-state education capacity, or both. The number of new RN graduates in this scenario starts at 1,497 ADN graduates and 732 pre-licensure BSN graduates who pass the NCLEX in Washington per year in 2011, increases by 10% to 1,647 ADN graduates and 805 pre-licensure BSN graduates per year from 2016 through 2020, and then increases another 20% to 1,976 ADN graduates and 966 pre-licensure BSN graduates per year from 2021 to 2031. The supply of practicing RNs begins at 55,044 in 2011 and reaches 77,075 in 2031. The data represented by this scenario can be found in Appendix B, Table B-4.
Figure 2. Estimated Washington State RN Supply and Demand: 2011-2031
2011
2012
2013
2014
2015
2016
2017
2018
2019
2020
2021
2022
2023
2024
2025
2026
2027
2028
2029
2030
2031
50,000
60,000
70,000
80,000
90,000
Num
ber
of P
racticin
g R
Ns
RN demand (number of RNs needed to fill available jobs)
Baseline Scenario 1: number of annual in-state RN graduates at 2011 levelScenario 2: 10% fewer RN graduates beginning in 2013Scenario 3: 10% more RN graduates beginning in 2013Scenario 4: 10% more RN graduates in 2016 and 20% more in 2021
Scenario 4: -12,111 practicing RNs
Scenario 3: -15,772 practicing RNs
Scenario 1: -18,540 practicing RNs
Scenario 2: -21,128 practicing RNs
Gap Between Supply and
Demand in 2031
14
LICENSED SUPPLY SCENARIOS COMPARED TO THE BENCHMARKAll of the RN supply projection scenarios (decreasing, increasing, and maintaining in-state RN education capacity) resulted in projected numbers of licensed RNs that remained at or above the 2011 benchmark of 1,001 licensed RNs per 100,000 population through 2031. Scenario 4 produced the largest number of licensed RNs in 2031 (95,838), which was 13% greater than the 84,674 needed to maintain the 2011 RNs per capita ratio. In other words, under these scenarios, the projected supply of licensed RNs in all four scenarios increased at rates similar to the projected rate of state population growth. But as is clear from Figure 2, under all four scenarios, demand for RNs is projected to grow at a much higher rate than RN supply, and simply maintaining the 2011 per capita number of RNs will likely not meet future needs.
LIMITATIONSPredicting the future of health care, the economy, and RNs’ employment decisions is difficult. The projections in this report are estimates only and contain the possibility of error. Much of the data used to establish the baseline estimates of supply and demand, such as numbers of licensed RNs and the number of RNs graduating from Washington’s nursing schools, are highly accurate. Other baseline data, such as number of nurses leaving the state to work elsewhere, are based on surveys with small state-level sample sizes, are incomplete, and/or are not sufficiently specific to be able to clearly separate variables of interest. To project supply and demand over time also requires estimating the rates of change in each factor included in the model. Usually these rates are based on historical trend data that may or may not represent future trends. Fortunately, a 2007 survey of RNs licensed in Washington10 provides information to support these supply and demand projections so that they can be based on more Washington-specific—and we believe more accurate—baseline and trend data than were available for the earlier RN projections.
CONCLUSIONS AND DISCUSSIONThe scenarios presented in this report give four somewhat different but, we believe, realistic views of possible changes in the size of Washington’s RN supply relative to demand over time, and several near-term and longer-term messages.
Short-term (five-year) RN supply appears to align with demand in Washington. Between 2011 and 2016, Washington’s practicing RN supply appears to track
closely with expected demand for RNs in the state. This is the case for all four scenarios we examined. While Scenarios 1, 2, and 4 show possible RN job vacancies in 2016, these vacancies do not exceed 2.3% of the expected RN jobs (the estimated number of jobs exceed the number of practicing RNs by 1.0%, 2.3%, and 0.7%, respectively), and under Scenario 3’s increased education capacity, practicing RNs appear to slightly exceed the available jobs by 0.2%.
It is not clear how quickly implementation of the PPACA will increase access to health care in Washington. If most of the state’s uninsured population become insured when PPACA coverage mandates take effect in 2014, demand for services (and therefore RNs) could increase even sooner than estimated in our model.
RN demand will outpace supply in Washington over the next decade. Under all scenarios presented in this report, the rate of RN supply growth begins to slow between 2016 and 2020 as greater numbers of RNs leave the workforce due to age-related retirement and as demand for health care escalates. The resulting RN vacancy rate in 2020 ranges from an estimate of 3.5% to 7.6%.
Washington’s RN supply, as projected in all four scenarios, either meets or exceeds the number of RNs needed to maintain the 2011 per capita benchmark (i.e., keeps pace with population growth) across the entire projection period. This state-level finding is consistent with the national trend projected by Auerbach et al.14 As the authors caution, however, projections of ongoing RN supply growth are dependent on continued entry of young RNs into the workforce. If future nursing candidates are unable to attend nursing school because of constrained education capacity, or if interest in nursing careers declines because new nurses report difficulty obtaining employment during the recession, this growth in the RN workforce will not materialize.
We project that RN demand will increase faster than population growth, however, because of the expected needs of a more elderly and chronically ill state population, as well as wider access to health care through the PPACA. Meeting future demand for RNs in Washington requires that even more RNs enter the workforce than the number needed to maintain supply at 2011 levels.
To avoid future shortages of RNs, appropriate actions are needed now. Increases in education capacity will not have significant effects until several years of new graduates have moved into the state’s workforce. Four years are required to complete a BSN degree, and because many students need to complete required prerequisite courses to complete an ADN, students regularly spend more than three years in community college nursing programs before graduating. Education
15
to streamline transfer of ADN students. In addition, nearly every nursing program and major acute care facility in the state participates in one of the Clinical Placement Consortia, designed to expand learning sites and ensure a valuable clinical experience for students. These strategies are evidence of the emphasis within Washington on increasing the efficiency and effectiveness of nursing education in the state.
The future of Washington’s RN workforce depends on which paths the economy and health care delivery take in the next two decades, as well as decisions made by health care planners, educators, and policymakers. Everyone involved in health care planning in Washington should anticipate the projected gap between RN supply and demand, and identify strategies, such as increasing education capacity and identifying more efficient and effective models of care, which will bring RN supply into better alignment with the population’s rapidly increasing need for health care. This does not need to occur in isolation. National efforts in response to a growing, aging, and increasingly more diverse population are working to help build a larger nurse workforce prepared for patient demands beyond acute care interventions.16-18 Washington State will likely need many more RNs in the coming decades, and these RNs need to be prepared to care for the rapidly growing and changing demands of the state’s population.
REFERENCES1. Skillman SM, Andrilla CHA. Washington State
Data Snapshot: Registered Nurses (RNs). Seattle, WA: WWAMI Center for Health Workforce Studies, University of Washington; 2011.
2. Washington State Office of Financial Management. Projections of the state population by age, sex, race, and Hispanic origin: 2000-2030. Available at: http://www.ofm.wa.gov/pop/race/projections/. Accessed December 7, 2011.
3. U.S. Department of Health and Human Services. Affordable Care Act in your state: Washington. Available at: http://www.healthcare.gov/law/resources/wa.html. Accessed December 8, 2011.
4. Washington State Office of the Insurance Commissioner. State of the Uninsured: Health Coverage in Washington State. Olympia, WA: Washington State Office of the Insurance Commissioner; 2011.
programs expanded in 2012 will not impact RN supply until 2015 at the earliest. Supply is also effectively increased by improving RN job retention and reducing turnover. Improving work environments to increase RNs’ job satisfaction and to enable them to have long careers in practice must be an ongoing effort.
In addition, better data resources are needed to track workforce trends in Washington, including identifying how many health professionals are practicing, where, and in what specialties. Such data, not regularly collected in Washington, could support many assessments of the adequacy of the state’s health workforce, including increasing the accuracy of future supply and demand projections such as the ones presented in this report. Many states and their health professions boards collect these data when professionals are licensed, at renewal, and through ongoing surveys.
Maintaining an effective nurse workforce is about more than the numbers. It is beyond the scope of this report to discuss alternative models of care delivery, or how RN education needs to change. But we can predict that in the future we will see redesign of health care delivery in all settings as the emphasis on prevention increases, more of the population has chronic disease to manage, and as the economic climate demands optimal use of health care resources. RNs’ roles will increasingly require skills in leadership, primary care, community health systems, research, and management of transitions of care. Nursing education (including continuing education) must not only keep up with demand for more RNs, but also is charged with producing nurses who have the knowledge and skills to teach, monitor, and manage care across health care settings and who can update that knowledge over the course of their careers.
Nursing education programs in Washington State are recognized for their innovation, an important asset for addressing Washington’s future RN workforce needs. They have streamlined students from ADN to BSN completion through dual enrollment (enrollment in an ADN program and a nearby BSN program) practices; agreement to use a single degree, the “Associate of Applied Science Transfer” degree, for transfer to upper-division schools; and agreement on a single set of prerequisite courses for all ADN programs across the state. Many underserved students in rural areas now have access to RN careers through the Rural Outreach Nursing Education Program, which provides ADN distance education access to a community college program in another region of the state.15 Washington also has several programs designed to prepare internationally educated RNs to become licensed in the state, is collaborating with the Western Governor’s University to expand the state’s BSN completion capacity, and is working to identify common completion requirements or a common transfer degree
16
5. Washington State Department of Health. The health of Washington State, 2007. Available at: http://www.doh.wa.gov/hws/TOC2007.shtm. Accessed December 7, 2011.
6. Lee T. New policy brief: Declining support for education threatens economic growth. Available at: http://budgetandpolicy.org/schmudget/new-policy-brief-declining-support-for-education-threatens-economic-growth. Accessed December 7, 2011.
7. Skillman SM, Andrilla CHA, Hart LG. Washington State Registered Nurse Supply and Demand Projections: 2006-2025. Final Report #112. Seattle, WA: WWAMI Center for Health Workforce Studies, University of Washington; 2007.
8. Skillman SM, Andrilla CHA. Washington State Data Snapshot: Advanced Registered Nurse Practitioners (ARNPs). Seattle, WA: WWAMI Center for Health Workforce Studies, University of Washington; 2011.
9. Health Resources and Services Administration. The Registered Nurse Population. Findings from the 2008 National Sample Survey of Registered Nurses. Rockville, MD: Health Resources and Services Administration, U.S. Department of Health and Human Services; 2010.
10. Skillman SM, Andrilla CHA, Tieman L, Doescher MP. Demographic, Education, and Practice Characteristics of Registered Nurses in Washington State: Results of a 2007 Survey. Final Report #120. Seattle, WA: WWAMI Center for Health Workforce Studies, University of Washington; 2008.
11. Washington State Employment Security Department, Labor Market and Economic Analysis. Projections. Available at: http://www.workforceexplorer.com/cgi/dataanalysis/?pageid=94&subid=162. Accessed November 17, 2011.
12. U.S. Census Bureau. Population profile of the United States. Available at: http://www.census.gov/population/www/pop-profile/natproj.html. Accessed November 14, 2011.
13. Washington State Office of Financial Management. State population forecast. Available at: http://www.ofm.wa.gov/pop/stfc/default.asp. Accessed November 14, 2011.
14. Auerbach DI, Buerhaus PI, Staiger DO. Registered nurse supply grows faster than projected amid surge in new entrants ages 23-26. Health Aff (Millwood). Dec 2011;30(12):2286-2292.
15. Lower Columbia College. RONE. Available at: http://lowercolumbia.edu/nr/exeres/B835F7BB-25F2-4507-AD41-23D0A5CE4887. Accessed December 21, 2011.
16. Institute of Medicine, Committee on the Robert Wood Johnson Foundation Initiative on the Future of Nursing. The Future of Nursing: Leading Change, Advancing Health. Washington, DC: National Academies Press; 2010.
17. Health Resources and Services Administration. Nursing grant programs. Available at: http://bhpr.hrsa.gov/nursing/grantprograms.html. Accessed December 21, 2011.
18. Benner P, Sutphen M, Leonard V, Day L. Educating Nurses: A Call for Radical Transformation. San Francisco, CA: Jossey-Bass; 2010.
19. Arias E. United States life tables, 2006. Natl Vital Stat Rep. Jun 28 2010;58(21):1-40.
17
APPENDIX A. ESTIMATES OF THE RATES OF DEATH AND OUT-MIGRATION AMONG RNS WITH WASHINGTON LICENSES
Table A-1. Estimates of Annual RN Deaths Among Licensed Washington RNs, by Age Group (2011)
Age Category
Estimated Number of
Deaths
Estimated Percent Annual Deaths Among Total RNs in Age Group
<30 3 0.06%
30-34 4 0.07%
35-39 7 0.11%
40-44 11 0.17%
45-49 19 0.26%
50-54 35 0.38%
55-59 64 0.55%
60-64 74 0.86%
65+ 96 1.52%
Total 314 0.47%
Data source: National Vital Statistics Reports for female death rates.19
Table A-2. Estimates of Licensed RNs Migrating Out of Washington, by Age Group (2011)
Age Category
Estimated Number of RNs Migrating
Out of State
Estimated Percent of RNs Migrating Out of State Among
Total RNs in Age Group
<30 556 10.1%
30-34 90 1.5%
35-39 71 1.1%
40-44 78 1.2%
45-49 100 1.4%
50-54 116 1.3%
55-59 38 0.3%
60-64 0 0.0%
65+ 0 0.0%
Total 1,049 1.6%
Data sources: Skillman et al., 200810; Washington State Department of Health, Health Professions Licensing Data System.
18 19
APP
EN
DIX
B: E
STIM
ATE
S O
F R
N S
UPP
LY A
ND
DE
MA
ND
IN W
ASH
ING
TON
FR
OM
201
1 TO
203
1 U
ND
ER
FO
UR
SC
EN
AR
IOS
Tabl
e B
-1. B
asel
ine
Scen
ario
1: N
umbe
r of I
n-St
ate
RN
Gra
duat
es (W
ho P
ass
the
NC
LEX
in W
ashi
ngto
n)
Mai
ntai
ned
at 2
011
Leve
l, K
ey D
ata
by Y
ear*
2011
2012
2013
2014
2015
2016
2017
2018
2019
2020
2021
2022
2023
2024
2025
2026
2027
2028
2029
2030
2031
Est
imat
ed s
uppl
y†
Lice
nsed
RN
s 6
8,19
2 7
0,14
2 7
1,98
7 7
3,71
8 7
5,32
8 7
6,81
6 7
8,17
8 7
9,40
5 8
0,50
9 8
1,54
2 8
2,48
7 8
3,29
7 8
4,01
7 8
4,69
7 8
5,32
1 8
5,92
1 8
6,46
4 8
6,98
7 8
7,49
3 8
8,02
4 8
8,60
7
Pra
ctic
ing
RN
s 5
5,04
4 5
6,41
2 5
7,67
4 5
8,83
9 5
9,95
5 6
0,94
4 6
1,83
2 6
2,65
0 6
3,41
4 6
4,18
0 6
4,88
7 6
5,53
1 6
6,15
2 6
6,76
4 6
7,38
2 6
7,98
8 6
8,55
5 6
9,10
9 6
9,64
1 7
0,18
1 7
0,73
6
Est
imat
ed n
umbe
r of p
re-li
cens
ure
RN
gra
duat
es fr
om s
choo
ls in
Was
hing
ton
who
pas
s N
CLE
X
AD
N g
radu
ates
1,4
97
1,4
97
1,4
97
1,4
97
1,4
97
1,4
97
1,4
97
1,4
97
1,4
97
1,4
97
1,4
97
1,4
97
1,4
97
1,4
97
1,4
97
1,4
97
1,4
97
1,4
97
1,4
97
1,4
97
1,4
97
BS
N g
radu
ates
732
7
32
732
7
32
732
7
32
732
7
32
732
7
32
732
7
32
732
7
32
732
7
32
732
7
32
732
7
32
732
Est
imat
ed d
eman
d‡ 5
5,07
0 5
6,22
6 5
7,40
7 5
8,61
3 6
0,07
8 6
1,58
0 6
3,12
0 6
4,69
8 6
6,31
5 6
7,97
3 6
9,67
2 7
1,41
4 7
3,19
9 7
5,02
9 7
6,90
5 7
8,82
8 8
0,79
8 8
2,81
8 8
4,88
9 8
7,01
1 8
9,18
6
* E
stim
ates
are
for t
he e
nd o
f eac
h ca
lend
ar y
ear.
† W
ith a
ddre
sses
in W
ashi
ngto
n S
tate
.‡
RN
s ne
eded
to fi
ll pr
ojec
ted
num
ber o
f ava
ilabl
e jo
bs.
Tabl
e B
-2. S
cena
rio 2
: 10%
Few
er R
N G
radu
ates
(Who
Pas
s th
e N
CLE
X in
Was
hing
ton)
B
egin
ning
in 2
013,
Key
Dat
a by
Yea
r*20
1120
1220
1320
1420
1520
1620
1720
1820
1920
2020
2120
2220
2320
2420
2520
2620
2720
2820
2920
3020
31
Est
imat
ed s
uppl
y†
Lice
nsed
RN
s 6
8,19
2 7
0,14
2 7
1,76
4 7
3,28
0 7
4,68
2 7
5,97
0 7
7,14
0 7
8,18
2 7
9,10
9 7
9,97
2 8
0,75
3 8
1,40
5 8
1,97
3 8
2,50
5 8
2,98
8 8
3,45
0 8
3,85
9 8
4,25
3 8
4,63
5 8
5,04
6 8
5,51
2
Pra
ctic
ing
RN
s 5
5,04
4 5
6,41
2 5
7,47
4 5
8,44
6 5
9,37
7 6
0,18
8 6
0,90
5 6
1,56
0 6
2,16
9 6
2,78
6 6
3,35
2 6
3,86
1 6
4,35
2 6
4,83
9 6
5,33
7 6
5,82
7 6
6,28
2 6
6,72
8 6
7,15
7 6
7,59
9 6
8,05
9
Est
imat
ed n
umbe
r of p
re-li
cens
ure
RN
gra
duat
es fr
om s
choo
ls in
Was
hing
ton
who
pas
s N
CLE
X
AD
N g
radu
ates
1,4
97
1,4
97
1,3
47
1,3
47
1,3
47
1,3
47
1,3
47
1,3
47
1,3
47
1,3
47
1,3
47
1,3
47
1,3
47
1,3
47
1,3
47
1,3
47
1,3
47
1,3
47
1,3
47
1,3
47
1,3
47
BS
N g
radu
ates
732
7
32
659
6
59
659
6
59
659
6
59
659
6
59
659
6
59
659
6
59
659
6
59
659
6
59
659
6
59
659
Est
imat
ed d
eman
d‡ 5
5,07
0 5
6,22
6 5
7,40
7 5
8,61
3 6
0,07
8 6
1,58
0 6
3,12
0 6
4,69
8 6
6,31
5 6
7,97
3 6
9,67
2 7
1,41
4 7
3,19
9 7
5,02
9 7
6,90
5 7
8,82
8 8
0,79
8 8
2,81
8 8
4,88
9 8
7,01
1 8
9,18
6
* E
stim
ates
are
for t
he e
nd o
f eac
h ca
lend
ar y
ear.
† W
ith a
ddre
sses
in W
ashi
ngto
n S
tate
.‡
RN
s ne
eded
to fi
ll pr
ojec
ted
num
ber o
f ava
ilabl
e jo
bs.
18 19
Tabl
e B
-3. S
cena
rio 3
: 10%
Mor
e R
N G
radu
ates
(Who
Pas
s th
e N
CLE
X in
Was
hing
ton)
B
egin
ning
in 2
013,
Key
Dat
a by
Yea
r*20
1120
1220
1320
1420
1520
1620
1720
1820
1920
2020
2120
2220
2320
2420
2520
2620
2720
2820
2920
3020
31
Est
imat
ed s
uppl
y†
Lice
nsed
RN
s 6
8,19
2 7
0,14
2 7
2,21
0 7
4,15
6 7
5,97
3 7
7,66
2 7
9,21
6 8
0,62
8 8
1,91
0 8
3,11
3 8
4,22
2 8
5,18
9 8
6,06
2 8
6,88
8 8
7,65
5 8
8,39
3 8
9,06
9 8
9,72
0 9
0,35
1 9
1,00
2 9
1,70
1
Pra
ctic
ing
RN
s 5
5,04
4 5
6,41
2 5
7,87
5 5
9,23
2 6
0,53
4 6
1,70
0 6
2,75
9 6
3,74
0 6
4,66
0 6
5,57
4 6
6,42
1 6
7,20
0 6
7,95
1 6
8,68
8 6
9,42
8 7
0,14
9 7
0,82
8 7
1,48
9 7
2,12
4 7
2,76
4 7
3,41
4
Est
imat
ed n
umbe
r of p
re-li
cens
ure
RN
gra
duat
es fr
om s
choo
ls in
Was
hing
ton
who
pas
s N
CLE
X
AD
N g
radu
ates
1,4
97
1,4
97
1,6
47
1,6
47
1,6
47
1,6
47
1,6
47
1,6
47
1,6
47
1,6
47
1,6
47
1,6
47
1,6
47
1,6
47
1,6
47
1,6
47
1,6
47
1,6
47
1,6
47
1,6
47
1,6
47
BS
N g
radu
ates
732
7
32
805
8
05
805
8
05
805
8
05
805
8
05
805
8
05
805
8
05
805
8
05
805
8
05
805
8
05
805
Est
imat
ed d
eman
d‡ 5
5,07
0 5
6,22
6 5
7,40
7 5
8,61
3 6
0,07
8 6
1,58
0 6
3,12
0 6
4,69
8 6
6,31
5 6
7,97
3 6
9,67
2 7
1,41
4 7
3,19
9 7
5,02
9 7
6,90
5 7
8,82
8 8
0,79
8 8
2,81
8 8
4,88
9 8
7,01
1 8
9,18
6
* E
stim
ates
are
for t
he e
nd o
f eac
h ca
lend
ar y
ear.
† W
ith a
ddre
sses
in W
ashi
ngto
n S
tate
.‡
RN
s ne
eded
to fi
ll pr
ojec
ted
num
ber o
f ava
ilabl
e jo
bs.
Tabl
e B
-4. S
cena
rio 4
: 10%
Mor
e R
N G
radu
ates
(Who
Pas
s th
e N
CLE
X in
Was
hing
ton)
in
201
6 and
20%
in 2
021,
Key
Dat
a by
Yea
r*20
1120
1220
1320
1420
1520
1620
1720
1820
1920
2020
2120
2220
2320
2420
2520
2620
2720
2820
2920
3020
31
Est
imat
ed s
uppl
y†
Lice
nsed
RN
s 6
8,19
2 7
0,14
2 7
1,98
7 7
3,71
8 7
5,32
8 7
7,03
9 7
8,61
6 8
0,05
0 8
1,35
5 8
2,58
1 8
4,20
1 8
5,66
1 8
7,00
8 8
8,29
2 8
9,49
8 9
0,65
6 9
1,73
6 9
2,77
6 9
3,78
0 9
4,79
2 9
5,83
8
Pra
ctic
ing
RN
s 5
5,04
4 5
6,41
2 5
7,67
4 5
8,83
9 5
9,95
5 6
1,14
4 6
2,22
5 6
3,22
8 6
4,17
1 6
5,10
7 6
6,41
7 6
7,64
1 6
8,81
8 6
9,96
2 7
1,09
1 7
2,18
5 7
3,22
0 7
4,22
0 7
5,17
8 7
6,12
7 7
7,07
5
Est
imat
ed n
umbe
r of p
re-li
cens
ure
RN
gra
duat
es fr
om s
choo
ls in
Was
hing
ton
who
pas
s N
CLE
X
AD
N g
radu
ates
1,4
97
1,4
97
1,4
97
1,4
97
1,4
97
1,6
47
1,6
47
1,6
47
1,6
47
1,6
47
1,9
76
1,9
76
1,9
76
1,9
76
1,9
76
1,9
76
1,9
76
1,9
76
1,9
76
1,9
76
1,9
76
BS
N g
radu
ates
732
7
32
732
7
32
732
8
05
805
8
05
805
8
05
966
9
66
966
9
66
966
9
66
966
9
66
966
9
66
966
Est
imat
ed d
eman
d‡ 5
5,07
0 5
6,22
6 5
7,40
7 5
8,61
3 6
0,07
8 6
1,58
0 6
3,12
0 6
4,69
8 6
6,31
5 6
7,97
3 6
9,67
2 7
1,41
4 7
3,19
9 7
5,02
9 7
6,90
5 7
8,82
8 8
0,79
8 8
2,81
8 8
4,88
9 8
7,01
1 8
9,18
6
* E
stim
ates
are
for t
he e
nd o
f eac
h ca
lend
ar y
ear.
† W
ith a
ddre
sses
in W
ashi
ngto
n S
tate
.‡
RN
s ne
eded
to fi
ll pr
ojec
ted
num
ber o
f ava
ilabl
e jo
bs.
20
RELATED RESOURCES FROM THE WWAMI CENTER FOR HEALTH WORKFORCE STUDIES AND THE RURAL HEALTH RESEARCH CENTERPUBLISHED ARTICLESKaplan L, Brown MA, Andrilla H, Hart LG. Barriers to autonomous practice. Nurse Pract. 2006;31(1):57-63.
Kaplan L, Brown MA, Andrilla H, Hart LG. The Washington State nurse anesthetist workforce: a case study. AANA J. Feb 2007;75(1):37-42.
Skillman SM, Andrilla CHA, Patterson DG, Tieman L, Doescher MP. The licensed practical nurse workforce in the United States: one state’s experience. Cah Sociol Demogr Med. Apr-Jun 2010;50(2):179-212.
Skillman SM, Palazzo L, Hart LG, Keepnews D. The characteristics of registered nurses whose licenses expire: why they leave nursing and implications for retention and re-entry. Nurs Econ. May-Jun 2010;28(3):181-189.
Skillman SM, Palazzo L, Keepnews D, Hart LG. Characteristics of registered nurses in rural vs. urban areas: implications for strategies to alleviate nursing shortages in the United States. J Rural Health. 2006;22(2):151-157.
REPORTSAndrilla CHA, Hart LG, Kaplan L, Brown MA. Practice Patterns and Characteristics of Nurse Practitioners in Washington State. Working Paper #109. Seattle, WA: WWAMI Center for Health Workforce Studies, University of Washington, 2007.
Andrilla CHA, Skillman SM, Tieman L. Demographic, Education, and Practice Characteristics of Licensed Practical Nurses in Washington State: Results of a 2007 survey. Final Report #123. Seattle, WA: WWAMI Center for Health Workforce Studies, University of Washington; 2009.
Patterson DG, Skillman SM, Andrilla CHA. Data Snapshot: Wyoming Advanced Practice Nurses, 2009. Seattle, WA: WWAMI Center for Health Workforce Studies, University of Washington; 2009.
Skillman SM, Andrilla CHA. Washington State Data Snapshot: Advanced Registered Nurse Practitioners (ARNPs). Seattle, WA: WWAMI Center for Health Workforce Studies, University of Washington; 2011.
Skillman SM, Andrilla CHA. Washington State Data Snapshot: Licensed Practical Nurses (LPNs). Seattle, WA: WWAMI Center for Health Workforce Studies, University of Washington; 2011.
For a complete list of publications by the Center for Health Workforce Studies, visit http://depts.washington.edu/uwchws/.
mar CFS:cjan2012:m:s 1/4/12
Skillman SM, Andrilla CHA. Washington State Data Snapshot: Registered Nurses (RNs). Seattle, WA: WWAMI Center for Health Workforce Studies, University of Washington; 2011.
Skillman SM, Andrilla CHA, Hart LG. Washington State Registered Nurse Supply and Demand Projections: 2006-2025. Final Report #112. Seattle, WA: WWAMI Center for Health Workforce Studies, University of Washington; 2007.
Skillman SM, Andrilla CHA, Kaplan L, Brown MA. Demographic, Education, and Practice Characteristics of Advanced Registered Nurse Practitioners in Washington State: Results of a 2008 Survey. Final Report #124. Seattle, WA: WWAMI Center for Health Workforce Studies, University of Washington; 2009.
Skillman SM, Andrilla CHA, Patterson DG, Thomas A, Tieman L. Washington State Licensed Practical Nurse Supply and Demand Projections: 2007-2026. Final Report #129. Seattle, WA: WWAMI Center for Health Workforce Studies, University of Washington; 2009.
Skillman SM, Andrilla CHA, Tieman L, Doescher MP. Demographic, Education, and Practice Characteristics of Registered Nurses in Washington State: Results of a 2007 Survey. Final Report #120. Seattle, WA: WWAMI Center for Health Workforce Studies, University of Washington; 2008.
Skillman SM, Basye A. Policy Brief: Home Care Aides in Washington State: Current Supply and Future Demand. Seattle, WA: WWAMI Center for Health Workforce Studies, University of Washington; 2011.
Skillman SM, Doescher MP, Rosenblatt RA. Policy Brief: Threats to the Future Supply of Rural Registered Nurses. Seattle, WA: WWAMI Rural Health Research Center, University of Washington; 2009.
Skillman SM, Palazzo L, Hart LG, Keepnews D. What Happens to Registered Nurses Whose Licenses Expire? An Exploratory Study in Washington State. Working Paper #110. Seattle, WA: WWAMI Center for Health Workforce Studies, University of Washington; 2006.
Skillman SM, Palazzo L, Keepnews D, Hart LG. Characteristics of Registered Nurses in Rural vs. Urban Areas: Implications for Strategies to Alleviate Nursing Shortages in the United States. Working Paper #91. Seattle, WA: WWAMI Center for Health Workforce Studies, University of Washington; 2005.