WASHINGTON STATE TRANSPORTATION BY THE NUMBERS: Meeting the State’s Need for Safe and Efficient Mobility MARCH 2014 202-466-6706 www.tripnet.org Founded in 1971, TRIP ® of Washington, DC, is a nonprofit organization that researches, evaluates and distributes economic and technical data on surface transportation issues. TRIP is sponsored by insurance companies, equipment manufacturers, distributors and suppliers; businesses involved in highway and transit engineering and construction; labor unions; and organizations concerned with efficient and safe surface transportation.
Transcript
WASHINGTON STATE TRANSPORTATION
BY THE NUMBERS:
Meeting the State’s Need for Safe and Efficient Mobility
MARCH 2014
202-466-6706
www.tripnet.org
Founded in 1971, TRIP ® of Washington, DC, is a nonprofit organization that researches, evaluates and distributes economic and technical data on surface transportation issues. TRIP is sponsored by insurance companies, equipment manufacturers, distributors and suppliers; businesses involved in highway and transit engineering and construction; labor unions; and organizations concerned with efficient and safe surface transportation.
TRIP estimates that Washington roadways that lack some desirable safety features, have inadequate capacity to meet travel demands or have poor pavement conditions cost the state’s residents approximately $6.5 billion annually in the form of additional vehicle operating costs, lost time and wasted fuel due to traffic congestion and traffic crashes.
$1,845
The average Seattle driver loses $1,845 each year as a result of driving on roads that are congested, deteriorated or that lack some desirable safety features.
$1,423
The average Spokane driver loses $1,423 each year as a result of driving on roads that are congested, deteriorated or that lack some desirable safety features.
21%
45%
Statewide, twenty-one percent of Washington’s roads and highways are in poor condition. In both the Seattle and Spokane urban areas, 45 percent of major urban roads are in poor condition.
3X
From 2013 to 2018, under current funding projections, the share of state-maintained roads and highways (the most heavily traveled in the state) with pavements in poor condition is anticipated to more than triple from eight percent to 26 percent. And the share of state-maintained roads and highways in good condition will decrease from 70 percent to 45 percent.
$1.2 Billion
From 2013 to 2018, WSDOT projects a shortfall of approximately $1.2 billion between the anticipated annual budget for road, highway and bridge preservation and reconstruction and the needed annual budget to achieve sustained improvements in the state’s major roads, highways and bridges.
138 158
The number of state-maintained bridges (the most critical bridges in the state) that are rated structurally deficient are expected to increase from 138 in 2013 to 158 in 2018 under current funding.
4X The fatality rate on Washington’s non-interstate rural roads is nearly four times higher than on all other roads in the state (1.90 fatalities per 100 million vehicle miles of travel vs. 0.50).
$848 million If a lack of adequate revenue into the Federal Highway Trust Fund is not addressed by Congress, funding for highway and transit improvements in Washington State could be cut by $848 million for federal fiscal year 2015 beginning October 1, 2014.
474 2,371
On average, 474 people were killed each year in Washington traffic crashes from 2008 to 2012, a total of 2,371 fatalities over the five-year period.
2
Executive Summary Washington State’s extensive system of roads, highways and bridges provides the state’s residents, visitors and businesses with a high level of mobility. This transportation system forms the backbone that supports the state’s economy. Washington’s surface transportation system enables the state’s residents and visitors to travel to work and school, visit family and friends, and frequent tourist and recreation attractions while providing its businesses with reliable access to customers, materials, suppliers and employees. As Washington looks to retain its businesses, maintain its level of economic competitiveness and achieve further economic growth, the state will need to maintain and modernize its roads, highways and bridges by improving the physical condition of its transportation network and enhancing the system’s ability to provide efficient and reliable mobility for motorists and businesses. Making needed improvements to Washington’s roads, highways and bridges could also provide a significant boost to the state’s economy by creating jobs in the short term and stimulating long term economic growth as a result of enhanced mobility and access.
With a current unemployment rate of 6.8 percent and with the state’s population continuing to grow, Washington must improve its system of roads, highways and bridges to foster economic growth and keep businesses in the state. In addition to economic growth, transportation improvements are needed to ensure safe, reliable mobility and quality of life for all residents. Meeting Washington’s need to modernize and maintain its system of roads, highways and bridges will require a significant boost in local, state and federal funding.
An inadequate transportation system costs Washington residents a total of $6.5 billion every year in the form of additional vehicle operating costs (VOC), congestion-related delays and traffic crashes.
• TRIP estimates that Washington roadways that lack some desirable safety features, have inadequate capacity to meet travel demands or have poor pavement conditions cost the state’s residents approximately $6.5 billion annually in the form of additional vehicle operating costs, the cost of lost time and wasted fuel due to traffic congestion, and traffic crashes.
• TRIP has calculated the annual cost to Washington residents of driving on roads that are deteriorated, congested and lack some desirable safety features both statewide and in the state’s largest urban area. The following chart shows the cost breakdown for these areas.
3
Population and economic growth in Washington have resulted in increased demands on the state’s major roads and highways, leading to increased wear and tear on the transportation system.
• Washington’s population reached 6.9 million in 2012, a 42 percent increase since 1990. Washington had 5,178,789 licensed drivers in 2011.
• Vehicle miles traveled in Washington increased 27 percent from 1990 to 2012 – jumping from 44.7 billion vehicle miles traveled (VMT) in 1990 to 57 billion VMT in 2012.
• By 2030, vehicle travel in Washington is projected to increase by another 15 percent.
• From 1990 to 2012, Washington’s gross domestic product, a measure of the state’s economic output, increased by 85 percent, when adjusted for inflation.
Pavement and bridge conditions in Washington have reached unprecedented levels of deterioration due to a lack of funding. Pavement conditions in Washington are projected to deteriorate even further in the future unless the state can provide additional transportation funding for pavement preservation and reconstruction.
• Twenty-one percent of Washington’s roads and highways have pavement in poor condition and an additional 23 percent are rated in mediocre condition. Seventeen percent of Washington’s major roadways are rated in fair condition and the remaining 38 percent are rated in good condition.
• Roads rated in poor condition typically show clear signs of deterioration, including
rutting, cracks and potholes. In some cases, poor roads can be resurfaced, but often are too deteriorated and must be reconstructed.
• The pavement data in this report for arterial roads and highways is provided by the Federal Highway Administration, based on data submitted annually by the Washington State Department of Transportation (WSDOT) on the condition of major state and locally maintained roads and highways in the state.
• In the Seattle urban area, 45 percent of major locally and state-maintained roads are rated
in poor condition and 30 percent are rated in mediocre condition. Nine percent of the area’s major urban roads are rated in fair condition and 16 percent are rated in good condition.
• Forty-five percent of major urban roads in the Spokane urban area are rated in poor
condition and 23 percent are rated in mediocre condition. Nineteen percent of Spokane’s major urban roads are rated in fair condition and 13 percent are rated in good condition.
• Pavement conditions in Washington are projected to deteriorate significantly in the next
five years unless the state can secure additional funding for pavement preservation and reconstruction. From 2013 to 2018, under current funding projections, the share of state-
4
maintained roads and highways (the most heavily traveled in the state) with pavements in poor condition is anticipated to more than triple from eight percent to 26 percent. And the share of state-maintained roads and highways in good condition is projected to decrease from 70 percent to 45 percent.
• From 2013 to 2018, WSDOT projects a shortfall of nearly $1 billion between the current
and anticipated annual budget for pavement preservation and reconstruction and the needed annual budget to achieve sustained improvements in pavement conditions. The chart below details the amount needed each year for pavement preservation and reconstruction and the amount projected to be available.
• Driving on rough roads costs Washington motorists a total of $2.3 billion annually in
extra vehicle operating costs. Costs include accelerated vehicle depreciation, additional repair costs, and increased fuel consumption and tire wear.
• Driving on rough roads costs the average Seattle motorist $625 annually in extra vehicle operating costs, while the average driver in the Spokane urban area loses $619 each year as a result of driving on deteriorated roads.
More than a quarter of locally and state-maintained bridges in Washington show significant deterioration or do not meet current design standards often because of narrow lanes, inadequate clearances or poor alignment. WSDOT projects a bridge funding shortfall of $220 million over the next five years.
• Five percent of Washington’s bridges are structurally deficient. A bridge is structurally deficient if there is significant deterioration of the bridge deck, supports or other major components. Structurally deficient bridges may be posted for lower weight or closed to traffic, restricting or redirecting large vehicles, including commercial trucks and emergency services vehicles.
• Twenty-one percent of Washington’s bridges are functionally obsolete. Bridges that are
functionally obsolete no longer meet current highway design standards, often because of narrow lanes, inadequate clearances or poor alignment.
• Four percent of Washington’s bridges are fracture critical. A fracture-critical bridge is
one that does not contain redundant supporting elements. This means that if those key supports fail, the bridge would be in danger of collapse. This does not mean the bridge is inherently unsafe, only that there is a lack of redundancy in its design.
5
• Under current funding projections, the number of structurally deficient, state-maintained bridges (the most critical bridges in the state) will increase from 138 in 2013 to 158 in 2018.
• WSDOT projects a total shortfall of $220 million from 2013 to 2018 between the anticipated budget for bridge preservation and reconstruction and the needed annual budget to achieve sustained improvements in bridge conditions.
The deterioration of roads and bridges can have significant consequences for drivers, leading to longer, rougher trips and a potential decrease in roadway safety.
• Rough pavement conditions on roads and bridges lead to a less pleasant driving environment, including louder road noise and an increased number of potholes, which may lead to tire and vehicle damage.
• Roadway speeds may be temporarily reduced as a result of rough road conditions, leading to additional congestion.
• Bridges in need of repair may be closed or restricted to vehicles with lower weights, resulting in detours and increased travel times, especially in more rural areas where the nearest alternate crossing may be a significant distance away.
Increasing levels of traffic congestion cause significant delays in Washington, particularly in the state’s larger urban areas, choking commuting and commerce.
• According to the Texas Transportation Institute (TTI), the average driver in the Seattle urban area loses $1,050 each year in the cost of lost time and wasted fuel as a result of traffic congestion. The average commuter in the Seattle urban area wastes48 hours each year stuck in traffic.
• TTI estimates that the average Spokane-area driver loses $518 annually in the cost of lost time and wasted fuel due to congestion. The average Spokane commuter wastes23 hours to traffic congestion every year.
• The total annual cost of traffic congestion in Washington is $2.7 billion in lost time and wasted fuel.
6
Washington’s traffic fatality rate on rural, non-Interstate routes is nearly four times higher than that on all other roads and highways in the state. Improving safety features on Washington’s roads and highways would likely result in a decrease in the state’s traffic fatalities and serious crashes. Roadway features are likely a contributing factor in approximately one-third of all fatal and serious traffic crashes.
• Between 2008 and 2012 a total of 2,372 people were killed in traffic crashes in Washington, an average of 474 fatalities per year.
• Washington’s overall traffic fatality rate of 0.78 fatalities per 100 million vehicle miles of
travel in 2012 is lower than the national average of 1.13.
• The fatality rate on Washington’s rural non-Interstate roads was 1.90 fatalities per 100 million vehicle miles of travel, nearly four times higher than the 0.50 fatality rate on all other roads and highways in the state.
• The annual cost of serious traffic crashes in Washington, in which roadway features were
likely a contributing factor, was approximately $1.5 billion.
• The annual cost per motorist of traffic crashes in which roadway design was likely a contributing factor in the state’s major urban areas are: Seattle - $170; Spokane - $286.
• Roadway features that impact safety include the number of lanes, lane widths, lighting, lane markings, rumble strips, shoulders, guard rails, other shielding devices, median barriers and intersection design. The cost of serious crashes includes lost productivity, lost earnings, medical costs and emergency services.
• Several factors are associated with vehicle crashes that result in fatalities, including driver behavior, vehicle characteristics and roadway features. TRIP estimates that roadway features are likely a contributing factor in approximately one-third of fatal traffic crashes.
• Where appropriate, highway improvements can reduce traffic fatalities and crashes while improving traffic flow to help relieve congestion. Such improvements include removing or shielding obstacles; adding or improving medians; improved lighting; adding rumble strips, wider lanes, wider and paved shoulders; upgrading roads from two lanes to four lanes; and better road markings and traffic signals.
• Investments in rural traffic safety have been found to result in significant reductions in serious traffic crashes. A 2012 report by the Texas Transportation Institute (TTI) found that improvements completed recently by the Texas Department of Transportation that widened lanes, improved shoulders and made other safety improvements on 1,159 miles of rural state roadways resulted in 133 fewer fatalities on these roads in the first three years after the improvements were completed (as compared to the three years prior). TTI estimates that the improvements on these roads are likely to save 880 lives over the next 20 years.
The efficiency of Washington’s transportation system, particularly its highways, is critical to the health of the state’s economy. Businesses are increasingly reliant on an efficient and reliable transportation system to move products and services. A key component in business efficiency and success is the level and ease of access to customers, markets, materials and workers.
• Annually, $216 billion in goods are shipped from sites in Washington and another $229 billion in goods are shipped to sites in Washington, mostly by truck.
• Fifty-nine percent of the goods shipped annually from sites in Washington are carried by trucks and another 18 percent are carried by courier services or multiple mode deliveries, which include trucking.
• Highway accessibility was ranked the number one site selection factor in a 2011 survey of corporate executives by Area Development Magazine.
• A 2007 analysis by the Federal Highway Administration found that every $1 billion
invested in highway construction would support approximately 27,800 jobs, including approximately 9,500 in the construction sector, approximately 4,300 jobs in industries supporting the construction sector, and approximately 14,000 other jobs induced in non-construction related sectors of the economy.
• The Federal Highway Administration estimates that each dollar spent on road, highway and bridge improvements results in an average benefit of $5.20 in the form of reduced vehicle maintenance costs, reduced delays, reduced fuel consumption, improved safety, reduced road and bridge maintenance costs and reduced emissions as a result of improved traffic flow.
The federal government remains a critical source of funding for Washington’s roads, highways and bridges and provides a significant return to Washington in road and bridge funding based on the revenue generated in the state by the federal motor fuel tax.
• MAP-21(Moving Ahead for Progress in the 21st Century Act), the current federal surface transportation program approved by Congress in July 2012, greatly increased funding flexibility for states and streamlined project approval processes to improve the efficiency of state and local transportation agencies in providing needed transportation improvements in the state.
• MAP-21 does not provide sufficient long-term revenues to support the current level of
federal surface transportation investment. Nationwide federal funding for highways is expected to be cut by almost 100 percent from the current investment level for the fiscal year starting October 1, 2014 (FY 2015) unless Congress provides additional transportation revenues. This is due to a cash shortfall in the Highway Trust Fund as projected by the Congressional Budget Office.
• If the funding shortfalls into the federal Highway Trust Fund are addressed solely by cutting spending it is estimated that federal funding for highway and transit improvements in Washington State will be cut by $848 million for the federal fiscal year starting October 1, 2014, unless Congress provides additional transportation revenues.
• From 2008 to 2012, the federal government provided $1.37 for road improvements in
Washington for every one dollar paid in federal motor fuel fees. Sources of information for this report include the Washington State Department of Transportation (WSDOT), the Federal Highway Administration (FHWA), the Bureau of Transportation Statistics (BTS), the U.S. Census Bureau, the Texas Transportation Institute (TTI) and the National Highway Traffic Safety Administration (NHTSA). All data used in the report is the latest available.
9
Introduction
Washington State’s roads, highways and bridges form vital transportation links for the
state’s residents, visitors and businesses, providing daily access to homes, jobs, shopping, natural
resources and recreation. Today, with the state working to foster quality of life improvements
and economic competitiveness, the modernization of Washington’s transportation system is
crucial, particularly to critical areas of the state’s economy including tourism, agriculture and
manufacturing.
As the U.S. and Washington look to rebound from the recent economic downturn, the
preservation and modernization of the state’s transportation system could play an important role
in enhancing Washington’s economic competitiveness and improving economic well-being by
providing critically needed jobs in the short term and by improving the productivity and
competitiveness of the state’s businesses in the long term. As Washington faces the challenge of
preserving and modernizing its transportation system, the future level of federal, state and local
transportation funding will be a critical factor in whether the Evergreen State’s residents and
visitors continue to enjoy access to a safe and efficient transportation network. Meeting
Washington’s need to modernize and maintain its system of roads, highways and bridges will
require a significant boost in local, state and federal funding.
This report examines the condition, use and safety of Washington’s roads, highways and
bridges, and the future mobility needs of the state. Sources of information for this report include the
Washington State Department of Transportation (WSDOT), the Federal Highway Administration
(FHWA), the Bureau of Transportation Statistics (BTS), the U.S. Census Bureau, the Texas
Transportation Institute (TTI) and the National Highway Traffic Safety Administration (NHTSA). All
data used in the report is the latest available.
10
Population, Travel and Economic Trends in Washington
Washington residents and businesses require a high level of personal and commercial
mobility. Population increases and economic growth in the state have resulted in an increase in
the demand for mobility as well as an increase in vehicle miles of travel (VMT). To foster a high
quality of life and spur economic growth in Washington, it will be critical that the state provide a
safe and modern transportation system that can accommodate future growth in population,
tourism, recreation and vehicle travel.
Washington’s population grew to 6.9 million residents in 2012, a 42 percent increase
since 1990.1 Washington had 5,178,789 licensed drivers in 2011.2 From 1990 to 2012,
Washington’s gross domestic product (GDP), a measure of the state’s economic output,
increased by 85 percent, when adjusted for inflation.3
From 1990 to 2012, annual vehicle miles of travel in Washington increased 27 percent,
from 44.7 billion miles traveled annually to 57 billion miles traveled annually.4 Based on
population and other lifestyle trends, TRIP estimates that travel on Washington’s roads and
highways will increase by another 15 percent by 2030.5
Condition of Washington’s Roads
The life cycle of Washington’s roads is greatly affected by the state's ability to perform
timely maintenance and upgrades to ensure that road and highway surfaces last as long as
possible. The pavement data in this report for all arterial roads and highways is provided by the
11
Federal Highway Administration, based on data submitted annually by the Washington State
Department of Transportation (WSDOT) on the condition of major state and locally maintained
roads and highways.
Throughout the state, 21 percent of major roads and highways have pavement in poor
condition and an additional 23 percent are rated in mediocre condition.6 Seventeen percent of
Washington’s highways and roadways are rated in fair condition and the remaining 38 percent
are rated in good condition.7
Roads rated poor may show signs of deterioration, including rutting, cracks and potholes.
In some cases, poor roads can be resurfaced but often are too deteriorated and must be
reconstructed. The reconstruction of a roadway is significantly more costly than performing
timely resurfacing to keep the roadway in good repair.
Pavement failure is caused by a combination of traffic, moisture and climate. Moisture
often works its way into road surfaces and the materials that form the road’s foundation. Road
surfaces at intersections are even more prone to deterioration because the slow-moving or
standing loads occurring at these sites subject the pavement to higher levels of stress. It is critical
that roads are fixed before they require major repairs because reconstructing roads costs
approximately four times more than resurfacing them.8 As roads and highways continue to age,
they will reach a point of deterioration where routine paving and maintenance will not be
adequate to keep pavement surfaces in good condition and costly reconstruction of the roadway
and its underlying surfaces will become necessary.
Pavement conditions in Washington are projected to deteriorate significantly in the next
five years unless the state can secure additional funding for pavement preservation and
reconstruction. From 2013 to 2018, the share of state-maintained roads and highways with
12
pavements in poor condition is projected to increase from eight percent to 26 percent.9 And the
share of state-maintained roads and highways with pavements in good condition is projected to
decrease from 70 percent to 45 percent.10
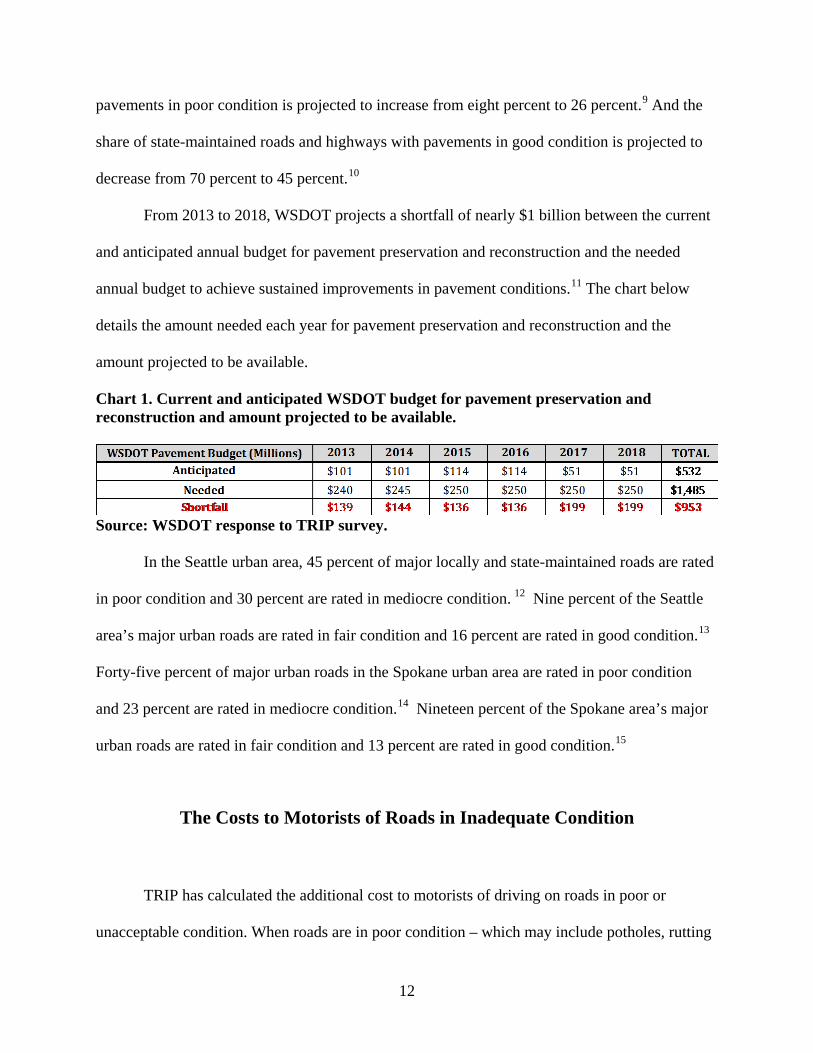
From 2013 to 2018, WSDOT projects a shortfall of nearly $1 billion between the current
and anticipated annual budget for pavement preservation and reconstruction and the needed
annual budget to achieve sustained improvements in pavement conditions.11 The chart below
details the amount needed each year for pavement preservation and reconstruction and the
amount projected to be available.
Chart 1. Current and anticipated WSDOT budget for pavement preservation and reconstruction and amount projected to be available.
Source: WSDOT response to TRIP survey.
In the Seattle urban area, 45 percent of major locally and state-maintained roads are rated
in poor condition and 30 percent are rated in mediocre condition. 12 Nine percent of the Seattle
area’s major urban roads are rated in fair condition and 16 percent are rated in good condition.13
Forty-five percent of major urban roads in the Spokane urban area are rated in poor condition
and 23 percent are rated in mediocre condition.14 Nineteen percent of the Spokane area’s major
urban roads are rated in fair condition and 13 percent are rated in good condition.15
The Costs to Motorists of Roads in Inadequate Condition
TRIP has calculated the additional cost to motorists of driving on roads in poor or
unacceptable condition. When roads are in poor condition – which may include potholes, rutting
13
or rough surfaces – the cost to operate and maintain a vehicle increases. These additional vehicle
operating costs include accelerated vehicle depreciation, additional vehicle repair costs,
increased fuel consumption and increased tire wear. TRIP estimates that additional vehicle
operating costs borne by Washington motorists as a result of driving on rough roads is $2.3
billion annually.16
Driving on rough roads costs the average Seattle motorist $625 annually in extra vehicle
operating costs, while the average driver in the Spokane urban area loses $619 each year as a
result of driving on deteriorated roads.17
Additional vehicle operating costs have been calculated in the Highway Development
and Management Model (HDM), which is recognized by the U.S. Department of Transportation
and more than 100 other countries as the definitive analysis of the impact of road conditions on
vehicle operating costs. The HDM report is based on numerous studies that have measured the
impact of various factors, including road conditions, on vehicle operating costs.18
The HDM study found that road deterioration increases ownership, repair, fuel and tire
costs. The report found that deteriorated roads accelerate the pace of depreciation of vehicles and
the need for repairs because the stress on the vehicle increases in proportion to the level of
roughness of the pavement surface. Similarly, tire wear and fuel consumption increase as roads
deteriorate since there is less efficient transfer of power to the drive train and additional friction
between the road and the tires.
TRIP’s additional vehicle operating cost estimate is based on taking the average number
of miles driven annually by a motorist, calculating current vehicle operating costs based on
AAA’s 2012 vehicle operating costs and then using the HDM model to estimate the additional
vehicle operating costs paid by drivers as a result of substandard roads.19 Additional research on
14
the impact of road conditions on fuel consumption by the Texas Transportation Institute (TTI) is
also factored into TRIP’s vehicle operating cost methodology.
Bridge Conditions in Washington
Washington’s bridges form key links in the state’s highway system, providing
communities and individuals access to employment, schools, shopping and medical facilities,
and facilitating commerce and access for emergency vehicles.
More than a quarter of Washington’s local and state-maintained bridges were rated as
structurally deficient or functionally obsolete in 2012.20
Five percent of Washington’s bridges are rated as structurally deficient.21 A bridge is
structurally deficient if there is significant deterioration of the bridge deck, supports or other
major components. Bridges that are structurally deficient may be posted for lower weight limits
or closed if their condition warrants such action. Deteriorated bridges can have a significant
impact on daily life. Restrictions on vehicle weight may cause many vehicles – especially
emergency vehicles, commercial trucks, school buses and farm equipment – to use alternate
routes to avoid posted bridges. Redirected trips also lengthen travel time, waste fuel and reduce
the efficiency of the local economy.
Twenty-two percent of Washington’s bridges are rated functionally obsolete.22 Bridges
that are functionally obsolete no longer meet current highway design standards, often because of
narrow lanes, inadequate clearances or poor alignment with the approaching roadway.
Four percent of Washington’s bridges are fracture critical.23 A fracture-critical bridge is
one that does not contain redundant supporting elements. This means that if those key supports
15
fail, the bridge would be in danger of collapse. This does not mean the bridge is inherently
unsafe, only that there is a lack of redundancy in its design.
The service life of bridges can be extended by performing routine maintenance such as
resurfacing decks, painting surfaces, insuring that a facility has good drainage and replacing
deteriorating components. But most bridges will eventually require more costly reconstruction
or major rehabilitation to remain operable.
According to WSDOT, under current funding projections, the number of state-maintained
bridges that are structurally deficient will increase from 138 in 2013 to 158 in 2018 unless
additional funding can be provided.24
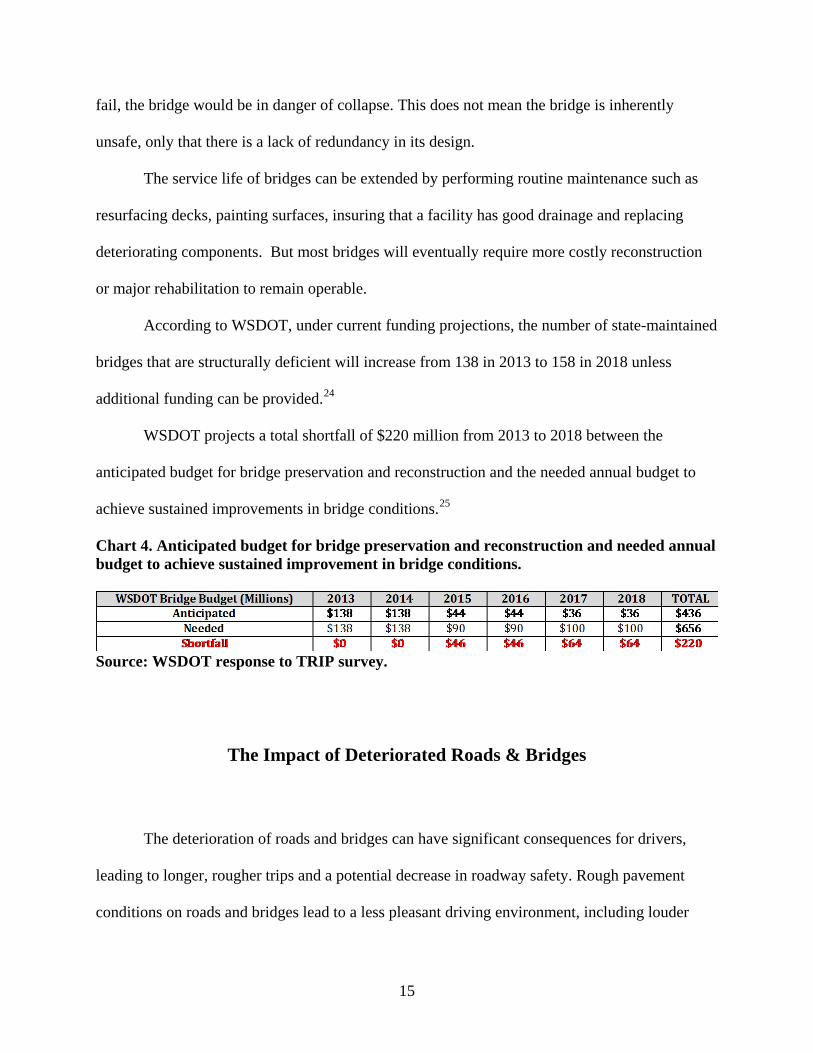
WSDOT projects a total shortfall of $220 million from 2013 to 2018 between the
anticipated budget for bridge preservation and reconstruction and the needed annual budget to
achieve sustained improvements in bridge conditions.25
Chart 4. Anticipated budget for bridge preservation and reconstruction and needed annual budget to achieve sustained improvement in bridge conditions.
Source: WSDOT response to TRIP survey.
The Impact of Deteriorated Roads & Bridges
The deterioration of roads and bridges can have significant consequences for drivers,
leading to longer, rougher trips and a potential decrease in roadway safety. Rough pavement
conditions on roads and bridges lead to a less pleasant driving environment, including louder
16
road noise and an increased number of potholes, which may lead to tire and vehicle damage.
Roadway speeds may also be temporarily reduced as a result of rough road conditions, leading to
increasingly congested and inefficient roadways.
Bridges in need of repair may be closed or restricted to vehicles with lower weights,
resulting in detours and increased travel times, especially in more rural areas where the nearest
alternate crossing may be a significant distance away.
Traffic Congestion in Washington
Commuting and commerce in Washington are constrained by growing traffic congestion,
which will increase in the future unless additional highway and transit capacity is provided.
Vehicle travel in Washington has increased dramatically in recent years, without a corresponding
increase in roadway lane miles or transit capacity. As a result, the state’s roads have become
increasingly congested, choking commuting and commerce.
According to the Texas Transportation Institute (TTI), the average driver in the Seattle
urban area loses $1,050 each year in the cost of lost time and wasted fuel as a result of traffic
congestion. 26 The average commuter in the Seattle urban area wastes 48 hours each year stuck in
traffic. 27 In the Spokane urban area, the average driver loses $518 annually in the cost of lost
time and wasted fuel due to congestion, while wasting 23 hours each year in congestion. 28
The total cost of traffic congestion annually in Washington is $2.7 billion in lost time and
may see businesses relocate to areas with a smoother, more efficient and more modern
transportation system.
Conclusion
As Washington looks to build and enhance a thriving, growing and dynamic state, it will
be critical that it is able to provide a 21st century network of roads, highways and bridges that can
accommodate the mobility demands of a modern society. And to fully rebound from the recent
economic downturn, the U.S. will need to modernize its surface transportation system by
improving the physical condition of its transportation network and enhancing the system’s ability
to provide efficient and reliable mobility for motorists and businesses. Making needed
improvements to Washington’s roads, highways and bridges could provide a significant boost to
the state’s economy by creating jobs in the short term and stimulating long-term economic
growth as a result of enhanced mobility and access.
Without a substantial boost in federal, state and local highway funding, numerous
projects to improve the condition and expand the capacity of Washington’s roads, highways and
bridges will not be able to proceed, hampering the state’s ability to improve the condition of its
transportation system and to enhance economic development opportunities in the state.
# # #
23
Endnotes
1 U.S. Census Bureau (2012). 2 Highway Statistics (2011). Federal Highway Administration. DL-1C 3 TRIP analysis of Bureau of Economic Analysis data. 4 U.S. Department of Transportation - Federal Highway Administration: Highway Statistics 1990 and 2012. 5 TRIP calculation based on U.S. Census and Federal Highway Administration data. 6 Federal Highway Administration (2013). Pavement condition data is for 2011. 7 Ibid. 8 Selecting a Preventative Maintenance Treatment for Flexible Pavements. R. Hicks, J. Moulthrop. Transportation Research Board. 1999. Figure 1. 9 WSDOT response to TRIP survey, 2013. 10 Ibid. 11 Ibid. 12Federal Highway Administration (2013). Pavement condition data is for 2011. 13 Ibid. 14 Ibid. 15 Ibid. 16 TRIP estimate. 17 Ibid. 18 Highway Development and Management: Volume Seven. Modeling Road User and Environmental Effects in HDM-4. Bennett, C. and Greenwood, I. 2000. 19 Your Driving Costs. American Automobile Association. 2012. 20 Federal Highway Administration (2012). National Bridge Inventory. 21 Ibid. 22 Ibid. 23 Ibid. 24 WSDOT response to TRIP survey (2013). 25 Ibid. 26 Texas Transportation Institute. 2012 Urban Mobility Report. 27 Ibid. 28 Ibid. 29 TRIP estimate based on analysis of FHWA and TTI data. 30 TRIP analysis of National Highway Traffic Safety Administration data (2012). 31 TRIP analysis of National Highway Traffic Safety Administration and Federal Highway Administration data (2012). 32 Ibid. 33 Ibid. 34 TRIP estimates based on National Highway Traffic Safety Administration (NHTSA) data. 35 Ibid. 36 Adding Highway Shoulders, Width, Reduce Crash Numbers and Save Lives (August 9, 2012). Texas Transportation Institute. 37 U.S. Senate Committee on Environment and Public Works (2013). http://www.epw.senate.gov/public/index.cfm?FuseAction=Files.View&FileStore_id=cf1dfe4e-8e60-4506-a9e0-205fe809f314 38 TRIP analysis of Federal Highway Administration data. 2007 to 2011 Highway Statistics sf-1. 39 Federal Highway Administration, 2008. Employment Impacts of Highway Infrastructure Investment. 40 Bureau of Transportation Statistics (2010), U.S. Department of Transportation. 2007 Commodity Flow Survey, State Summaries. http://www.bts.gov/publications/commodity_flow_survey/2007/states/ 41 Ibid.
42 FHWA estimate based on its analysis of 2006 data. For more information on FHWA’s cost-benefit analysis of highway investment, see the 2008 Status of the Nation's Highways, Bridges, and Transit: Conditions and Performance. 43 Area Development Magazine (Winter, 2012). 26th Annual Survey of Corporate Executive Results.


![[Shinobi] Bleach 466](https://static.documents.pub/doc/80x56/568c4a721a28ab4916982d2e/shinobi-bleach-466.jpg)


