Poster P.3.2 - 1 - Notice: This manuscript has been authored by UT-Battelle, LLC, under Contract No. DE-AC05-00OR22725 with the U.S. Department of Energy. The United States Government retains and the publisher, by accepting the article for publication, acknowledges that the United States Government retains a non-exclusive, paid-up, irrevocable, world-wide license to publish or reproduce the published form of this manuscript, or allow others to do so, for United States Government purposes. 11 th IEA Heat Pump Conference 2014, May 12-16 2014, Montréal (Québec) Canada Waste Heat Recovery Analysis of CO 2 Refrigeration Systems Vishaldeep Sharma, Brian Fricke and Pradeep Bansal Oak Ridge National Laboratory, Oak Ridge, Tennessee, USA Abstract: This paper presents a comparative analysis of various CO 2 transcritical supermarket refrigeration systems for a range of operating conditions. The performance of the CO 2 -based refrigeration systems is compared with the baseline R-404A multiplex direct expansion system using bin analyses in sixteen cities from eight climate zones of the United States. Finally, the potential for utilization of waste heat from transcritical CO 2 refrigeration systems, for application in desiccant regeneration, water heating and space heating, has been analyzed. The analysis has revealed that the Transcritical Booster System with Bypass Compressor (TBS-BC) had the lowest energy consumption for ambient temperatures (T amb ) less than 8°C. Also, the TBS-BC performs equivalent to or better than the R-404A direct expansion system in the northern two-thirds of the US. For the southern portion of the US, the R-404A multiplex DX system outperformed the transcritical CO 2 systems. It was found that heat recovery from transcritical CO 2 systems could nearly satisfy the desiccant regeneration and water heating needs of a supermarket for all climate zones in the US, while partially meeting the space heating requirements. Key Words: supermarket refrigeration, transcritical CO 2 refrigeration, waste heat 1 INTRODUCTION In an effort to reduce the greenhouse gas emissions of supermarket refrigeration systems, carbon dioxide (CO 2 ) has recently received considerable attention as an alternative to the high Global Warming Potential (GWP) synthetic refrigerants commonly used in supermarket systems (Bansal, 2012; Getu and Bansal, 2008). The benefits of carbon dioxide include no Ozone Depletion Potential (ODP), and a GWP value of one, as well as being nontoxic, nonflammable and inexpensive. Although CO 2 has a high critical pressure (7.38 MPa) and a low critical temperature (31.0°C), its high operating pressure leads to a high vapor density, and thus a high volumetric refrigerating capacity. For example, the volumetric refrigerating capacity of CO 2 (22,545 kJ·m -3 at 0°C) is three to ten times larger than that of many CFC, HCFC, HFC and HC refrigerants (Kim et al., 2004). Carbon dioxide has successfully been used as a refrigerant in the low-temperature circuit of cascade systems, in secondary loop systems, and in transcritical systems (Bansal, 2012; Hinde and Zha, 2009; Girotto et al., 2004). However, transcritical CO 2 systems tend to be more popular in moderate climates such as Northern Europe where the refrigeration system operates a majority of the time in the more efficient subcritical mode (Sawalha and Palm, 2003). In an effort to increase the efficiency of the transcritical CO 2 refrigeration system and to make it applicable to warmer climates, several researchers have investigated the energy efficiency of various configurations of the system (Ge and Tassou, 2010; Sarkar and Agrawal, 2010). These studies focused only on a particular system and did not compare the system
Transcript
Poster P.3.2 - 1 -
Notice: This manuscript has been authored by UT-Battelle, LLC, under Contract No. DE-AC05-00OR22725 with the U.S. Department of Energy. The United States Government retains and the publisher, by accepting the article for publication, acknowledges that the United States Government retains a non-exclusive, paid-up, irrevocable, world-wide license to publish or reproduce the published form of this manuscript, or allow others to do so, for United States Government purposes.
Waste Heat Recovery Analysis of CO2 Refrigeration Systems
Vishaldeep Sharma, Brian Fricke and Pradeep Bansal Oak Ridge National Laboratory, Oak Ridge, Tennessee, USA
Abstract: This paper presents a comparative analysis of various CO2 transcritical supermarket refrigeration systems for a range of operating conditions. The performance of the CO2-based refrigeration systems is compared with the baseline R-404A multiplex direct expansion system using bin analyses in sixteen cities from eight climate zones of the United States. Finally, the potential for utilization of waste heat from transcritical CO2 refrigeration systems, for application in desiccant regeneration, water heating and space heating, has been analyzed. The analysis has revealed that the Transcritical Booster System with Bypass Compressor (TBS-BC) had the lowest energy consumption for ambient temperatures (Tamb) less than 8°C. Also, the TBS-BC performs equivalent to or better than the R-404A direct expansion system in the northern two-thirds of the US. For the southern portion of the US, the R-404A multiplex DX system outperformed the transcritical CO2 systems. It was found that heat recovery from transcritical CO2 systems could nearly satisfy the desiccant regeneration and water heating needs of a supermarket for all climate zones in the US, while partially meeting the space heating requirements.
Key Words: supermarket refrigeration, transcritical CO2 refrigeration, waste heat 1 INTRODUCTION In an effort to reduce the greenhouse gas emissions of supermarket refrigeration systems, carbon dioxide (CO2) has recently received considerable attention as an alternative to the high Global Warming Potential (GWP) synthetic refrigerants commonly used in supermarket systems (Bansal, 2012; Getu and Bansal, 2008). The benefits of carbon dioxide include no Ozone Depletion Potential (ODP), and a GWP value of one, as well as being nontoxic, nonflammable and inexpensive. Although CO2 has a high critical pressure (7.38 MPa) and a low critical temperature (31.0°C), its high operating pressure leads to a high vapor density, and thus a high volumetric refrigerating capacity. For example, the volumetric refrigerating capacity of CO2 (22,545 kJ·m−3 at 0°C) is three to ten times larger than that of many CFC, HCFC, HFC and HC refrigerants (Kim et al., 2004). Carbon dioxide has successfully been used as a refrigerant in the low-temperature circuit of cascade systems, in secondary loop systems, and in transcritical systems (Bansal, 2012; Hinde and Zha, 2009; Girotto et al., 2004). However, transcritical CO2 systems tend to be more popular in moderate climates such as Northern Europe where the refrigeration system operates a majority of the time in the more efficient subcritical mode (Sawalha and Palm, 2003). In an effort to increase the efficiency of the transcritical CO2 refrigeration system and to make it applicable to warmer climates, several researchers have investigated the energy efficiency of various configurations of the system (Ge and Tassou, 2010; Sarkar and Agrawal, 2010). These studies focused only on a particular system and did not compare the system
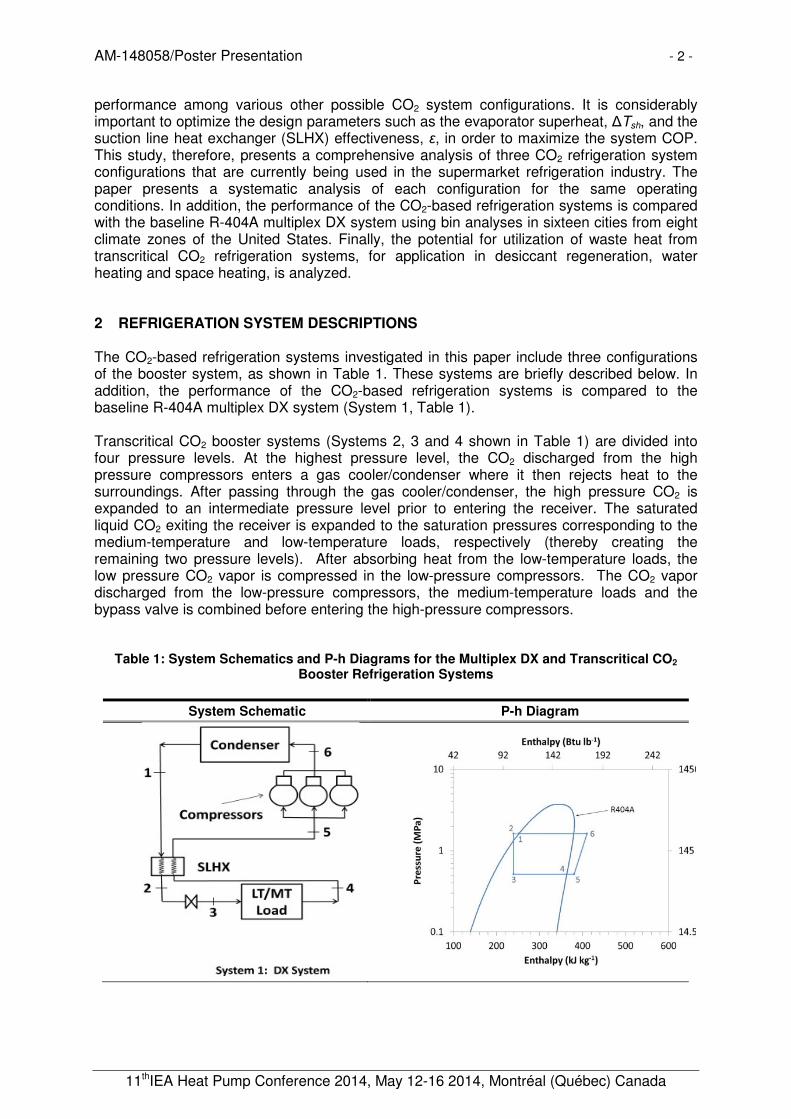
performance among various other possible CO2 system configurations. It is considerably important to optimize the design parameters such as the evaporator superheat, ∆Tsh, and the suction line heat exchanger (SLHX) effectiveness, ε, in order to maximize the system COP. This study, therefore, presents a comprehensive analysis of three CO2 refrigeration system configurations that are currently being used in the supermarket refrigeration industry. The paper presents a systematic analysis of each configuration for the same operating conditions. In addition, the performance of the CO2-based refrigeration systems is compared with the baseline R-404A multiplex DX system using bin analyses in sixteen cities from eight climate zones of the United States. Finally, the potential for utilization of waste heat from transcritical CO2 refrigeration systems, for application in desiccant regeneration, water heating and space heating, is analyzed. 2 REFRIGERATION SYSTEM DESCRIPTIONS The CO2-based refrigeration systems investigated in this paper include three configurations of the booster system, as shown in Table 1. These systems are briefly described below. In addition, the performance of the CO2-based refrigeration systems is compared to the baseline R-404A multiplex DX system (System 1, Table 1). Transcritical CO2 booster systems (Systems 2, 3 and 4 shown in Table 1) are divided into four pressure levels. At the highest pressure level, the CO2 discharged from the high pressure compressors enters a gas cooler/condenser where it then rejects heat to the surroundings. After passing through the gas cooler/condenser, the high pressure CO2 is expanded to an intermediate pressure level prior to entering the receiver. The saturated liquid CO2 exiting the receiver is expanded to the saturation pressures corresponding to the medium-temperature and low-temperature loads, respectively (thereby creating the remaining two pressure levels). After absorbing heat from the low-temperature loads, the low pressure CO2 vapor is compressed in the low-pressure compressors. The CO2 vapor discharged from the low-pressure compressors, the medium-temperature loads and the bypass valve is combined before entering the high-pressure compressors.
Table 1: System Schematics and P-h Diagrams for the Multiplex DX and Transcritical CO2 Booster Refrigeration Systems
2.1 Standard Transcritical Booster System (TBS-S) In the TBS-S system (System 2, Table 1), the high pressure refrigerant from the outlet of the gas cooler/condenser passes through a suction line heat exchanger (SLHX1) before expanding to an intermediate pressure level through the expansion device between locations 2 and 3. On the P-h diagram, state points 1, 2 and 17 are at the high pressure level, state points 3, 4, 6 and 9 are at the intermediate pressure level, state points 5, 7, 8, 13, 14, 15 and 16 are at the medium-temperature pressure level and state points 10, 11 and 12 are at the low-temperature pressure level. 2.2 Transcritical Booster System with Upstream Expansion Valve (TBS-UX) The TBS-UX system (System 3, Table 1) differs from the TBS-S in that the high pressure refrigerant from the gas cooler is expanded between 1 and 2, prior to passing through SLHX1 and being stored in the receiver. On the P-h diagram, state points 1 and 17 are at the high pressure level, state points 2, 3, 4, 6 and 9 are at the intermediate pressure level,
state points 5, 7, 8, 13, 14, 15 and 16 are at the medium pressure level and state points 10, 11 and 12 are at the low pressure level. 2.3 Transcritical Booster System with Bypass Compressor (TBS-BC) The TBS-BC system (System 4, Table 1) is similar to the TBS-S, however, the refrigerant exiting the receiver bypass at location 4 is compressed by an additional set of compressors (bypass compressors), which then combines with the discharge of the high-pressure compressors at location 18, before entering the gas cooler/condenser. On the P-h diagram, state points 1, 2, 5, 17 and 18 are at the high pressure level, state points 3, 4, 6 and 9 are at the intermediate pressure level, state points 7, 8, 13, 14, 15, 16 are at the medium pressure level and state points 10, 11 and 12 are at the low pressure level. 3 SYSTEM ANALYSIS AND PARAMETERS The overall Coefficient of Performance, COP, of a refrigeration system is determined by:
��� �����
� �� �� (1)
where ����� is the total refrigeration capacity of the system and ������� is the total power
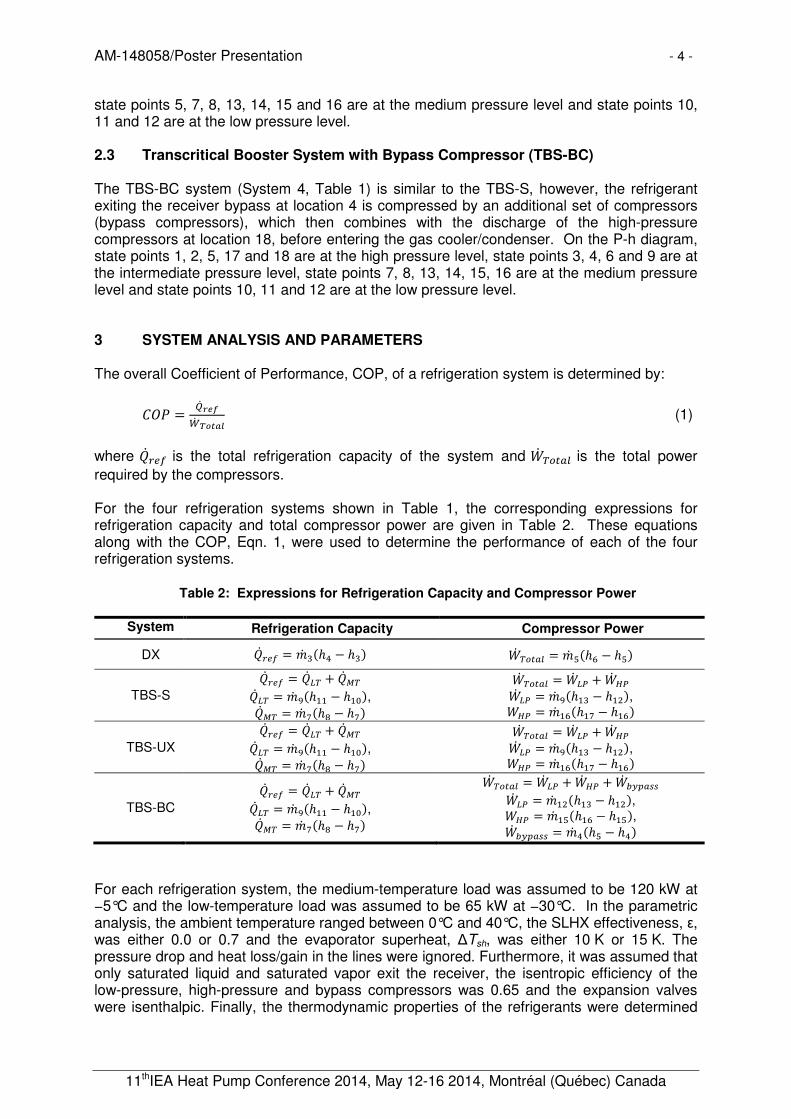
required by the compressors. For the four refrigeration systems shown in Table 1, the corresponding expressions for refrigeration capacity and total compressor power are given in Table 2. These equations along with the COP, Eqn. 1, were used to determine the performance of each of the four refrigeration systems.
Table 2: Expressions for Refrigeration Capacity and Compressor Power
System Refrigeration Capacity Compressor Power
DX ����� � �� ���� � �� ������� � �� !��" � �!
TBS-S
����� � ��#� $ ��%�
��#� � �� &��'' � �'( ,
��%� � �� )��* � �)
������� � ��
#+ $ ��,+
��#+ � �� &��'� � �'- ,
�,+ � �� '"��') � �'"
TBS-UX
����� � ��#� $ ��%�
��#� � �� &��'' � �'( ,
��%� � �� )��* � �)
������� � ��
#+ $ ��,+
��#+ � �� &��'� � �'- ,
�,+ � �� '"��') � �'"
TBS-BC
����� � ��#� $ ��%�
��#� � �� &��'' � �'( ,
��%� � �� )��* � �)
������� � ��
#+ $ ��,+ $ ��
./0�11
��#+ � �� '-��'� � �'- ,
�,+ � �� '!��'" � �'! ,
��./0�11 � �� ���! � ��
For each refrigeration system, the medium-temperature load was assumed to be 120 kW at −5°C and the low-temperature load was assumed to be 65 kW at −30°C. In the parametric analysis, the ambient temperature ranged between 0°C and 40°C, the SLHX effectiveness, ε, was either 0.0 or 0.7 and the evaporator superheat, ∆Tsh, was either 10 K or 15 K. The pressure drop and heat loss/gain in the lines were ignored. Furthermore, it was assumed that only saturated liquid and saturated vapor exit the receiver, the isentropic efficiency of the low-pressure, high-pressure and bypass compressors was 0.65 and the expansion valves were isenthalpic. Finally, the thermodynamic properties of the refrigerants were determined
using the National Institute of Standards and Technology (NIST) Reference Fluid Thermodynamic and Transport Properties Database (REFPROP) Version 8.0 (Lemmon et al., 2007). 4 SYSTEM PERFORMANCE As mentioned previously, three CO2-based refrigeration system configurations were considered; the TBS-S (System 2), the TBS-UX (System 3) and the TBS-BC (System 4). The effects of ambient temperature, evaporator superheat and SLHX effectiveness on the performance of each of the three configurations were investigated. In addition, the performance of the three CO2-based refrigeration systems was compared to the baseline R-404A multiplex DX system (System 1). 4.1 Transcritical Booster Systems For the Standard Transcritical Booster System (TBS-S), Figure 1 shows the system COP, the work ratios (LP WR, HP WR) and the mass flow ratios (LT MR, HT MR, BP MR) vs. ambient temperature at constant SLHX effectiveness (εSLHX = 0.4). The work ratio of a circuit (low-temperature or medium-temperature) is the ratio of the circuit compressor power to the total compressor power. Similarly, the mass flow ratio of a circuit (low-temperature, medium-temperature, or bypass) is the ratio of the circuit flow rate to the total system mass flow rate. These two ratios are determined as follows:
�234�354� �� 67�687
� 9:;� <:;� =>?�@@ (2)
A234�354� �B� 67�687
B� 9�;B� C�;B� =>?�@@ (3)
(a)
(b)
Figure 1: Performance of the TBS-S (System 2) with εSLHX = 0.4 and ∆Tsh = 10 K. (a) System COP
and Work Ratios, (b) Mass Flow Ratios
As shown in Figure 1(b), for a given SLHX effectiveness and superheat, an increase in ambient temperature leads to an increase in the bypass mass flow rate and the bypass mass flow ratio (BP MR). The effect of this can be seen in Figure 1(a) where the work required by the high-pressure compressor increases and consequently, the system COP decreases.
An increase in evaporator superheat results in a decrease in the total refrigerant mass flow rate. In general, increasing the evaporator superheat leads to an increase in the refrigerant enthalpy throughout the system between the low-pressure compressor and the gas cooler inlet. However, the increase in enthalpy associated with superheat is nearly counterbalanced by the decrease in the total refrigerant flow rate. As a result, the rate of change of COP with an increase in superheat is insignificant (<0.5%). Similarly, in the Transcritical Booster System with Upstream expansion Valve (TBS-UX) and the Transcritical Booster System with Bypass Compressor (TBS-BC), the evaporator superheat has an insignificant impact on the system COP. Figure 2a shows the mass flow ratio (LT MR,HT MR,BP MR) vs. ambient temperature for a given evaporator superheat of 18°F (10 K) for the TBS-S (System 2). With an increase in the effectiveness of SLHX1 and SLHX2, the quality of refrigerant at the inlet of both the receiver and the low-temperature evaporator decreases, thereby decreasing the bypass mass flow ratio (BP MR) and the low-temperature mass flow ratio (LT MR). Since the bypass mass flow rate increases with an ambient temperature but decreases with SLHX effectiveness, above 59°F (15°C) the first effect is more pronounced than the latter, leading to an increase in LT MR.
(a)
(b)
Figure 2: (a) Mass Flow Ratio vs. Ambient Temperature with ∆Tsh = 10 K for the TBS-S (System
2). (b) System COP vs. Ambient Temperature with εSLHX = 0.4 and ∆Tsh = 10 K for Systems 1 through 4
In addition, for the TBS-S (System 2), an increase in the SLHX effectiveness increases the enthalpy of the refrigerant at the inlet of the low and high-pressure compressors. In subcritical operation, the rate of increase in the enthalpy difference across the compressors and the rate of decrease in the mass flow through the low-temperature evaporator and the bypass, lead to a change in the work input to the compressors. This results in a decrease in the system COP during subcritical operation but an increase during transcritical operation. For example, as the SLHX effectiveness increases from 0 to 0.7, the system COP decreases by 1.4% at an ambient temperature of 50°F (10°C), and increases by 1.9% at an ambient temperature of 95°F (35°C). Similarly, in the TBS-UX (System 3) and the TBS-BC (System 4), the system COP decreases by 1.2% and 1.3% respectively, at an ambient temperature of 50°F (10°C) whereas the system COP increases by 0.2% and 1.9% respectively, at an ambient temperature of 95°F (35°C).
4.2 Comparison of CO2-based Refrigeration Systems with the Baseline System Based on the results of the parametric study presented above, the optimal CO2-based refrigeration system was identified as the TBS-BC (System 4). Figure 2b shows the system COP vs. ambient temperature for the three transcritical booster systems and the baseline R-404A multiplex DX system for a constant SLHX effectiveness (εSLHX = 0.4) and evaporator superheat (∆Tsh = 10 K). At ambient temperature less than 8°C, the COP of the TBS-BC (System 4) is higher than the COP of the R-404A multiplex DX system (System 1), but at higher temperatures, the COP of the R-404A multiplex DX system is higher than of the TBS-BC. For example, at an ambient temperature of 5°C, the system COP of TBS-BC is 12% higher than that of R-404A multiplex DX system, whereas, at an ambient temperature of 35°C, the system COP of the R-404A multiplex DX system is 7% higher than TBS-BC. The TBS-S and TBS-UX behave similar to TBS-BC, however, over the temperature range of 0°C to 40°C, the average COP of the TBS-BC is 10% greater than that of the TBS-S. Also, the average COP of the R-404A multiplex DX system and the TBS-BC are nearly the equal. 4.3 Performance in Climate Zones Based on the analysis discussed above, the TBS-BC system (System 4) exhibited the greatest energy efficiency of the three CO2-based refrigeration systems investigated. Thus, the TBS-BC system was further compared with the baseline R-404A multiplex DX system (System 1) to determine their average annual performance in various climate zones of the United States. Bin analyses were performed to determine the annual average COP of the TBS-BC (System 4) and the R-404A multiplex DX system (System 1) in sixteen cities selected from the eight climate zones of the United States (International Code Council 2006). The hourly weather data from these sixteen cities were divided into temperature bins having a width of 3°C. The
average energy consumption and average COP of the two refrigeration systems was determined for each of the temperature bins assuming a medium-temperature load of 120 kW at −5°C and a low-temperature load of 65 kW at −30°C. Finally, the average annual COP of the two refrigeration systems was determined for the sixteen cities. Table 2 shows the 16 cities selected for the bin analyses, along with their annual average temperature. Also shown in Table 3 is the annual average COP of the two refrigeration systems (Systems 1 and 4) for each of the 16 cities. Furthermore, Figure 3 shows which of the two refrigeration systems performs most efficiently for each climate zone in the US. It can be seen that for the northern half of the US (Zones 5, 6, 7 and 8), the TBS-BC is the most efficient. Both the TBS-BC and the R-404A multiplex DX system perform similarly in a narrow band through the center of the country (Zones 4A and 4B). For the southern portion of the US (Zones 1, 2, 3 and 4C), the R-404A multiplex DX system is the best option. 5 WASTE HEAT UTILIZATION When a CO2 refrigeration system operates at subcritical pressure, the heat rejection from the system occurs at a constant temperature (after desuperheating the compressor discharge gas). However, at supercritical pressure, the heat rejection from a CO2 refrigeration system occurs over a range of temperature, rather than at a constant temperature. Thus, the average heat rejection temperature is higher for supercritical operation than for subcritical operation, making supercritical operation more suited to heat recovery applications.
Table 3: Results of Refrigeration System Bin Analysis
Climate Zone
City
Annual Average
Temperature (°C)
Annual Average
COP, R-404A DX
Annual Average
COP, TBS-BC
COP TBS-BC vs. COP R-404A
DX
1 Miami, FL 24.9 2.47 2.23 -9.72
2A Houston, TX 20.7 2.78 2.55 -8.27
2B Phoenix, AZ 23.8 2.57 2.32 -9.73
3A Atlanta, GA 17.0 3.04 2.87 -5.59
3B Los Angeles, CA 17.3 3.04 2.64 -13.16
3B Las Vegas, NV 20.2 2.86 2.65 -7.34
3C San Francisco, CA 14.4 3.34 2.97 -11.08
4A Baltimore, MD 13.3 3.24 3.23 -0.31
4B Albuquerque, NM 14.2 3.24 3.20 -1.23
4C Seattle, WA 11.4 3.51 3.33 -5.13
5A Chicago, IL 10.0 3.38 3.52 4.14
5B Boulder, CO 10.3 3.41 3.50 2.64
6A Minneapolis, MN 8.0 3.44 3.69 7.27
6B Helena, MT 7.2 3.56 3.79 6.46
7 Duluth, MN 4.3 3.62 3.95 9.12
8 Fairbanks, AK −2.1 3.71 4.18 12.67
Figure 3: Regional Applicability of TBS-BC and R-404A DX Refrigeration Systems
5.1 Waste Heat Utilization Modeling To investigate the heat recovery potential from CO2 refrigeration systems, an analysis was performed in which the heat rejected from the system is used for desiccant regeneration, water heating and space heating. In this study, the whole building energy simulation
program, EnergyPlus, was used to determine the hourly space heating, water heating and desiccant regeneration heating needs of a supermarket for a period of one year in 16 cities in the United States, representing eight climate zones. The energy which could be recovered from a transcritical CO2 refrigeration system was then compared with the heating needs of the supermarket to determine the potential that heat recovery could be used to offset the heating requirements of a supermarket. The EnergyPlus supermarket model used in this study was based on the new construction reference supermarket model developed by the U.S. Department of Energy (Deru et al. 2011). This single-story supermarket model has a floor area of 4,181 m2 with a floor-to-ceiling height of 6.1 m, and is divided into six zones (office, dry storage, deli, sales, produce and bakery). Exterior wall construction consists of stucco, concrete block, insulation and gypsum while roof construction consists of roofing membrane, insulation and metal decking. Internal loads include people and lighting, as well as miscellaneous gas and electric loads in the deli and bakery zones. HVAC is provided by packaged constant volume units with gas heat and electric cooling. In addition, humidification and desiccant dehumidification is used to maintain the relative humidity within the supermarket between 30% and 55%. Figure 4 shows a schematic of the hypothetical three-stage heat recovery scheme investigated in this study. Waste heat from the refrigeration system is first used to heat regeneration air for the desiccant dehumidifier. The source of the regeneration air is the ambient, and this air is heated to a maximum temperature of 80°C. Next, the waste heat is
used to heat water for process applications. It was assumed that water entered the supermarket at 10°C and was heated to a maximum of 60°C. Finally, the remaining waste heat is used for space heating, where it was assumed that the supply air, consisting of return air and ambient air, would be heated from 18°C to a maximum of 40°C.
Figure 4: Waste Heat Utilization Scheme for Transcritical CO2 Refrigeration Systems
5.2 Waste Heat Utilization Modeling Results The results of the waste heat utilization analysis are summarized in Table 4. For each city and use category (i.e., desiccant regeneration, water heating, or space heating), the energy required for the use category as a percentage of the total heating requirement is listed along with the percentage of the use category’s energy needs met by waste heat recovery. In general, the ability of waste heat recovery to satisfy supermarket heating requirements decreases from the warmer climate zones to the colder climate zones. Lower grade waste heat is generated by the refrigeration systems in colder climates due to their lower average condensing temperatures. For all climate zones, it can be seen that 95% or more of the energy required for desiccant regeneration can be obtained through waste heat recovery. The heat required for desiccant
regeneration is only a small fraction of the total heating requirement for the supermarket, where desiccant regeneration represents less than 1% of the total heating requirement for 10 of the 16 cities. For Climate Zones 1 through 4, over 95% of the water heating needs of the supermarket can be met through waste heat recovery. For the colder climate zones (Zones 5 through 8), waste heat recovery can contribute, on average, to 90% of the required water heating. Furthermore, the energy analysis indicates that water heating accounts for approximately 9% of the total heating requirement of a supermarket. Finally, it can be noted that the waste heat recovery can contribute between 20% to 60% of the required space heating. The warmer climate zones tend to benefit from having more of the space heating load met by waste heat recovery compared with the colder climate zones. Also, space heating accounts for approximately 89% of the total heating requirement of a supermarket.
Table 4: Results of Waste Heat Utilization Analysis
Climate Zone, City
Desiccant Regeneration (DR)
Water Heating (WH) Space Heating (SH)
% of Total Heat
Required for DR
% of DR Load Met by Waste
Heat Recovery
% of Total Heat
Required for WH
% of WH Load Met by Waste
Heat Recovery
% of Total Heat
Required for SH
% of SH Load Met by Waste
Heat Recovery
1, Miami 0.89 100.0 9.5 97.7 89.6 59.8
2A, Houston 8.0 94.6 8.7 97.9 83.3 51.9
2B, Phoenix 0.47 99.7 9.6 99.7 89.9 59.9
3A, Atlanta 4.0 96.6 9.0 96.9 87.0 43.9
3B, Los Angeles 2.4 97.8 9.5 99.5 88.1 44.4
3B, Las Vegas <0.10 100.0 9.5 98.7 90.5 48.4
3C, San Francisco <0.10 96.0 9.6 99.5 90.3 35.3
4A, Baltimore 2.6 96.1 9.0 94.5 88.4 36.6
4B, Albuquerque <0.10 99.1 9.2 95.9 90.8 36.0
4C, Seattle <0.10 96.9 9.3 96.1 90.6 29.0
5A, Chicago 7.8 98.5 8.3 91.8 83.9 31.8
5B, Boulder <0.10 99.5 9.0 93.6 91.0 30.0
6A, Minneapolis 1.3 98.0 8.8 90.3 89.9 29.1
6B, Helena 0.0 8.9 90.7 91.2 24.5
7, Duluth 0.80 97.3 8.7 88.6 90.5 22.9
8, Fairbanks <0.10 98.2 8.6 86.6 91.4 18.8
6 CONCLUSIONS A comparative analysis of three transcritical CO2 booster refrigeration systems with a baseline R-404A multiplex DX refrigeration system revealed that the system COP of the transcritical CO2 booster systems (TBS-S, TBS-UX and TBS-BC) decreases with an increase in ambient temperature and the SLHX effectiveness; and the evaporator superheat has negligible impact on system performance. Furthermore, the TBS-BC is the most efficient transcritical booster system among the three booster systems investigated. For the four refrigeration systems investigated, the TBS-BC system offers the highest COP for Tamb < 8°C. For 22°C < Tamb < 33°C, the TBS-BC system and the baseline R-404A multiplex DX system exhibited comparable system COP.
For the two-thirds of the northern US, the TBS-BC performed as well or better than the R-404A multiplex DX system. Implementation of transcritical booster systems using optimized operating conditions will lead to reduced direct greenhouse gas emissions while achieving comparable energy consumption as compared to current HFC-based multiplex DX systems. Finally, the heat recovery potential from transcritical CO2 refrigeration systems was analyzed, in which the heat rejected from the system was used for desiccant regeneration, water heating and space heating. It was found that heat recovery could nearly satisfy the desiccant regeneration and water heating needs of a supermarket for all climate zones in the US. Furthermore, after satisfying the desiccant regeneration and water heating requirements, heat recovery could meet 20% to 60% of the space heating needs of a supermarket, depending upon the climate zone. 7 REFERENCES Bansal, P. 2012. “Status of CO2 as a mainstream low temperature refrigerant: Fundamentals and R&D opportunities,” Applied Thermal Engineering, Vol. 41, pp. 18-29. Deru, M., K. Field, D. Studer, K. Benne, B. Griffith, P. Torcellini, B. Liu, M. Halverson, D. Winiarski, M. Rosenberg, M. Yazdanian, J. Huang, and D. Crawley. 2011. U.S. Department of Energy Commercial Reference Building Models of the National Building Stock, National Renewable Energy Laboratory, Golden, CO. Ge, Y., and S. Tassou. 2010. “Performance evaluation and control optimization of a CO2 booster refrigeration system in supermarket,” 1st IIR International Conference on Sustainability and the Cold Chain, Cambridge, UK, 29-31 March 2010. Getu, H., and P. Bansal. 2008. “Thermodynamic analysis of an R744-R717 cascade refrigeration system,” International Journal of Refrigeration, Vol. 31, pp. 45-54. Girotto, S., S. Minetto, and P. Neksa. 2004. “Commercial refrigeration system using CO2 as the refrigerant,” International Journal of Refrigeration, Vol. 27, pp. 717-723. Hinde, D., and S. Zha. 2009. “Natural refrigerant applications in North American supermarkets,” IIAR Industrial Refrigeration Conference and Exhibition, Dallas, TX, 22-25 March 2009. International Energy Conservation Code 2009. International Code Council, Washington, D.C. Kim, M., J. Pettersen, and C. Bullard. 2004. “Fundamental process and system design issues in CO2 vapor compression systems,” Progress in Energy and Combustion Science, Vol. 30, pp. 119-174. Lemmon, E., M. McLinden, and M. Huber. 2007. NIST Standard Reference Database 23: Reference Fluid Thermodynamic and Transport Properties-REFPROP, Version 8.0, National Institute of Standards and Technology, Standard Reference Data Program, Gaithersburg, MD. Sarkar, J., and N. Agrawal. 2010. “Performance optimization of transcritical CO2 cycle with parallel compression economization,” International Journal of Thermal Sciences, Vol. 49, pp. 838-843.
Sawalha, S., and B. Palm. 2003. “Energy consumption evaluation of indirect systems with CO2 as secondary refrigerant in supermarket refrigeration,” 21st IIR International Congress of Refrigeration, Washington, D.C, 17-22 August 2003.