Waste Management and Waste Waste Management and Waste - - to to - - Energy Energy Status in Singapore Status in Singapore Lawrence C. C. Lawrence C. C. Koe Koe , J. Y. Wang, and H.B. Ding , J. Y. Wang, and H.B. Ding Environmental Engineering Research Environmental Engineering Research Center Center Nanyang Nanyang Technological University Technological University Singapore Singapore
Transcript
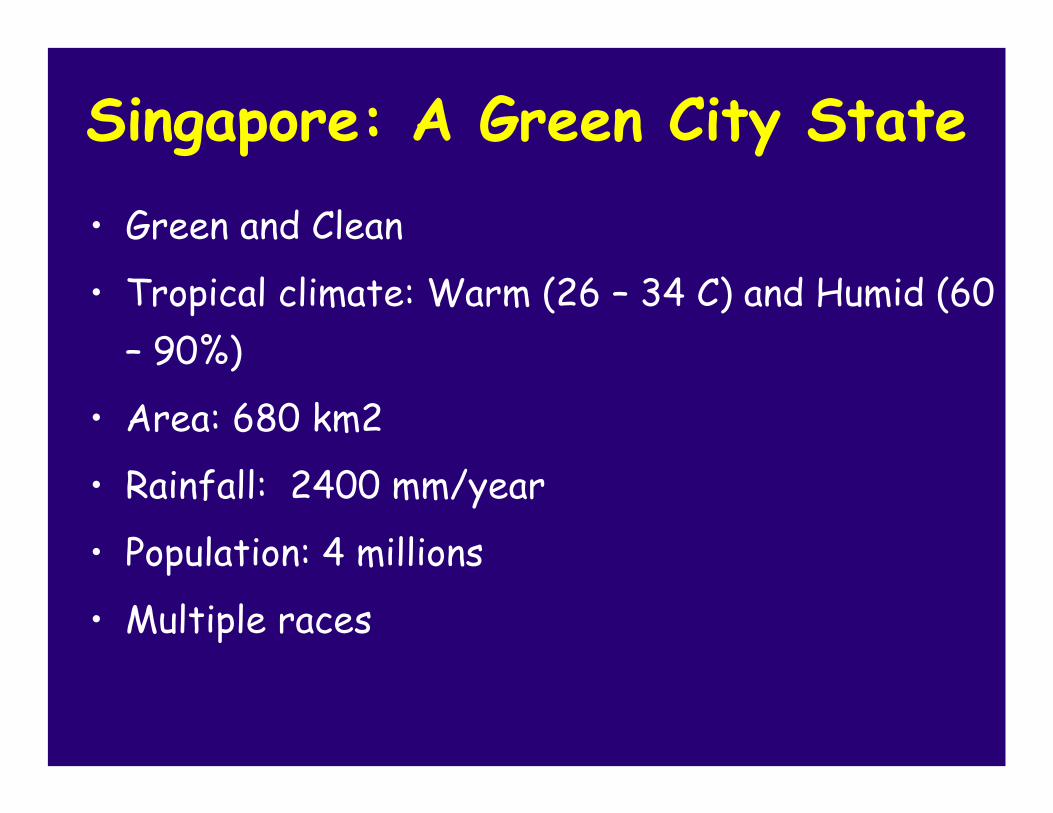
Waste Management and WasteWaste Management and Waste--toto--Energy Energy Status in SingaporeStatus in Singapore
Lawrence C. C.Lawrence C. C. KoeKoe, J. Y. Wang, and H.B. Ding, J. Y. Wang, and H.B. DingEnvironmental Engineering Research Environmental Engineering Research CenterCenter
• Semi-automated sorting plant opened in Nov 02– capacity to sort 50
tonnes/day of recyclables e.g. paper and cardboard, plastics, glass and cans
Wood Waste Recycling
Recycling of wood waste to produce• Office furniture• Home furniture• Pallets
Shredded Wood Waste
e-Waste Recycling
Construction & Demolition Waste Recycling
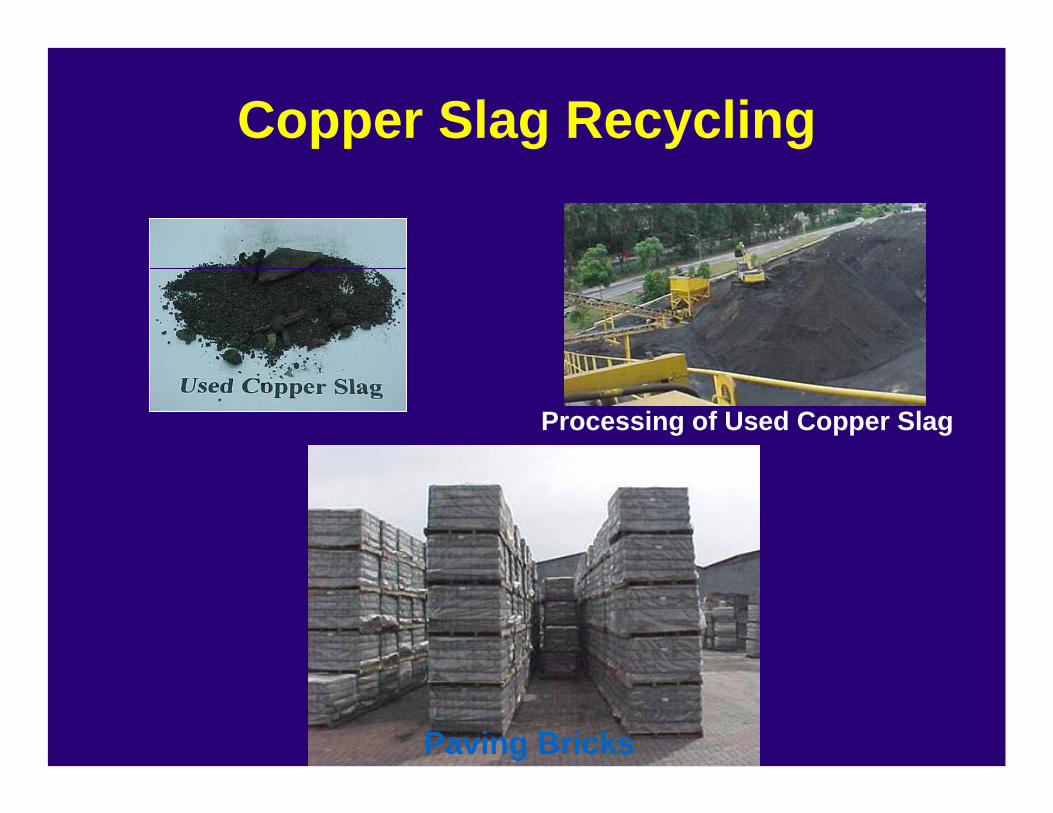
Copper Slag Recycling
Paving Bricks
Processing of Used Copper Slag
Plastic Waste Recycling
Plastic scraps
Plastic Pellets
Heating and Extrusion
Pelletised Animal Feed
Recycling Process
Food Waste Recycling
Spent Soya Bean
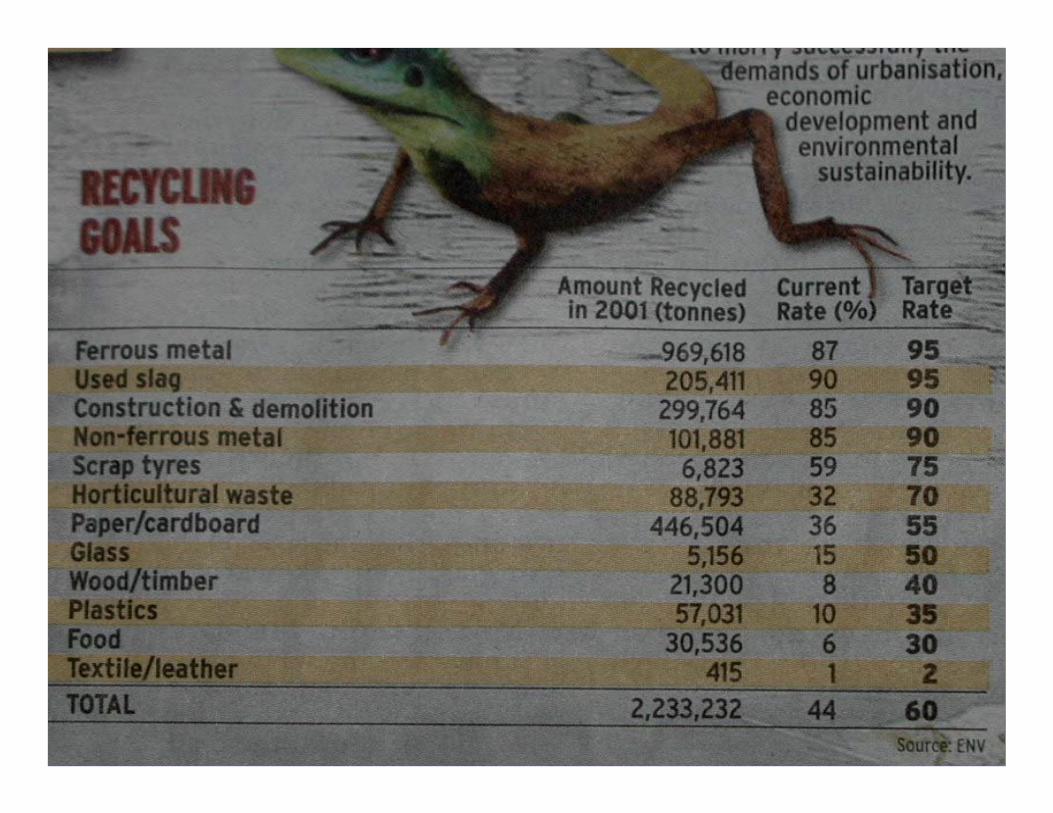
NEA’s Target
To increase current recycling rate of
47% to 60%
by 2012
Disposal
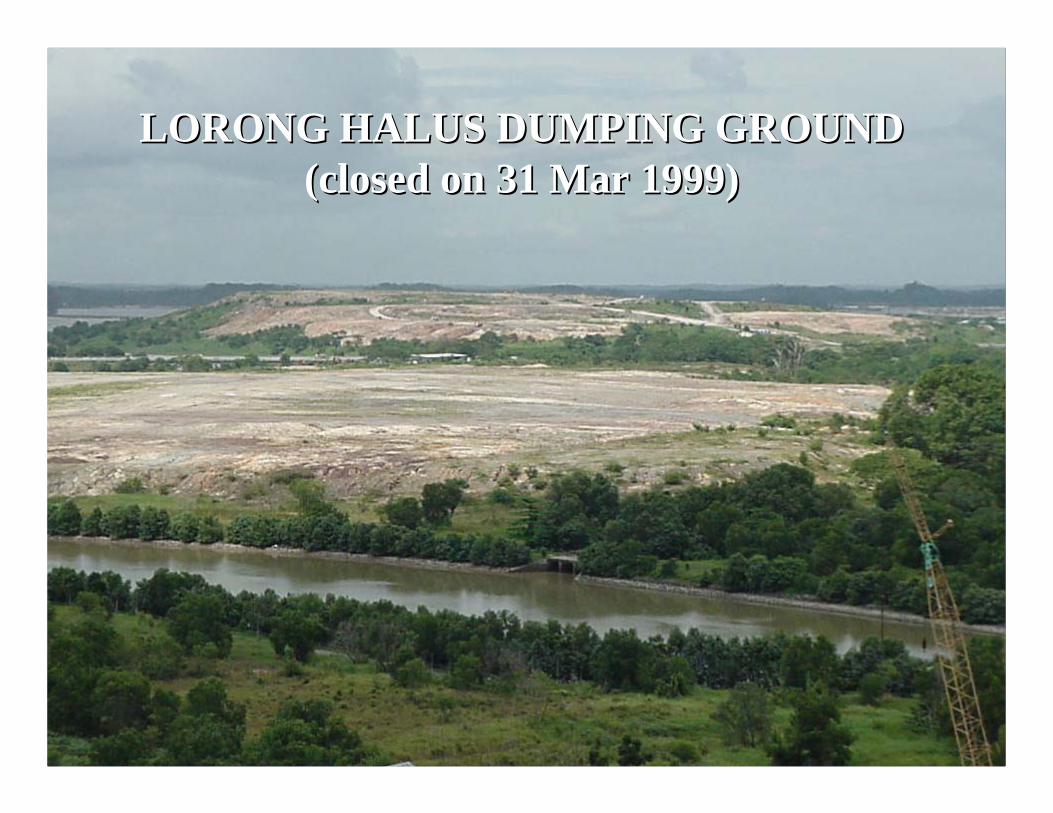
LORONG HALUS DUMPING GROUNDLORONG HALUS DUMPING GROUND(closed on 31 Mar 1999)(closed on 31 Mar 1999)
• 92% of waste is disposed of by incineration
• Volume of waste is reduced by 90%
• Energy is recovered for electricity generation• 981 million kWh of electricity generated • 2 to 3% of the electricity demand for Singapore
• Scrap metal is recovered for recycling• 22,800 tons of scrap recovered
Disposal - Incineration
Incineration Plants
Senoko IPSenoko IP
Tuas Tuas South IPSouth IP
Tuas IPTuas IP UluUlu PandanPandanIPIP
Incineration Capacities
8,200Total
3,0002000Tuas South
2,4001992Senoko
1,7001986Tuas
1,1001979Ulu Pandan
Capacity(tonnes/day)
Year CommissionedIP
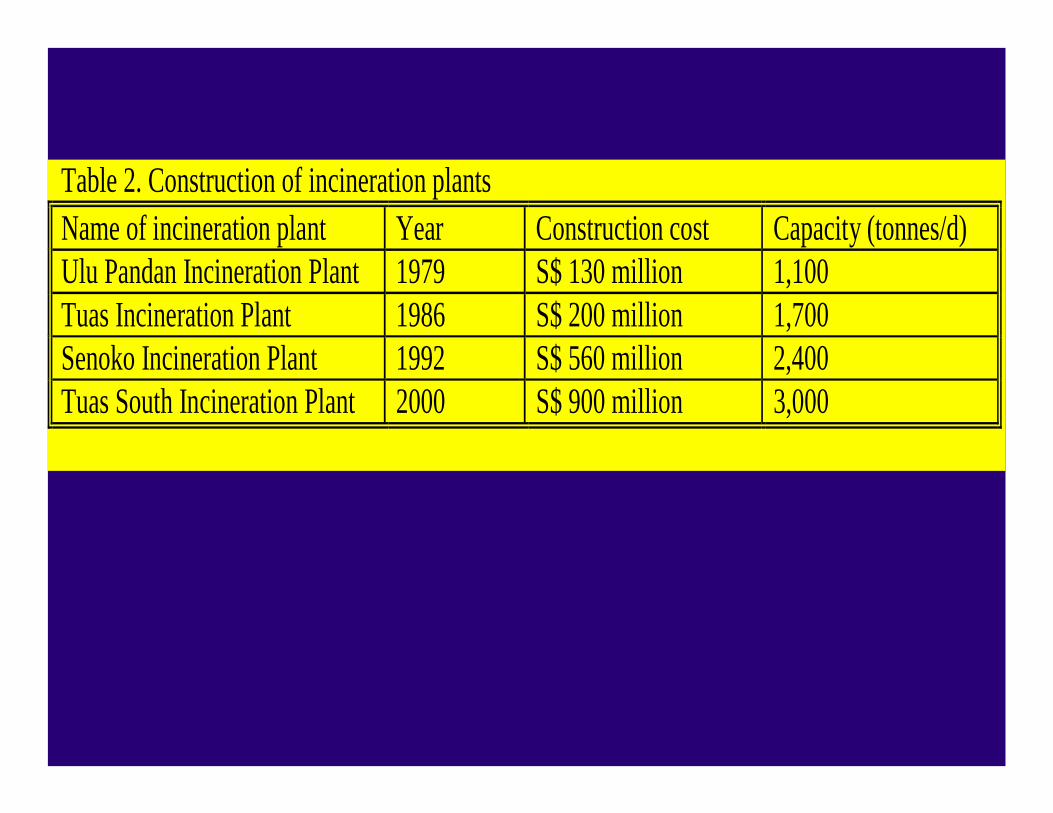
Table 2. Construction of incineration plants Name of incineration plant Year Construction cost Capacity (tonnes/d) Ulu Pandan Incineration Plant 1979 S$ 130 million 1,100 Tuas Incineration Plant 1986 S$ 200 million 1,700 Senoko Incineration Plant 1992 S$ 560 million 2,400 Tuas South Incineration Plant 2000 S$ 900 million 3,000
Tuas South Incineration Plant
Tuas South Incineration Plant
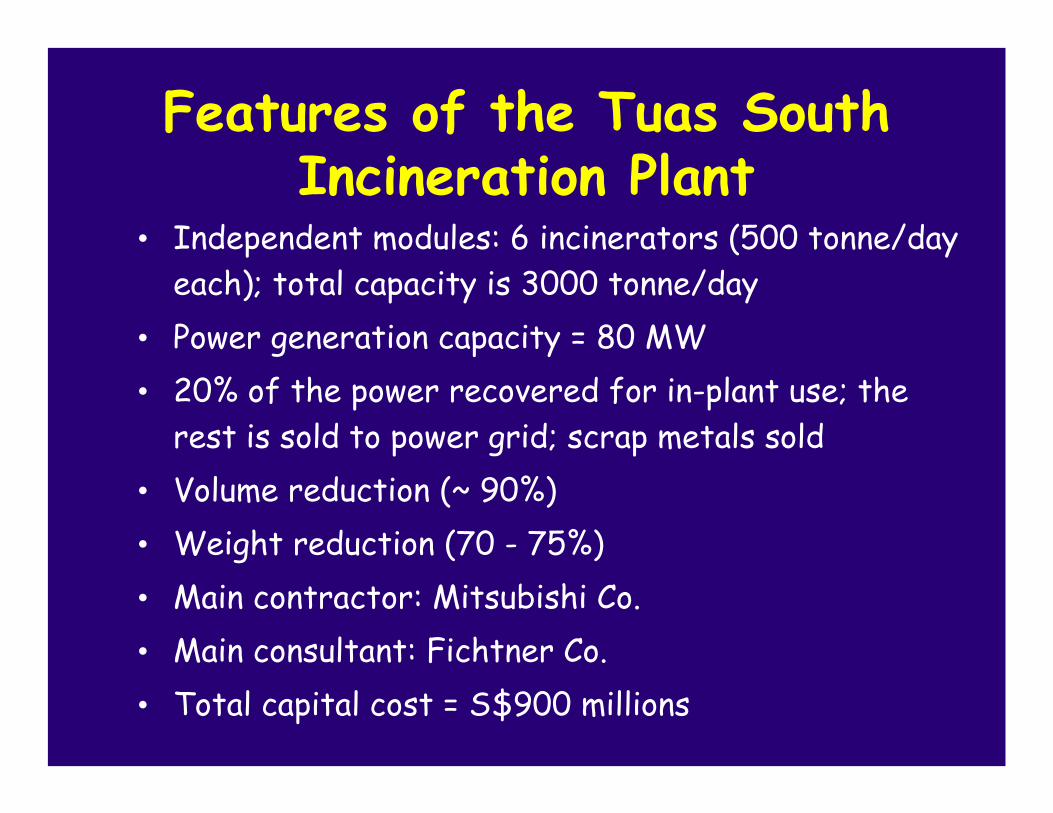
Features of the Tuas South Incineration Plant
• Independent modules: 6 incinerators (500 tonne/day each); total capacity is 3000 tonne/day
• Power generation capacity = 80 MW• 20% of the power recovered for in-plant use; the
rest is sold to power grid; scrap metals sold• Volume reduction (~ 90%)• Weight reduction (70 - 75%)• Main contractor: Mitsubishi Co.• Main consultant: Fichtner Co.• Total capital cost = S$900 millions
• Disposal of 10% non-incinerablewaste
• 1,400 tonnes/day IBA
• Commenced operation on 1 Apr 99
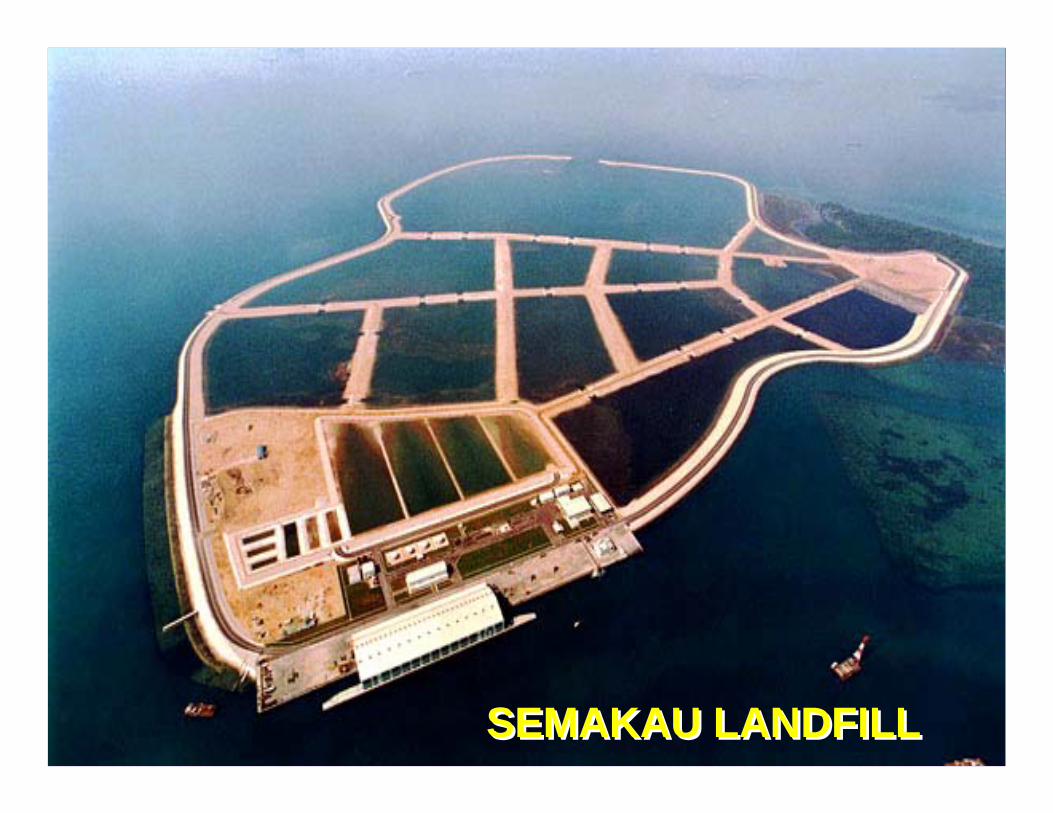
• Capacity : 63 million m3
• Area : 350 ha
Semakau Landfill
Semakau Landfill
SemakauSemakauLandfillLandfill
TuasTuas Marine Marine Transfer StationTransfer Station
Tuas Marine Transfer StationTuas Marine Transfer Station
Tipping of WasteTipping of Waste
TuasTuas Marine Transfer StationMarine Transfer Station
Full BargeFull Barge
TuasTuas Marine Transfer StationMarine Transfer Station
Closing of Hatch CoverClosing of Hatch Cover
TuasTuas Marine Transfer StationMarine Transfer Station
Waste is brought Waste is brought by barge to the by barge to the
receiving stationreceiving station
SEMAKAU LANDFILLSEMAKAU LANDFILL
Unloading of wasteUnloading of waste
SEMAKAU LANDFILLSEMAKAU LANDFILL
Loading onto dump truckLoading onto dump truck
SEMAKAU LANDFILLSEMAKAU LANDFILL
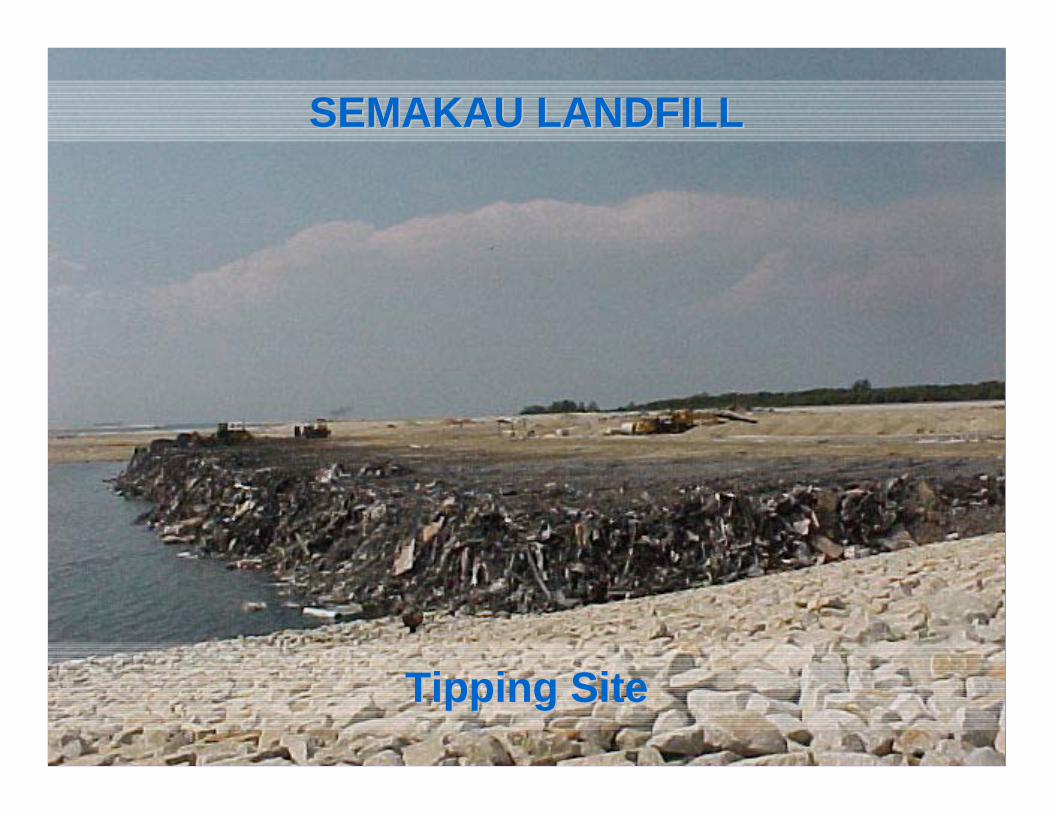
Tipping SiteTipping Site
SEMAKAU LANDFILLSEMAKAU LANDFILL
SEMAKAU LANDFILLSEMAKAU LANDFILL
MSW Research Work @EERC• Bioconversion of food waste into biogas and biofertilizer
• Bioconversion of dewatered sewage sludge and food waste into biofertilizer
• Bioconversion of horticultural waste and food waste into a new soil substitute
• Pyrolytic conversion of plastic waste into fuel and monomers
• Use of ladle furnace slag (by product of steel making) for asphalt production
• Use of incineration fly ash and marine clay as construction materials
FOOD WASTE CONVERSIONFOOD WASTE CONVERSION• Research goal is to convert food waste into
value-added products, e.g., compost, fertiliser,or methane gas