Waste picking in South Africa Derick Blaauw (NWU), Rinie Schenck (UWC) and Kotie Viljoen (UJ) National dialogue: Integrating the informal sector and SMEs into municipal solid waste management in South Africa 8 October 2015 Cape Town
Transcript
Waste picking in South Africa
Derick Blaauw (NWU), Rinie Schenck (UWC) and Kotie Viljoen (UJ)
National dialogue: Integrating the informal sector and SMEs into
municipal solid waste management in South Africa
8 October 2015
Cape Town
Structure of the presentation
1. The meaning of work
2. South Africa’s informal economy
3. Waste picking described
4. Waste Picker research
5. Profile of the WPs
6. Employment history
7. Income analysis
8. Enabling factors
9. “Barriers” to employment
Rinie
Schenck
Derick
Blaauw
The meaning/importance of work
• Economic dimension
• Social dimension
• Psychological dimension
• Vital for the well being of the person
3
South Africa’s informal economy
• Unregistered, unregulated, unorganised• 17 % of total employment and 12.7% of total labour
• “Waste picking is an unskilled profession and give unskilled labourers the opportunity to enter the labour market “
• “There are no barriers to enter waste picking”
• World Bank: 15 million waste pickers around the world
• SA - 35-70,000 (estimations)• Work for themselves or “self employed” • “Determine” their own income
Landfill waste pickers
Street waste pickers
“Recycle cycle”
Waste generators
Users
Collectors/waste pickers
Middle man (BBC)
Recyclers (PETCO/MONDI)
Waste Picker Research• Study 1: Exploratory interviews were conducted with street
waste pickers (SWPs) in Pretoria, (2009)• Study 2: Consisted of a survey of SWPs in Pretoria with 142
respondents (2010)• Study 3: In 2011 a reconnaissance study to determine the
prevalence of buy-back centres (BBCs) and SWPs in the major cities of South Africa
• Study 4: The National survey was completed with 910 SWPs and 64 BBC’s (2012)
• Study 6: Consisted of a survey on 9 landfill sites with 400 landfill waste pickers (LWPs) in the Free State Province in South Africa (2012)
• Study 7: Received funding to look at nutritional status of the LWPs (2015)
• Study 8: Received Funding for funding - WPs in the Karoo region (2015)
• Study 9: Management of landfill sites and best practices
9
Profile of the WPs Street Waste pickers –
national 2012
Landfill waste
pickers- Free State
2012
Landfill waste
pickers-
Stellenbosch 2015
Youth 42% under 35 42% under 35 48% under 35
Gender
Male 96% 52% 75%
Female 4% 48% 25%
Total 100 100 100
Race
Black 84.6% 98% 33,3%
Coloured 14.6% 2% 66,6%
Indian/Asian 0.4% 0% 0%
White 0.4% 0% 0%
Total 100 100 100
10
Street waste pickers (96%male)
Female SWP (4%)
Street waste picker
Countries of origin
Country SWPs- national
2012
Landfill waste
pickers- Free
State 2012
Landfill waste
pickers
Stellenbosch
2015
South African 72.3% 89% 98%
Zimbabwe 8.3% 1%
Namibia 0.5%
Swaziland 0.3%
Mozambique 1.8%
Lesotho 15.7% 9%
Botswana 0% 1%
Other 1.1% 2%
Total 100 100 100 14
Pretoria SWPs 2012
15
Education of the WPs – Free State 2012
16
2%
28%
10%
51%
9%
0%
3%
29%
14%
49%
5%
0%
No schooling
Some primary schooling
Complete primary
Some secondary
Completed secondary
Post school
LWP SWP
17
.Age related0.1%
School-related5.4%
Financial difficulties/
poverty68%
Family related15.6%
Behaviouralissues5.4%
Health-related0.9%
General reasons
4.5%
Few left by choice
68%
• Financial difficulties/ poverty
most prominent reason lost one or both parents
no-one to care for them
• Family related issues Problems at home
• Problems related to behaviour /
characteristics might decrease employability
Source: Survey data
It is generally accepted that poverty has a detrimental effect on the
capability to achieve the productive functioning such as schooling (Fryer
and Hepburn, 2010:6).
SWPs national 2012: Reasons for leaving
school early
Reasons for becoming SWPs
• “I am my own boss”,
• “ I get sufficient income”
• “ doing well enough.”
• “ the only option” due to being uneducated, low skilled and limited opportunities in the formal labour market.
18
Variety of economic activities
• An ethnographic study by Reyneke(2012) on a landfill site in Pretoria suggests that multiple economic activities are also playing themselves out on landfill sites such as producing items from the collected waste, off and uploading (trucks)
• Collecting of food and other household items
19
The Family Lives of the WPs
SWPs ( national) LWPs (Free State)
Brick House 18% 46%
Shack 22% 47%
Elsewhere
(construction site,
street, veld, place of
work, domestic
worker)
70% 7%
Total 100 100 20
Living on the landfill
LWPs: Pretoria
• During the day about 300-400 waste pickers operate on the landfill. Yet not all these individuals reside on the landfill. Only about 200 of the waste pickers own shacks on the landfill and the others commute back and forth on a daily basis”. This means that around 50% of the waste pickers on the landfill site are sleeping on the landfill (Reyneke 2012)
22
Landfill waste pickers (LWPs)
Food security: Access to food
Dustbins Landfill
sites
Other
WPs
Own/
bring/buy
Other e.g.
churches,
individual
SWPs 32% - 15% 40% 32%
LWPs - 31% 15% 83% 15%
24
Waste pickers: Food security
• ‘’… you see somebody’ supper from last night and you eat it…”
• “ from my experience no one has died from food…”
• “Some people dry meat in the sun and dry it until their next trip home”
Sense of independence
• “ I am my own boss, no one tells me …. What to do, what, when and how….” “Your employer does not push you, even if you are not feeling well …. He does not push you, he is not after you, you push yourself, your pay is determined by you”
• “ I am my own boss”
26
N2 Scrap metal collectors(on their way to “Marikana”)
28
Only 52.4% previously had a full-time job with
benefitsLess than a
year (18.1%)
1 - 2 years(15.4%)
2 - 5 years (30.2%)
5 - 10 years (20.2%)
More than 10 years (16.1%)
Period employed (years)
Source: Survey data
• 16.1% - longer than 10 years
• 30.2% - 2-5 years
• 20.2% - 5-10 years
• 18.1% - less than a year
• 15.4% - 1 to 2 years.
• Almost 63.7% had their previous full
time job for less than 5 years
Employment history: previous full-time
job experience
Lack of full-time job experience makes them more vulnerable in
terms of competing for and finding a full-time job.
29
Contract ended (12.8%)
Quit - medical reasons (8.5%)
Quit - wage too low (16%)
Disciplinary reasons (6.1%)
Laid off -business
downsizing (9.3%)
Laid off -business
moved/sold (7.5%)
Laid off -business
closed (15.4%)
Other (24.4%)
Reasons for leaving previous full-time job
Source: Survey data
32.2% - were laid off
12.8% - contracts ended
24.5% quitted their job
including
16% for low wages
8.5% for medical reasons
Reasons for leaving last full-time job
30
Anything I can get (345)
Show that street waste picking is not an
option to earn high incomes.
Most still prefer another job
Yes85.7%
No14.3%
Source: Survey data
Are they looking for a full-time job?
Not looking for a job?
• 35.1% - too old to find a job
• 24.3% - disability and
illness
• 13.5% - satisfied with their
job as SWP
• 3.6% - immigrants (either
temporary in the country or
do not qualify to work in
South Africa)
“I would like to have a proper job”
“I would like a real permanent job”
“I would rather have a decent job”
31
• 5H00 or earlier - 39.3 % starts
• 6H00 another 26.2% joins
• 7h00 majority (86%) are busy picking waste
• Only 35% work 8 hours or less
• Majority work between 8 and 11 hours
0,61,7
14,8
22,2
26,2
20,6
10,2
2,2 1,40,1
0
5
10
15
20
25
30
1 2 3 4 5 6 7 8 9 10 11
Percentage
Hours
Start of working day They start very early
• to follow the dustbins to
collect as much as possible
before the municipal trucks
collects the waste
• Competition is stiff and they
compete to get to the more
valuable waste first
• Compete for limited amounts
of waste
Start of the working day
Analysis of the SWPs’ income and interpretation of the
findings
• Two groups of SWPs were identified:
• Those earning their income on the day they have collected the waste.
• Those who store their waste and sell it weekly.
• Of the total of 873 SWPs who revealed their income, 751 reported it for a
day’s waste collected, while 122 reported it for a week’s waste collected.
• Data was collected for 3 different scenarios:
• the income usually earned,
• the income earned on a good day or week; and
• Income earned on a bad day or week.
33Source: Survey data
The descriptive analysis of the income earned by SWPs confirms the claim of
low and uncertain incomes. The average usual income earned for a day’s
waste is R67.29 with a median income of R50. The mean income earned for a
usual week’s waste is R508.79 and the median income is R300. Because of the
large variance in incomes, the median income is a better indication of the
incomes earned and shows that only a few street waste pickers earn high
incomes.
Descriptive analysis and interpretation of findings - Phase 1
34
Descriptive analysis and interpretation of findings –
Phase 1
Quantity of waste - Income and city size
• There are large differences in the incomes across cities, but no
correlation between the income and the size of the cities.
• Reasons: There is an interplay between factors such as the
availability of waste, competition for the waste, and the
different prices paid for the different waste products.
• More waste is available in the larger cities, but it does not
necessarily reflect in higher incomes because the competition
for waste is also greater in the larger cities
• Availability of waste affected by: weather conditions, holiday
seasons, fashion seasons and fresh farm produce seasons.
Cities
Day (usual incme) Week (usual income)
nMean Median
nMean Median
(R (R) (R) (R)
Bloemfontein 39 61.74 40 6 220 165
Cape Town 152 64.05 50 1 200 200
Durban 65 58.06 45 15 226.6 200
East London 36 44.58 30 - 50 50
Johannesburg 188 80.65 60 84 621.23 400
Kimberley 14 40.79 40 - -
Mafikeng 6 79.17 65 - -
Nelspruit 1 65 65 1 350 350
Pietermaritzburg 3 73.33 75 2 450 450
Polokwane 11 66.82 70 - -
Port Elizabeth 18 43.22 35 1 100 100
Pretoria 212 68.4 50 12 301.67 300
Upington 6 84.5 90 - -
Total 751 67.26 50 122 505.06 300
36
Large differences in the mean incomes between the cities
No relationship between the mean income and the size of the cities
Reasons:
Interplay of factors such as:
• different prices paid for the different waste products
• availability of waste
• competition for the waste
More waste is available in the larger cities but will not necessarily be
reflected in higher incomes because the competition for the waste is also
greater
“Sometimes there are not enough to pick up”
“Lots of competition”
“There is huge competition in the work”
“Some people living in flats and some working in certain
companies started to sell the waste for themselves”
Median incomes:
Day = R50
Week = R300
Income of SWPs
“ I do not earn enough for a decent living“
“ I am suffering…it is very difficult to survive.”
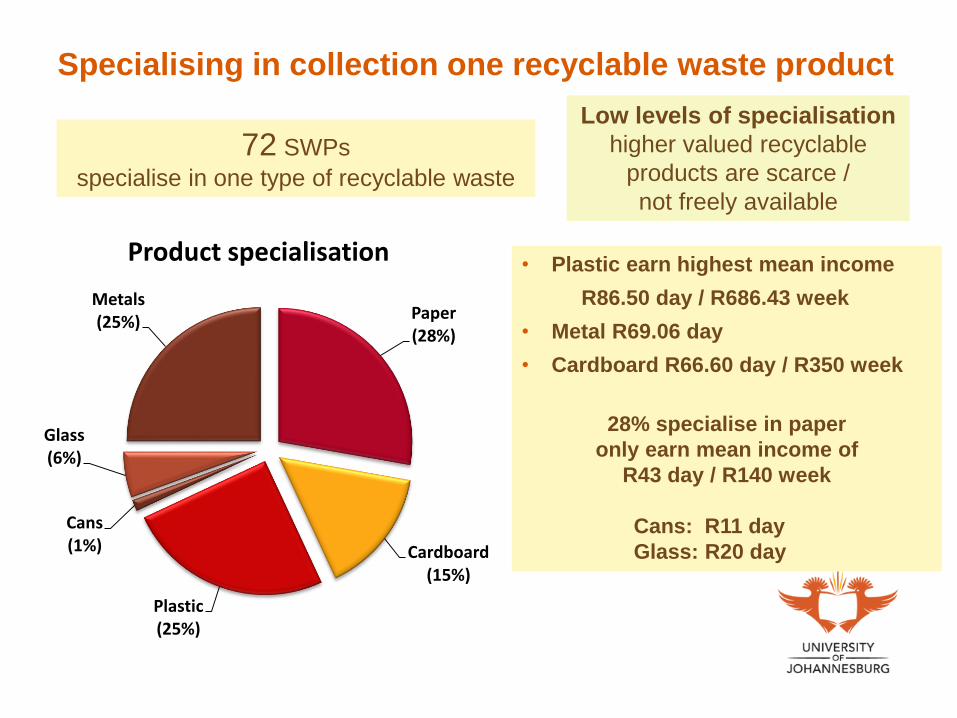
Paper(28%)
Cardboard(15%)
Plastic(25%)
Cans(1%)
Glass(6%)
Metals(25%)
Product specialisation
72 SWPs
specialise in one type of recyclable waste
Low levels of specialisation
higher valued recyclable
products are scarce /
not freely available
• Plastic earn highest mean income
R86.50 day / R686.43 week
• Metal R69.06 day
• Cardboard R66.60 day / R350 week
28% specialise in paper
only earn mean income of
R43 day / R140 week
Cans: R11 day
Glass: R20 day
Specialising in collection one recyclable waste product
38
Cross-sectional regression analysis
Apart from the price differences between the various recyclable waste
products 8 other possible independent variables, were identified that seem to
have an influence on the usual day income of street waste pickers. These
variables are:
gender;
age;
use of a trolley;
duration or hours worked on a day;
educational attainment level;
country of origin
the starting time of waste picking activities; and
being married or living with a partner; and
A Cross-sectional regression analysis was performed to assess whether
and to what extent the variables identified in the descriptive analysis