WASTE TYRE MANAGEMENT PROBLEMS IN SOUTH AFRICA AND THE POSSIBLE OPPORTUNITIES THAT CAN BE CREATED THROUGH THE RECYCLING THEREOF. by MPANYANA LUCAS MAHLANGU Submitted in fulfillment of the requirements for the degree of MASTER OF ARTS In the subject ENVIRONMENTAL MANAGEMENT at the UNIVERSITY OF SOUTH AFRICA SUPERVISOR: PROF O R AWOFOLU APRIL / MAY 2009
Transcript
WASTE TYRE MANAGEMENT PROBLEMS IN SOUTH AFRICA AND THE POSSIBLE OPPORTUNITIES THAT CAN BE CREATED THROUGH THE RECYCLING THEREOF.
by
MPANYANA LUCAS MAHLANGU
Submitted in fulfillment of the requirements for the degree of
MASTER OF ARTS
In the subject
ENVIRONMENTAL MANAGEMENT
at the
UNIVERSITY OF SOUTH AFRICA
SUPERVISOR: PROF O R AWOFOLU
APRIL / MAY 2009
LETTER OF DECLARATION I, Mpanyana Lucas Mahlangu, hereby declare that the work contained in this
thesis, is of my own originality and have not been previously in its entirety or part
thereof submitted to any institution of higher learning in South Africa or abroad
for the purposes of a degree.
The work is submitted for the first time to the University of South Africa for the
purpose of study towards a Masters degree in Environmental Management.
SIGNED: …………………… DATED:……../…………/…………..
ACKNOWLEDGEMENTS
I wish to express my profound gratitude to my substantive supervisor Professor
O R Awofolu, who despite his busy schedule was able to guide me through this
research until the final write up.
I acknowledge my indebtedness to my wife Nomsa, my son Siyabonga and
daughter Khanyile for the support and understanding they afforded me during
trying times when I conducted the research.
Finally, I thank the almighty God for bringing me this far and for always been
with me.
SUMMARY
The research work critically analyzed the factors responsible for imprudent waste
tyre management in South Africa. As an approach to determine the complexity
of the problem, questionnaires were sent to one hundred and sixty (160)
respondents in conjunction with interviews. Perusal of literature and interaction
with industry involved in waste tyre processing to further gain knowledge of the
problem and possible solutions that can be solicited to address the problem.
Findings revealed that, lack of clear, focused legislation that guide the handling,
disposal and processing of waste tyres remain the challenge. It is also deduced
that recycling of waste tyres can provide economic benefits and opportunities. It
is recommended that South Africa develop appropriate legislation that deals with
handling, treatment and disposal of waste tyres, develop an incentive programme
to set up initiatives as well as developing skilled and capacitated enforcement
agency.
Key words: Waste Tyres, Legislation, Recycling, Management, South Africa
LIST OF CONTENTS HEADING PAGE No.
CHAPTER 1 1. Introduction 1-3
1.1 Background information of the study 3- 9 1.2 Waste tyres 9- 12 1.2 Problem Statements 12- 13 1.3 Research Motivation 13-14 1.4 Aims and Objectives of the Research 14- 17 1.5 Research hypothesis 17- 18
CHAPTER 2 2.1 Review of literature 19 -21 2.2 Recycling of waste tyres 21- 29 2.3 Thermal Technologies 29 -31 2.4 Incineration emission limit in South Africa 31- 34
2.5 Pyrolysis 35 2.6 Gasification 35 2.7 Geoplasma and Plasma Arc 36- 38 2.8 Legislative Review 38 2.8.1 South Africa 38- 39
2.8.2 European Union 39- 41
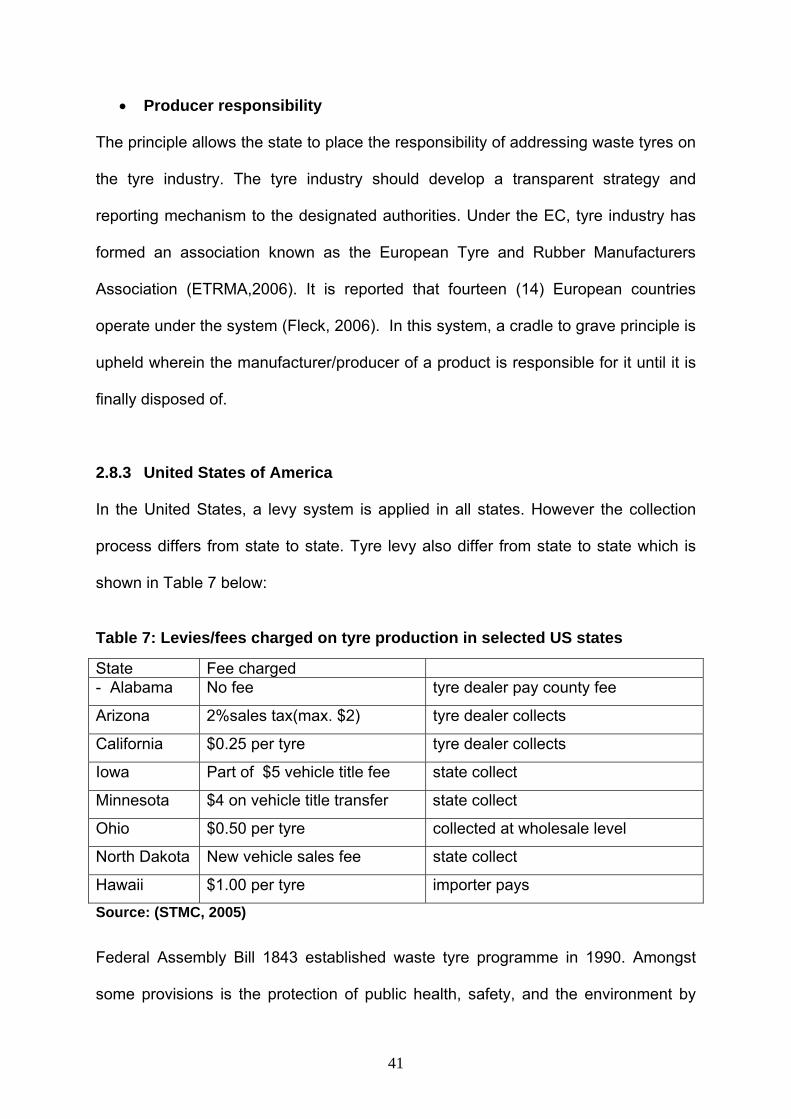
2.8.3 United States 41- 42
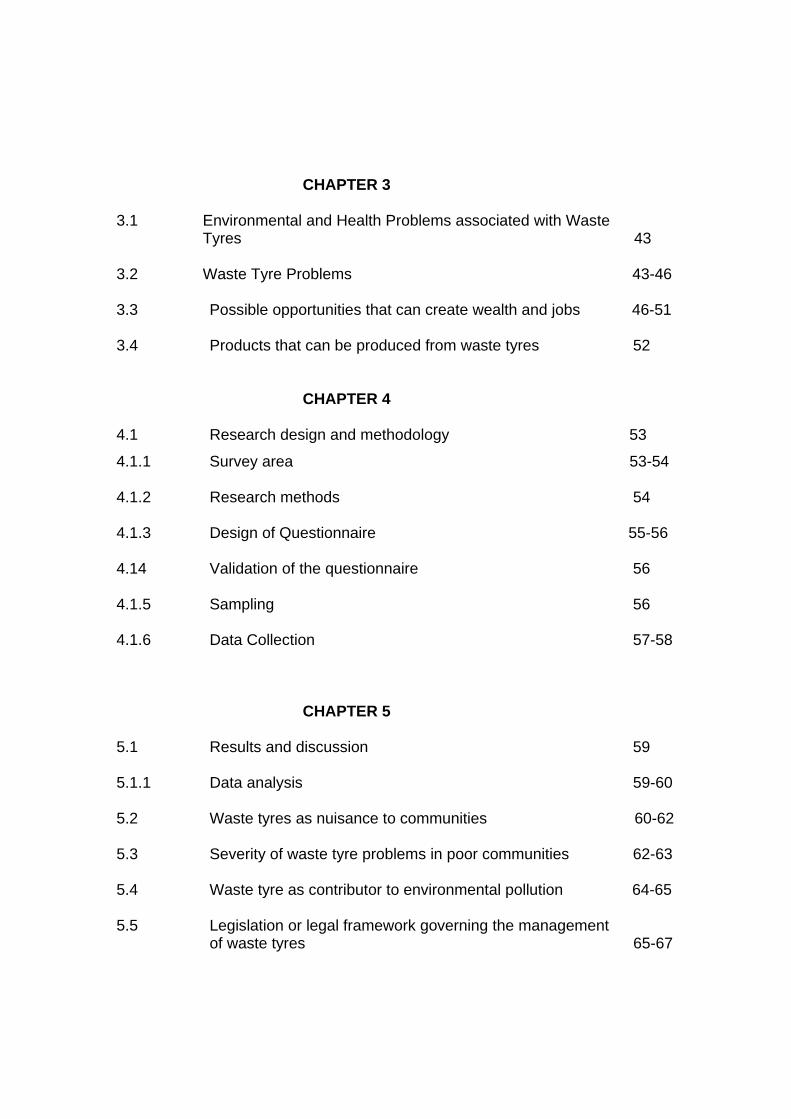
CHAPTER 3 3.1 Environmental and Health Problems associated with Waste Tyres 43 3.2 Waste Tyre Problems 43-46
3.3 Possible opportunities that can create wealth and jobs 46-51
3.4 Products that can be produced from waste tyres 52
CHAPTER 4
4.1 Research design and methodology 53
4.1.1 Survey area 53-54 4.1.2 Research methods 54
4.1.3 Design of Questionnaire 55-56
4.14 Validation of the questionnaire 56
4.1.5 Sampling 56 4.1.6 Data Collection 57-58
CHAPTER 5
5.1 Results and discussion 59
5.1.1 Data analysis 59-60
5.2 Waste tyres as nuisance to communities 60-62
5.3 Severity of waste tyre problems in poor communities 62-63
5.4 Waste tyre as contributor to environmental pollution 64-65
5.5 Legislation or legal framework governing the management of waste tyres 65-67
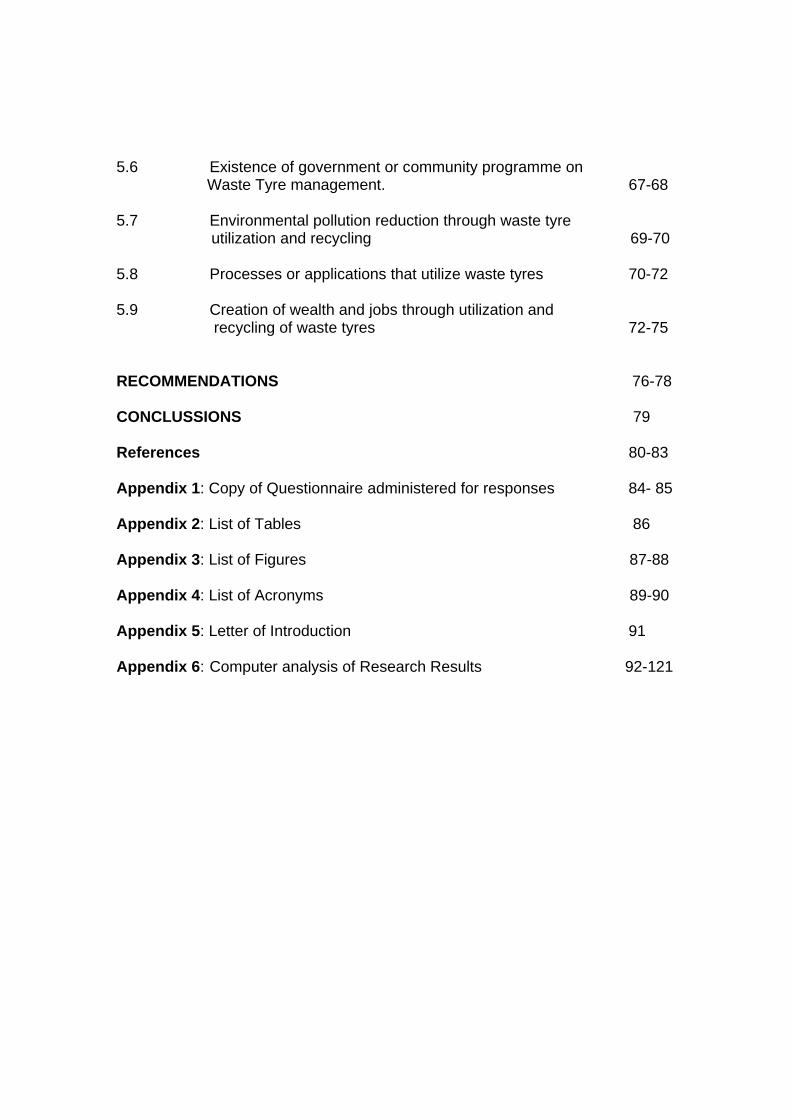
5.6 Existence of government or community programme on Waste Tyre management. 67-68 5.7 Environmental pollution reduction through waste tyre utilization and recycling 69-70 5.8 Processes or applications that utilize waste tyres 70-72
5.9 Creation of wealth and jobs through utilization and recycling of waste tyres 72-75
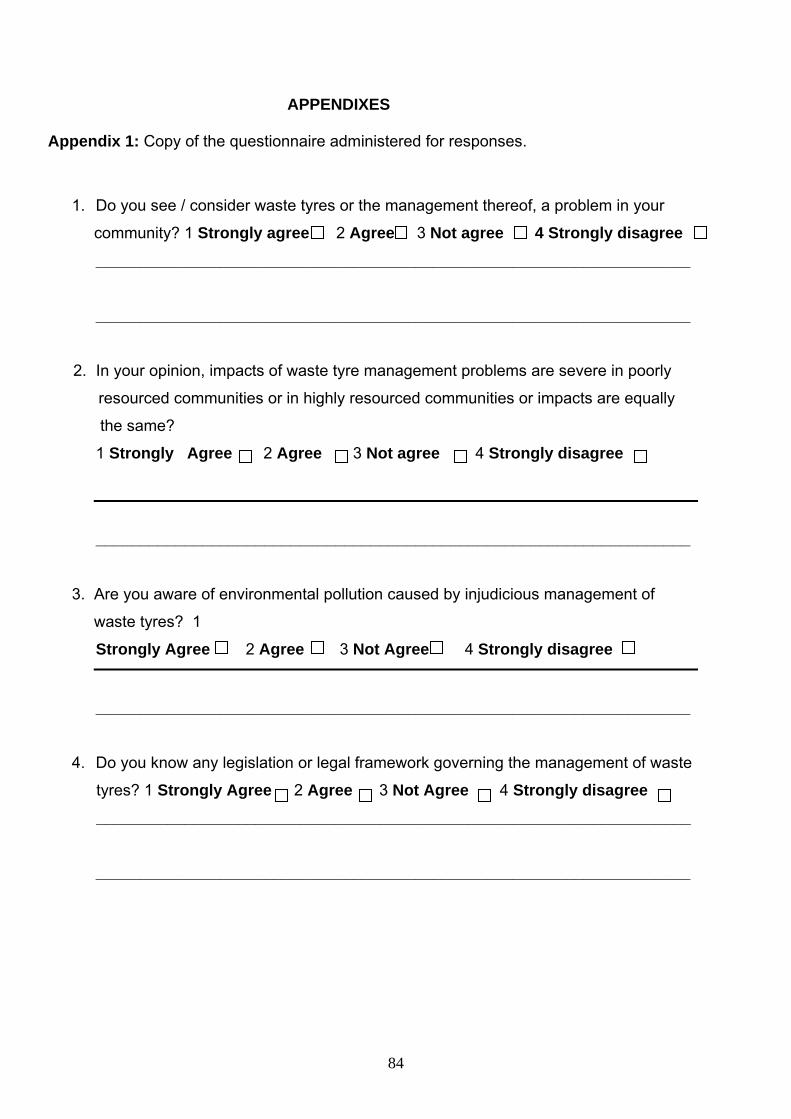
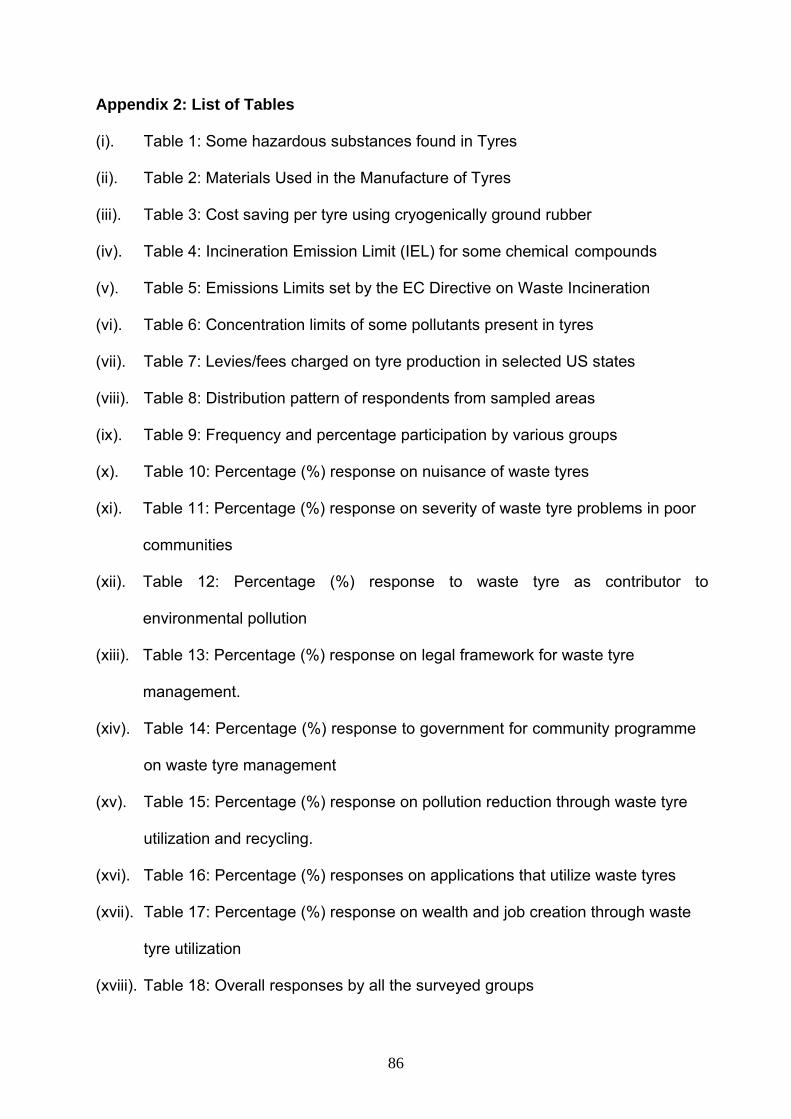
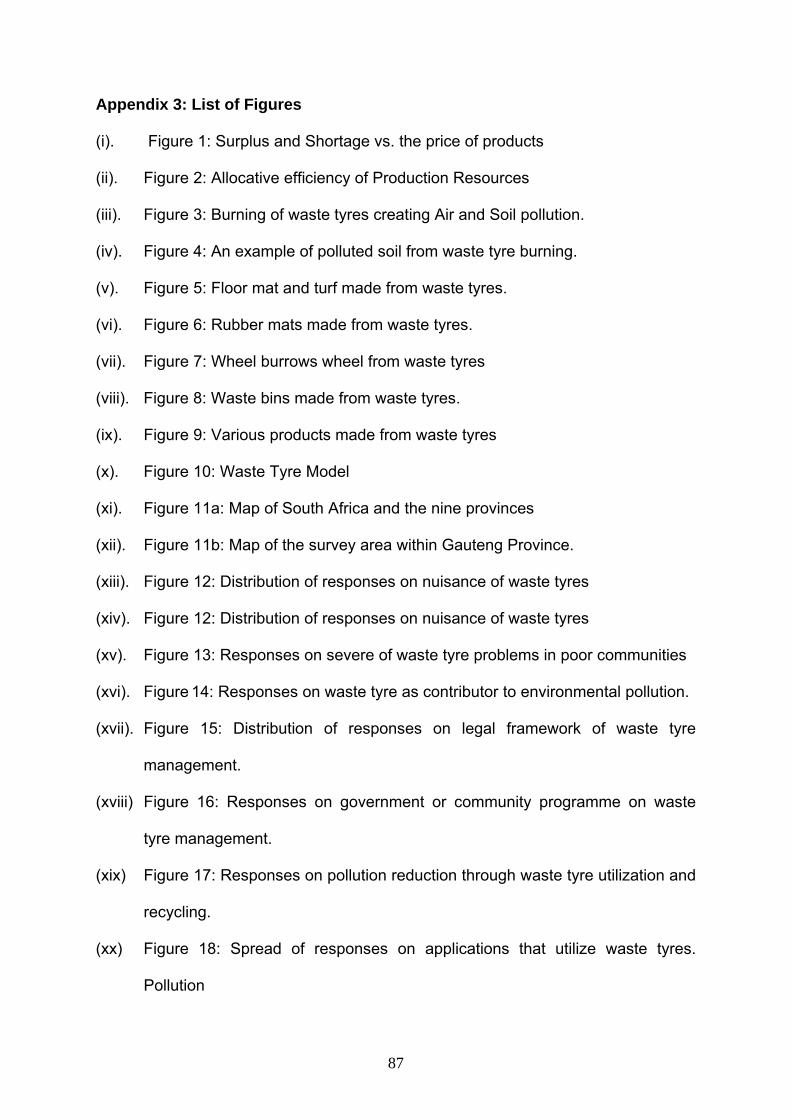
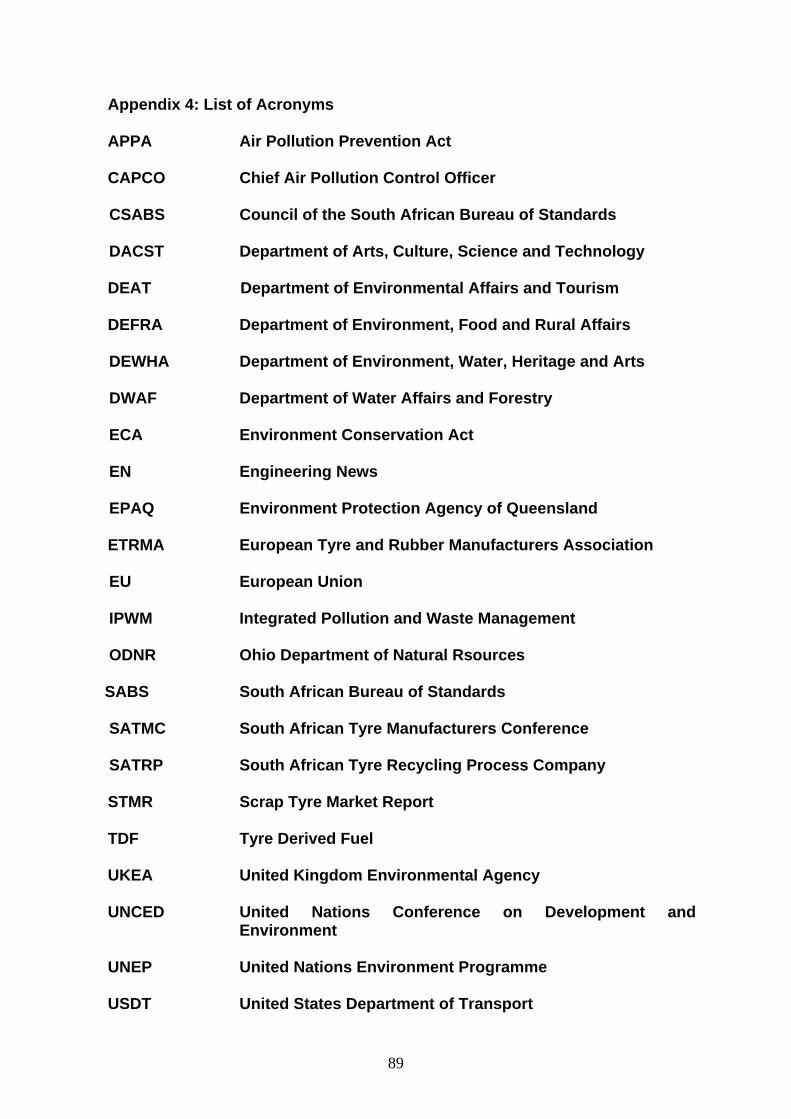
RECOMMENDATIONS 76-78 CONCLUSSIONS 79 References 80-83 Appendix 1: Copy of Questionnaire administered for responses 84- 85 Appendix 2: List of Tables 86 Appendix 3: List of Figures 87-88 Appendix 4: List of Acronyms 89-90 Appendix 5: Letter of Introduction 91 Appendix 6: Computer analysis of Research Results 92-121
1
CHAPTER 1
1. INTRODUCTION
Wastes generally are inevitable products that are generated by every living
organism. This extends from the simple unicellular organism such as Amoeba
proteus to the complex multi-cellular organism such as man. The volume of waste
generated by various organisms is related to their size or complexity. Before the
industrial era, anthropogenic wastes include but not limited to those from
physiological process, ashes from burning of wood, agricultural and animal wastes
which are buried in the ground. However, with increase in population, the volume of
wastes generated also increases. The industrial era brought about tremendous
improvement in the standard of living of man. This was also accompanied by the
introduction of different kinds of waste materials, some of which are detrimental to
our lives and the environment. These wastes are in the form of solid wastes e.g.
and lead compounds, organic halogen compounds and some additives like solvents,
age resistors, vulcanizing agents, softeners, fillers and processing aids in varying
proportions depending on whether it is a car or truck tyre (UNEP, 1998). According
to Basel Convention (UNEP, 1999), a waste tyre is considered a hazardous material
10
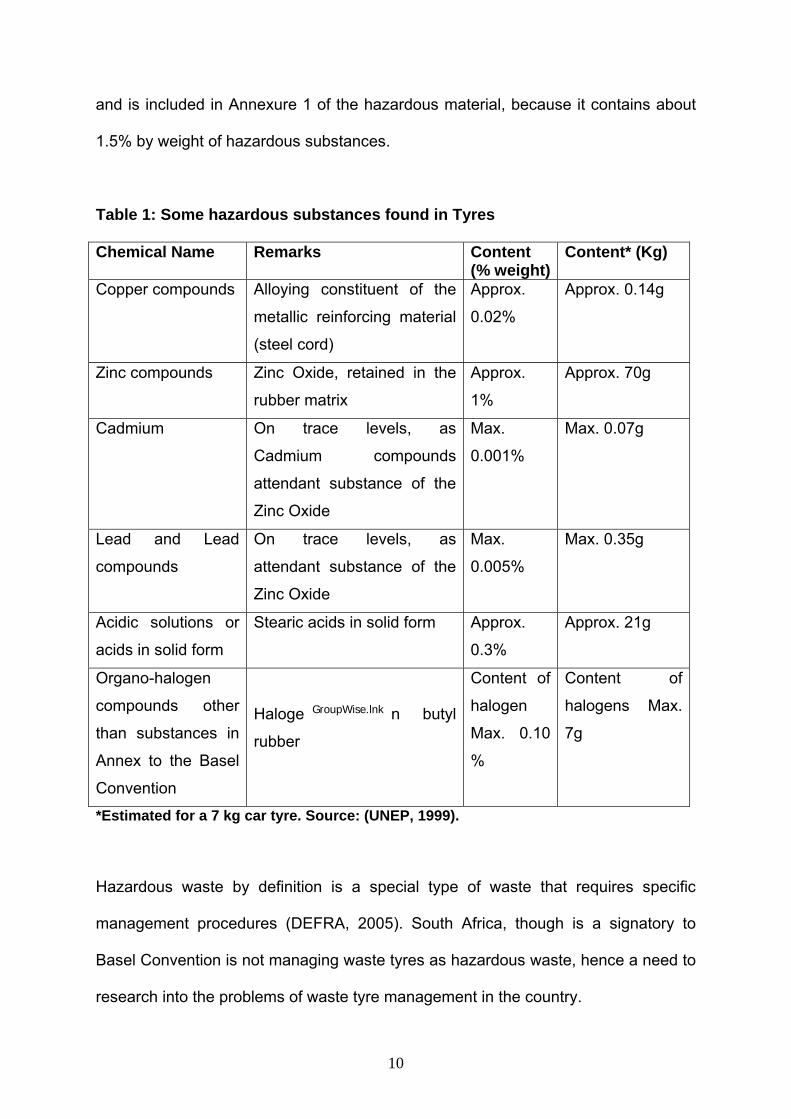
and is included in Annexure 1 of the hazardous material, because it contains about
1.5% by weight of hazardous substances.
Table 1: Some hazardous substances found in Tyres
Chemical Name Remarks Content (% weight)
Content* (Kg)
Copper compounds Alloying constituent of the
metallic reinforcing material
(steel cord)
Approx.
0.02%
Approx. 0.14g
Zinc compounds Zinc Oxide, retained in the
rubber matrix
Approx.
1%
Approx. 70g
Cadmium On trace levels, as
Cadmium compounds
attendant substance of the
Zinc Oxide
Max.
0.001%
Max. 0.07g
Lead and Lead
compounds
On trace levels, as
attendant substance of the
Zinc Oxide
Max.
0.005%
Max. 0.35g
Acidic solutions or
acids in solid form
Stearic acids in solid form Approx.
0.3%
Approx. 21g
Organo-halogen
compounds other
than substances in
Annex to the Basel
Convention
Haloge GroupWise.lnk n butyl
rubber
Content of
halogen
Max. 0.10
%
Content of
halogens Max.
7g
*Estimated for a 7 kg car tyre. Source: (UNEP, 1999).
Hazardous waste by definition is a special type of waste that requires specific
management procedures (DEFRA, 2005). South Africa, though is a signatory to
Basel Convention is not managing waste tyres as hazardous waste, hence a need to
research into the problems of waste tyre management in the country.
11
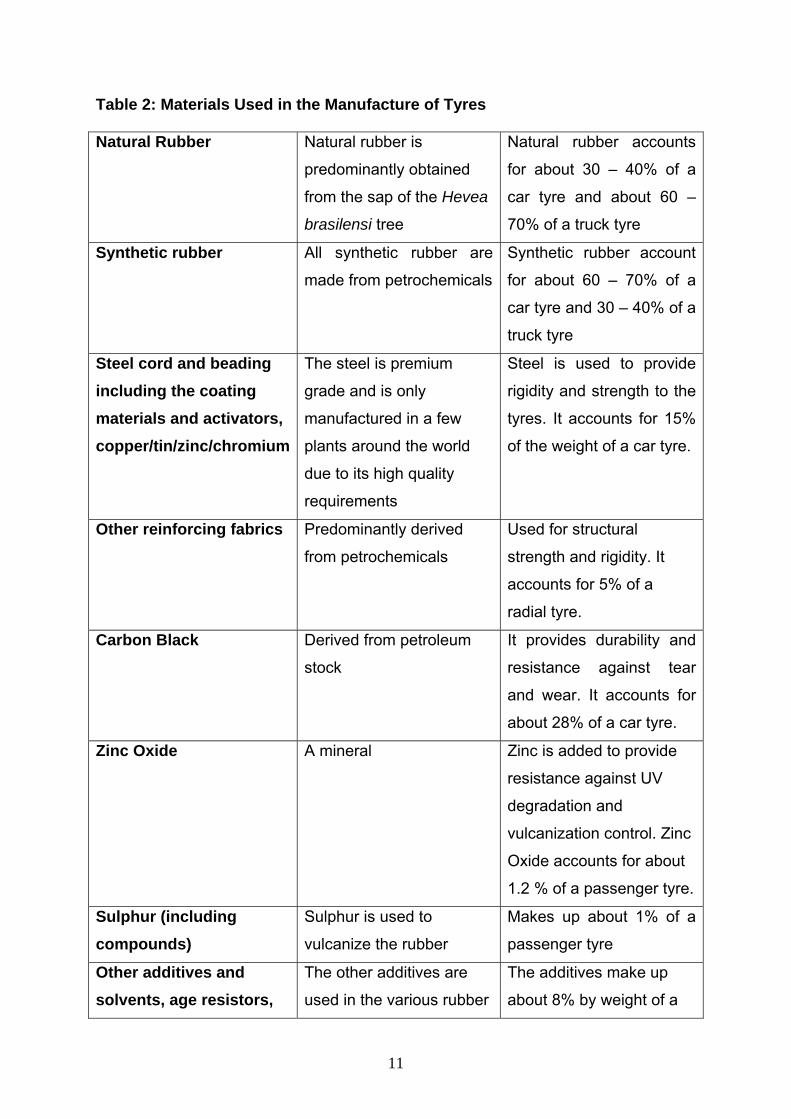
Table 2: Materials Used in the Manufacture of Tyres
Natural Rubber Natural rubber is
predominantly obtained
from the sap of the Hevea
brasilensi tree
Natural rubber accounts
for about 30 – 40% of a
car tyre and about 60 –
70% of a truck tyre
Synthetic rubber All synthetic rubber are
made from petrochemicals
Synthetic rubber account
for about 60 – 70% of a
car tyre and 30 – 40% of a
truck tyre
Steel cord and beading including the coating materials and activators, copper/tin/zinc/chromium
The steel is premium
grade and is only
manufactured in a few
plants around the world
due to its high quality
requirements
Steel is used to provide
rigidity and strength to the
tyres. It accounts for 15%
of the weight of a car tyre.
Other reinforcing fabrics Predominantly derived
from petrochemicals
Used for structural
strength and rigidity. It
accounts for 5% of a
radial tyre.
Carbon Black Derived from petroleum
stock
It provides durability and
resistance against tear
and wear. It accounts for
about 28% of a car tyre.
Zinc Oxide A mineral Zinc is added to provide
resistance against UV
degradation and
vulcanization control. Zinc
Oxide accounts for about
1.2 % of a passenger tyre.
Sulphur (including compounds)
Sulphur is used to
vulcanize the rubber
Makes up about 1% of a
passenger tyre
Other additives and solvents, age resistors,
The other additives are
used in the various rubber
The additives make up
about 8% by weight of a
12
processing aids, accelerators, vulcanizing agents, softeners and fillers
compounds to modify
handling, manufacturing
and end products
properties
passenger tyre.
Recycled rubber Recovered from used
tyres or other rubber
products
Used in some rubber
compounds in the
manufacturing of new
rubber products and
retread materials
Source: Adapted from ( DEWHA, 2001).
1.2 Problem statements
Presently, waste tyres in the country could be regarded as constituting a menace to
human and environmental health (Human, 2005). They are found in illegal dumpsites
across the country which habour storm or rain water and thus constitute breeding
haven for mosquitoes. They are burn for the generation of heat by people in rural
areas, low income residential areas and informal settlements. It is widely known that
such action will lead to the release of noxious gases such as the NOx, SOx, COx,
dioxins etc into the atmosphere causing the atmospheric pollution.
It is estimated that about eleven million tyres are scrapped every year in South
Africa. Unutilized or improper disposal of these substances present a major
ecological hazard since they are not biodegradable and disposal is a serious
challenge since most landfills do not accept them. As a consequence, waste tyres
litter the countryside and are often burnt to recover the steel strap by poor and
unemployed people. This situation is compounded due to the absence of effective
legislation to guide, control and regulate the disposal, storage, utilization and
recycling of this “waste” in the country.
13
These problems can be ameliorated and possible turned into human and
environmentally beneficial products through appropriate societal and governmental
intervention. Hence, it becomes imperative to investigate root cause of these
problems and deduce ways by which they can be mitigated.
1.3 Research Motivation
Waste tyres, when neglected or injudiciously managed can have serious social
impacts to communities. The impacts of waste tyres on social well - being of
communities ranges from being a nuisance, unsightly, cause health problems when
ignited and the fire generated is difficult and costly to extinguish. Socially
communities do not see waste tyres as their responsibility and as such are not willing
to interfere with them. Unscrupulous traders sell waste tyres as second hand tyres
and the results are fatal accidents and deaths. Some community members burn the
waste tyres to warm themselves during winter months and care less about the
problems that result from their actions due to ignorance.
On the contrary, waste tyre is a resource that has multi-uses that are not well
researched and accorded the benefits they can provide in South Africa. Coal, which
is widely used in South Africa, is highly contributing to the Global Warming due to its
high carbon content that creates carbon dioxide and carbon monoxide (CO) in
chemical reaction and that is a major contributor to the green house effect. Major
industries are emitting more than they are supposed to in terms of Air Quality
Management Act, No. 39 of 2004. It is important that utilization of coal, which is one
of the main culprits as a source of greenhouse gases and ozone layer depleting
substance is minimized in South Africa. Waste tyres are successfully used by
14
developed countries in various applications and viable industries have developed
therefrom, however their use in South Africa is very minimal. It therefore becomes
imperative to find out why South Africa is not deriving the benefits from the waste
tyres as the developed countries. It is equally important to investigate the possibility
of generating new uses for waste tyres, which are peculiar or indigent to South
Africa.
Coal that is widely used in South Africa contains twice the fixed carbon that is in the
Tyre Derived Fuel. Furthermore, coal is a finite natural resource that is being
depleted. The rubber crumbs from tyres will also replace quarried gravel materials
that are also finite, difficult to find and also expensive to quarry and transport. The
resultant benefit of rubber crumbs will be the likely reduction in road noise through
absorption of sound by the rubber layer. Rubber crumbs derived from recycled tyres
are also used as additives to the bitumen to increase the durability of the surface
layers of roads and pavements structures. Rubber crumbs also increase the braking
and gripping efficiency of motor tyres when used on roads. Job creation from waste
tyre collection, transportation, recycling and applications of the recycled products will
positively improve the economic activities in South Africa. It is very critical that the
benefits of waste tyres are thoroughly researched and all the valuable information
brought to the fore for public information that will assist in business decisions while
also addressing environmental and social problems posed by waste tyres.
1.4 Aims and Objectives of the Research
The aims and objectives of the research project are:
15
• To critically identify environmental, socio-economic and legal factors that
contribute to the failure by the markets or institutions to develop or support the
sustainable management of waste tyres for use in recycling and for energy
generation purposes.
• In the process attempt to develop a “Model” that will stimulate waste tyre
management in developing countries.
• To identify opportunities for job creation from waste tyres.
The most important aspects to consider in this objective are:
(a) The impacts of waste tyre management problems on the environment.
Emphasis will be based on the studies, interviews, observation and existing
findings. The environmental impacts play a very critical role especially on the
World Trade Organization (WTO) as South Africa is a signatory. Participating
countries are required to adhere to stringent environmental standards like the
Rio Declaration and the Earth Summit, also the commitments of World
Summit on Sustainable Development held in South Africa, Kyoto Protocol and
the ISO 14000. This pertains to products that will be developed from the
waste tyres.
(b) Economics of the waste tyres. A waste tyre has no economic or commercial
value attached to it currently in South Africa while it has economic value in
developed countries. For a waste tyre to have value its economic or
commercial use must be developed through stimulation of the market forces.
There are several ways to stimulate the economic value and create the
markets. One of the ways is the subsidies to waste tyre disposal companies to
16
create the markets. For example, in the United States, companies that are
recycling waste tyres are provided with a grant to commission sustainable
plants like electricity generation from waste tyres and tyre derived fuels (TDF)
and that create markets for waste tyres. The second way is the disposal fee
paid by the generator of waste tyres. The other way is the taxation of waste
generation when enforcement is not practically executed. A portion of the
levies collected either by disposal fee or taxation is used to promote the
technologies that address waste tyres and as such markets for waste tyres
are being developed and expanded. In South Africa, an example can be cited
from the plastic bag levy that is intended to fund and promote plastic
recycling.
(c) Legal implication of waste tyres. In terms of legal capacity in developing
countries to enforce compliance of waste management where poverty is the
order of the day pose a very serious challenge. South Africa, like many
developing countries is confronted by many challenges ranging from health,
food security, education, industry development (technology), housing, water,
sanitation, etc. and least attention is however given to the environment. There
are no environmental courts where environmental violations are tried. Waste
tyre is a special type of waste and requires a special management procedure
for example storage and handling of waste tyres to be considerate of fire
hazard management, have sufficient drainage so that it does not provide a
breeding ground for mosquitoes. This procedure should be backed by
enforcement and supported by legislative imperatives.
17
• Provide long lasting potential opportunities in the waste tyre recycling industry.
Potential opportunities that could arise from the recycling of waste tyres will
be looked into and the findings made available to potential investors.
Products that could be made from the recycled waste tyres will be
researched. The important consideration in this case will be sustainable use in
the recycling industry. Research will focus on why the usage of waste tyres in
the recycling industry is not sustainable.
• Provide information on the possible use of waste tyre for business
(medium and large scale) development.
• Usage of waste tyres in an environmental, economic and socially friendly
manner will be investigated and the findings made known.
• Highlight the pollution problems posed by indiscriminate and illegal dumped
waste tyres in the country.
• It is the most important anticipation that solutions discovered or researched
will result in the approach that address pollution from waste tyres that plague
our country.
• To suggest ways by which waste tyres could be turned into valuable
resources.
1.5 Research Hypothesis
The approach to waste tyre management in South Africa should be to encourage the
development of an innovative tyre recycling industry that creates a demand for waste
tyres, give them value and develop sustainable markets. In commercial perspective,
the ultimate objective of South African strategy should be to develop a strong
diversified industry capable of using all waste tyres generated in the country from
18
various applications. At the moment however, there are no economic incentives for
collectors and recyclers of waste tyres, hence a failure in the process industry to
access waste tyres to develop products. In essence, appropriate Waste Tyre
Management in the country should involve a high percentage of waste tyres being
recycled and or used as energy source.
Hence it is hypothesized that:
(a) Socio economic factors contribute to the problems of waste tyre management
in South Africa.
(b) Environmental and legal factors also contribute to waste tyre management
problems in South Africa.
(c) Waste tyre utilization and recycling will reduce environmental pollution as well
as create wealth and economic development.
19
CHAPTER 2
2.1 Review of Literature
The starting point to the understanding of the complexity and challenges of waste
tyre management is by providing a general overview of the past and existing
information with regards to waste tyre utilization both nationally and internationally.
This will show or indicate the gaps that exist so that possible solutions and
recommendations can be provided. Generally, research work into the menace of
waste tyres has largely focused on the economics and Law of Disposal of Solid
Waste (Stedge, 1996). Stedge (1996, p43); cited paper by Fullereton and Kinnaman
(1995) that where enforcement is assumed to be non-feasible for municipal waste
disposal, a subsidy than tax as an economic instrument for disposal companies
where illegal disposal is a possibility, is found to be more efficient and effective.
Dinan (1992), cited by Stedge (1996) discusses the potential effects of a disposal tax
and reuse subsidy. Under this policy, producers will be taxed according to the cost of
disposing the waste emanating from the goods they produce. In South Africa,
disposal companies are costing disposal of waste based on the distance to the
disposal site and the cost of landfill operation. However, hazardous waste disposal is
additionally charged for the hazard rate and the treatment method used .
In relation to tax, companies that use recycled material receive a subsidy. This
programme can be expensive to implement for all products, hence may be used to
target specific problematic waste streams like waste tyres (Rudolph, 1995). In South
Africa, there are no tax incentives for using recycled material (DEAT, 2008). At the
moment, discussions are on-going between the government and the private sector
regarding the tax incentive for the use of recycled material; however legislative
20
reform has taken effect to a certain level. A reference is made specifically to the
amendment of Environment Conservation Act, 73 of 1989 (Amendment of section 24
i.e. insertion of section 24(i)). The section give effect to the imposition of compulsory
charging, deposit or related financial measures on waste streams or specified items
in waste streams by Minister of Environmental Affairs with the concurrence of the
Minister of Finance. It is important to note that demand for recycled products is
dependent on:
(a) Price: In most cases recycled products are more expensive than virgin
products. For example, the 1993 price of recycled paper in Central
Pennsylvania was $10.35 more per cartoon than paper produced from virgin
pulp (Stedge, 1996). In reality, the opposite is expected to hold.
(b) Environmental conscience: In countries where awareness on environmental
issues is high, people tend to take convictions to support initiatives that
persuade environmental cause like recycling. People feel that it is through
their actions and activities that the future generations will inherit the
environment that is habitable.
(c) Perception associated with recycled products: There is a perception,
especially in developing countries such as South Africa that recycled products
like recycled paper, plastics and glass are of poor quality. This could be true
in some cases, because some recycling companies do not perform quality
assurance checks on the recycled products and thus are assumed to be of
lower quality. There is a need for recycling industry and standardization
21
institutions to change this perception and ensure transparency with respect to
quality checks that are carried out on recycled products.
2.2 Recycling of Waste Tyres
Recycling of waste tyres is a business like any production process where economic
efficiency is central to sustainability (Sharma, et al., 2000). Environmental
consideration is another integral factor, although it is not the sole driver of the
initiative. Energy or resource economics might be the determinants of resource
recycling. In the interest of the environment, governments are putting measures to
integrate environmental management into the production process of all business
initiatives (Scott, 1998). As a result, reuse and recycling of resources is not by choice
but in the interest of environmental protection. Consequently, recycling of any
material in a sustainable manner requires the critical consideration of:
(1) Economic growth and
(2) Environmental protection
It is crucial that a balanced between these considerations is attained. The use of
cost – benefit analysis in environmental policy can be used to strike a balance
between the economic growth and environmental management. International trends
show renew use of cost benefit analysis (Rudolph, 1995). Whenever a government
choose a method of recycling, economic efficiency is key in the decision. Economic
efficiency is categorized as follows:
(a) Allocative efficiency: Companies produce products where marginal social
cost of production equals the marginal social benefits. Allocative efficiency is at
the equilibrium price where suppliers of commodities like recycled waste tyre
22
products are enticed to just supply enough to get the market cleared as the
products are being sold. The supply balances the demand hence; there is no
noticeable surplus or shortage.
Critical economic considerations in this efficiency are surplus and shortage.
These are the most poorly understood and misused terms. Surplus exists only
when the price of a commodity is too high to clear the market. That means the
commodity suppliers are willing to sell at that price which exceeds the quantity
demanded at the price. Shortage exists when there is an excess demand for a
commodity in a market. Excess demand can be caused by either the price of
the commodity being too low or positive change in consumption pattern for a
commodity. Positive change may include the diminishing of substitutes in the
market place, health choice consciousness, and sudden economic
improvement of the communities.
Surplus and shortage can be eliminated when the price of recycled products is
accordingly adjusted as follows:
Surplus can be eliminated when the price of recycled products is reduced to a
market clearing level and the shortage addressed when the price of recycled
products is increased to the market clearing level. In these circumstances,
equilibrium will be achieved when available commodities will be distributed to
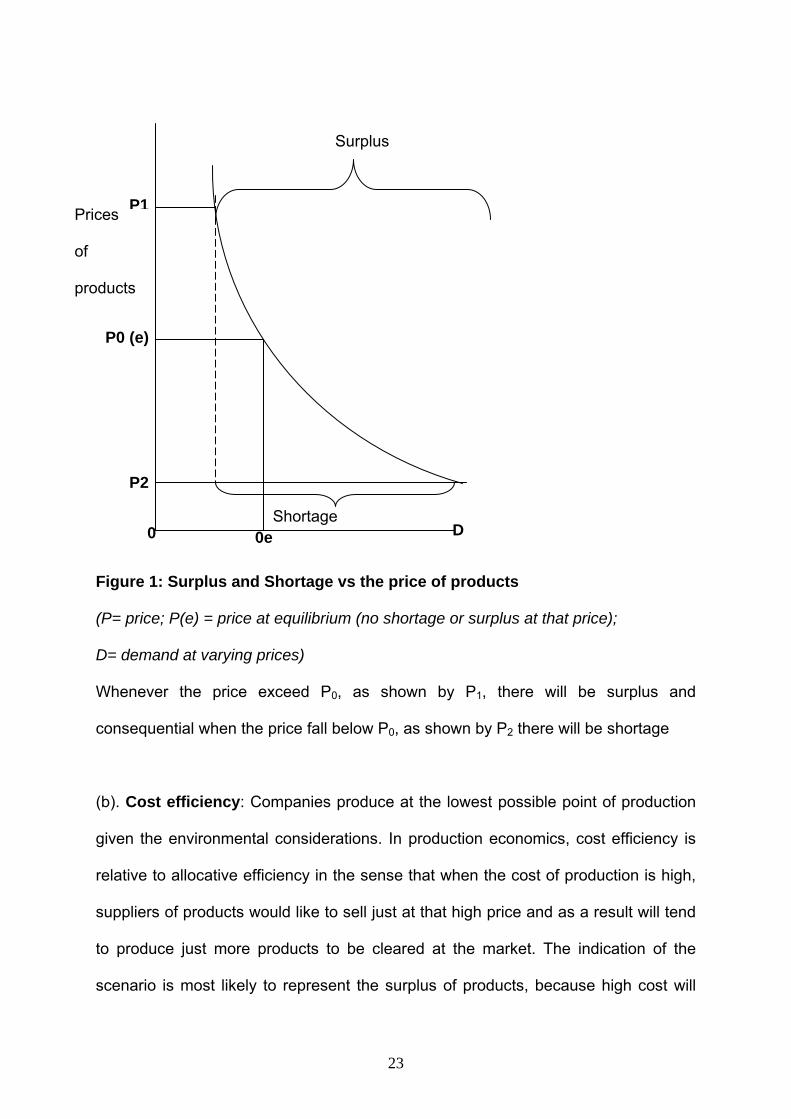
the available capable buyers. In essence, the price determines the resource
allocation function. This is illustrated in Figure 1 as shown below.
23
Surplus
Prices
of
products
Figure 1: Surplus and Shortage vs the price of products
(P= price; P(e) = price at equilibrium (no shortage or surplus at that price);
D= demand at varying prices)
Whenever the price exceed P0, as shown by P1, there will be surplus and
consequential when the price fall below P0, as shown by P2 there will be shortage
(b). Cost efficiency: Companies produce at the lowest possible point of production
given the environmental considerations. In production economics, cost efficiency is
relative to allocative efficiency in the sense that when the cost of production is high,
suppliers of products would like to sell just at that high price and as a result will tend
to produce just more products to be cleared at the market. The indication of the
scenario is most likely to represent the surplus of products, because high cost will
P1
D
P0 (e)
P2
0e 0 Shortage
24
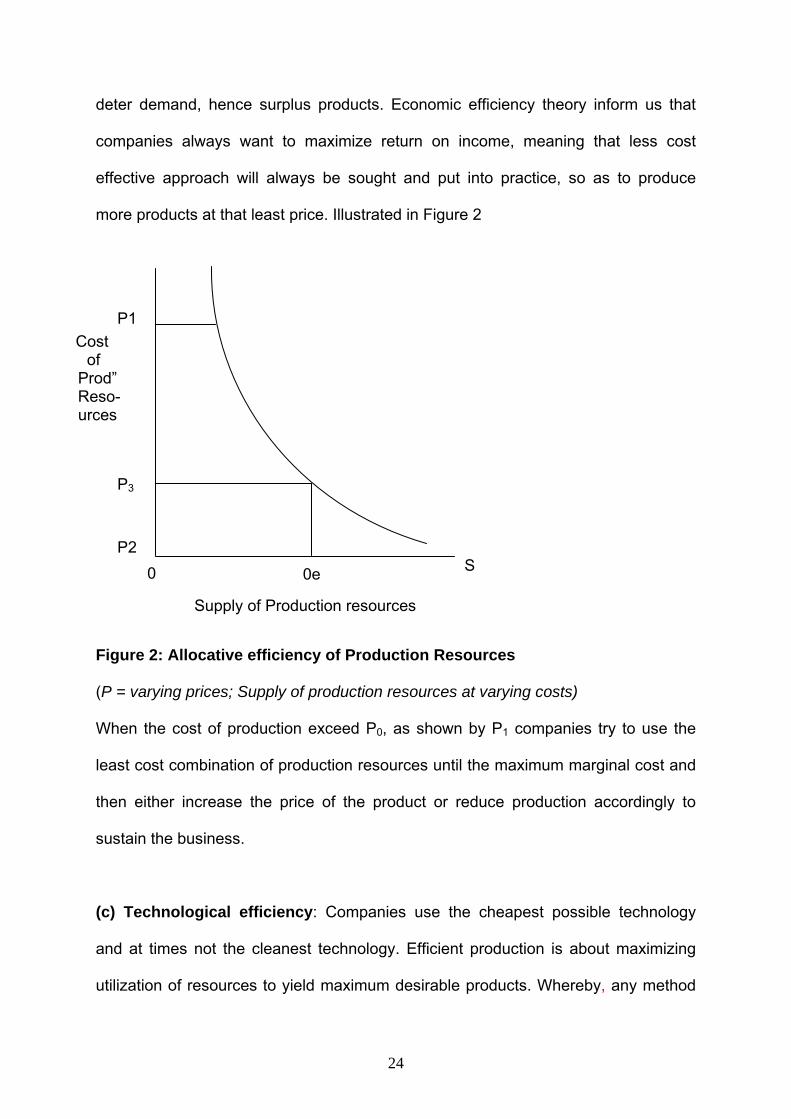
deter demand, hence surplus products. Economic efficiency theory inform us that
companies always want to maximize return on income, meaning that less cost
effective approach will always be sought and put into practice, so as to produce
more products at that least price. Illustrated in Figure 2
Figure 2: Allocative efficiency of Production Resources
(P = varying prices; Supply of production resources at varying costs)
When the cost of production exceed P0, as shown by P1 companies try to use the
least cost combination of production resources until the maximum marginal cost and
then either increase the price of the product or reduce production accordingly to
sustain the business.
(c) Technological efficiency: Companies use the cheapest possible technology
and at times not the cleanest technology. Efficient production is about maximizing
utilization of resources to yield maximum desirable products. Whereby, any method
S
P3
P2
0e 0
Supply of Production resources
P1 Cost of Prod” Reso- urces
25
of production that will maximize output and minimize costs using the best possible
technology is seen to be technologically efficient. Cleaner production methods that
yield benefits over time and are environmental sensitive are most often seen as the
expensive technologies. For a technology to be efficient, it must be weighed in
terms of economics and environmental management. Developed countries such as
Denmark, Finland, Sweden, Japan, United Kingdom and the United States of
America are developing more technologies that are efficient in both economics and
environmental terms. Technologies such as “scrappers” (entrapping of particulates,
compounds e.g. furans and SO2 from incineration of waste tyres in cement kilns are
seen to be cleaner technologies in terms of environmental protection.
There is no legislation in South Africa that encourage recycling; hence recycling of
waste is voluntary and non–mandatory. Waste Tyre Regulation state that any person
who undertakes an activity involving the re-use, recycling or recovery of waste tyres
must, before undertaking that activity, ensure that the re-use, recycling or recovery of
waste tyres to the extent that it is possible, is less harmful to the environment than
the disposal of such waste tyres (DEAT, 2008). As a consequence, waste tyres stock
piles continue to rise unabated. There are no systems in place to entice or compel
the industry to recycle waste tyres, neither to look into the product designs so that
they can be recycled. However, there are discussions taking place between the
industry and the government to regulate stockpiling and the disposal of the waste
tyres. Recycling of waste tyres is in the centre of the discussions. The main issue is
that, if the industry does not realize benefits from recycling waste tyres, they will be
reluctant to participate in the programme of recycling (Liaskos, 1994). Hence, it is
crucial that government take the lead in creating conducive conditions for the
26
creation of the markets for the recycled tyre products. Creating conducive conditions
will require developing appropriate policies for example green procurement policy
that encourage the use of recycled goods, legislative support and incentives to
encourage participation by business. Incentives may include tax breaks for using
recycled tyres, subsidies to encourage use of waste tyres and also preferential
treatment for recycling waste tyres. The industry is also required to commit to social
responsibility to ensure that the products they produce/ manufacture do not
compromise the environment and impact negatively on the social being of the
communities. The developed countries such as the United States of America recycle
waste tyre to derive various products that are value adding. Some of these
processes are as follows:
(i) Civil Engineering Applications
One of the fastest growing markets in the United States is the use of waste tyres in
civil engineering applications (STMR, 1994). The process can be called physical
application because the waste tyre does not undergo any chemical process where
the structure (thermosetting materials) is broken down.
The waste tyre can be used whole or chipped in the following applications:
- Clean fill, gravel and sand. (Waste tyres are used as they are without physical
or chemical processing). In this regard, waste tyres are used as light weight
back fill, as road embankment fill, as leachate collection system and as septic
field drainage material. Others include:
- Artificial reefs
- Floating Breakwaters
- Erosion control
27
- Silage production. Here tyres are used to hold plastic sheeting
- Landscaping. There is some use of waste tyres as a base for landscaping in
raised garden beds and cascading rock gardens.
- As alternative landfill daily cover
- As thermal insulator along housing foundations
(ii) Ground Rubber Applications
Waste tyres can be processed into products known as ground rubber or alternatively
called rubber crumbs. The crumbs can vary from particle size of about 18 mm to 150
microns. The use thereof would be a function of size and shape (Edwards and
Smith, 1997). Large materials (12.5 mm to 18 mm) are used as cover material for
play grounds, as soil conditioner and as synthetic turf. Larger size rubber particles
(4- 16 mesh) are used in asphalt binding which is the largest market for ground
rubber. Ground rubber in the 20 – 80 mesh sizes is incorporated into a wide range of
manufactured products, including but not limited to mats and carpet backing. The
ultra fine mesh e.g. 100 mesh and below is used in tyre manufacturing. This is the
second largest market application for ground rubber. The following are notable
applications for ground rubber:
- Road surfacing
- Rubberized bitumen and asphalt
- Incorporation into rubber and plastic products
- Molded and Extruded rubber products
- Synthetic turf
- Protecting coatings
- Industrial flooring
28
- Building materials
- Traffic guide posts
- Soil conditioner
- Production of new tyres
(iii) Chemical process applications
One of the serious challenges facing the environment globally is the disposal of
rubber waste. Rubber, due to its chemical composition, does not decompose easily.
A waste rubber need very long time (over 10 years) for natural degradation due to
cross-linked structure and the presence of stabilizers and other additives such as fire
retardants, colorants and plasticizers that are added to enhance product properties
and performance (Adhikari et al., 2000).
The well documented and researched method of chemical processing of waste tyres
is the Cryogenic process (Aldhikari et al., 2000). The rubber chips are placed into
the liquid nitrogen for a specified period depending on the required particle size. The
particle size of cryogenically ground powder varies between 30 to 100 mesh for most
products (Adhikari et al., 2000). It has been found that up to 10 percent of
cryogenically crumb rubber in the passenger and truck tyre compounds during
manufacturing show some economic benefit. The economic benefit for the modest
usage (5%) in passenger and truck tyres has been estimated at approximately $0.10
and $0.54 per tyre, respectively (Adhikari et al., 2000). At the 10% usage, the benefit
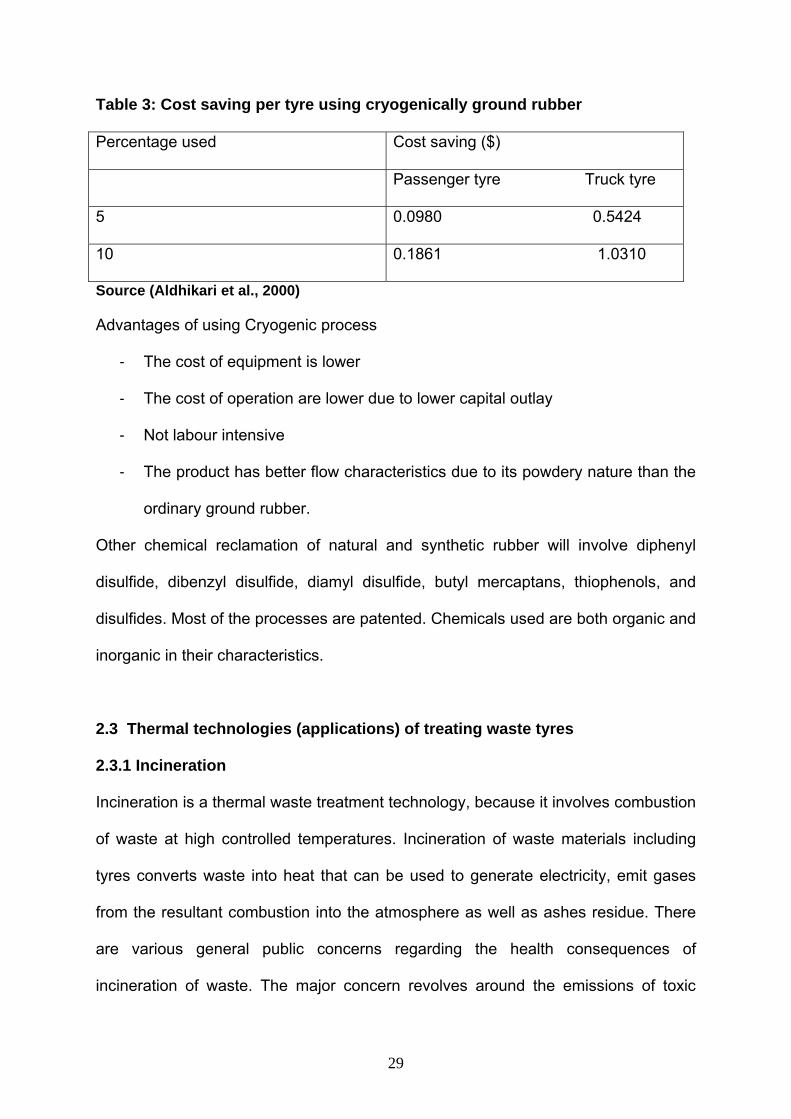
almost doubles as shown in Table 3.
29
Table 3: Cost saving per tyre using cryogenically ground rubber
Percentage used Cost saving ($)
Passenger tyre Truck tyre
5 0.0980 0.5424
10 0.1861 1.0310
Source (Aldhikari et al., 2000)
Advantages of using Cryogenic process
- The cost of equipment is lower
- The cost of operation are lower due to lower capital outlay
- Not labour intensive
- The product has better flow characteristics due to its powdery nature than the
ordinary ground rubber.
Other chemical reclamation of natural and synthetic rubber will involve diphenyl
disulfide, dibenzyl disulfide, diamyl disulfide, butyl mercaptans, thiophenols, and
disulfides. Most of the processes are patented. Chemicals used are both organic and
inorganic in their characteristics.
2.3 Thermal technologies (applications) of treating waste tyres 2.3.1 Incineration Incineration is a thermal waste treatment technology, because it involves combustion
of waste at high controlled temperatures. Incineration of waste materials including
tyres converts waste into heat that can be used to generate electricity, emit gases
from the resultant combustion into the atmosphere as well as ashes residue. There
are various general public concerns regarding the health consequences of
incineration of waste. The major concern revolves around the emissions of toxic
30
compounds such as dioxins, mercury, cadmium, nitrous oxide, hydrogen chloride,
sulfuric acid, fluorides and particulates that can be inhaled and magnify or stay
permanently in our lungs. They can cause an array of diseases like asthma and
cancer. Incineration of waste in conventional terms means that when you burn
something it goes away. Scientifically in physical law, we know that matter does not
go away but change its state of matter. It is known that heavy metals like arsenic,
lead, mercury, chromium and organic chemicals such as polycyclic aromatic
hydrocarbons, dioxins and furans; radioactive materials are not destroyed by
incineration.
They are however; vapourized and released through the smoke stack into the
environment or alongside the ash coming out as waste causing the resultant ash to
be toxic. The volume of waste is sometimes reduced but the material still remain
hazardous. Incinerators in South Africa, like any developing countries are not yet
compliant to the International Standards such as Directive 2000/76/EC of the
European Parliament. There have been many non compliant cases investigated by
Air Quality Management Inspectors of South Africa. In developing countries like
South Africa, Botswana, and Swaziland cement kilns are not yet using scrubber
process to address the toxic emissions into the atmosphere.
Waste tyres are not yet used in the cement kilns in the country although the industry
is challenging the government to give them the opportunity to tap into the cheap
waste. This will however, exacerbated the situation with a lot more toxic emissions
into the atmosphere. The current situation is the use of low grade coal in the cement
31
kilns. Gases such as dioxins, furans, sulphur-dioxide, nitrogen oxide, hydrogen
chloride and carbon dioxide are emitted unabated into the atmosphere.
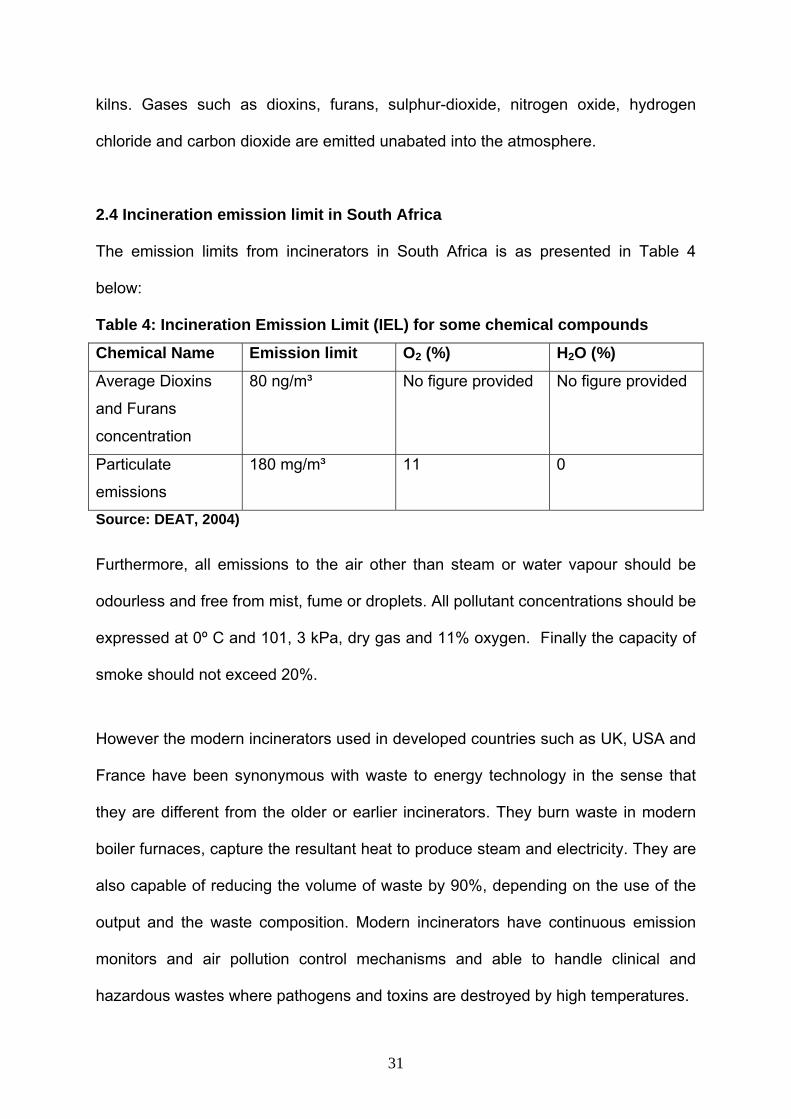
2.4 Incineration emission limit in South Africa
The emission limits from incinerators in South Africa is as presented in Table 4
below:
Table 4: Incineration Emission Limit (IEL) for some chemical compounds
Chemical Name Emission limit O2 (%) H2O (%)
Average Dioxins
and Furans
concentration
80 ng/m³ No figure provided No figure provided
Particulate
emissions
180 mg/m³ 11 0
Source: DEAT, 2004) Furthermore, all emissions to the air other than steam or water vapour should be
odourless and free from mist, fume or droplets. All pollutant concentrations should be
expressed at 0º C and 101, 3 kPa, dry gas and 11% oxygen. Finally the capacity of
smoke should not exceed 20%.
However the modern incinerators used in developed countries such as UK, USA and
France have been synonymous with waste to energy technology in the sense that
they are different from the older or earlier incinerators. They burn waste in modern
boiler furnaces, capture the resultant heat to produce steam and electricity. They are
also capable of reducing the volume of waste by 90%, depending on the use of the
output and the waste composition. Modern incinerators have continuous emission
monitors and air pollution control mechanisms and able to handle clinical and
hazardous wastes where pathogens and toxins are destroyed by high temperatures.
32
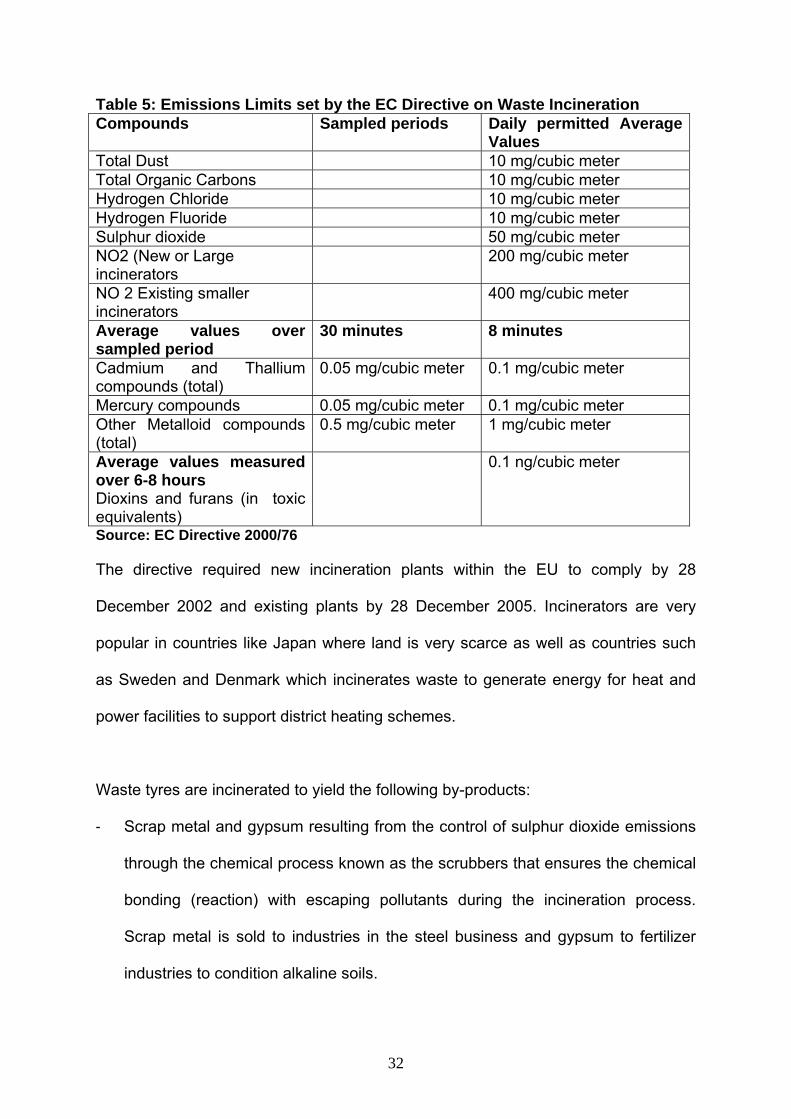
Table 5: Emissions Limits set by the EC Directive on Waste Incineration Compounds Sampled periods Daily permitted Average
Values Total Dust 10 mg/cubic meter Total Organic Carbons 10 mg/cubic meter Hydrogen Chloride 10 mg/cubic meter Hydrogen Fluoride 10 mg/cubic meter Sulphur dioxide 50 mg/cubic meter NO2 (New or Large incinerators
200 mg/cubic meter
NO 2 Existing smaller incinerators
400 mg/cubic meter
Average values over sampled period
30 minutes 8 minutes
Cadmium and Thallium compounds (total)
0.05 mg/cubic meter 0.1 mg/cubic meter
Mercury compounds 0.05 mg/cubic meter 0.1 mg/cubic meter Other Metalloid compounds (total)
0.5 mg/cubic meter 1 mg/cubic meter
Average values measured over 6-8 hours Dioxins and furans (in toxic equivalents)
0.1 ng/cubic meter
Source: EC Directive 2000/76
The directive required new incineration plants within the EU to comply by 28
December 2002 and existing plants by 28 December 2005. Incinerators are very
popular in countries like Japan where land is very scarce as well as countries such
as Sweden and Denmark which incinerates waste to generate energy for heat and
power facilities to support district heating schemes.
Waste tyres are incinerated to yield the following by-products:
- Scrap metal and gypsum resulting from the control of sulphur dioxide emissions
through the chemical process known as the scrubbers that ensures the chemical
bonding (reaction) with escaping pollutants during the incineration process.
Scrap metal is sold to industries in the steel business and gypsum to fertilizer
industries to condition alkaline soils.
33
- Fly ash will be used by reclaiming companies to recover zinc sulphate, lead and
cadmium for various applications like motor car batteries.
- The bottom part of the fly ash contains significant quantities of iron oxide that
could be sold to cement kilns.
- The steam that can produce up to 11.5 megawatts per hour can also be sold to
the local power generator or can be used for local heating systems.
Table 6: Concentration limits of some pollutants present in tyres
Chemical name Max. concentration measured in the chimney
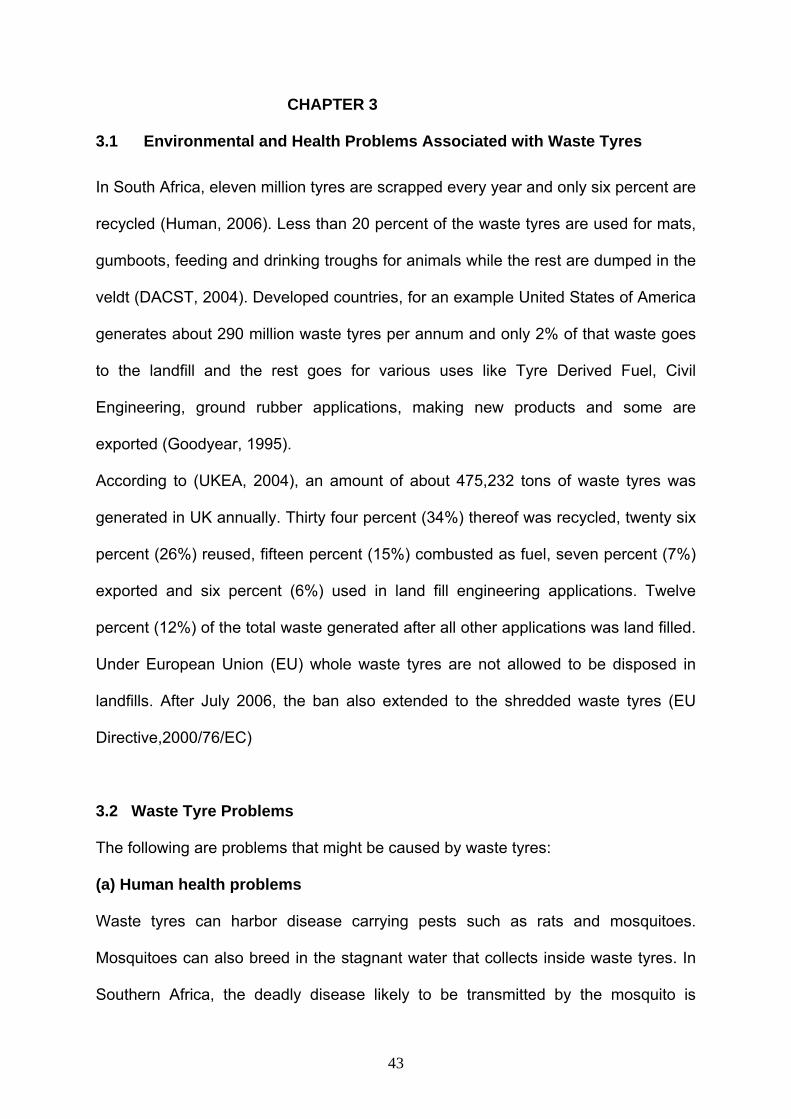
(PCBs), arsenic, cadmium, nickel, mercury, zinc, chromium and vanadium are
released into the atmosphere.
Figure 3: Burning of waste tyres creating air and soil pollution; (Photograph by Researcher, 2003) Water Pollution: Tyre combustion causes pyrolysis of the rubber, resulting in oily
decomposition waste (Reisman, 1997). The oily discharge can flow into nearby
streams, ditches and waterways or can leach into the ground water. In cases where
water is used to put out the fire, chemical compounds like aromatic liquids and
paraffin may be carried by the water. Then the used water needs to be treated,
before it is disposed of, which does not often happen in practice (Hoddinott, 1997).
The situation can pollute nearby streams or may seep into the ground water.
Soil Pollution: Residues that remain on the soil after a fire can have an impact on
the environment in two ways:
46
- Immediate pollution resulting from decomposing liquid products
penetrating the soil.
- Gradual pollution caused by leaching of ash and unburned residues (UK,
Chemical Hazard Report, 2003).
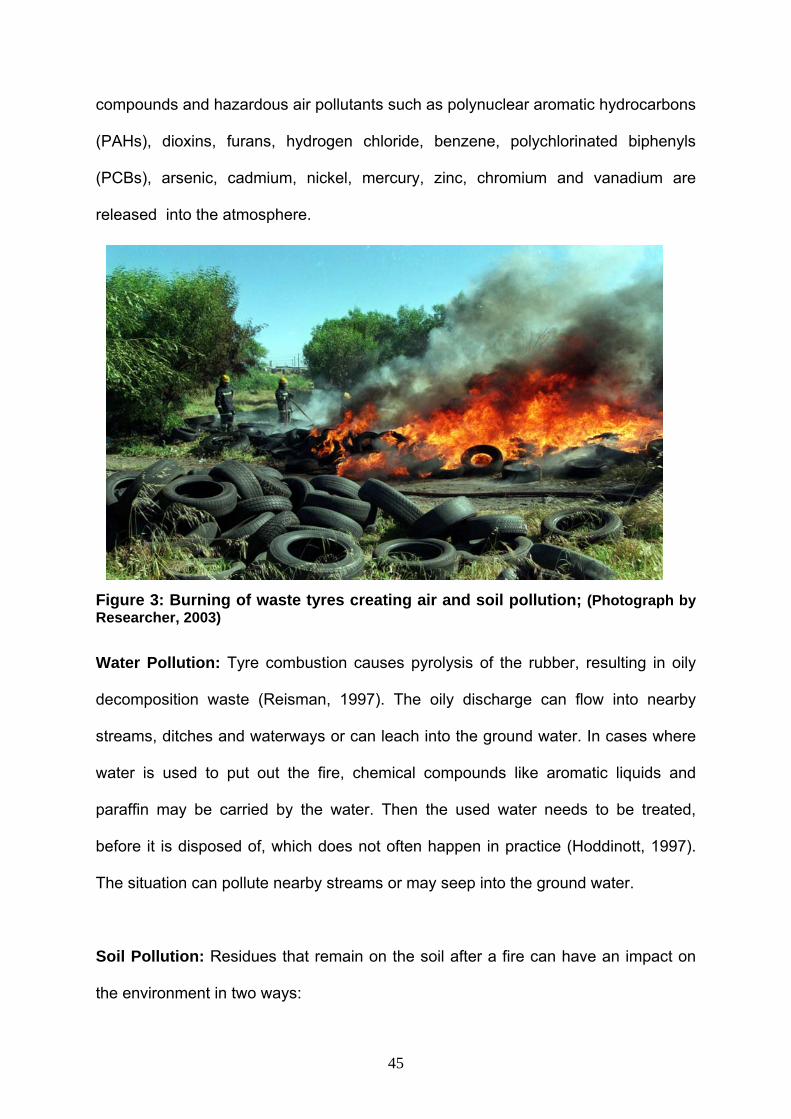
Gradual leaching of oily discharge can occur and the toxic residues of the burnt tyre
such as zinc salts can cause harm to fauna and flora (Humphrey et al., 1997). As
shown in Figure 4 below, it will take some time for the contaminated soil to recover
unless remediation and or rehabilitation measures are taken.
Figure 4: An example of polluted soil from waste tyre burning; (Photograph by Researcher, 2006) 3.3 POSSIBLE OPPORTUNITIES THAT CAN CREATE WEALTH AND JOBS FROM WASTE TYRES. Given the favourable economic conditions in South Africa, that can be supported and
facilitated through appropriate legislative frameworks, and the commitment through
47
collaboration between the tyre industry and government, it is firmly believed that
waste tyres have an inherent value that can be enhanced commercially to yield
viable products and by products. Reviewed in detail, the recycling of waste tyre is
considered in terms of economics and the hierarchy of environmental management
alternatives which is Reduce, re-use, recycle and recover. However markets are key
to the success and sustainability of waste tyre industry. The main markets for waste
tyre are:
• Cement Kilns
Due to the better caloritic value of tyres compared to the low grade coal used in the
cement industry, waste tyres are preferred. The metal strap in tyres adds iron that
is required in the cement kilns which coal does not provide. This is another
advantage of a waste tyre than coal.
• Electricity Generating Utilities
Waste tyres can also replace finite resource like coal. They have a better burning
efficiency and heat value than coal. So they can be used in the power generating
plants provided their collection is coordinated and there is a constant supply.
• Paper and Pulp mills
In the United States of America, Waste Tyre Fuels (Tyre Derived Fuels or TDF) are
the most preferred fuel enhancement. North Carolina in the U.S is used as a case
study where 5.4 million waste tyres would be used as supplemental fuel in pulp and
paper mill boilers and cement kilns (Barlaz, et al., 1993).
48
• Waste Tyre to Energy Recovery Plants
The largest use of waste tyre is in the energy recovery, where the TDF is the main
objective of waste tyre processing. U.S is leading the developed countries on
energy generation from waste tyres (Sharma, et al., 2000).
• Brick Making
In brick making, waste tyres are utilized in the furnaces to create heat used to dry
the bricks, so that more bricks are ready for use in shorter periods.
• Boiler systems
In the mining sector, where warm water is continuously used, waste tyre could be
put in better use to heat water than the continued use of electricity which is in short
supply in South Africa.
• Road construction industry
In South Africa, it is still a limited market, because waste tyre collection is not
coordinated for continous market supply. Furthermore, there is no legislation that
compels tyre centres to accept waste tyres, hence, are dumped illegally in the veld.
• Miscellaneous industry
Waste tyres are used in various applications such as under floor carpet, sport fields
wheels, knee caps for mines, reclaimed rubber to replace virgin rubber in new tyre
making, buffer rubber to retreat tyres. Pictoral representation of some applications
of waste tyres are as follows:
49
Fig 5: Floor mat and turf made from waste tyres; (Source: picture taken from a local company, 2008)
Fig. 6: Rubber mats made from waste tyres; (Source: picture taken from a local company, 2008)
50
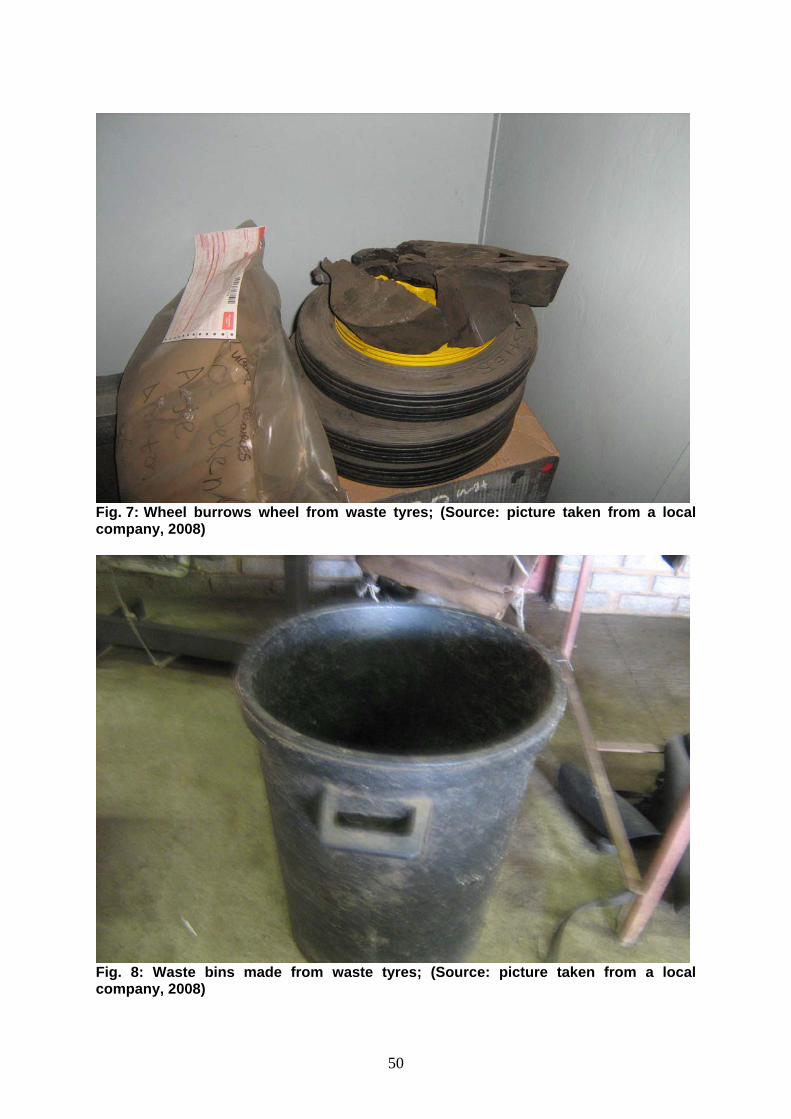
Fig. 7: Wheel burrows wheel from waste tyres; (Source: picture taken from a local company, 2008)
Fig. 8: Waste bins made from waste tyres; (Source: picture taken from a local company, 2008)
51
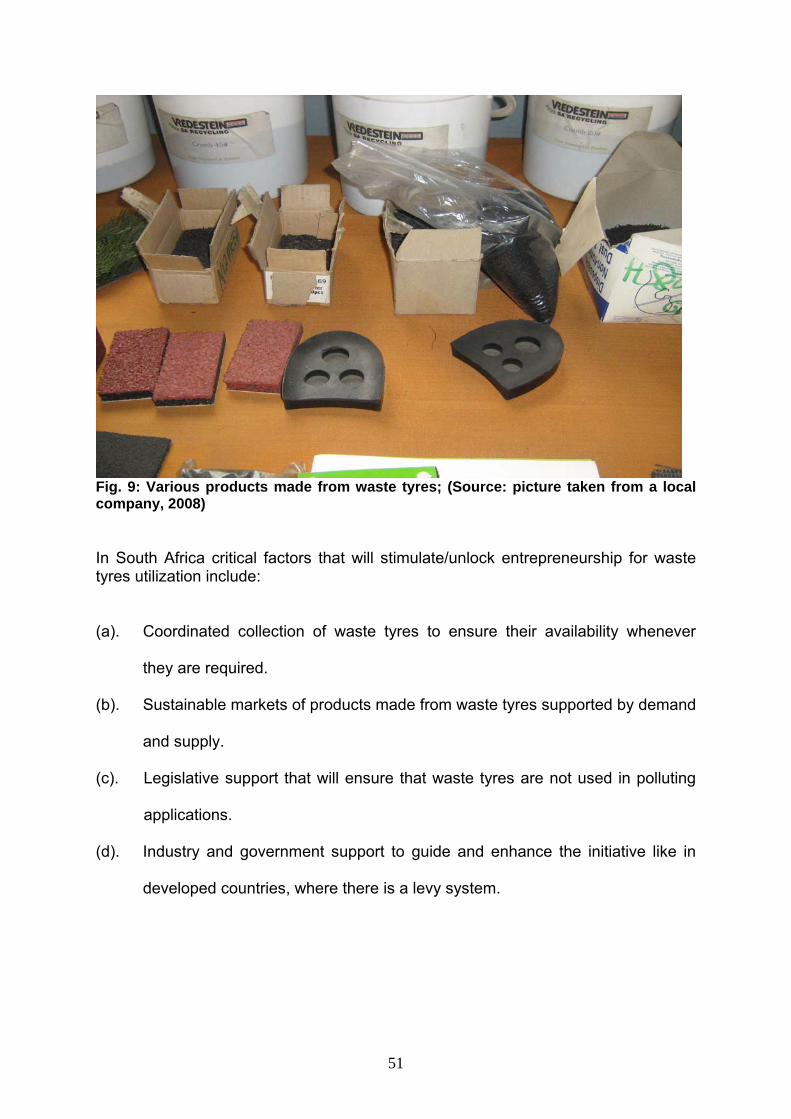
Fig. 9: Various products made from waste tyres; (Source: picture taken from a local company, 2008) In South Africa critical factors that will stimulate/unlock entrepreneurship for waste tyres utilization include:
(a). Coordinated collection of waste tyres to ensure their availability whenever
they are required.
(b). Sustainable markets of products made from waste tyres supported by demand
and supply.
(c). Legislative support that will ensure that waste tyres are not used in polluting
applications.
(d). Industry and government support to guide and enhance the initiative like in
developed countries, where there is a levy system.
52
3.4 OTHER PRODUCTS THAT CAN BE PRODUCED FROM WASTE TYRES
There are over two hundred products that can be manufactured from waste
tyres. The important ones can be enumerated as follows:
• Fabricated products
Examples in this category are mat compounds, boots, shoe soles, rubber
crumbs in road construction, dock bumpers, carbon black, reclaimed rubber
for use in new tyre making, buffer products for use in reconditioned tyres,
knee caps for use in mines, mine blasting bags, belts, gaskets, waste bins,
wheel-burrow wheels and washers.
• Civil Engineering
Examples of products in this category include road fills, landfill leachate
collection systems, landfill cell daily covers, septic systems leach fields and
crumbs mixed with asphalt in roads enhancement and construction.
• Agriculture
In this category the following are examples Animals feeding and drinking
troughs, farm dam walls and as fill in horse stables to create mat finish.
• Miscellaneous
Other examples of applications are backyard swings, flower pots, tyre walls,
race track crush barriers.
53
CHAPTER 4
4.1 RESEARCH DESIGN AND METHODOLOGY
4.1.1 Survey area
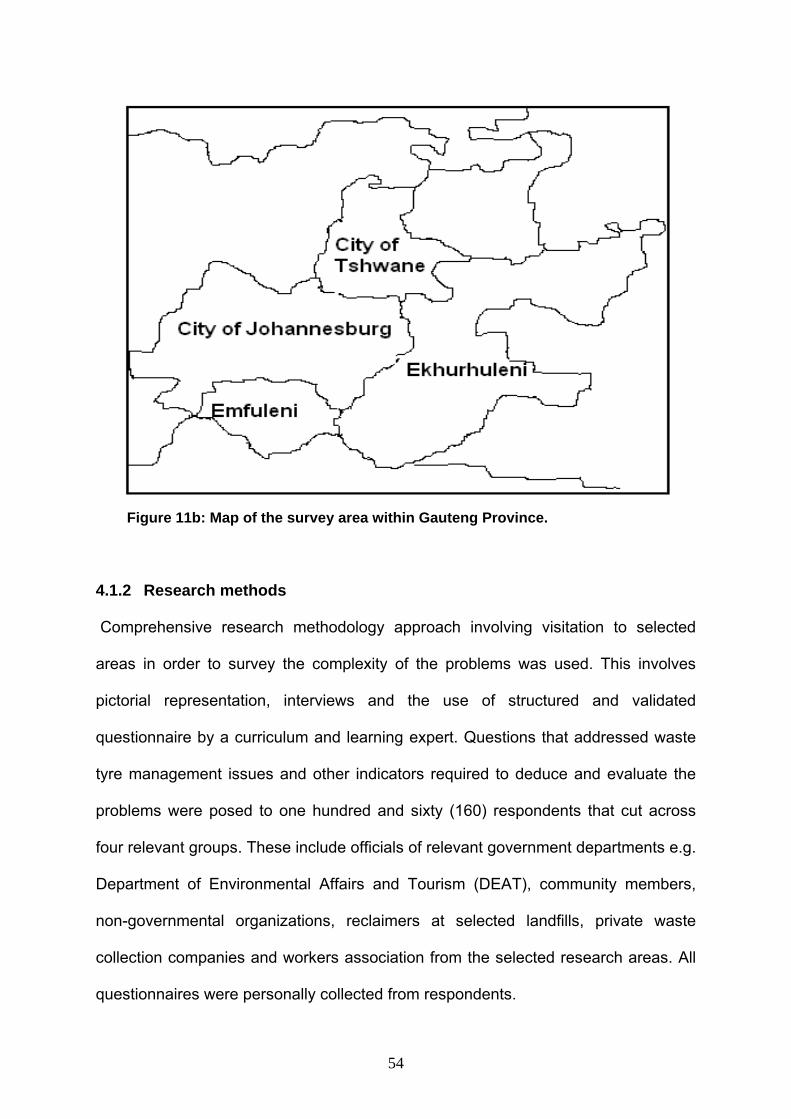
Sampling areas where the survey was conducted are Johannesburg, Ekurhuleni,
Emfuleni and Tshwane municipalities within Gauteng Province. The latter is referred
to as the commercial heartland of South Africa with the highest investment;
population density as well as number of automobiles hence could be regarded as the
most appropriate sampling sites for the investigation. These areas were carefully
studied and selected as a result of the complexity and the magnitude of the problem.
The standard practice in dealing with waste tyres was evaluated including waste
tyres that are illegally dumped, stock piled and thrown into the veldt. Figure 11a
illustrate the map of South Africa and the nine provinces that constitute the country
while Figure 11b show the survey area within Gauteng province.
Figure 11a: Map of South Africa and the nine provinces
54
Figure 11b: Map of the survey area within Gauteng Province. 4.1.2 Research methods
Comprehensive research methodology approach involving visitation to selected
areas in order to survey the complexity of the problems was used. This involves
pictorial representation, interviews and the use of structured and validated
questionnaire by a curriculum and learning expert. Questions that addressed waste
tyre management issues and other indicators required to deduce and evaluate the
problems were posed to one hundred and sixty (160) respondents that cut across
four relevant groups. These include officials of relevant government departments e.g.
Department of Environmental Affairs and Tourism (DEAT), community members,
non-governmental organizations, reclaimers at selected landfills, private waste
collection companies and workers association from the selected research areas. All
questionnaires were personally collected from respondents.
55
4.1.3 Design of Questionnaire
The design of the survey questionnaire has been done in principle as follows:
A: The type of information that is required from the respondents was determined in
relation to the objectives of the research study. An intuitive approach was used in
terms of how the respondents should provide the answers. For example, single or
multiple responses could be provided where the respondent gives one or more
answers for a single question (see Appendix 1).
B: Questions were phrased in simple sentences and as simple as possible for
adequate understanding by respondents. It is believed that understanding of the
questions and the intention of the research are very vital to achieving the aims of the
study. Technical and ambiguous words and phrases were avoided so that ordinary
person can read and understand the questions.
C: Questions were arranged in a logical manner that allows sequential flow of
questions and the intention of the researcher with respect to the aims of the study.
Ideally, questions that are posed to respondents should be meaningful and relevant
in such a way that the purpose of the questions and how they are linked to each
other are revealed. In doing this, the direction of the study would be clear and allow
the respondent to be at ease when answering and filling the questionnaire.
D: The questions have to be specific and unambiguous. The respondent should not
guess as to what the researcher wants but has to understand the questions
explicitly. It is however, important that after the questionnaire is designed and before
56
distribution to the sampled group of sectors of respondents, it is weighed against the
hypothesis being verified.
4.14 Validation of the questionnaire
It is very important for questionnaire to be used in a study of this magnitude to
undergo validation. This ensured the acceptability and applicability of the research
instrument. It also ensured the validity and correctness of the result obtained from
the use of the tool. Subsequently, the questionnaire was sent to qualified personnel
at the Institute of Curriculum and Learning Development (ICLD) of the University of
South Africa. This was adequately scrutinize, corrected and validated for use as
research instrument for the intended study.
4.1.5 Sampling
Sampling is a technique in interpolation used to rationalize the collection of
information whereby an acceptable approach is chosen to collect the actual
information. The instances or institutions where information was obtained are those
that have frequent dealings with waste tyres. Not many institutions in South Africa
deal with waste tyres. According to Leedy (1997), sampling is the process of
choosing from a much larger population, a group which researchers wish to make a
generalized statement so that the selected part will represent the whole group. The
sample was therefore responsibly and sensitively selected so that a group of people
being researched / studied is faithfully and truthfully relevant. It is critical that the
selections of the groups in the sample are done correctly. It does not matter how
best the collection of the data is, as long as the sampling is not correctly done, the
generalization will not be accurate.
57
4.1.6 Data Collection
As mentioned earlier, the empirical instrument used for this quantitative research to
gather the required data was the questionnaire. This was complemented with visual
field observations and interviews by the researcher. One hundred and sixty (160)
questionnaires were distributed to respondents in the identified research areas
during October 2007. Collection and return of questionnaires spaned a period of 4-5
months (November 2007- March 2008) in order to allow for sufficient follow up time
for receipt of completed questionnaires. Twenty (20) questionnaires were distributed
to people and individuals representing the following categories or organizations:
1. Relevant government environment departments involved in waste
management at national, provincial and local level.
2. South African Tyre Recycling Process company (SATRP) consisting of waste
tyre recyclers, tyre retreaders, tyre dealers association, tyre manufacturers
association, informal tyre dealers and cementious association of South Africa
representing cement kilns.
3. Community members residing in the following municipalities: Emfuleni,
Tshwane Metropolitan, Ekurhuleni Metropolitan as well as Johannesburg
Metropolitan of Gauteng province.
4. Four Environmental Centers of non-governmental organizations in Ekurhuleni,
Johannesburg, Tshwane and Emfuleni municipalities of Gauteng province.
5. Reclaimers at the landfills in Tshwane, Johannesburg, Emfuleni and
Ekurhuleni municipalities of Gauteng province.
6. Private waste collection companies in Emfuleni, Tshwane, Johannesburg and
Ekurhuleni municipalities of Gauteng province.
58
Respondents were visited one by one at their workstations, questionnaires fully
explained including the purpose and their willingness to participate in the research.
In order to ensure maximum follow-up and collection of completed questionnaire,
collection of completed questionnaires was carried out physically by the researcher.
59
CHAPTER 5
5.1 RESULTS AND DISCUSSION
5.1.1 Data analysis
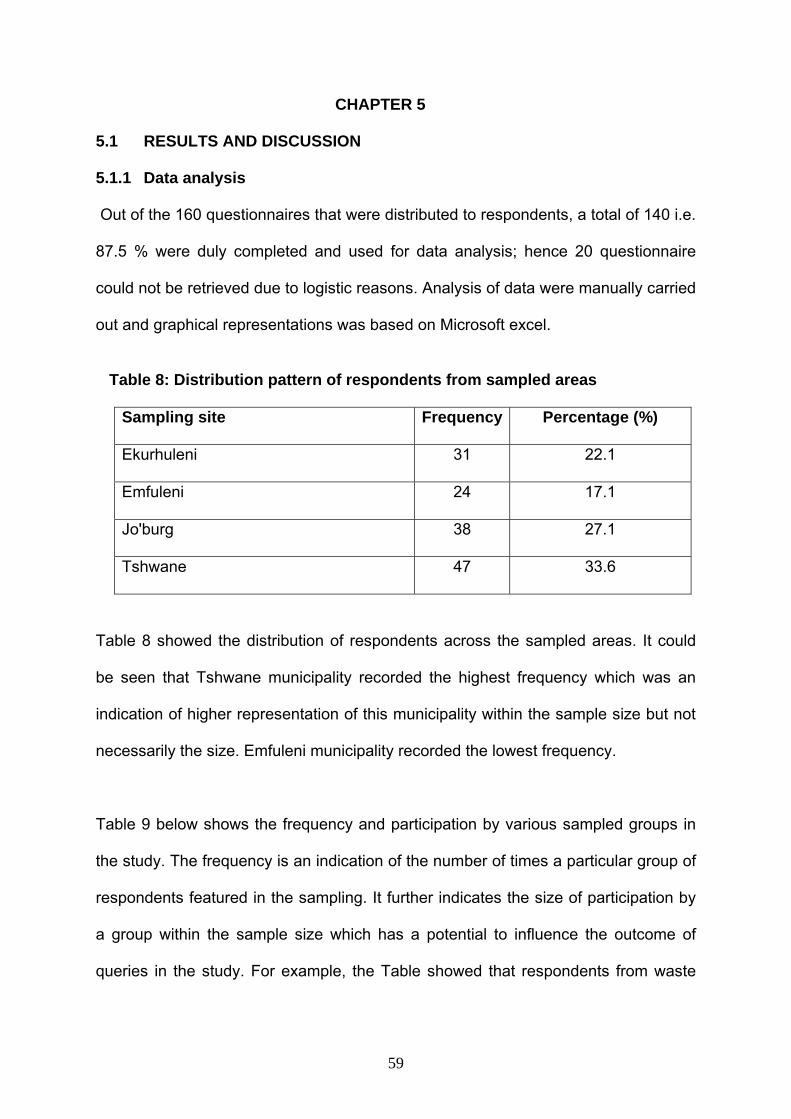
Out of the 160 questionnaires that were distributed to respondents, a total of 140 i.e.
87.5 % were duly completed and used for data analysis; hence 20 questionnaire
could not be retrieved due to logistic reasons. Analysis of data were manually carried
out and graphical representations was based on Microsoft excel.
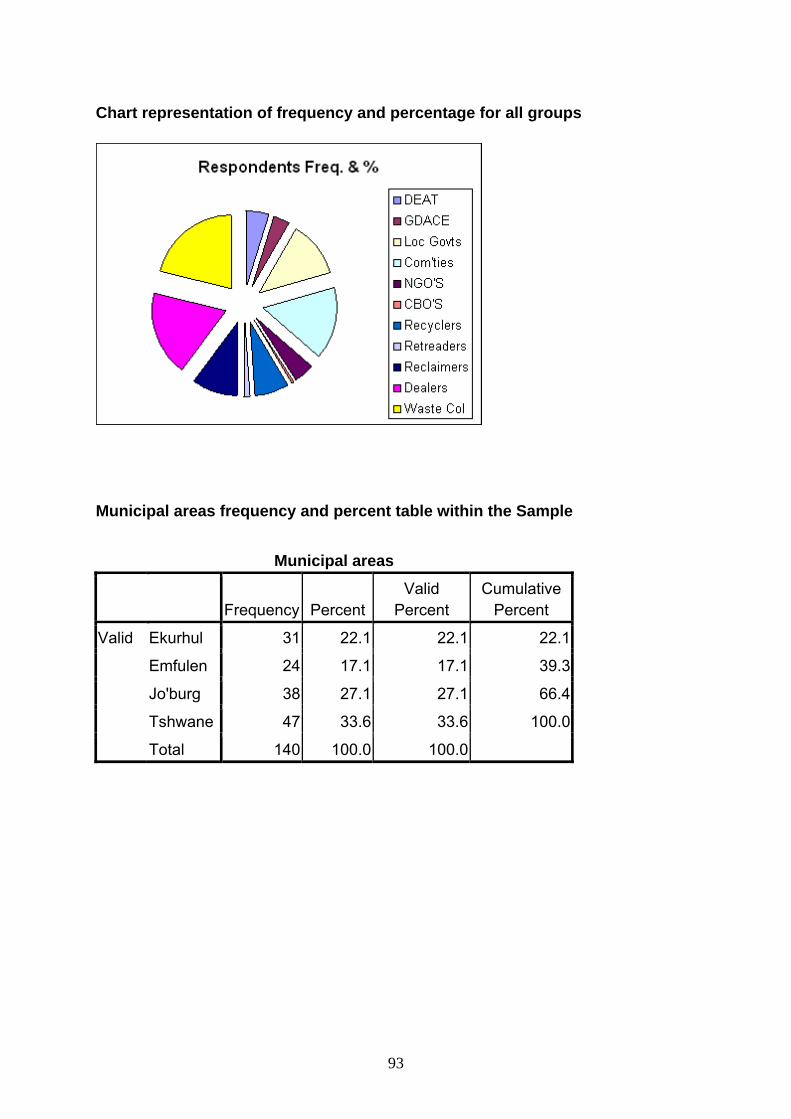
Table 8: Distribution pattern of respondents from sampled areas
Sampling site Frequency Percentage (%)
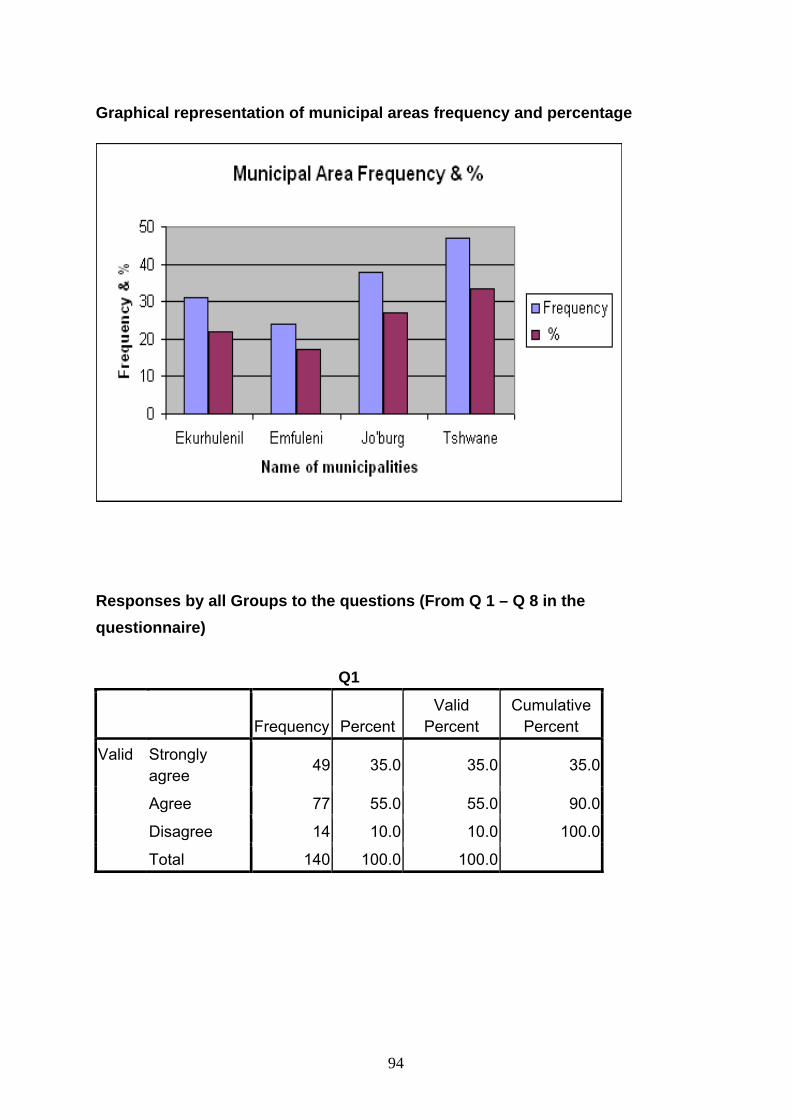
Ekurhuleni 31 22.1
Emfuleni 24 17.1
Jo'burg 38 27.1
Tshwane 47 33.6
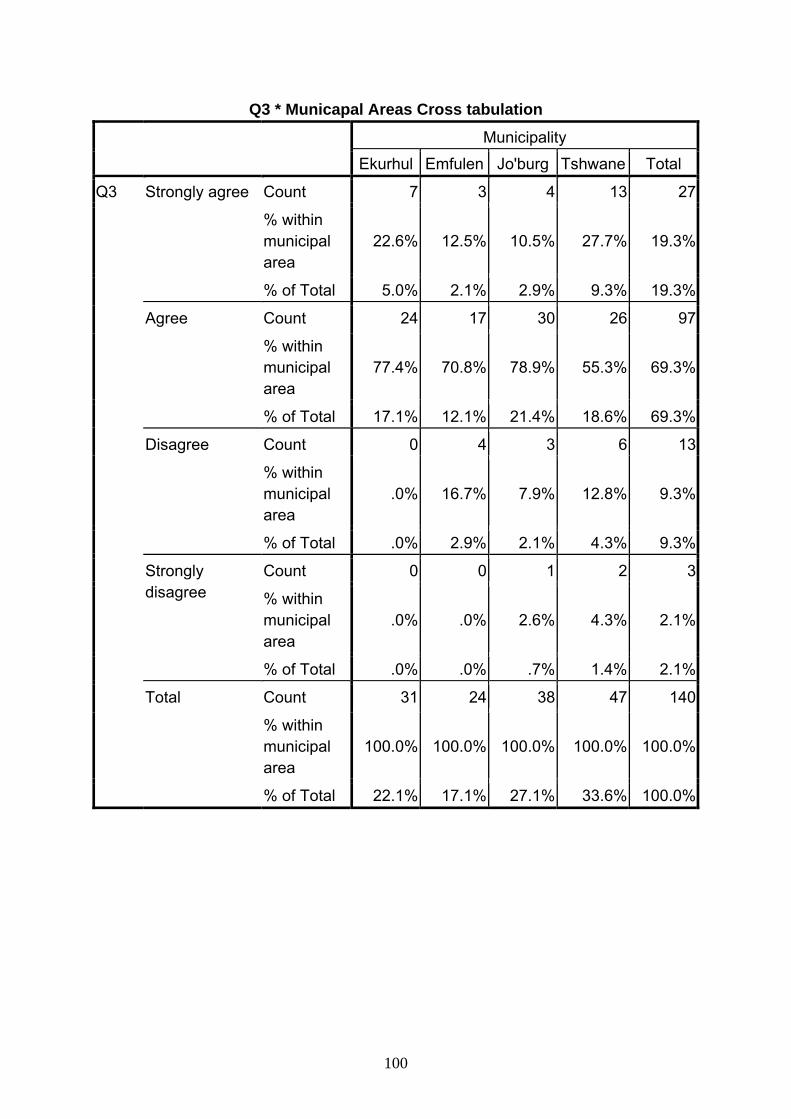
Table 8 showed the distribution of respondents across the sampled areas. It could
be seen that Tshwane municipality recorded the highest frequency which was an
indication of higher representation of this municipality within the sample size but not
necessarily the size. Emfuleni municipality recorded the lowest frequency.
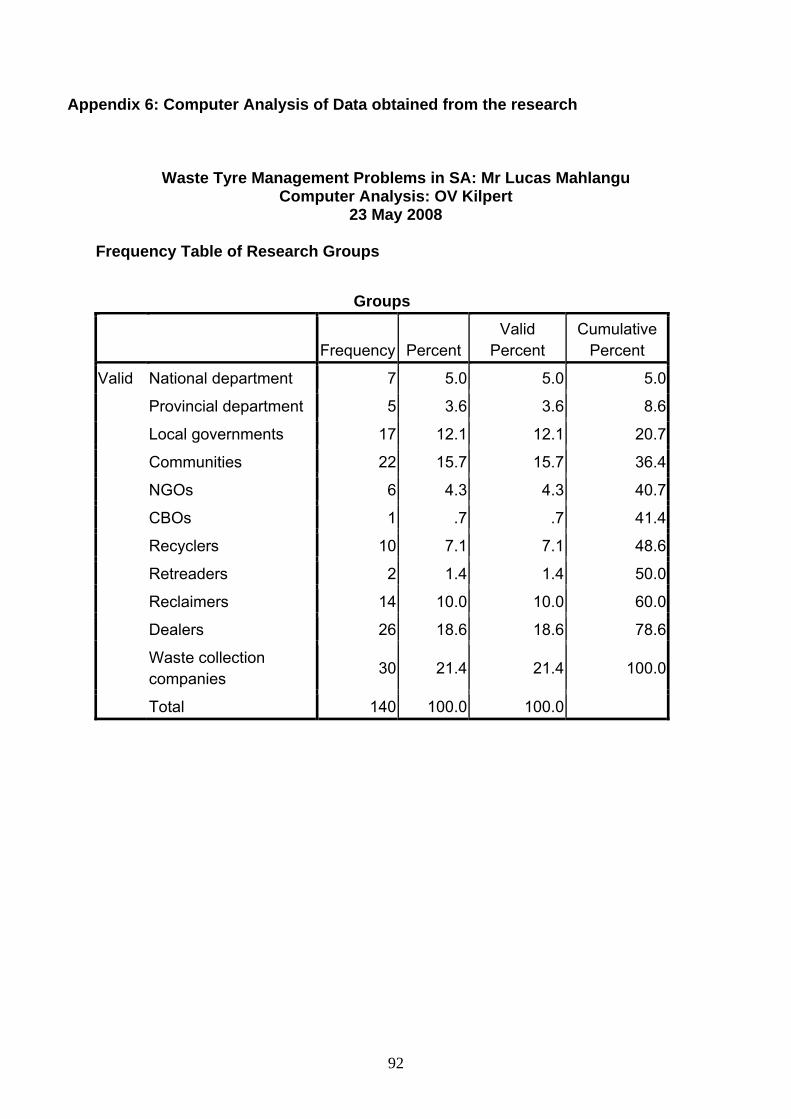
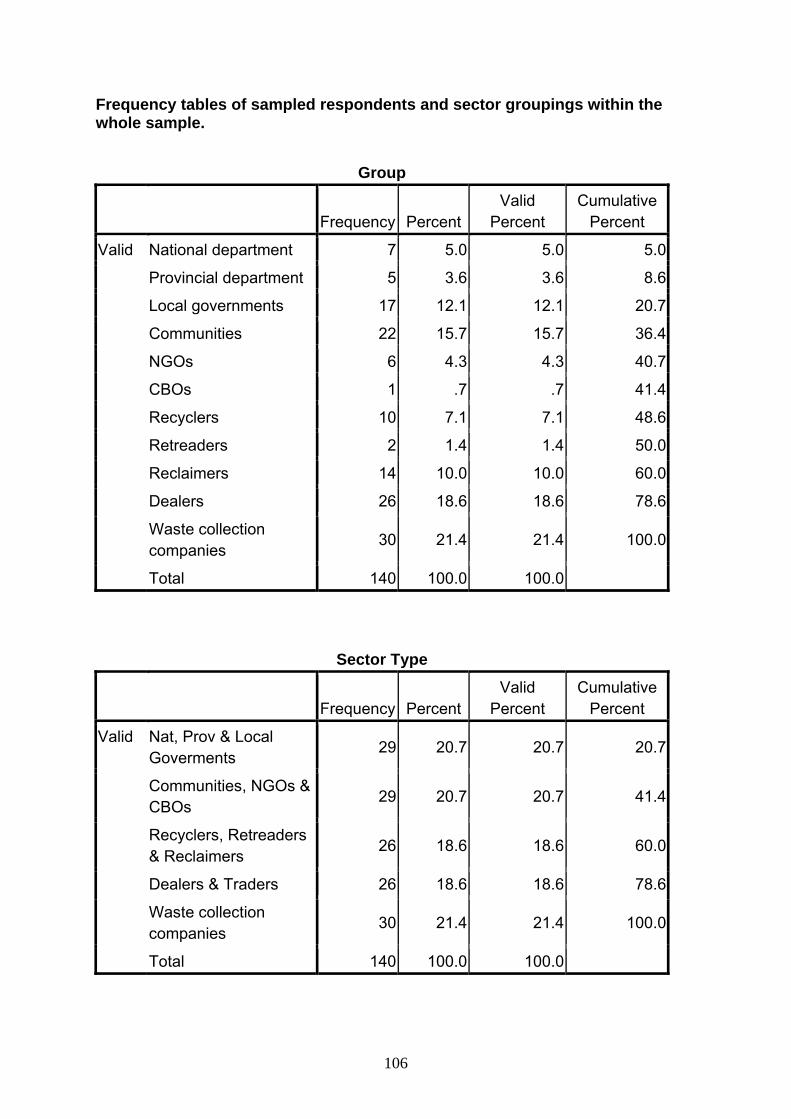
Table 9 below shows the frequency and participation by various sampled groups in
the study. The frequency is an indication of the number of times a particular group of
respondents featured in the sampling. It further indicates the size of participation by
a group within the sample size which has a potential to influence the outcome of
queries in the study. For example, the Table showed that respondents from waste
60
collection companies, government departments, Tyre Dealers and recyclers
recorded higher frequencies of participation in the sampled areas.
Table 9: Frequency and percentage participation by various groups
No. Sampled groups Frequency %
1 Government 29 20.7
2 Community members & NGOs 29 20.7
3 Recyclers, retreaders & reclaimers 26 18.5
4 Tyre dealers 26 18.6
5 Waste companies 30 21.4
Total 140 100
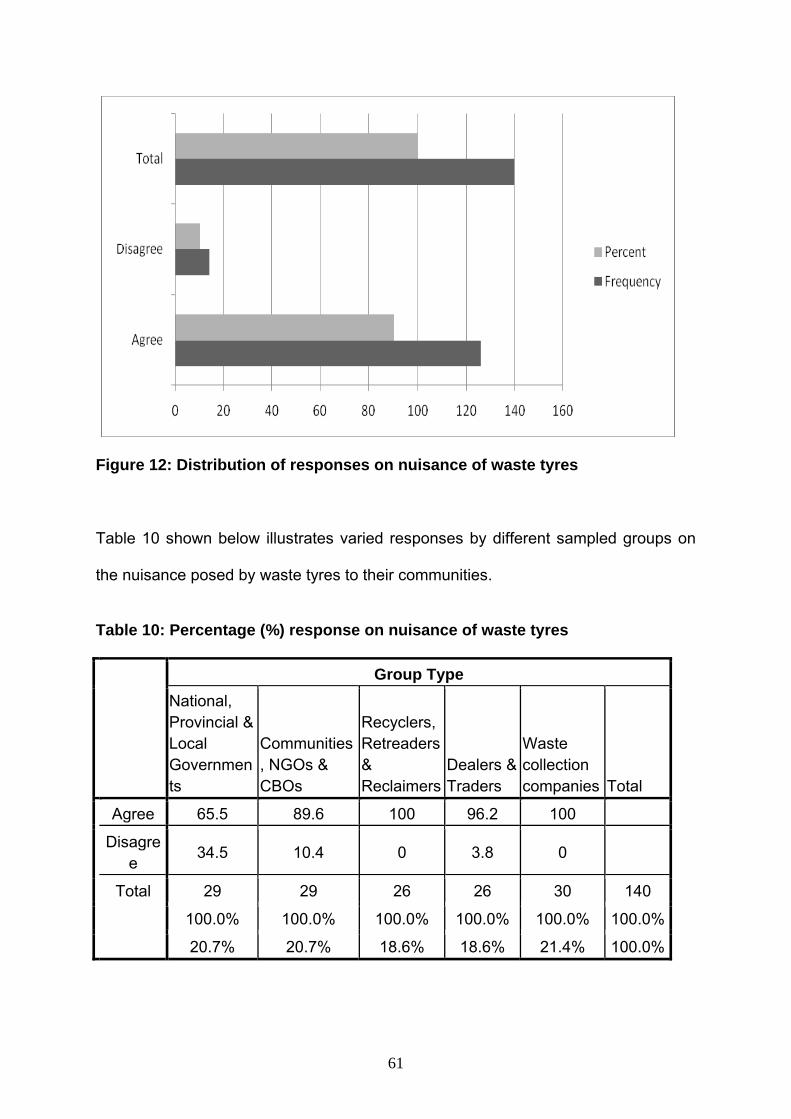
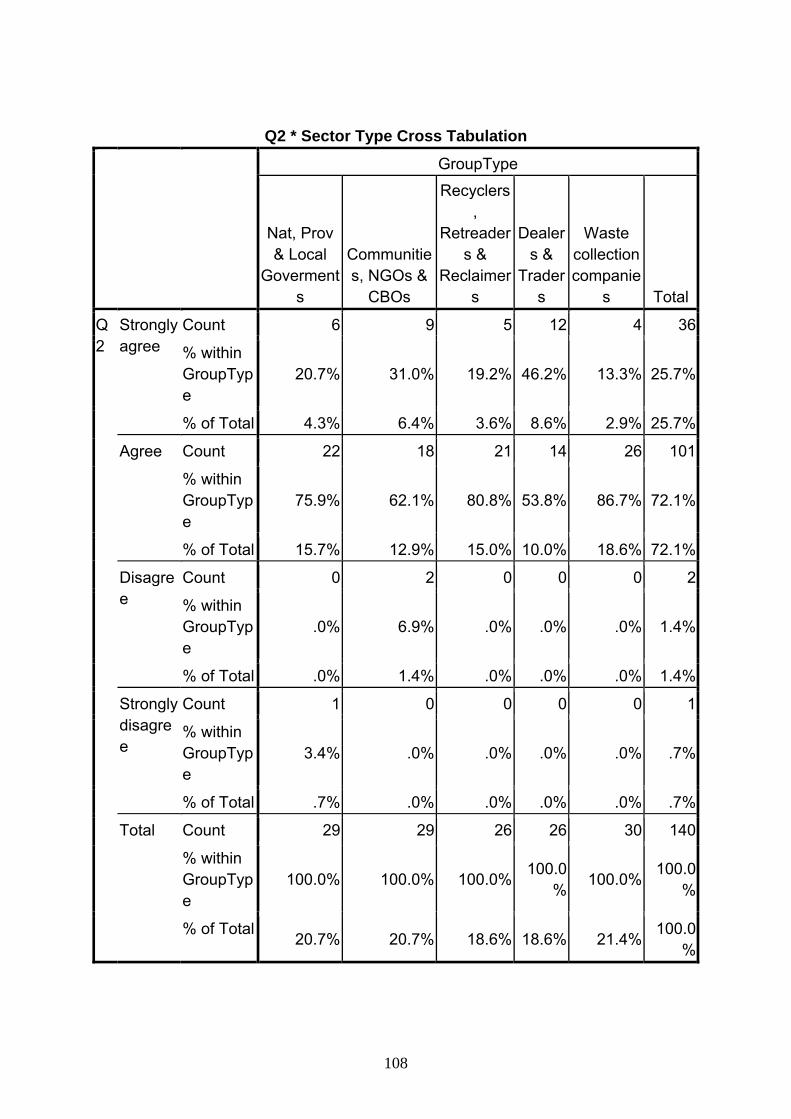
5.2 Waste tyres as nuisance to communities
From the result obtain in Figure 12 below, 126 respondents out of 140, representing
90 % concur that waste tyres are of great nuisance to the community while only 14
respondents which represent 10 % of the total did not agree with the assertion.
Although, the 10 % could be regarded as small or marginal, it does signify the view
of a group of people who perhaps are unemployed and thus benefit from the waste
tyre through burning and recovering the inner metal for income purposes. It is
pertinent to mention that respondents from the government (34.5 %) are of the
opinion that waste tyres do not constitute nuisance to the public.
61
Figure 12: Distribution of responses on nuisance of waste tyres
Table 10 shown below illustrates varied responses by different sampled groups on
the nuisance posed by waste tyres to their communities.
Table 10: Percentage (%) response on nuisance of waste tyres Group Type National,
Provincial & Local Governments
Communities, NGOs & CBOs
Recyclers, Retreaders & Reclaimers
Dealers & Traders
Waste collection companies Total
Agree 65.5 89.6 100 96.2 100
Disagree 34.5 10.4 0 3.8 0
Total 29 29 26 26 30 140
100.0% 100.0% 100.0% 100.0% 100.0% 100.0%
20.7% 20.7% 18.6% 18.6% 21.4% 100.0%
62
Most noticeable is the 34% which is higher compared to all other groups by a big
margin considering that the lowest percentage is 0. It is interesting to note that only
the surveyed group from government is of the opinion that waste tyres are not much
of significant nuisance. However, considering all other responses from other groups
in the sample, it is deduced that 90% of responses view waste tyres as nuisance to
the environment. Only 9.7% of the overall responses believe waste tyres are not
posing nuisance to the environment. Table 10 above illustrate percentage
responses regarding whether waste tyres are a nuisance or not to the environment.
5.3 Severity of waste tyre problems in poor communities
The issue of uncontrolled and unregulated dumping of waste tyres is of great
concern. This is due to the impact this will have on human and environmental health
especially in poor and disadvantaged communities in South Africa. In Figure 13, an
overwhelming 97.7% of the respondents acceded to the severity of the problems of
waste tyres in poor communities while only 2.3 % of respondents disagree. Analysis
also revealed general support of this assertion by the various sampled groups i.e.
the tyre dealers (100 %), communities including NGOs (93.1 %) as well as the
government (96.6 %).
63
Figure 13: Responses on severe of waste tyre problems in poor communities
All groups in the sample overwhelmingly in excess of 93% agree with the assertion
that waste tyre problems are severe in poor communities especially in areas where
waste removal is erratic or non-existent. The problem is worse in informal settlement
where waste management is a challenge. Views on the severity of waste tyre
management in poor communities are illustrated in Table 11 below:
Table 11: Percentage (%) response on severity of waste tyre problems in poor communities Group Type National,
Provincial & Local Governments
Communities, NGOs & CBOs
Recyclers, Retreaders & Reclaimers
Dealers & Traders
Waste collection companies Total
Agree 96.6 93.1 100 100 100
Disagree 4.5 6.9 0 0 0
Total 29 29 26 26 30 140
100.0% 100.0% 100.0% 100.0% 100.0% 100.0%
20.7% 20.7% 18.6% 18.6% 21.4% 100.0%
64
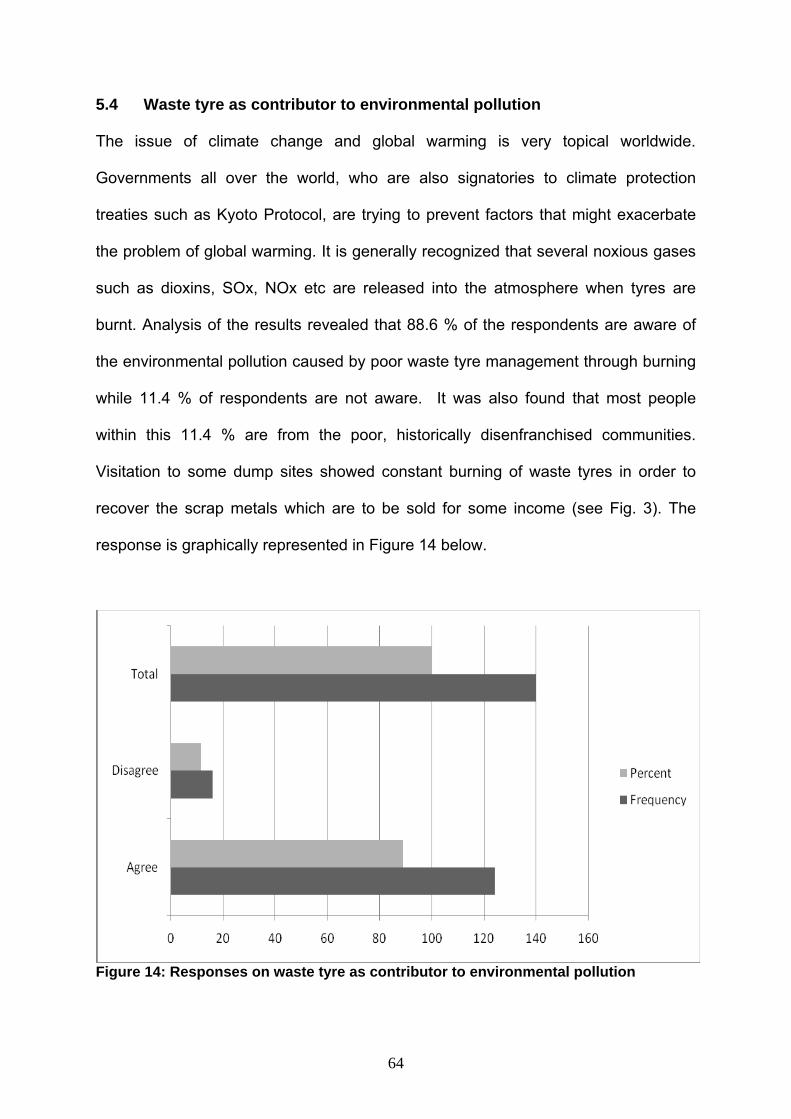
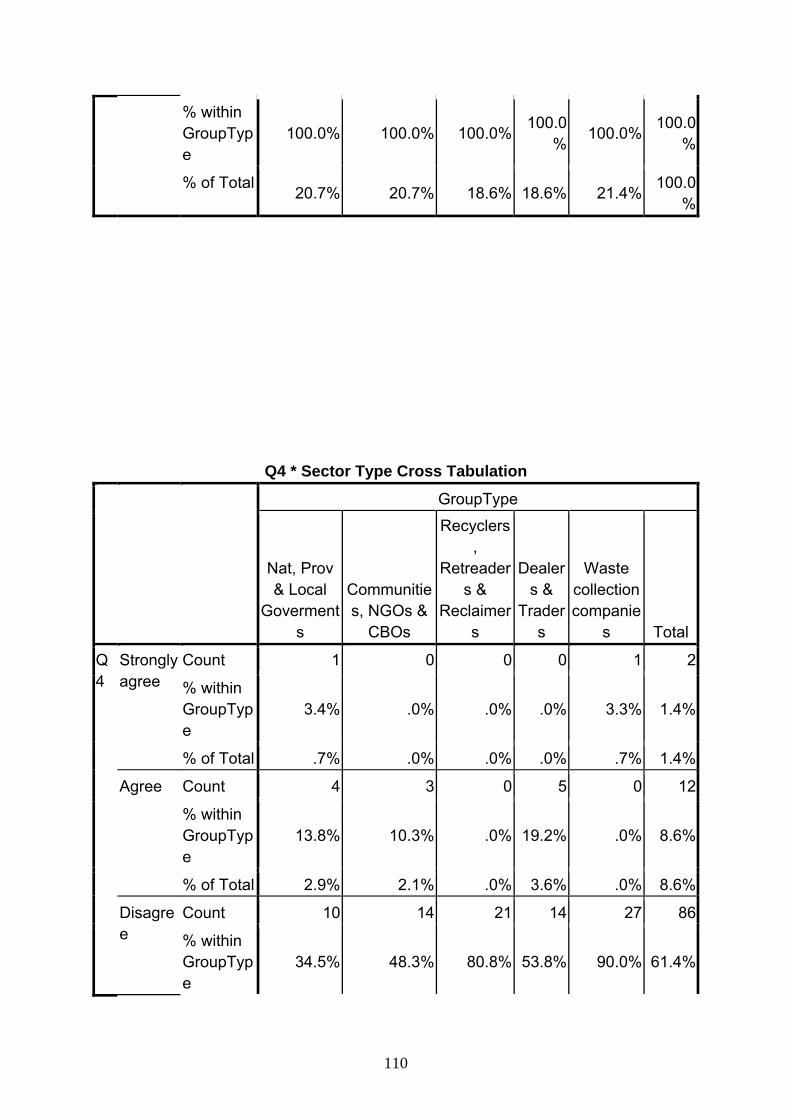
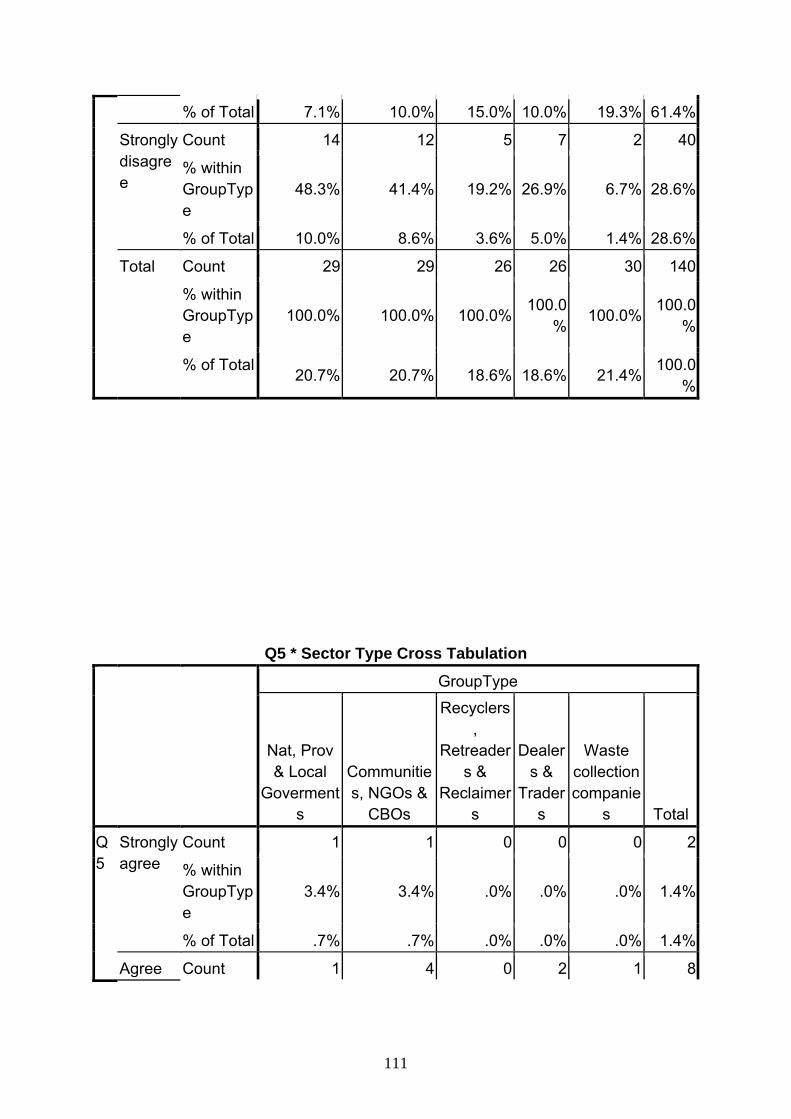
5.4 Waste tyre as contributor to environmental pollution
The issue of climate change and global warming is very topical worldwide.
Governments all over the world, who are also signatories to climate protection
treaties such as Kyoto Protocol, are trying to prevent factors that might exacerbate
the problem of global warming. It is generally recognized that several noxious gases
such as dioxins, SOx, NOx etc are released into the atmosphere when tyres are
burnt. Analysis of the results revealed that 88.6 % of the respondents are aware of
the environmental pollution caused by poor waste tyre management through burning
while 11.4 % of respondents are not aware. It was also found that most people
within this 11.4 % are from the poor, historically disenfranchised communities.
Visitation to some dump sites showed constant burning of waste tyres in order to
recover the scrap metals which are to be sold for some income (see Fig. 3). The
response is graphically represented in Figure 14 below.
Figure 14: Responses on waste tyre as contributor to environmental pollution
65
On average all groups agree to the assertion that waste tyre is a contributor to
environmental pollution. Government group, however believe that contribution to
environmental pollution by waste tyres is not alarming when compared to energy
generating facilities like power plants and petrochemical industry. Table 12 below
illustrates percentage responses to the assertion of whether waste tyre is a
contributor to environmental pollution or not.
Table 12: Percentage (%) response to waste tyre as contributor to environmental pollution Group Type National,
Provincial & Local Governments
Communities, NGOs & CBOs
Recyclers, Retreaders & Reclaimers
Dealers & Traders
Waste collection companies Total
Agree 65.5% 86.2% 96.1% 96.2% 100%
Disagree 34.5% 13.8% 3.9% 3.8% 0
Total 29 29 26 26 30 140
100.0% 100.0% 100.0% 100.0% 100.0% 100.0%
20.7% 20.7% 18.6% 18.6% 21.4% 100.0%
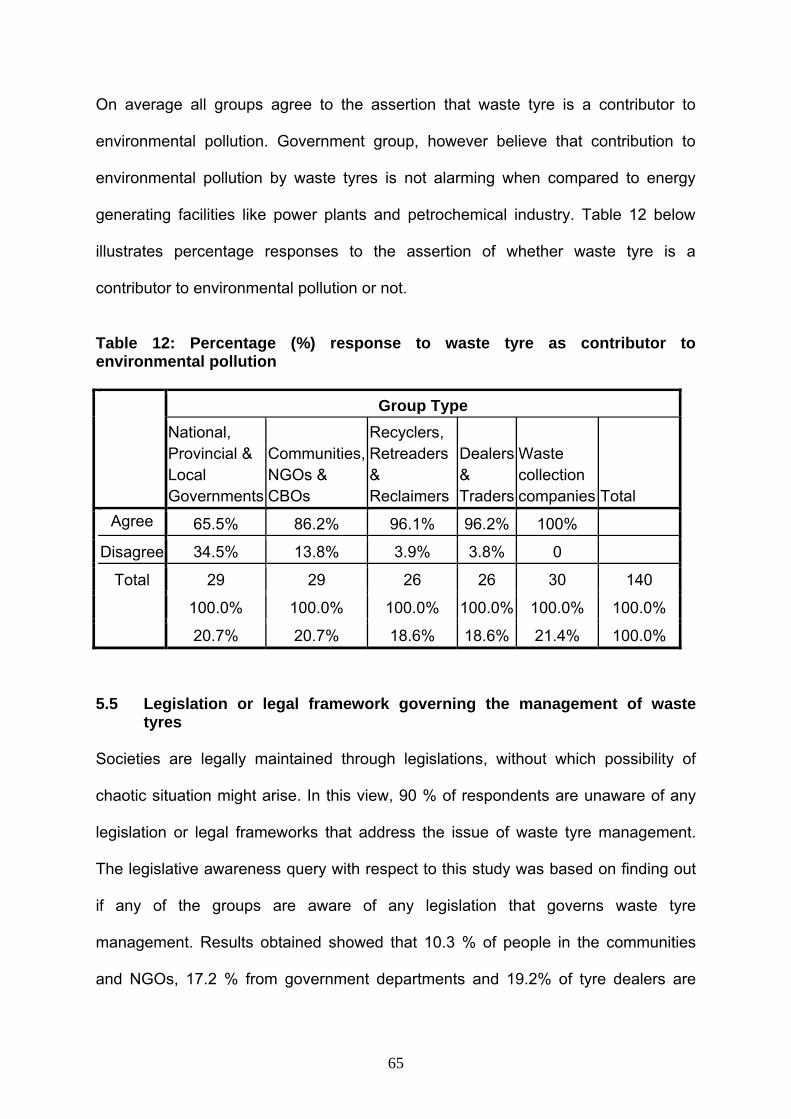
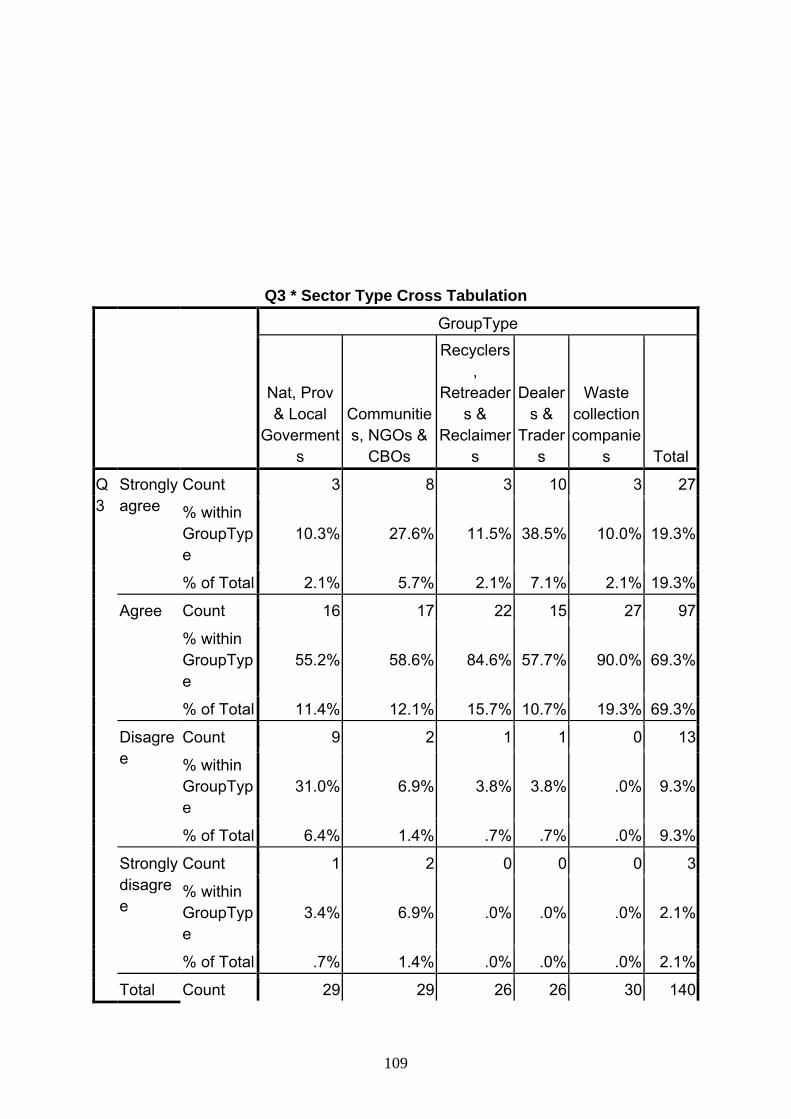
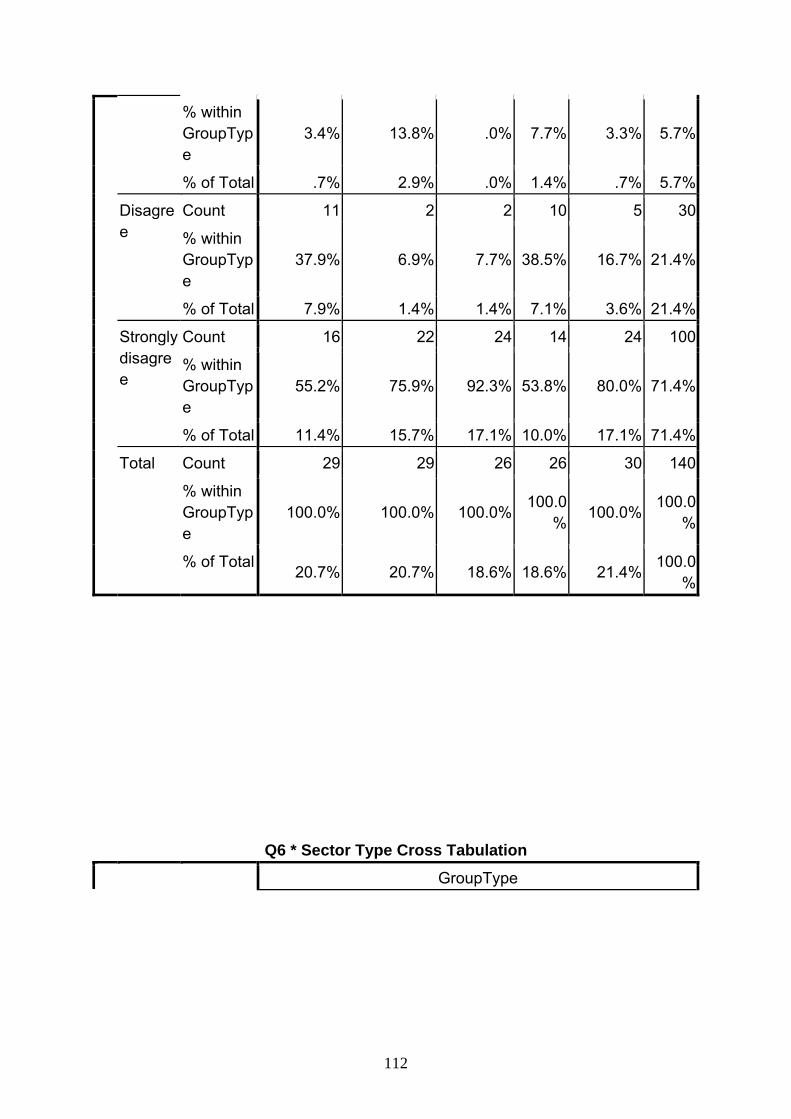
5.5 Legislation or legal framework governing the management of waste tyres Societies are legally maintained through legislations, without which possibility of
chaotic situation might arise. In this view, 90 % of respondents are unaware of any
legislation or legal frameworks that address the issue of waste tyre management.
The legislative awareness query with respect to this study was based on finding out
if any of the groups are aware of any legislation that governs waste tyre
management. Results obtained showed that 10.3 % of people in the communities
and NGOs, 17.2 % from government departments and 19.2% of tyre dealers are
66
unaware of any legislation regulating waste tyre management. It is pertinent to note
that as at the time of this study, there was no specific legislative framework for waste
tyres in existence but an Environment Conservation Act No. 79 of 1989 that
generally address waste management. Figure 15 shows the responses with regard
to legal framework governing the management of waste tyres.
Figure 15: Spread of responses on legal framework of waste tyre management It is interesting to note that 90% of respondents are not aware of any legislation that
regulate management of waste tyres which include collection, treatment and final
disposal thereof. Currently there is no specific guideline that direct the management
are aware of legal framework on waste tyre management.
67
Table 13: Percentage (%) response on legal framework for waste tyre management
Group Type National,
Provincial & Local Goverments
Communities, NGOs & CBOs
Recyclers, Retreaders & Reclaimers
Dealers & Traders
Waste collection companies
Total ∑%/5
Agree
17.2% 10.3% 0.0% 19.2% 3.3% 10%
Disagree
82.8% 89.7% 100% 80.8% 96.7% 90%
Total 29.0 29.0 26.0 26.0 30.0 140.0
100.0% 100.0% 100.0% 100.0% 100.0% 100.0%
20.7% 20.7% 18.6% 18.6% 21.4% 100.0%
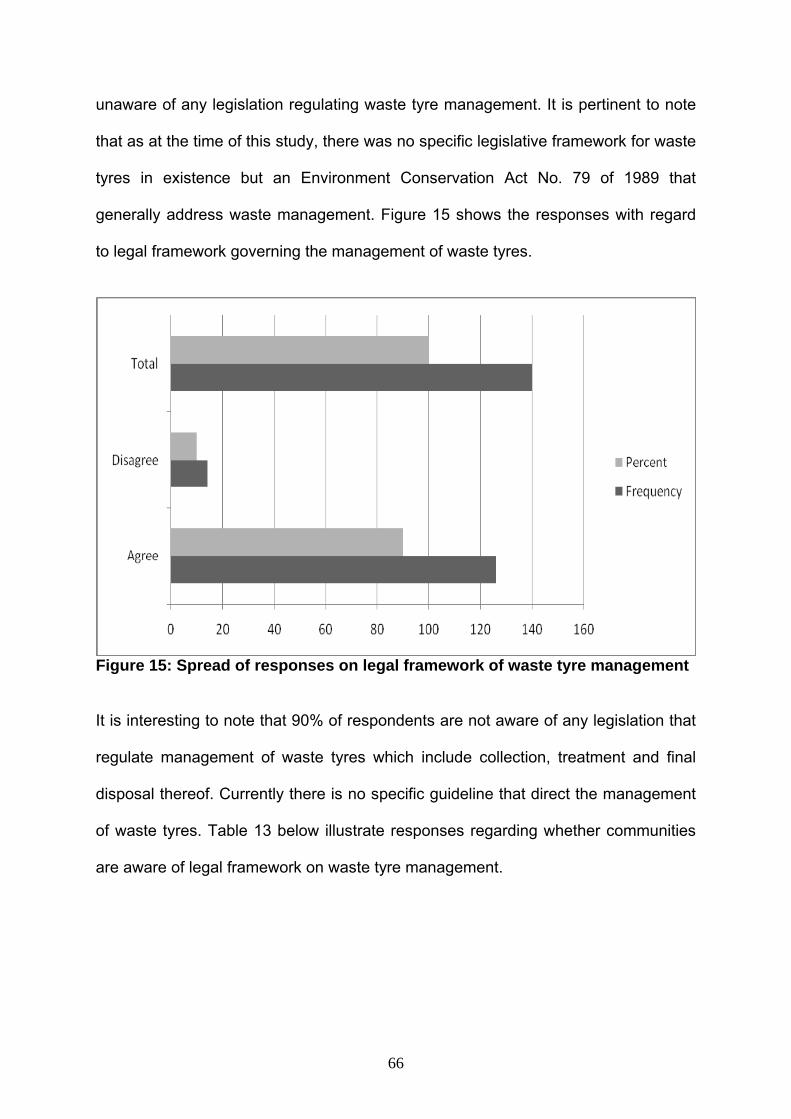
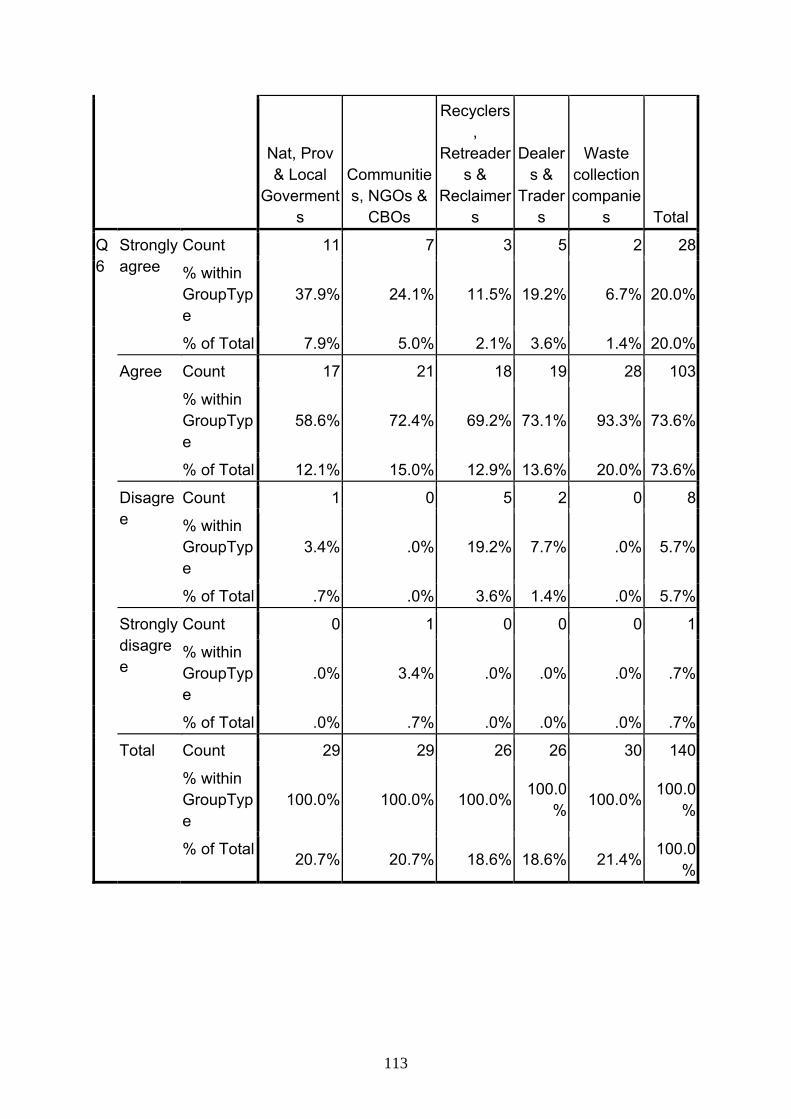
5.6 Existence of government or community programme on waste tyre management The intention of this query was to highlight the importance of the existence and
participation of the private and government sector e.g. tyre industries including the
retreaders, recyclers and importers in waste tyre management with the support of
the government from the results obtained, Ninety two point nine percent (92.9 %) of
respondents are not aware of any programmes that are either community, private or
government based which sought to address the issue of waste tyre management in
the country. Figure 16 reflect the responses.
68
Figure 16: Range of responses on government or community programme on waste tyre management
Over 93% of responses believe that community or government driven programmes
to address management of waste tyres do not exist. Of importance, government
group overwhelmingly with 93% does not agree that there are government or
community programmes to support management of waste tyres. Table 14 below
illustrates percentage response to the statement.
Table 14: Percentage (%) response to government or community programme on waste tyre management
Group Type National,
Provincial & Local Governments
Communities, NGOs & CBOs
Recyclers, Retreaders & Reclaimers
Dealers & Traders
Waste collection companies
Total ∑%/5
Agree 6.8% 17.2% .0% 7.7% 3.3% 7%
Disagree 93.2% 82.8% 100% 92.3% 96.7% 92.8%
Total 29 29 26 26 30 140
100.0% 100.0% 100.0% 100.0% 100.0% 100.0%
20.7% 20.7% 18.6% 18.6% 21.4% 100.0%
69
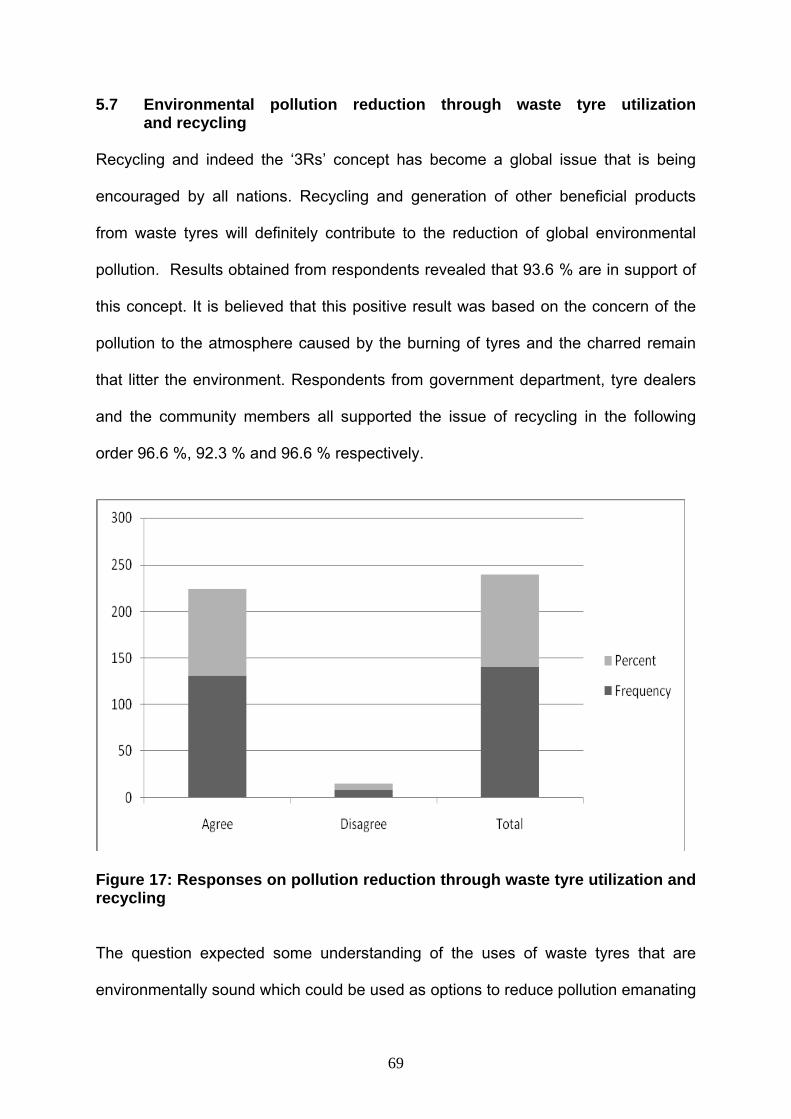
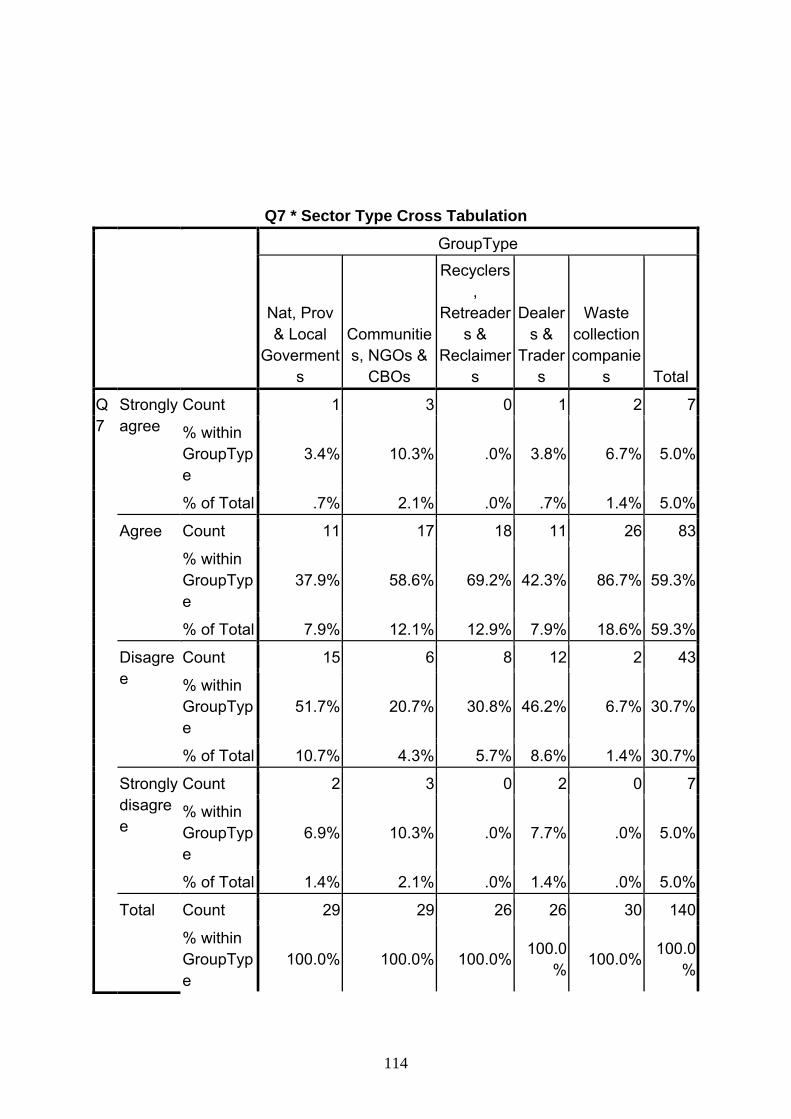
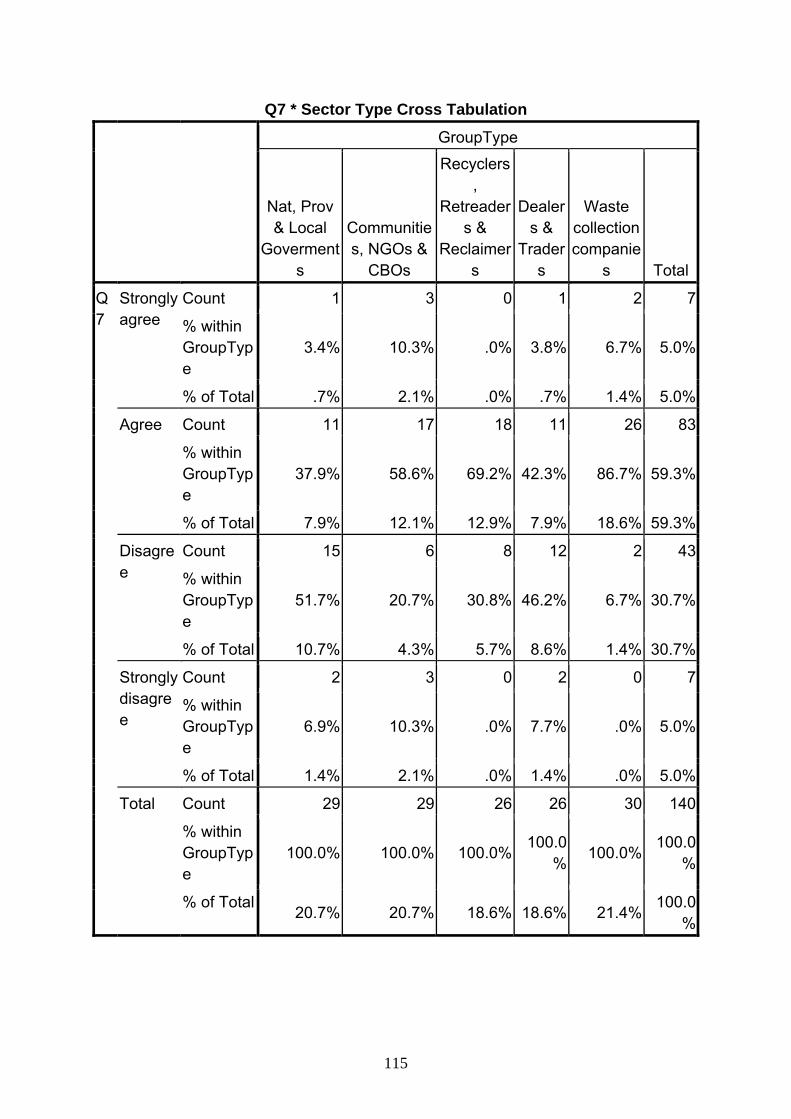
5.7 Environmental pollution reduction through waste tyre utilization and recycling Recycling and indeed the ‘3Rs’ concept has become a global issue that is being
encouraged by all nations. Recycling and generation of other beneficial products
from waste tyres will definitely contribute to the reduction of global environmental
pollution. Results obtained from respondents revealed that 93.6 % are in support of
this concept. It is believed that this positive result was based on the concern of the
pollution to the atmosphere caused by the burning of tyres and the charred remain
that litter the environment. Respondents from government department, tyre dealers
and the community members all supported the issue of recycling in the following
order 96.6 %, 92.3 % and 96.6 % respectively.
Figure 17: Responses on pollution reduction through waste tyre utilization and recycling The question expected some understanding of the uses of waste tyres that are
environmentally sound which could be used as options to reduce pollution emanating
70
from waste tyres. All respondents from various sampled groups overwhelmingly
agreed that waste tyre utilization and recycling would reduce pollution from waste
tyres. Table 15 further illustrates this percentage.
Table 15: Percentage (%) response on pollution reduction through waste tyre utilization and recycling Group Type National,
Provincial & Local Governments
Communities, NGOs & CBOs
Recyclers, Retreaders & Reclaimers
Dealers & Traders
Waste collection companies
Total ∑%/5
Agree
96.5% 96.5% 80.7% 92.3% 100% 93.2%
Disagree
3.5% 3.5% 19.3% 7.7% 0% 6.8%
Total 29 29 26 26 30 140
100.0% 100.0% 100.0% 100.0% 100.0% 100.0%
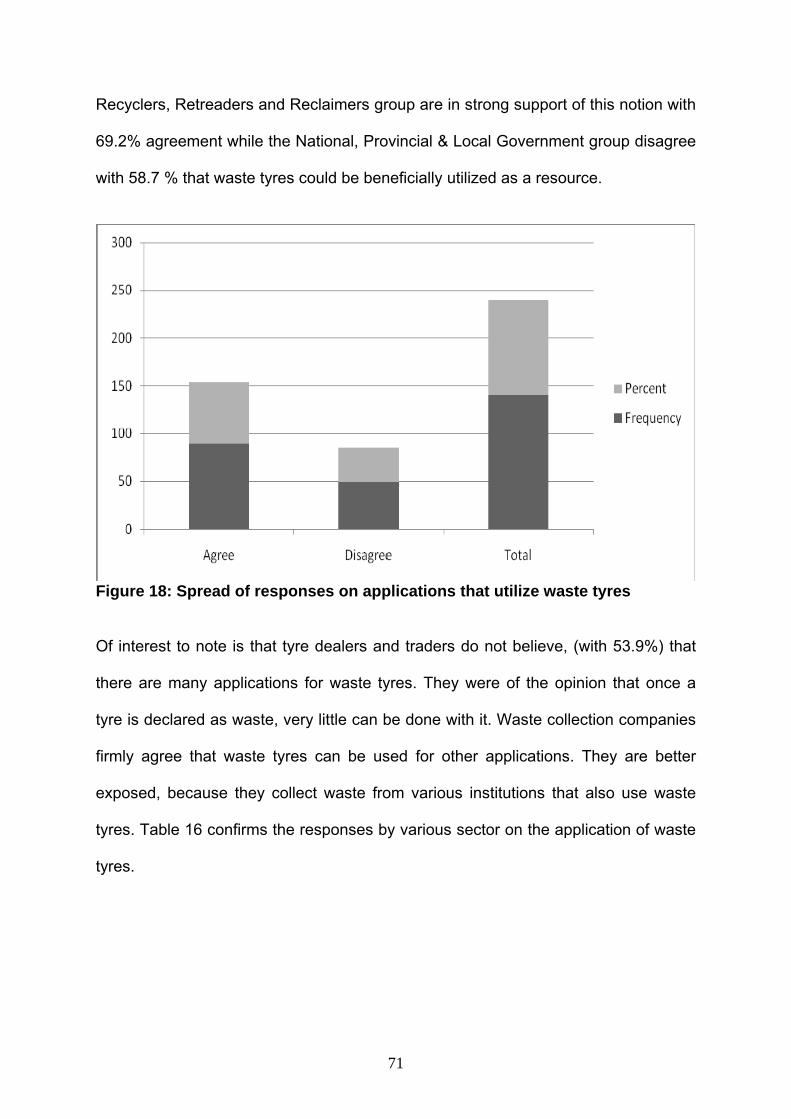
20.7% 20.7% 18.6% 18.6% 21.4% 100.0% 5.8 Processes or applications that utilize waste tyres
There are some industrial processes that could utilize waste tyres as source of
energy. The main markets for waste tyre include cement kilns, electricity generating
utilities that can replace finite resource like coal, small to medium scale enterprises
that can create floor carpet, mats, shoe soles etc as by-products from waste tyres.
These applications and processes might contribute to the solution of the problem.
From Figure 18, the result showed that 64.3 % of respondents believed that efficient
processes that make use of waste tyres will be beneficial to the economy and the
society. Table 16 also shows the distribution of views people within the surveyed
groups relevant to the study with respect to utilization of this waste resource. The
71
Recyclers, Retreaders and Reclaimers group are in strong support of this notion with
69.2% agreement while the National, Provincial & Local Government group disagree
with 58.7 % that waste tyres could be beneficially utilized as a resource.
Figure 18: Spread of responses on applications that utilize waste tyres
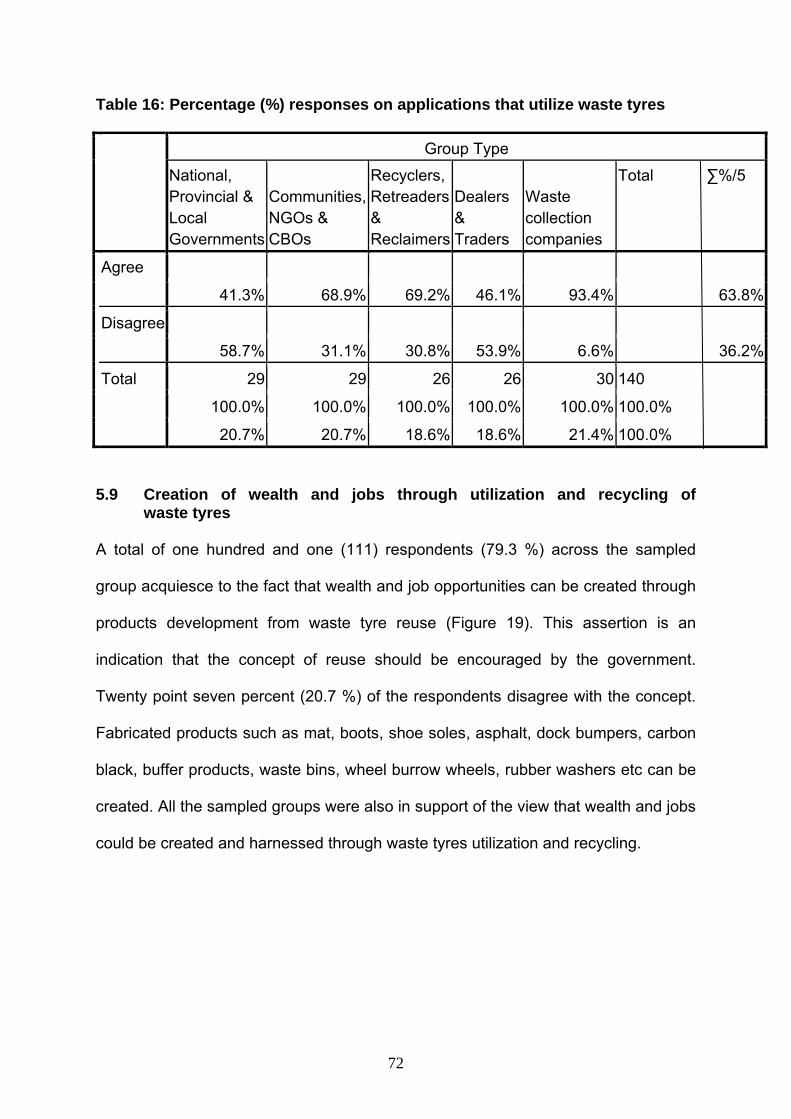
Of interest to note is that tyre dealers and traders do not believe, (with 53.9%) that
there are many applications for waste tyres. They were of the opinion that once a
tyre is declared as waste, very little can be done with it. Waste collection companies
firmly agree that waste tyres can be used for other applications. They are better
exposed, because they collect waste from various institutions that also use waste
tyres. Table 16 confirms the responses by various sector on the application of waste
tyres.
72
Table 16: Percentage (%) responses on applications that utilize waste tyres
Group Type National,
Provincial & Local Governments
Communities, NGOs & CBOs
Recyclers, Retreaders & Reclaimers
Dealers & Traders
Waste collection companies
Total ∑%/5
Agree
41.3% 68.9% 69.2% 46.1% 93.4% 63.8%
Disagree
58.7% 31.1% 30.8% 53.9% 6.6% 36.2%
Total 29 29 26 26 30 140
100.0% 100.0% 100.0% 100.0% 100.0% 100.0%
20.7% 20.7% 18.6% 18.6% 21.4% 100.0%
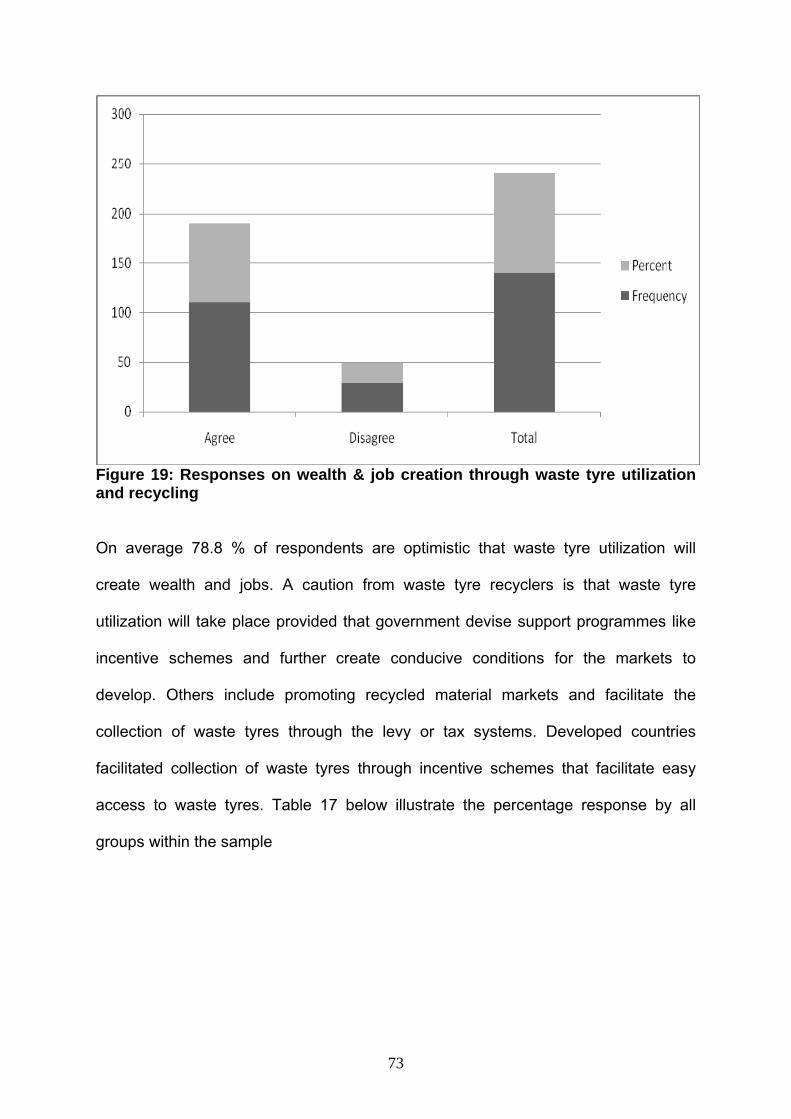
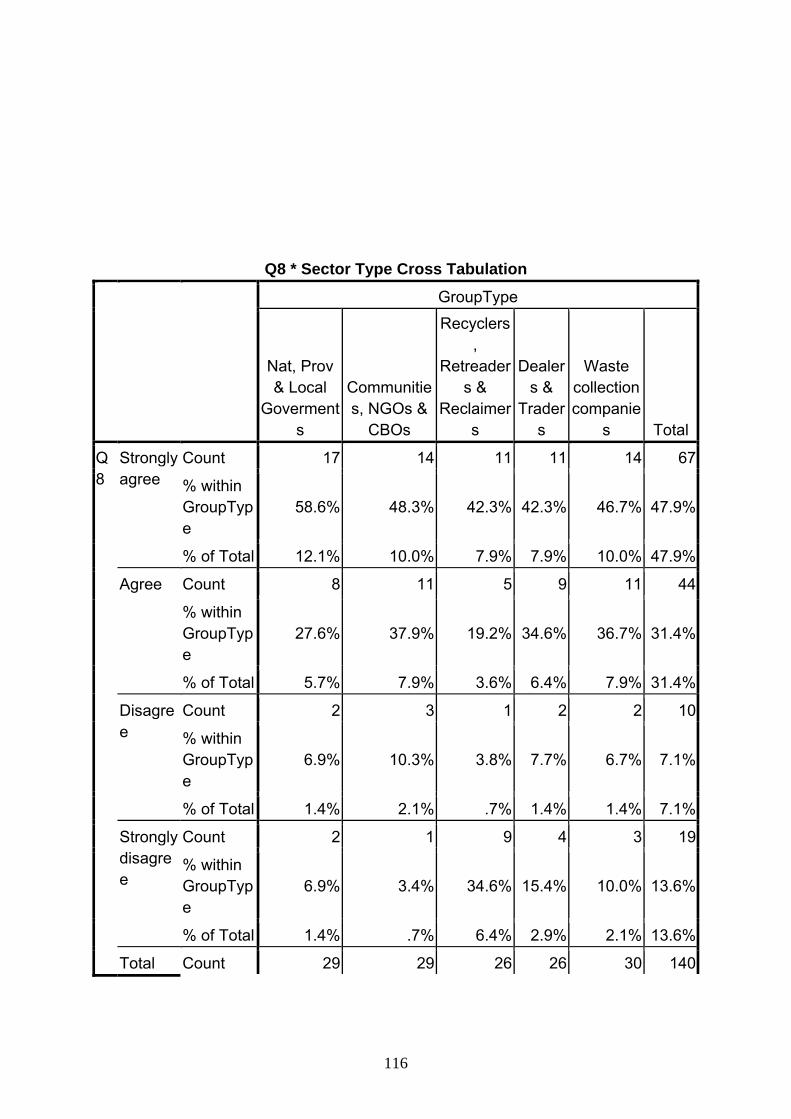
5.9 Creation of wealth and jobs through utilization and recycling of waste tyres A total of one hundred and one (111) respondents (79.3 %) across the sampled
group acquiesce to the fact that wealth and job opportunities can be created through
products development from waste tyre reuse (Figure 19). This assertion is an
indication that the concept of reuse should be encouraged by the government.
Twenty point seven percent (20.7 %) of the respondents disagree with the concept.
Fabricated products such as mat, boots, shoe soles, asphalt, dock bumpers, carbon
black, buffer products, waste bins, wheel burrow wheels, rubber washers etc can be
created. All the sampled groups were also in support of the view that wealth and jobs
could be created and harnessed through waste tyres utilization and recycling.
73
Figure 19: Responses on wealth & job creation through waste tyre utilization and recycling
On average 78.8 % of respondents are optimistic that waste tyre utilization will
create wealth and jobs. A caution from waste tyre recyclers is that waste tyre
utilization will take place provided that government devise support programmes like
incentive schemes and further create conducive conditions for the markets to
develop. Others include promoting recycled material markets and facilitate the
collection of waste tyres through the levy or tax systems. Developed countries
facilitated collection of waste tyres through incentive schemes that facilitate easy
access to waste tyres. Table 17 below illustrate the percentage response by all
groups within the sample
74
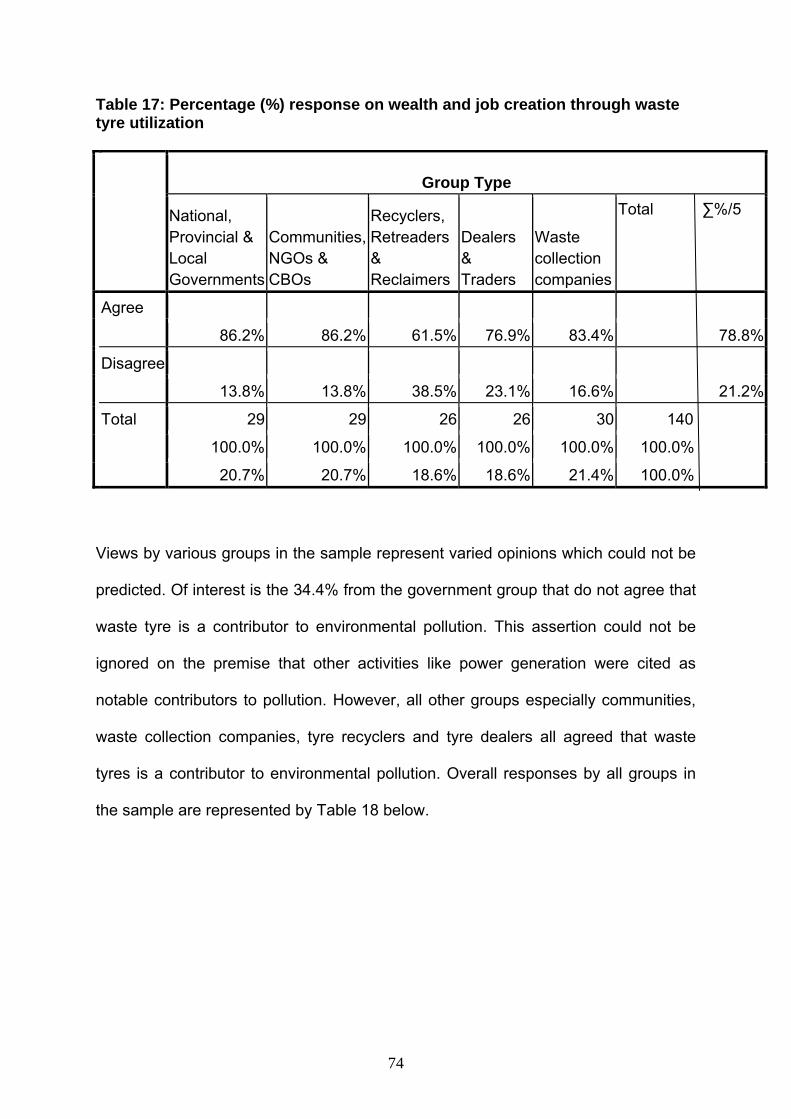
Table 17: Percentage (%) response on wealth and job creation through waste tyre utilization
Group Type
National, Provincial & Local Governments
Communities, NGOs & CBOs
Recyclers, Retreaders & Reclaimers
Dealers & Traders
Waste collection companies
Total ∑%/5
Agree
86.2% 86.2% 61.5% 76.9% 83.4% 78.8%
Disagree
13.8% 13.8% 38.5% 23.1% 16.6% 21.2%
Total 29 29 26 26 30 140
100.0% 100.0% 100.0% 100.0% 100.0% 100.0%
20.7% 20.7% 18.6% 18.6% 21.4% 100.0% Views by various groups in the sample represent varied opinions which could not be
predicted. Of interest is the 34.4% from the government group that do not agree that
waste tyre is a contributor to environmental pollution. This assertion could not be
ignored on the premise that other activities like power generation were cited as
notable contributors to pollution. However, all other groups especially communities,
waste collection companies, tyre recyclers and tyre dealers all agreed that waste
tyres is a contributor to environmental pollution. Overall responses by all groups in
the sample are represented by Table 18 below.
75
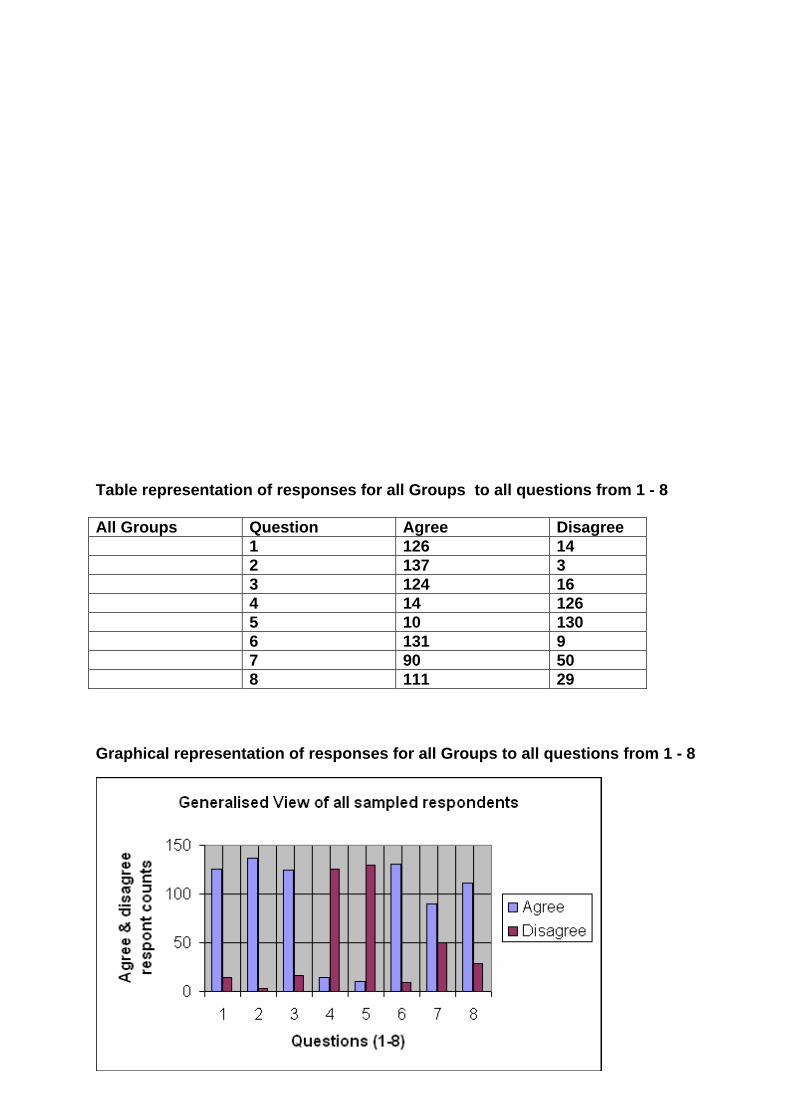
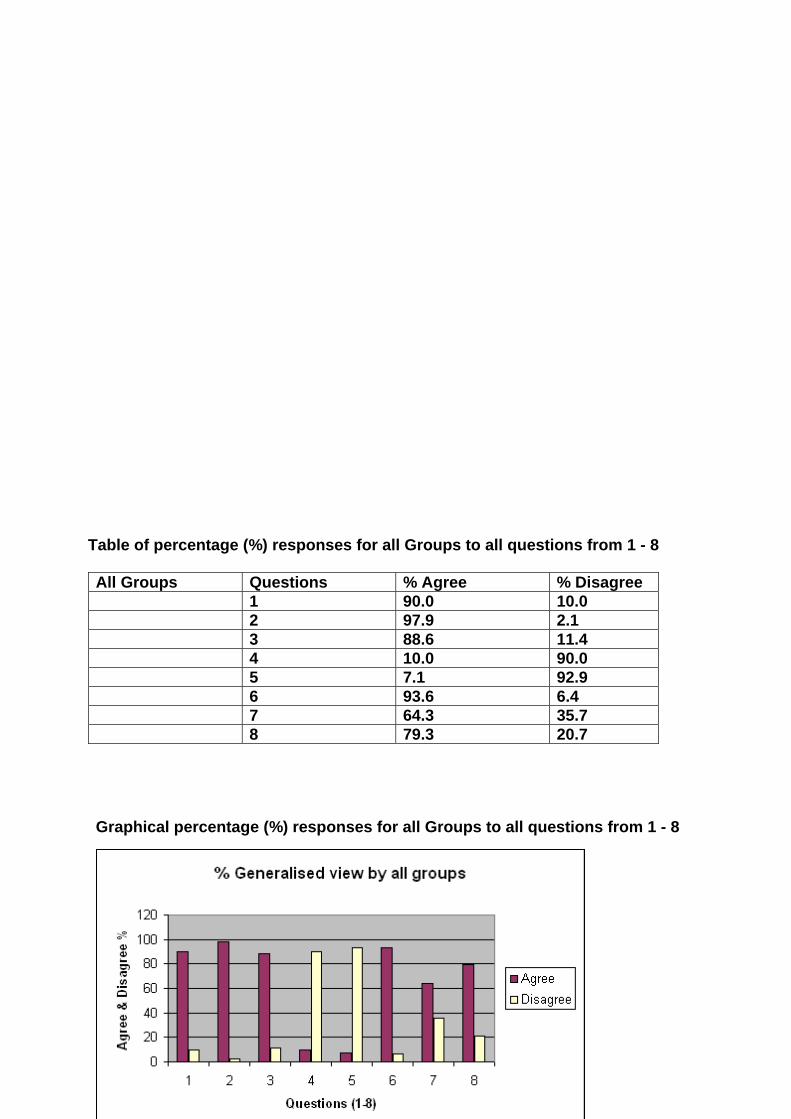
Table 18: Overall responses by all the surveyed groups Question No. % Agree % Disagree Total %
1 90 10 100
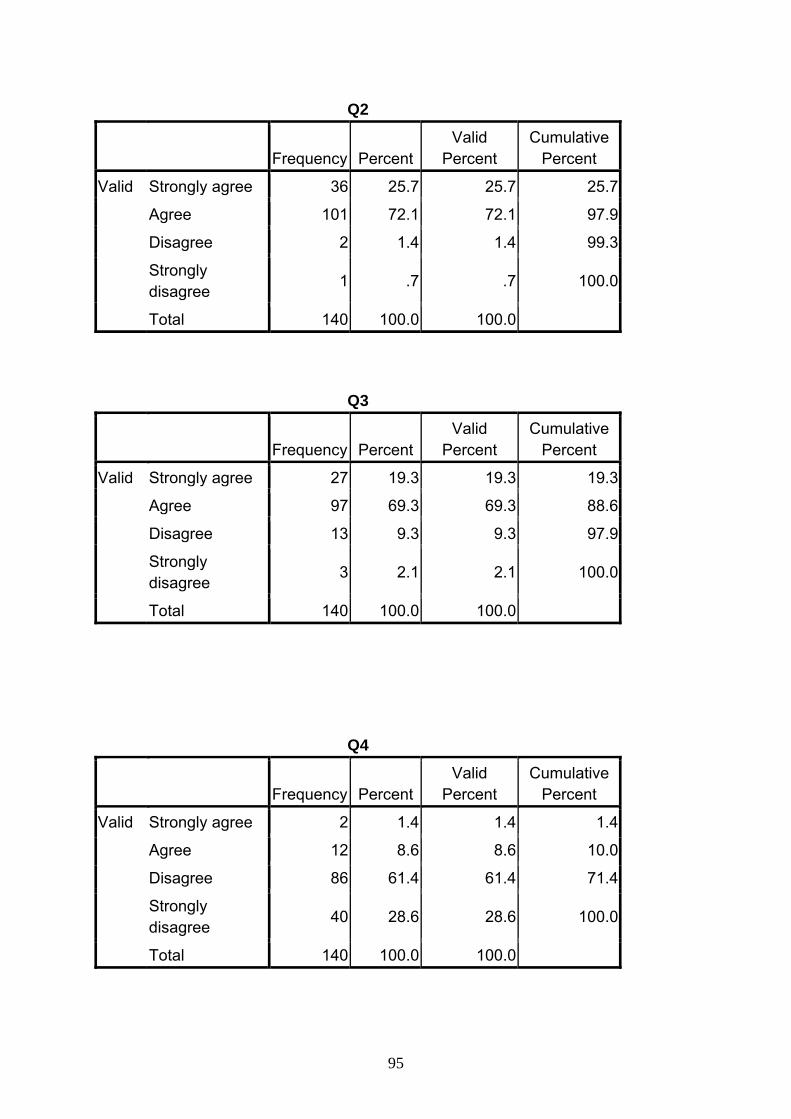
2 97.9 2.1 100
3 88.6 11.4 100
4 10 90 100
5 7.1 92.9 100
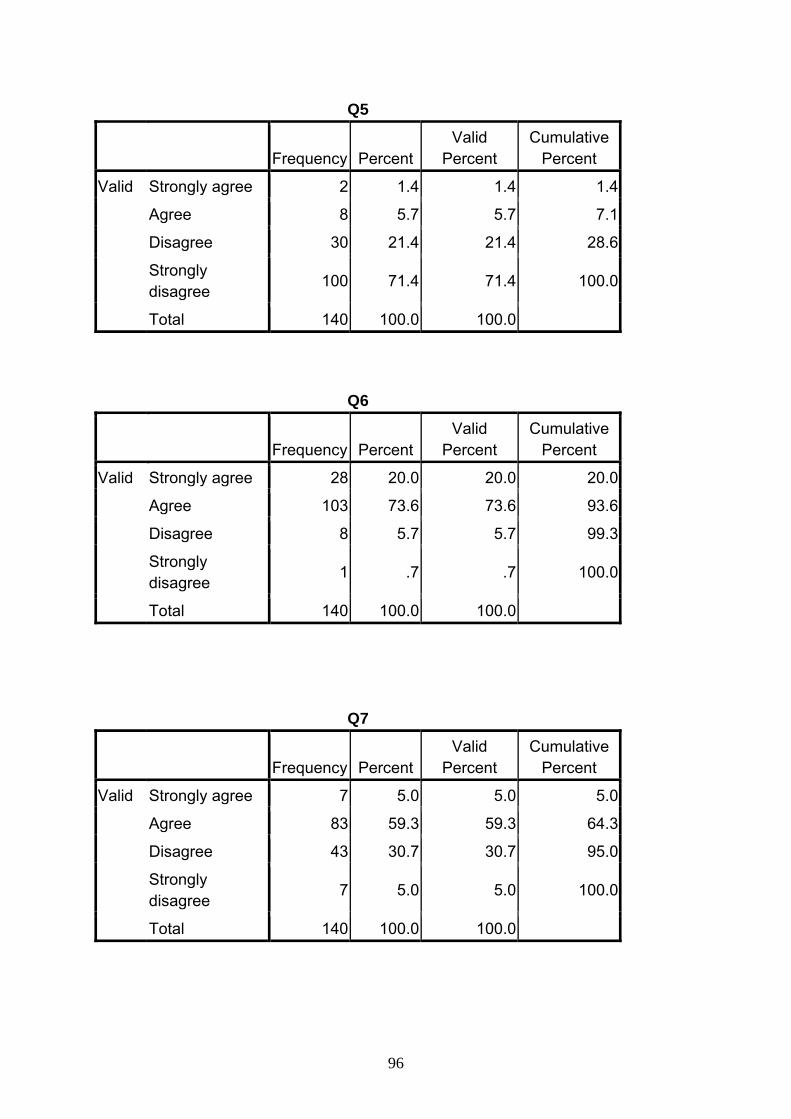
6 93.6 6.4 100
7 64.3 35.7 100
8 79.3 20.7 100
76
RECOMMENDATIONS
Development and use of appropriate applicable framework / model for
effective and efficient management of waste tyres by countries is essential.
Characteristics that can make the proposed waste tyre management model to
be implemented in waste management systems are:
• Consumers or general public must be well informed about waste management
matters including applicable legislations. These characteristic enable the
consumers to actively participate and support existing waste tyre and other
waste management systems. The consumers play an import part in the
management of waste and thus become whistle blowers for non complying
companies that are menacing the environment and can challenge such
companies in the courts of law.
• Appropriate legislation
The legislation must be specific and not ambiguous; address waste tyres in an
integrated manner such that generation, collection, transportation, treatment
and final disposal are monitored through the Waste Information System. The
legislation must give guidance on storage, handling and treatment /
processing. Tyre manufacturers are an important player and are leading the
technology development to enhance compliance with the existing legislations.
• Economic instruments
Most of the developed countries use economic instruments, like tax
incentives, tax charges or in some instances the levy system to address
environmental impacts associated with waste tyres. For example, economic
77
instrument assist companies to set up recycling plants, give tax incentives to
companies that recycle waste tyres.
• Free market system
Countries such as the United Kingdom with stringent enforcement agent do
not attach any form of levy to waste tyres. However, once a legislation is
passed or enacted, the environmental agency will make sure that the industry
complies and if not, stringent fines will be imposed as stipulated by the law.
The command and control sanction is favoured. The tyre industries created an
association and regulate their activities.
• Law enforcement agencies
A country need to have effective and functional agencies that are well
equipped with capacity and supported by the environmental courts.
Short comings of developing countries on waste management
Developing countries have waste management systems that are not compatible
with socio economic development in many cases. Some countries are thriving
with defective policies, legislations and some have insufficient capacities.
Interestingly, in South Africa environment including waste management is not
prioritized. Consumers are not sufficiently up dated about developments in waste
management. Consumers do not see themselves as part of the solution for waste
management problems. There are no environmental courts, which is the biggest
challenge. It is however recommended that vigorous public awareness
programmes on environmental issues especially waste management should be
carried out. Furthermore, appropriate legislation for integrated waste
78
management should be enacted. Enforcement agencies are developed,
capacitated and equipped with the necessary skills, legal power and dedicated
unit that can coordinate and work with other agencies to streamline the function
in teamwork approach. Most importantly, environmental courts should be
developed. Below is the formulated model on waste tyre management, see Fig.
10 below.
Fig. 10: Waste Tyre Model (source: Formulated by the researcher).
- Free market / Economic instruments (levy or tax system)
- Effective enforcement agency
79
CONCLUSIONS
The diverse range of views and opinions obtained in this study revealed the
independence of opinion within the sampled groups. Results showed that
opportunities and potential job creation from waste tyre recycle are not harnessed by
the government. Hence, there is a need for leadership through focused legislation
that will regulate the handling, disposal and recycling of waste tyres in the country
which the tyre industries are eagerly awaiting. The absence of adequate legislation
created many waste tyre illegal dumps sites especially in less developed areas
where unemployed people use them for various purposes. The current state of
unregulated disposal poses serious threat to human, environment and health. The
results also revealed that the community is unaware of the role of the government
with respect to waste tyre management. In addition, it could be inferred that the low
socio-economic level of people, presented by high unemployment rate in the country
contributes to the problem of waste tyre management. People living in informal
settlements tend to burn waste tyres for heat generation, especially during winter
season and to recover the steel strap for some income. This act can contribute to the
national, regional and possibly global atmospheric pollution. The government is
required to provide leadership in this direction through appropriate legislation,
enforcement and control.
80
REFERENCES
Adhikari, B., De, D. and Maiti, S. (2000). Reclamation and Recycling of Waste Rubber. Progress in Polymer Science, 25, 909 – 948. ANZECC (1994). Australia and New Zealand, Environment and Conservation Council. National Guideline for the Management of Waste Tyre: National Manifest and Classification System. ASTMC (1994). Australian Scrap Tyre Management Council. Solving Australia’s Scrap Tyre Disposal Problem: An Industry based Solution, mimeo. Barlaz, M.A., Eleazer, W.E and Whittle, D.J. (1993). Potential to use waste tires as supplemental fuel in pulp and paper mill boilers, cement kilns and in road pavement. Waste Management Resource, 11, 463–480. CSABS (2005). Council for South African Bureau of Standards. Standard Specification for the Production of reconditioned tyres. General SANS 1550. Constitution of the Republic of South Africa (1996). Bill of Rights. Pretoria DACST (2004). Department of Arts, Culture, Science and Technology. Innovation Fund: Round 4. Unpublished internal document, Pretoria. DEAT (1989). Department of Environmental Affairs and Tourism. Environment Conservation Act No. 73 of 1989, Pretoria. DEAT (2000). Department of Environmental Affairs and Tourism. Policy on Integrated Pollution and Waste Management, Pretoria. DEAT (2004). Department of Environmental Affairs and Tourism. Air Quality Management Act, No. 39 of 2004, Pretoria. DEAT (2005). Department of Environmental Affairs and Tourism. Environment Conservation Act No. 73 of 1989, Amendment 2005, Pretoria. DEAT (2007). Department of Environmental Affairs and Tourism. Waste Tyre Regulations No. 147 of 2007. Published for comments, Pretoria. DEAT (2008). Department of Environmental Affairs and Tourism. Waste Tyre Regulations No. 425 of 2008. Published for comments, Pretoria. DEFRA (2005). Department of Environment, Food and Rural Affairs. Annual report, London. DEWHA (2001). Department of Environment, Water, Heritage and Arts. National Approach to Waste Tyres. Canberra, Australia. DWAF (1998). Department of Water Affairs and Forestry. Minimum requirements for Monitoring at Waste Management Facilities. Pretoria.
81
Edwards, A.C.and Smith, A. R (1997). Recycling of Bituminous materials, Feasibility Study. TRLProjects OSC/117/97, Unpublished internal document. EN (2006). Engineering News. Feasibility study into KwaZulu Natal Tyre Recycling Project. October 10), p19. EPAQ (1999). Environment Protection Agency of Queensland. A Strategy for Managing Waste Tyres in Queensland. ETRMA (2006). European Tyre and Rubber Manufacturers Association, Report . EU (1999). European Union. Landfill Directive:1999/31/EC. EU (2007). European Union. Landfill Directive: 2000/76/EC. Fleck, E (2006). A long – time flame: Waste to energy still goes strong in Europe. Waste Management World. 7 (7), 8 -12. Goodyear (1995). Scrap Tyre Recovery – An Analyses of alternatives. 142-178. Hoddinott, E.D.S (1997). Tyre shreds as operationss layer materials at municipal waste. American Society for Testing and Materials. 33 (4), 6-8. Human, E. H. (2005). Solid Waste Reduction Management with Special reference to developing countries. Unpublished DBL Thesis, University of South Africa (UNISA), Pretoria. Human, E. (2006). Waste tyre levy for South Africa. Pretoria News. p24, December 12. Humphrey, D.N. Katz, L.E and Bluementhal, M (1997). Water Quality Effects of Tire Chip Fills placed above the groundwater table. Journal of Environmental Management. 75 (3), 14 -16. Jang, J.W., Yoo. T.S, Oh, J.S and Iwasaki, I. (1998). Discarded tyre recycling practices in the United States, Japan and Korea, Resources, Conservation and Recycling, 22, 1–14. Leedy, P.D. (1997). Practical Research - Planning and Design (5th Edition). New York: Macmillan. Liaskos, J. (1994). Rubber & Tyre Recycling. UNEP Industry and Environment. 18 -21. ODNR (2005). Ohio Department of Natural Resources. Report, p23 - 30 Prisciandaro, M.G., Mazziotti, G and Veglió, F (2003). Effect of burning supplementary waste fuels on the pollutant emissions by cement plants: a statistical analysis of process data. Resource Conservation and Recycling, 39, 161–84.
82
Reisman, J.I. (1997). Air Emissions from Scrap Tire Combustion. United States National Risk Management Environmental Protection Research Laboratory. Agency Cincinnati, Report OH 45268. Rudolph, L.R. (1995). An Economic Analysis of Recycling - Closing the Loop. Unpublished PhD Thesis. University of Connecticut, Connecticut. SATMC (2005), South African Tyre Manufacturing Conference Business Plan, Tyre Recycling Plan and the National Waste Management Strategy Implementation, South Africa; Project Steering Committee. SATRP (2008). South African Tyre Recycling Process, Scott, D. J. (1988). Understanding the Contemporary Recycling Ethos - Qualifying the Quantitative. Unpublished PhD Thesis. York University, Canada. STMR (1994). Scrap Tyre Market Report. USA. Sharma, V. F., Fotuna, F. and Mincarini, M. (2000). Disposal of Waste Tyres for Energy Recovery and Safe Environment. Applied Energy.65, 381 – 394. Sieve, A (1996). “Conference Paper” Tyre shreading as a Tyre Disposal Technology. The full cycle of responsibility. Brisbane. Stedge, G.D. (1996). Solid Waste Disposal and Enforcement with an Application to Virginia’s Srap tires. Unpublished PhD Thesis. Virginia Polytech Institute and State University, Virginia. UKEA (2004). United Kingdom Environment Agency. Waste Tyre Report, London. UKEA (2003). United Kingdom Environment Agency. Hazard Chemicals Report, London. UNCED (1992). United Nations Conference on Environment and Development. June 3-14, Rio de Janeiro, Brazil. UNEP (1998). United Nations Environment Programme. Technical Working Group of Basel Convention. (unpublished). UNEP (1999). United Nations Environment Programme. Basel Convention Series. Identification and Management of Used Tyres. (Report SBC No. 99/008). USDT (2001). United States Department of Transport, Annual Report. USSEAR (2000). United States Secretary of Energy Advisory, Report. van Beukering, P.J and Jassen, M.A. (2001). Dynamic lifecycle analysis of tyres in Western Europe, Resources, Conservation and Recycling, 33, 235 – 265.
83
Weng, Y.C. and Chang, N.B. (2001). The development of sanitary landfill in Taiwan and its cost structure analysis. Resource, Conservation and Recycling, 33, 181–201. Winkler, A.C. and McCuen, J.R. (1997). Writing the Research Paper – a handbook. Harcourt Brace-Jovanovich, Inc., USA. Wenzel, R. (1998). Tyre Recycling in Australia, Discussion paper presented to the Waste Management Association of Australia, Brisbane.
84
APPENDIXES
Appendix 1: Copy of the questionnaire administered for responses.
1. Do you see / consider waste tyres or the management thereof, a problem in your
7. Are there efficient processes or applications that use waste tyres ? 1 Strongly agree 2 Agree 3 Not Agree 4 Strongly disagree ___________________________________________________________________
8. Do you think waste tyre utilization and recycling can create wealth and jobs
(i). Table 1: Some hazardous substances found in Tyres
(ii). Table 2: Materials Used in the Manufacture of Tyres
(iii). Table 3: Cost saving per tyre using cryogenically ground rubber
(iv). Table 4: Incineration Emission Limit (IEL) for some chemical compounds
(v). Table 5: Emissions Limits set by the EC Directive on Waste Incineration
(vi). Table 6: Concentration limits of some pollutants present in tyres
(vii). Table 7: Levies/fees charged on tyre production in selected US states
(viii). Table 8: Distribution pattern of respondents from sampled areas
(ix). Table 9: Frequency and percentage participation by various groups
(x). Table 10: Percentage (%) response on nuisance of waste tyres
(xi). Table 11: Percentage (%) response on severity of waste tyre problems in poor
communities
(xii). Table 12: Percentage (%) response to waste tyre as contributor to
environmental pollution
(xiii). Table 13: Percentage (%) response on legal framework for waste tyre
management.
(xiv). Table 14: Percentage (%) response to government for community programme
on waste tyre management
(xv). Table 15: Percentage (%) response on pollution reduction through waste tyre
utilization and recycling.
(xvi). Table 16: Percentage (%) responses on applications that utilize waste tyres
(xvii). Table 17: Percentage (%) response on wealth and job creation through waste
tyre utilization
(xviii). Table 18: Overall responses by all the surveyed groups
87
Appendix 3: List of Figures
(i). Figure 1: Surplus and Shortage vs. the price of products
(ii). Figure 2: Allocative efficiency of Production Resources
(iii). Figure 3: Burning of waste tyres creating Air and Soil pollution.
(iv). Figure 4: An example of polluted soil from waste tyre burning.
(v). Figure 5: Floor mat and turf made from waste tyres.
(vi). Figure 6: Rubber mats made from waste tyres.
(vii). Figure 7: Wheel burrows wheel from waste tyres
(viii). Figure 8: Waste bins made from waste tyres.
(ix). Figure 9: Various products made from waste tyres
(x). Figure 10: Waste Tyre Model
(xi). Figure 11a: Map of South Africa and the nine provinces
(xii). Figure 11b: Map of the survey area within Gauteng Province.
(xiii). Figure 12: Distribution of responses on nuisance of waste tyres
(xiv). Figure 12: Distribution of responses on nuisance of waste tyres
(xv). Figure 13: Responses on severe of waste tyre problems in poor communities (xvi). Figure 14: Responses on waste tyre as contributor to environmental pollution.
(xvii). Figure 15: Distribution of responses on legal framework of waste tyre
management.
(xviii) Figure 16: Responses on government or community programme on waste
tyre management.
(xix) Figure 17: Responses on pollution reduction through waste tyre utilization and
recycling.
(xx) Figure 18: Spread of responses on applications that utilize waste tyres.
Pollution
88
(xxi) Figure 19: Response on wealth and job creation through waste tyre utilization
and recycling.
89
Appendix 4: List of Acronyms
APPA Air Pollution Prevention Act
CAPCO Chief Air Pollution Control Officer CSABS Council of the South African Bureau of Standards DACST Department of Arts, Culture, Science and Technology
DEAT Department of Environmental Affairs and Tourism
DEFRA Department of Environment, Food and Rural Affairs DEWHA Department of Environment, Water, Heritage and Arts DWAF Department of Water Affairs and Forestry ECA Environment Conservation Act EN Engineering News EPAQ Environment Protection Agency of Queensland
ETRMA European Tyre and Rubber Manufacturers Association EU European Union IPWM Integrated Pollution and Waste Management ODNR Ohio Department of Natural Rsources SABS South African Bureau of Standards SATMC South African Tyre Manufacturers Conference SATRP South African Tyre Recycling Process Company
STMR Scrap Tyre Market Report TDF Tyre Derived Fuel UKEA United Kingdom Environmental Agency
UNCED United Nations Conference on Development and
Environment
UNEP United Nations Environment Programme
USDT United States Department of Transport
90
USEPA United States Environment Protection Agency US SEAR United States Secretary of Energy Advisory Report
WTO World Trade Organisation WTR Waste Tyre Regulations
91
LETTER OF INTRODUCTION
COLLEGE OF AGRICULTURE AND ENVIRONMENTAL SCIENCES DEPARTMENT OF ENVIROMENTAL SCIENCES
TO WHOM IT MAY CONCERN DATE: 2007.09.25 LETTER OF INTRODUCTION OF MR LUCAS MAHLANGU This is to introduce and attest that the above named person is a registered Masters
Degree student in the Department of Environmental Science, College of Agriculture and
Environmental Sciences, University of South Africa.
He is carrying out a research into the Waste Tyre Management Problems in South Africa
and any form assistance that would positively impact and contribute to the success of his
endeavour would be highly appreciated.
Sincerely,
Prof. O.R Awofolu Supervisor Department of Environmental Sciences, CAES Tel: 0123524059
92
Appendix 6: Computer Analysis of Data obtained from the research
Waste Tyre Management Problems in SA: Mr Lucas Mahlangu Computer Analysis: OV Kilpert
23 May 2008 Frequency Table of Research Groups
Groups
Frequency PercentValid
PercentCumulative
Percent
Valid National department 7 5.0 5.0 5.0
Provincial department 5 3.6 3.6 8.6
Local governments 17 12.1 12.1 20.7
Communities 22 15.7 15.7 36.4
NGOs 6 4.3 4.3 40.7
CBOs 1 .7 .7 41.4
Recyclers 10 7.1 7.1 48.6
Retreaders 2 1.4 1.4 50.0
Reclaimers 14 10.0 10.0 60.0
Dealers 26 18.6 18.6 78.6
Waste collection companies 30 21.4 21.4 100.0
Total 140 100.0 100.0
93
Chart representation of frequency and percentage for all groups
Municipal areas frequency and percent table within the Sample
Municipal areas
Frequency PercentValid
Percent Cumulative
Percent
Valid Ekurhul 31 22.1 22.1 22.1
Emfulen 24 17.1 17.1 39.3
Jo'burg 38 27.1 27.1 66.4
Tshwane 47 33.6 33.6 100.0
Total 140 100.0 100.0
94
Graphical representation of municipal areas frequency and percentage
Responses by all Groups to the questions (From Q 1 – Q 8 in the questionnaire)
Q1
Frequency PercentValid
Percent Cumulative
Percent
Valid Strongly agree
49 35.0 35.0 35.0
Agree 77 55.0 55.0 90.0
Disagree 14 10.0 10.0 100.0
Total 140 100.0 100.0
95
Q2
Frequency PercentValid
PercentCumulative
Percent
Valid Strongly agree 36 25.7 25.7 25.7
Agree 101 72.1 72.1 97.9
Disagree 2 1.4 1.4 99.3
Strongly disagree 1 .7 .7 100.0
Total 140 100.0 100.0
Q3
Frequency Percent
Valid Percent
Cumulative Percent
Valid Strongly agree 27 19.3 19.3 19.3
Agree 97 69.3 69.3 88.6
Disagree 13 9.3 9.3 97.9
Strongly disagree 3 2.1 2.1 100.0
Total 140 100.0 100.0
Q4
Frequency Percent
Valid Percent
Cumulative Percent
Valid Strongly agree 2 1.4 1.4 1.4
Agree 12 8.6 8.6 10.0
Disagree 86 61.4 61.4 71.4
Strongly disagree 40 28.6 28.6 100.0
Total 140 100.0 100.0
96
Q5
Frequency PercentValid
PercentCumulative
Percent
Valid Strongly agree 2 1.4 1.4 1.4
Agree 8 5.7 5.7 7.1
Disagree 30 21.4 21.4 28.6
Strongly disagree 100 71.4 71.4 100.0
Total 140 100.0 100.0
Q6
Frequency Percent
Valid Percent
Cumulative Percent
Valid Strongly agree 28 20.0 20.0 20.0
Agree 103 73.6 73.6 93.6
Disagree 8 5.7 5.7 99.3
Strongly disagree 1 .7 .7 100.0
Total 140 100.0 100.0
Q7
Frequency Percent
Valid Percent
Cumulative Percent
Valid Strongly agree 7 5.0 5.0 5.0
Agree 83 59.3 59.3 64.3
Disagree 43 30.7 30.7 95.0
Strongly disagree
7 5.0 5.0 100.0
Total 140 100.0 100.0
97
Q8
Frequency PercentValid
PercentCumulative
Percent
Valid Strongly agree 67 47.9 47.9 47.9
Agree 44 31.4 31.4 79.3
Disagree 10 7.1 7.1 86.4
Strongly disagree 19 13.6 13.6 100.0
Total 140 100.0 100.0
Reliability of Samples (Statistical reliability testing of sample) Scale: ALL VARIABLES
Case Processing Summary N %
Cases Valid 140 100.0
Excludeda 0 .0
Total 140 100.0a. List wise deletion based on all variables in the procedure.
Reliability Statistics
Cronbach's Alpha N of Items
.570 8
98
Cross tabulation of municipal areas response per question
1 * Municipal Areas Cross tabulation Municipality Ekurhul Emfulen Jo'burg Tshwane Total
Q1 Strongly agree
Count 13 7 11 18 49
% within municipal area
41.9% 29.2% 28.9% 38.3% 35.0%
% of Total 9.3% 5.0% 7.9% 12.9% 35.0%
Agree Count 18 13 23 23 77
% within municipal areay
58.1% 54.2% 60.5% 48.9% 55.0%
% of Total 12.9% 9.3% 16.4% 16.4% 55.0%
Disagree Count 0 4 4 6 14
% within municipal area
.0% 16.7% 10.5% 12.8% 10.0%
% of Total .0% 2.9% 2.9% 4.3% 10.0%
Total Count 31 24 38 47 140
% within municipal area
100.0% 100.0% 100.0% 100.0% 100.0%
% of Total 22.1% 17.1% 27.1% 33.6% 100.0%
99
Q2 * Municipal Areas Cross tabulation Municipality Ekurhul Emfulen Jo'burg Tshwane Total
Q2 Strongly agree Count 5 6 9 16 36
% within municipal area
16.1% 25.0% 23.7% 34.0% 25.7%
% of Total 3.6% 4.3% 6.4% 11.4% 25.7%
Agree Count 26 18 28 29 101
% within municipal area
83.9% 75.0% 73.7% 61.7% 72.1%
% of Total 18.6% 12.9% 20.0% 20.7% 72.1%
Disagree Count 0 0 1 1 2
% within municipal area
.0% .0% 2.6% 2.1% 1.4%
% of Total .0% .0% .7% .7% 1.4%
Strongly disagree
Count 0 0 0 1 1
% within municipal area
.0% .0% .0% 2.1% .7%
% of Total .0% .0% .0% .7% .7%
Total Count 31 24 38 47 140
% within municipal area
100.0% 100.0% 100.0% 100.0% 100.0%
% of Total 22.1% 17.1% 27.1% 33.6% 100.0%
100
Q3 * Municapal Areas Cross tabulation Municipality Ekurhul Emfulen Jo'burg Tshwane Total
Q3 Strongly agree Count 7 3 4 13 27
% within municipal area
22.6% 12.5% 10.5% 27.7% 19.3%
% of Total 5.0% 2.1% 2.9% 9.3% 19.3%
Agree Count 24 17 30 26 97
% within municipal area
77.4% 70.8% 78.9% 55.3% 69.3%
% of Total 17.1% 12.1% 21.4% 18.6% 69.3%
Disagree Count 0 4 3 6 13
% within municipal area
.0% 16.7% 7.9% 12.8% 9.3%
% of Total .0% 2.9% 2.1% 4.3% 9.3%
Strongly disagree
Count 0 0 1 2 3
% within municipal area
.0% .0% 2.6% 4.3% 2.1%
% of Total .0% .0% .7% 1.4% 2.1%
Total Count 31 24 38 47 140
% within municipal area
100.0% 100.0% 100.0% 100.0% 100.0%
% of Total 22.1% 17.1% 27.1% 33.6% 100.0%
101
Q4 * Municipal Areas Cross tabulation Municipality Ekurhul Emfulen Jo'burg Tshwane Total
Q4 Strongly agree Count 1 0 1 0 2
% within municipal area
3.2% .0% 2.6% .0% 1.4%
% of Total .7% .0% .7% .0% 1.4%
Agree Count 1 1 1 9 12
% within municipal area
3.2% 4.2% 2.6% 19.1% 8.6%
% of Total .7% .7% .7% 6.4% 8.6%
Disagree Count 22 14 25 25 86
% within municipal area
71.0% 58.3% 65.8% 53.2% 61.4%
% of Total 15.7% 10.0% 17.9% 17.9% 61.4%
Strongly disagree
Count 7 9 11 13 40
% within municipality 22.6% 37.5% 28.9% 27.7% 28.6%
% of Total 5.0% 6.4% 7.9% 9.3% 28.6%
Total Count 31 24 38 47 140
% within municipality
100.0% 100.0% 100.0% 100.0% 100.0%
% of Total 22.1% 17.1% 27.1% 33.6% 100.0%
102
Q5 * Munucipal Areas Cross tabulation Municipality Ekurhul Emfulen Jo'burg Tshwane Total
Q5 Strongly agree Count 0 0 1 1 2
% within municipal area
.0% .0% 2.6% 2.1% 1.4%
% of Total .0% .0% .7% .7% 1.4%
Agree Count 1 0 3 4 8
% within municipal area
3.2% .0% 7.9% 8.5% 5.7%
% of Total .7% .0% 2.1% 2.9% 5.7%
Disagree Count 7 3 7 13 30
% within municipal area
22.6% 12.5% 18.4% 27.7% 21.4%
% of Total 5.0% 2.1% 5.0% 9.3% 21.4%
Strongly disagree
Count 23 21 27 29 100
% within municipal area
74.2% 87.5% 71.1% 61.7% 71.4%
% of Total 16.4% 15.0% 19.3% 20.7% 71.4%
Total Count 31 24 38 47 140
% within municipal area
100.0% 100.0% 100.0% 100.0% 100.0%
% of Total 22.1% 17.1% 27.1% 33.6% 100.0%
103
Q6 * Municipal Areas Cross tabulation City Ekurhul Emfulen Jo'burg Tshwane Total
Q6 Strongly agree Count 3 6 8 11 28
% within municipal area
9.7% 25.0% 21.1% 23.4% 20.0%
% of Total 2.1% 4.3% 5.7% 7.9% 20.0%
Agree Count 27 18 28 30 103
% within municipal area
87.1% 75.0% 73.7% 63.8% 73.6%
% of Total 19.3% 12.9% 20.0% 21.4% 73.6%
Disagree Count 1 0 2 5 8
% within municipal area
3.2% .0% 5.3% 10.6% 5.7%
% of Total .7% .0% 1.4% 3.6% 5.7%
Strongly disagree
Count 0 0 0 1 1
% within municipal area
.0% .0% .0% 2.1% .7%
% of Total .0% .0% .0% .7% .7%
Total Count 31 24 38 47 140
% within municipal area
100.0% 100.0% 100.0% 100.0% 100.0%
% of Total 22.1% 17.1% 27.1% 33.6% 100.0%
104
Q7 * Municipal Areas Cross tabulation Municipality Ekurhul Emfulen Jo'burg Tshwane Total
Q7 Strongly agree Count 1 0 2 4 7
% within municipal area
3.2% .0% 5.3% 8.5% 5.0%
% of Total .7% .0% 1.4% 2.9% 5.0%
Agree Count 25 18 22 18 83
% within municipal area
80.6% 75.0% 57.9% 38.3% 59.3%
% of Total 17.9% 12.9% 15.7% 12.9% 59.3%
Disagree Count 5 4 13 21 43
% within municipal area
16.1% 16.7% 34.2% 44.7% 30.7%
% of Total 3.6% 2.9% 9.3% 15.0% 30.7%
Strongly disagree
Count 0 2 1 4 7
% within municipal area
.0% 8.3% 2.6% 8.5% 5.0%
% of Total .0% 1.4% .7% 2.9% 5.0%
Total Count 31 24 38 47 140
% within municipal area
100.0% 100.0% 100.0% 100.0% 100.0%
% of Total 22.1% 17.1% 27.1% 33.6% 100.0%
105
Q8 * Municipal Areas Cross tabulation Municipality Ekurhul Emfulen Jo'burg Tshwane Total
Q8 Strongly agree Count 11 13 19 24 67
% within municipal area
35.5% 54.2% 50.0% 51.1% 47.9%
% of Total 7.9% 9.3% 13.6% 17.1% 47.9%
Agree Count 11 8 13 12 44
% within municipal area
35.5% 33.3% 34.2% 25.5% 31.4%
% of Total 7.9% 5.7% 9.3% 8.6% 31.4%
Disagree Count 1 1 1 7 10
% within municipal area
3.2% 4.2% 2.6% 14.9% 7.1%
% of Total .7% .7% .7% 5.0% 7.1%
Strongly disagree
Count 8 2 5 4 19
% within municipal area
25.8% 8.3% 13.2% 8.5% 13.6%
% of Total 5.7% 1.4% 3.6% 2.9% 13.6%
Total Count 31 24 38 47 140
% within municipal area
100.0% 100.0% 100.0% 100.0% 100.0%
% of Total 22.1% 17.1% 27.1% 33.6% 100.0%
106
Frequency tables of sampled respondents and sector groupings within the whole sample.