1 WASTE WATER TREATMENT IN SOUTH SUMATRA : BETWEEN OPPORTUNITIES AND CHALLENGES Presented by: Ir. Lukitariati, M.Si (The Head of Environmental Agency – The Provincial Government) Badan Lingkungan Hidup Provinsi Sumatera Selatan Environmental Agency The Government of South Sumatra 2014 INTRODUCTION
Transcript
1
WASTE WATER TREATMENT IN SOUTH SUMATRA : BETWEEN OPPORTUNITIES AND CHALLENGES
Presented by:
Ir. Lukitariati, M.Si
(The Head of Environmental Agency – The Provincial Government)
Badan Lingkungan Hidup Provinsi Sumatera Selatan
E n v i r o n m e n t a l A g e n c y
T h e G o v e r n m e n t o f S o u t h S u m a t r a
2 0 1 4
INTRODUCTION
2
Region Profile
Area : 91,774.99 km2
Shore Line : +445 km
Population : 8.4 milliion
Administration :
13 Regencies 231 Sub District
4 Municipalities 384 Urban Villages
2,812 Rural Villages
Surface Water in South Sumatra
Main River : Sungai Musi - drains 750 km long
- pass 8 regencies and 1
municipality
Tributaries:
1. Komering
2. Ogan
3. Lematang
4. Musi Hulu
5. Semanggus
6. Kelingi
7. Kikim
8. Lakitan
9. Batang Hari Leko
10.Rawas
11.Musi Hilir
3
Water Quality
0
10
20
30
40
50
60
70
80
2010 2013
Highly Deteriorated
Deteriorated
Fair
Good
2010 2013
Good 0 0
Fair 0 0
Deteriorated 65 58
Highly Deteriorated 7 14
Data : water quality in 72 monitoring points
which are widespread in South Sumatra
Water-Quality Parameters of highly deteriorated point
Status Mutu Kualitas Air Menurut Sistem Nilai Storet Stasiun Pulau Pinang
17 Total Coliform jlh/100 ml 3,000.00 3,100.00 1,600.00 1000.00 3,100.00 1,600.00 2,566.67 -15
STATUS MUTU AIR -36
4
Three major sources of Water Pollution :
1. Industrial Activities
fertilizers; oil and mining; Crumb Rubber; Palm oil; and Pulp and Paper
2. Agriculture
Paddies and Plantation (individual and corporate)
3. Domestic
Human (water and Solid Waste), dumping solid waste, and water transportation
LARGEST CONTRIBUTION OF GREEN HOUSE GASES
FROM WASTE SECTOR IN SOUTH SUMATRA
Category/Sub Category Estimation of GHG (2012)
ton CO2-eq 4A1: Domestic solid waste disposal 187.630 4A2: Composting 664 4A3: Open burning 202.395 4D1: Domestic Wastewater treatment&discharge 689.350 4D2: Industrial wastewater (karet + sawit) 510.220 Jumlah 1.590.259
Tabel 4. Estimation of GHG from waste sector (data tahun 2012)
Graph. Contribution per Sub-Category of GHG in South Sumatra From Waste Sector
5
Managing and Controlling Quality of Environment in South Sumatra
Commitment of Provincial Government on Managing and Controlling Environments
Central Government Policies on Environment
Medium and Short – term Planning
Integrative Study on Environment Status
6
MISSION
VISION
- Provincial Government – Environmental Agency
Achieving good and healthy environment to
support environmentally sustainable
development in South Sumatra
• Pursuing better quality of environment, including water, air and land cover •Controlling the increase of Green House Gas Emission •Enhancing Capacity Building of Environmental Agency on Managing Environment
Activities on Managing and Controlling Environment
Managing Environment:
1.Assessing environmental performance on 100
companies. Those have to comply government
regulations on controlling environment.
2.Educating people on environmental
awareness.
3.Monitoring Air and Water Quality for Basis
Data on development.
4.Constructing facilities of integrative domestic
wastewater treatment in three points.
7
Communal Wastewater Treatment Plant
BACKGROUND
People who live near
the river, do washing
and bathing.
Water are mostly polluted
by Fecal Coli and other
chemicals from
wastewater discharge as
well as fertilizers… (refer
to data)
8
Alongside Musi
River, People have
floating toilets for
defecation and
urination
Traditional group,
who do not have
sufficient
knowledge on
healthy sanitation
and have
economic
constraints, have
one toilets for one
family
Communal Wastewater Treatment Plant
• Municipal Government construct three Communal Wastewater Treatments Plants; located in Jayalaksana, Prajuritnangyu, and Kasnariansyah.
• The areas are highly populated. Kasnariansyah is noted about 1000 people live in rented flat. In Jayalaksana and Prajurit nangyu there are about 2000 people each location (slum areas)
9
Technology : Anaerobic Baffle Reactor
TOILETS
Biodegester - REACTOR Bio Gas
for
Cooking
Water, from end-pipe outlet, sent to
environment
TOILETS in Communal Wastewater Treatment Plant
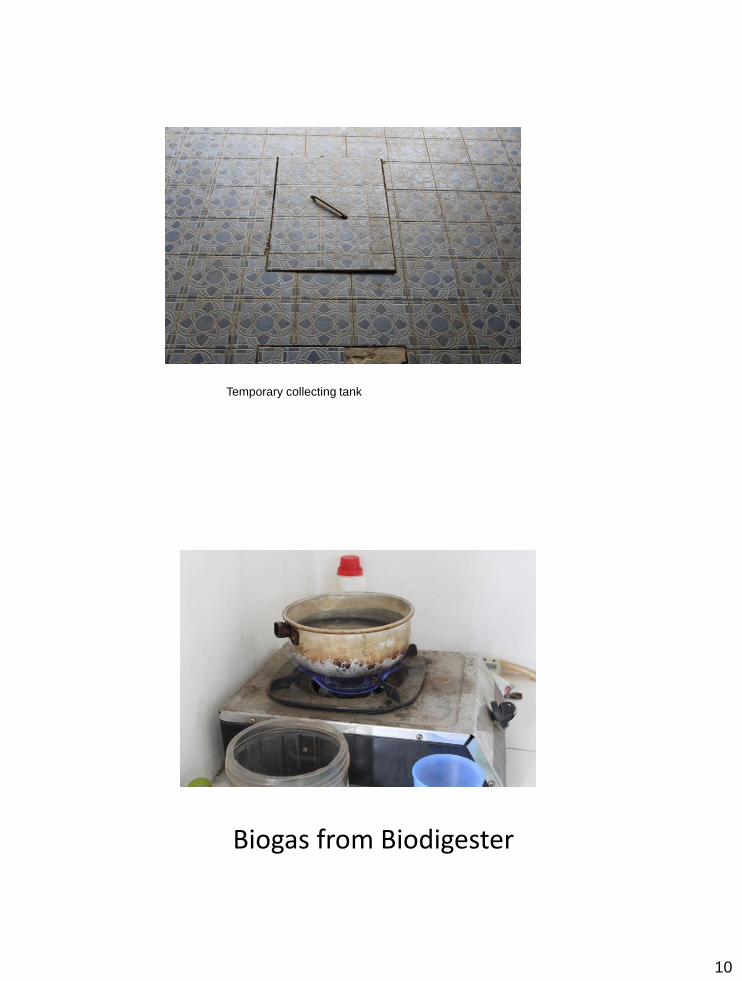
10
Temporary collecting tank
Biogas from Biodigester
11
BENEFITS :
• Low cost operation system
• Bio-gas can be used for cooking and electricity
• Ecological friendly waste (minimum impact)
• Healthy sanitation
• Economic generation (payment service – affordable)
• Sustainable development because water is less deteriorated.
POTENCY OF METHANE EMISSION FROM DOMESTIC WASTEWATER IN SOUTH SUMATRA
Type of wastewater treatment MCF Emisi CH4
(ton CO2-eq) Fraksi
Septic tank (individual) 0,5 353.975 57,5%
Communal Wastewater treatment (aerobic) – Unmanaged very well
0,3 3.172 0,5%
Direct dumping to environment 0,2 75.362 12,2%
To pond/rice field 0,5 17.128 2,8%
Wet latrine 0,7 165.854 26,9%
Total emisi CH4 615.492 100%
Notes:
a. Distribution of Wastewater treatment and discharge in South Sumatra (Riset Kesehatan Dasar, Kementrian Kesehatan RI, 2010):