64
Bundaberg East & Bargara Coastal Region Wastewater Treatment and Effluent Management Master Plan Bundaberg Regional Council Client Issue September 2009
Bundaberg East & Bargara Coastal Region
Wastewater Treatment and Effluent Management
Master Plan Bundaberg Regional Council
Client Issue September 2009
Bundaberg Regional Council

Report Details Project: Wastewater Treatment and Effluent Management Master Plan:
Bundaberg East & Bargara Coastal Region
Project No.: 2997
File Location: \\HO-FS1\Engineering\Projects\Bundaberg Regional Council\2997 - Bargara Regional Sewerage Masterplan (CL)\OUTPUTS\FINAL ISSUE\2997 – BRC Masterplan FINAL.docx
Document History and Status
Issue Report Status Prepared By Reviewed By Approved By Issue Date
1 Draft C Leah C SMITH C SMITH 15 July 2009 2 Client Issue C Leah & D Perry M Dawson C SMITH 5 August 2009 3 FINAL C. Leah C Smith 2 October 2009
Copyright © Hunter Water Australia Pty Limited, 2009 The concepts and information contained in this document are the property of Hunter Water Australia Pty Limited for
the sole use of the nominated client. Use or copying of this document without the written permission of Hunter Water Australia constitutes an infringement of copyright.
Hunter Water Australia Pty Limited
ACN 080 869 905 PO Box 5007 HRMC NSW 2310
Telephone 02 4941 5000

Bundaberg East & Bargara Coastal Region – Wastewater Treatment and Effluent Management Master Plan
Commercial in Confidence Page 1
Executive Summary This document, prepared by Hunter Water Australia, represents Bundaberg Regional Council’s Wastewater Treatment and Effluent Management Master Plan for Bundaberg East and the Bargara coastal region between Burnett Heads and Elliott Heads. Moore Park Beach has also been considered as a separate service area in preparing the plan.
Significant population growth is expected in Bundaberg and the Bargara coastal region. This Master Plan has been developed to identify the wastewater infrastructure required to support population growth in the region over the next 30 years and to improve the level of service provided to the community by programming the installation of sewer connections in backlog-growth areas that are currently served by on-site wastewater treatment systems. A staged approach to providing the infrastructure has been developed based on a logical expansion of the sewer network and the underlying population projections for each area. This staging provides flexibility and allows the costs associated with meeting the plan objectives to be spread over the planning period.
The environmental performance of wastewater treatment operations is a key consideration for Council. The strategies in the Master Plan acknowledge:
The proximity of the coastal communities to the Mon Repos Turtle Rookery and the Great Barrier Reef Marine Park, and
Council’s commitment under the current EPA licence requirements to consider, where possible, progressively reducing the annual load of contaminants released via the existing East Treatment Plant Burnett River discharge and Bargara ocean outfall.
Beneficial reuse of treated water for sustainable crop irrigation has been identified as the preferred strategy for the region. For the purpose of the Master Plan, it has been assumed that future treatment plants would be designed to produce effluent meeting Class A+ standards. This standard of treatment maximises reuse opportunities by providing treated water that is suitable for a wide range of uses including horticulture and sugar cane irrigation. It is expected that a regional effluent reuse and management strategy will be further developed as part of the planning process.
Following initial scoping and stake-holder consultation, four options were developed for further evaluation. The options are:
Option 1A: Construct a new centralised wastewater treatment plant to service all development areas. The treatment plant would be constructed in the vicinity of Bundaberg East. Beneficial reuse opportunities would initially be explored through Sunwater’s existing irrigation area, but the plan would also include the flexibility to utilise alternative reuse opportunities through irrigation in other areas including Council land. The plant would maintain a discharge to the Burnett River.
Option 1B: Construct two treatment plants: a centralised wastewater treatment plant to service Bundaberg East, Burnett Heads and Bargara and a second treatment plant located inland from Innes Park to service Innes Park and Elliott Heads. The centralised plant would pursue reuse opportunities through Sunwater’s existing irrigation area and would maintain a discharge to the Burnett River as for Option 1A. The Innes Park treatment plant would pursue beneficial reuse opportunities in the southern area, but would also require a new outfall

Bundaberg East & Bargara Coastal Region – Wastewater Treatment and Effluent Management Master Plan
Commercial in Confidence Page 2
to the Elliott or Burnett River in order to manage wet weather flows.
Option 1C: This option is identical to Option 1B, except that the southern wastewater treatment plant would be located inland from Elliott Heads. The Elliott Heads treatment plant would make use of beneficial reuse opportunities in the southern area, but would also require a new outfall to the Elliott River.
Option 2: This option is a decentralised strategy that involves the development of a plant to replace Bundaberg East and four coastal plants (Burnett Head, Elliott Head, Innes Park and Bargara). The new plants would require the establishment of land based reuse schemes and new outfalls from each treatment facility.
A scheme for Moore Park was also developed as a separate service area.
Preliminary cost estimates were developed for each option for comparison purposes. The cost estimates included the cost of the treatment plants, sewer network trunk mains and transfer pump stations. For the purpose of the master plan it was assumed that under Options 1B, 1C and 2, Council would acquire 50% of the land required for irrigation and a cost for land acquisition was included. Capital costs for each option were developed based on HWA’s proprietary cost curves and supported by recent contract values. The costs developed were considered suitable for comparative purposes but are not intended for budgeting purposes.
Stakeholders were involved in developing key objectives and success criteria for the Master Plan. Options were assessed using a multi-criteria analysis tool developed in consultation with Council to identify the preferred strategy. Results of the cost and non-cost assessment are summarised in the table below.
Option 1A 1B 1C 2
Non-Cost Criteria
State Government Support 12 9 9 7.5 Irrigation Community Support 10.5 10.5 10.5 7.5 Environmental Sustainability 10.5 9 9 6 Water Cycle Impacts 13.5 10.5 10.5 6 Customer Acceptability 4 7 7 6 Flexible Implementation 4 6.4 6.4 6.4 Affordability 4.8 4 4 5.6 Foreseeable risks 3.5 2.5 2.5 1.5 Impact on Liabilities 3 2 2 1.5 Health and Safety 2.8 2.4 2.4 2
Weighted Non-Cost Score 68.6 63.3 63.3 50
Non Cost Rank 1 2 2 3
Cost Comparison
Discounted Capital Cost $92.8M $112.5M $110.2M $99.7M Discounted Operating Cost $47.5M $58.3M $58.3M $59.9M
Total Discounted Cost $140.3M $170.8M $168.5M $159.6M
Cost Rank 1 4 3 2

Bundaberg East & Bargara Coastal Region – Wastewater Treatment and Effluent Management Master Plan
Commercial in Confidence Page 3
Option 1A – the construction of a new centralised treatment plant to service the catchment area was identified as the preferred option.
This option was favourable in terms of the cost comparison and also scored highest in the non-cost criteria, reflecting the key benefits that this strategy offers.
The key benefits of adopting the scheme are:
1. Adopting a centralised treatment strategy enables economies of scale in terms of treatment facility and reduces the number of facilities that the Council has to operate, monitor and report on.
2. The centralised scheme provides favourable environmental outcomes in that discharges to the Elliott River are avoided and over time the coastal effluent discharges are eliminated.
3. The strategy provides flexibility in terms of effluent management options. The new centralised plant is well located to make use of Sunwater’s existing irrigation infrastructure. A river discharge is also maintained.
4. This option is most likely to allow the reuse of treated water to substitute surface water allocations. The potential benefits of this substitution include increased environmental flows, increased security for town water supply, or improved water allocations for existing license holders.
5. This option is most likely to provide the best option for implementing a number of longer term effluent reuse opportunities such as dual reticulation to new development areas, managed aquifer recharge, or creation of a salt water intrusion barrier at Elliott Heads.
On this basis, it is recommended that Option 1A is adopted as the basis for future planning. A viable effluent management strategy has also been developed for Moore Park which comprises a single local treatment plant adjacent to a land based effluent management scheme.
As part of the implementation of this master plan strategy is acknowledged that additional work is required to further develop effluent management and reuse opportunities in the region. It is also recommended that ongoing consultation with the community is included in the planning process in order to manage the expectation of both developers and rate payers.
DISCLAIMER:
The Wastewater Treatment and Effluent Management Master Plan (The Master Plan) has been commissioned by Bundaberg Regional Council’s Infrastructure Services Department to provide a planning strategy for wastewater treatment and effluent management within the nominated study area. The Master Plan has been prepared for the express use by internal customers of the Bundaberg Regional Council only.
The Master Plan is not intended to be used as supporting land use planning documentation by external customers of Bundaberg Regional Council. Population growth assumptions utilised in the Model are not intended to be referenced or extrapolated in any form for land use planning applications. It is to be noted that population growth assumptions utilised in the Master Plan are not necessarily endorsed by Bundaberg Regional Council and will be subject to natural variations in population trends over time.

Bundaberg East & Bargara Coastal Region – Wastewater Treatment and Effluent Management Master Plan
Commercial in Confidence Page 4
Table of Contents ABBREVIATIONS ______________________________________________________ 6
1 INTRODUCTION _______________________________________________ 7
1.1 Scope ____________________________________________________ 7
1.2 Drivers ___________________________________________________ 7
2 EXISTING INFRASTRUCTURE ___________________________________ 8
3 MASTER PLAN OBJECTIVES _____________________________________ 10
3.1 Key stakeholders___________________________________________ 10
3.2 Objectives ________________________________________________ 10
4 STRATEGY DEVELOPMENT _____________________________________ 12
4.1 Population Growth _________________________________________ 12
4.2 Population Projections ______________________________________ 12
4.3 Service Level Requirements __________________________________ 13
4.4 Staging of Development _____________________________________ 15
4.5 Effluent Management Options ________________________________ 16
4.6 Land availability for irrigation _________________________________ 19
4.7 Irrigation Modelling ________________________________________ 20
4.8 Reused Effluent Quality Requirements __________________________ 21
4.9 Cost Estimating Methodology ________________________________ 22
5 STRATEGY OPTIONS __________________________________________ 25
5.1 Option 1A – Single Centralised Treatment Plant __________________ 25
5.2 Option 1B – Centralised treatment plant with second plant at School Lane ____________________________________________________ 28
5.3 Option 1C – Centralised treatment plant with second plant at Elliott Heads ___________________________________________________ 31
5.4 Option 2 – De-centralised Strategy _____________________________ 34
5.5 Comparative costs _________________________________________ 38
5.6 Flexibility to Develop Effluent Management Opportunities __________ 38
5.7 Moore Park Effluent Management Strategy ______________________ 39
6 MULTI CRITERIA ANALYSIS____________________________________ 40
6.1 Assessment Criteria ________________________________________ 40
6.2 Option Scores _____________________________________________ 41
7 RECOMMENDATIONS _________________________________________ 42
7.1 Bundaberg East & Bargara Coastal Region _______________________ 42
7.2 Moore Park _______________________________________________ 43
Bundaberg East & Bargara Coastal Region – Wastewater Treatment and Effluent Management Master Plan
Commercial in Confidence Page 5
List of Tables Table 3-1: Stakeholders ____________________________________________________ 10 Table 4-1: Adopted Population Growth Projection (EP) by Development Area _________ 13 Table 4-2: Current servicing and future objectives ________________________________ 14 Table 4-3 Irrigation Demand Planning Model Results _____________________________ 20 Table 4-4 Recent purchase prices of land acquired by Bundaberg Council _____________ 24 Table 5-1: Option 1A Planning Data __________________________________________ 25 Table 5-2: Option 1B Planning Data __________________________________________ 30 Table 5-3: Option 1C Planning Data __________________________________________ 33 Table 5-4: Option 2 Planning Data___________________________________________ 36 Table 5-5: Estimate of Likely Present Value of Costs (7% discount rate over 30 years) ____ 38 Table 5-6: Moore Park Planning Data _________________________________________ 39 Table 5-7: Moore Park Cost Estimate (7% Discount Rate over 30 years) ______________ 39 Table 6-1 Summary of MCA Results and Option Ranks ___________________________ 41
Exhibits Exhibit 1. Development catchment types
Exhibit 2. Existing features
Exhibit 3. Development staging
Exhibit 4. Option 1A – Single centralised treatment plant
Exhibit 5. Option 1B – Centralised treatment plant with second plant at School Lane
Exhibit 6. Option 1C - Centralised treatment plant with second plant at Elliott Heads
Exhibit 7. Option 2 – Decentralised strategy
Exhibit 8. Strategy for Moore Park
Appendices Appendix A. Cost estimates
Appendix B. Multi-criteria assessment methodology

Bundaberg East & Bargara Coastal Region – Wastewater Treatment and Effluent Management Master Plan
Commercial in Confidence Page 6
Abbreviations
ADWF average dry weather flow ADWG Australian Drinking Water Guidelines AEP annual exceedance probability BuCC (former) Bundaberg City Council BOD biochemical oxygen demand BOM Bureau of Meteorology, Australia BRC Bundaberg Regional Council BuPO Bundaberg Port Authority BuS Bundaberg Sugar BSC (former) Burnett Shire Council CED common effluent drainage CMF continuous microfiltration CSIRO Commonwealth Scientific and Industrial Research Organisation DO dissolved oxygen DPW Queensland Department of Public Works EIS Environmental Impact Statement ENSO El-Niño Southern Oscillation EP equivalent population EPA Queensland Environmental Protection Agency ET equivalent tenement GW Ground water HRC Healthy Rivers Commission HWA Hunter Water Australia LGA local government area NH3-N ammonia-N NRW Queensland Department of Natural Resources and Water NWQMS National Water Quality Management Strategy p.a. per annum PAC powdered activated carbon PMF probable maximum flood PS Planning Scheme QT Queensland Transport SPS sewerage pumping station SS suspended solids TN total nitrogen TP total phosphorus TSS total suspended solids WSUD water sensitive urban design WTP water treatment plant WQIP water quality improvement plan WQO water quality objectives WWPS Wastewater Pumping Station WWTP Wastewater Treatment Plant

Bundaberg East & Bargara Coastal Region – Wastewater Treatment and Effluent Management Master Plan
Commercial in Confidence Page 7
1 Introduction
1.1 Scope
Hunter Water Australia (HWA) has been engaged by Bundaberg Regional Council (BRC) to develop a sewerage treatment and effluent management master plan for Bundaberg East and the Bargara coastal region between Burnett Heads and Elliott Heads for the next 30 years. Moore Park Beach has also been considered as a separate service area.
This master plan builds upon the following planning strategies developed for the former Bundaberg City and Burnett Shire Councils:
GHD (March 2005) Burnett Coastal Sewerage Strategy.
HWA (January 2009) Planning Strategy for Bundaberg’s Wastewater Plants.
The amalgamation of the two councils in 2008 presents an opportunity to revisit these planning strategies to consider more regional solutions.
1.2 Drivers
This master plan presents a strategy for wastewater treatment and effluent management in a regional context. The drivers for Council are,
Need to cater for expected population growth over the next 30 years.
Need to cater for current and future environmental performance requirements from its wastewater treatment facilities.
Over the next 25 years the Wide Bay - Burnett region is predicted to have the second highest population growth in Queensland. Significant growth is predicted for Bundaberg and the Bargara coastal region with development expected to be most intense along the coastal areas.
The environmental performance of wastewater treatment operations is a key consideration for Council.
Specific issues for the planning area include:
The proximity of the coastal region to the Mon Repos Turtle Rookery and the southern boundary of the Great Barrier Reef Marine Park.
The provision of sewer connections and wastewater treatment facilities to areas currently served by on-site treatment systems.
The largest treatment plant in the study area, Bundaberg East, is aged and is unable to consistently meet effluent discharge requirements. New annual nutrient load limits on the discharge to the Burnett River are to be introduced by 2012.

Bundaberg East & Bargara Coastal Region – Wastewater Treatment and Effluent Management Master Plan
Commercial in Confidence Page 8
2 Existing Infrastructure
Wastewater treatment in the master plan study area is currently provided through a combination of centralised sewerage schemes and onsite treatment systems. The existing infrastructure and significant issues facing the study areas are summarised below.
Bundaberg East
The Bundaberg East Treatment Plant is by far the largest wastewater treatment system within the study area, serving a population of approximately 30,000. Treated effluent from the plant is discharged to the Burnett River. While the serviced catchment is not forecast to experience significant population growth, the existing treatment plant is unable to consistently meet effluent discharge requirements as a result of the age, complexity and capacity constraints of the facilities.
In addition to the current constraints, the Integrated Environmental Authority for the plant identifies new annual load limits for the total phosphorous and total nitrogen discharged to the Burnett River. These limits, which must be met by 31 December 2012, cannot be achieved with the existing infrastructure. Previous investigations into Bundaberg East have developed a number of augmentation strategies that combine treatment upgrades with an expansion of treated effluent reuse options.
Burnett Heads
Burnett Heads is currently serviced by onsite domestic treatment systems. These systems perform poorly during wet weather. The basalt derived soils in the Burnett Heads area have low infiltration potential which reportedly results in effluent reaching the surface and entering the stormwater system. Future population growth is expected to exacerbate this problem. This situation could ultimately lead to adverse water quality issues on adjacent beaches. Council operates a small onsite wastewater treatment system at the Burnett Heads Caravan Park which performs poorly during wet weather and peak load periods.
Bargara
Bargara is serviced by a conventional sewerage system with a treatment plant located adjacent to the Pasturage Reserve and Bargara Caravan Park. The Bargara treatment plant was upgraded in 2008 to improve effluent quality and increase capacity to 9,500 EP. Although some treated effluent is used for irrigation on adjacent playing fields, the majority is discharged via an ocean outfall.
Concerns have been raised regarding the proximity of the ocean outfall to the Mon Repos Turtle Rookery Reserve and the southern extremity of the Great Barrier Reef Marine Park. For these reasons Council has been exploring opportunities for increasing the proportion of effluent that can be used for irrigation.
Due to the recent investment in this plant it is assumed that it will remain in operation during the life of the plan. Attention is focused on a phased reduction of effluent discharge to the ocean.
Innes Park
The Innes Park area is currently serviced by onsite domestic wastewater treatment systems.
Bundaberg East & Bargara Coastal Region – Wastewater Treatment and Effluent Management Master Plan
Commercial in Confidence Page 9
There is increasing development pressure on this area as it is located between Bargara and Coral Cove. As development spreads along the coastline there is an expectation that sewerage will be expanded to service this area.
Coral Cove
Coral Cove is a recent residential development centred around a golf course. Wastewater treatment is provided by a package treatment plant operated by Council. Treated water from the plant is used to irrigate the adjacent golf course. Council currently has an effluent supply arrangement with the golf course which will be maintained in to the future.
Elliott Heads
Elliott Heads is currently serviced by a mixture of onsite domestic treatment systems and a package WWTP located at the Elliott Heads Golf Course. The township is located on former sand dunes overlying groundwater reserves. The area has high soil permeability and there is some likelihood that nutrients may be being transported to the groundwater reserves. The area faces population growth pressures which will increase any impacts on groundwater reserves in the area.
The Hummock
The Hummock is an established residential area located between Bundaberg and the coast. Whilst not facing significant development pressure, there are concerns with the performance of the existing onsite treatment systems.
Moore Park
Moore Park is a small coastal village located some 15 kilometres north of the mouth of the Burnett River. The area is currently serviced by onsite domestic wastewater treatment systems. Moore Park faces similar issues to Elliott Heads in that the existing onsite treatment systems are located in highly permeable coastal sands adjacent to groundwater reserves. The master plan will explore the provision of suitable wastewater treatment and management solution for the township and residential zoned hinterland.

Bundaberg East & Bargara Coastal Region – Wastewater Treatment and Effluent Management Master Plan
Commercial in Confidence Page 10
3 Master Plan Objectives
3.1 Key stakeholders
External stakeholders identified by Council were provided with an issues paper on 30 January 2009 and invited to attend a series of workshops held in Bundaberg during the week of 16 – 20 February 2009. The participating stakeholders are listed in Table 3-1.
Table 3-1: Stakeholders
Stakeholder Listing
Bundaberg Sugar Growcom – Representing fruit and vegetable growers. Cane Growers Burnett Mary Regional Group Port Marina Bundaberg Port Authority Sunwater Queensland EPA (now DERM) Queensland Department of Natural Resources (now DERM)
3.2 Objectives
The following objectives for the master plan were developed during the stakeholder consultation process.
Support growth and improve service levels
Parts of the master plan area are currently serviced by onsite treatment systems. In many cases these systems are performing poorly; leading to poor environmental outcomes and public health risks.
In addition to providing the capacity to support population growth, there is an expectation that improvements will be made to levels of service by providing sewer connections to areas that currently rely on onsite treatment facilities.
In developing the plan, it is important to provide capacity in a staged and flexible manner. This approach will assist in mitigating the risks from population growth by allowing future investment to be deferred if growth does not occur as projected.
Protection and enhancement of the environment
The environmental performance of wastewater treatment operations is a key consideration for Council. The operation of wastewater treatment plants and discharges to the environment are licensed by DERM. Increasingly, more stringent conditions are imposed for environmental discharges which over time will lead to an improvement in recognised environmental values and thus enhance the environment.
Government is increasingly looking to improve environmental outcomes where realistically

Bundaberg East & Bargara Coastal Region – Wastewater Treatment and Effluent Management Master Plan
Commercial in Confidence Page 11
achievable and options which facilitate this outcome are likely to have increased levels of governmental support and manage the risk of tightened regulation in the future.
Compatible with State legislation and policies
The operation of wastewater treatment schemes is regulated by state legislation covering the environmental, health and commercial aspects of their operation. In the area of wastewater treatment, recent policy direction has been towards encouraging beneficial reuse of effluent. Increasingly, the definition of beneficial reuse may be taken to include benefits to the wider water cycle by reducing demand on water sources.
The strategy developed must not only be acceptable in law but must also respond to key policy directions towards beneficial reuse in a way that balances government support with community acceptance. Schemes that respond to policy directions are considered to be more likely to receive government support.
Compatible with the irrigation industry
The master plan study area is within a dynamic and long established irrigation area. The reuse of treated effluent for irrigation within the master plan area must in reality compete or compliment pre-existing water sources.
For an irrigation scheme using treated effluent to be sustainable, the strategy must recognise the reality of the existing irrigation scheme in the district. It is unavoidable that treated effluent will have higher productions costs and more risks than existing water sources. Options which strengthen the business of a broad range of existing users will have more chance of long-term success than options which favour a small selection of groups or individuals.
Minimisation of risks and liabilities
The operation of wastewater treatment infrastructure exposes council to a number of risks and liabilities. Exposure to these can be minimised by adoption of the right strategy.
Consideration of specific risks and liabilities are outlined under the criteria described in Section 5 and developed within the presented options. Developing a strategy which attempts to minimise Council’s exposure to risks and liabilities will help to minimise future operating costs

Bundaberg East & Bargara Coastal Region – Wastewater Treatment and Effluent Management Master Plan
Commercial in Confidence Page 12
4 Strategy Development
4.1 Population Growth
Both the Queensland Planning Information and Forecasting Unit and the Australian Bureau of Statistics predict that the Bundaberg – Bargara region will experience significant population over the next 30 years. The principal driver of population growth in the area is an increase in the retiree (50+) demographic drawn to the milder climate and more affordable land costs. Actual growth over the last few years has been consistent with these long-term projections.
4.2 Population Projections
The study area was divided up in to logical sub-catchments based on the existing wastewater scheme catchments, planning scheme zones, logical development sequencing and earlier wastewater planning reports. Population growth projections were then developed for each catchment by referring to Planning Information Forecasting Unit reports, Australian Bureau of Statistics data and BRC staff.
The data used in developing the growth projections contained a number of potential growth scenarios. The medium growth projection scenario was adopted for development of the strategy for the following reasons:
The high growth projection scenario assumed that the major part of growth for the region will occur in the short to medium term. This exposes Council to significant financial risk if development does not proceed as projected.
As a result of the impact of the recent downturn in economic growth, population growth in the short term is expected to be below the high growth projections. As growth in this region is primarily driven by the demographic fundamentals of a retiring population, it has been assumed that the ultimate projected population will remain unchanged but that the rate of population growth will initially be low before accelerating in the medium to long term.
Changes in development density due to high rise coastal development will have an impact at the reticulation level but are not likely to increase the ultimate projected population.
Wastewater loadings projections were developed from the adopted population projections by applying a standard wastewater load of 240 litres per person per day. This value is consistent with observed inflow at plants operated by BRC. This wastewater load does not account for future reductions in flow due to demand management or infiltration reduction programs.
Exhibit 1 identifies the various sub catchments identified within the study area and categorises them by catchment type. The adopted growth projections for this study are presented in Table 4-1.

Bundaberg East & Bargara Coastal Region – Wastewater Treatment and Effluent Management Master Plan
Commercial in Confidence Page 13
Table 4-1: Adopted Population Growth Projection (EP) by Development Area
Development Area 2006 2011 2016 2021 2026 2036 2056 ULT
Bargara - existing 6,125 8,820 10,423 12,026 13,628 13,628 13,628 13,628 Innes park north
1,057 1,088 1,091 1,091 1,091 1,091
Bargara - area 1
18 27 27 1,987 3,946 3,946 Bargara - area 2
1,376 2,753 2,753
Bargara - area 3
24 36 36 622 1,209 1,209 Bargara - area 4
7,149 7,149
Innes park - existing
1,963 3,864 4,798 6,666 6,666 6,666 Innes park - area 1
653 1,958
Coral cove - existing 1,103 1,258 1,320 1,382 1,444 1,569 1,818 2,191 Elliott heads - existing
1,129 1,924 2,162 2,162 2,162 2,162
Elliott heads - area 1
644 1,932 1,932 Hummock - existing
428 665 691 744 849 849
Burnett heads - existing
3,033 4,957 5,386 6,245 7,964 7,964
Burnett heads - area 1
437 1,093
Rural areas - existing Cemex quarry
294 882 2,057 4,408 Total Southern Region: 7,228 10,078 19,395 25,969 29,557 37,616 54,314 58,999 Growth Rates p.a.:
6.87% 13.99% 6.01% 2.62% 2.44% 1.85%
Moore park - existing
2,084 3,785 4,605 6,816 6,816 6,816 East Bundaberg WWTP 31,967 34,304 36,717 39,029 41,487 43,580 43,580 43,580 Total study area: 39,195 44,965 59,721 71,332 79,863 93,880 97,560 102,246 Growth Rates p.a.:
2.78% 5.84% 3.62% 2.29% 1.63%
4.3 Service Level Requirements
Issues associated with each catchment were presented in Section 2. The servicing strategy used as the basis for this master plan are presented in Table 4-2.

Bundaberg East & Bargara Coastal Region – Wastewater Treatment and Effluent Management Master Plan
Commercial in Confidence Page 14
Table 4-2: Current servicing and future objectives
Catchment Current Situation Master Plan Objectives
Bargara - existing Serviced by Bargara WWTP which has capacity to service growth within this catchment.
Reduce reliance on ocean outfall by increasing beneficial reuse. Assume entire effluent stream to be received by proposed disposal strategy.
Innes Park north Existing residential area serviced by onsite treatment systems.
Improve service levels by extending sewerage to service existing and future population.
Bargara - area 1 Future Development Area with current Rural Zoning.
To be serviced by reticulated sewerage scheme.
Bargara - area 2 Future Development Area with current Rural Zoning.
To be serviced by reticulated sewerage scheme.
Bargara - area 3 Future Development Area with current Rural Zoning.
To be serviced by reticulated sewerage scheme.
Bargara - area 4 Future Development Area with current Rural Zoning.
To be serviced by reticulated sewerage scheme.
Innes Park - existing
Existing residential area serviced by onsite treatment systems.
Improve service levels by extending sewerage to service existing and future population.
Innes Park - area 1 Future Development Area with current Rural Zoning.
To be serviced by reticulated sewerage scheme.
Coral Cove - existing
Existing Residential area serviced by Package Treatment Plant adjacent to Golf Course.
Abandonment of Ex package plant due to poor operational performance. Assume effluent supply arrangements to be maintained with the Golf Course.
Elliott Heads - existing
Existing residential area serviced by onsite treatment systems.
Improve service levels by extending sewerage to service existing and future population.
Elliott Heads - area 1
Future Development Area with current Rural Zoning.
To be serviced by reticulated sewerage scheme.
Hummock - existing Existing residential area serviced by onsite treatment systems.
Improve service levels by extending sewerage to service existing and future population.
Burnett Heads - existing
Existing residential and commercial area serviced by onsite treatment systems.
Improve service levels by extending sewerage to service existing and future population.
Burnett Heads - area 1
Speculative development area on Northern Burnett River Mouth.
It is assumed that development will not proceed in this area within a 50 year timeframe.
Rural areas - existing
Rural properties with an existing water connection between the Hummock and Bargara. Currently serviced by onsite treatment systems.
Retain existing onsite treatment systems for these lots. Opportunistic connection of some of these properties can be evaluated during detailed design of transportation strategy.
Cemex quarry Future Development Area with current Rural Zoning.
To be serviced by reticulated sewerage scheme.
Moore Park - existing
Existing residential area serviced by onsite treatment systems.
Improve service levels by extending sewerage to service existing and future population.
East Bundaberg WWTP
Serviced by Bundaberg East WWTP which has limited capacity to service growth within the catchment.
Augment or replace Bundaberg East WWTP to improve environmental values and license compliance.
Bundaberg East & Bargara Coastal Region – Wastewater Treatment and Effluent Management Master Plan
Commercial in Confidence Page 15
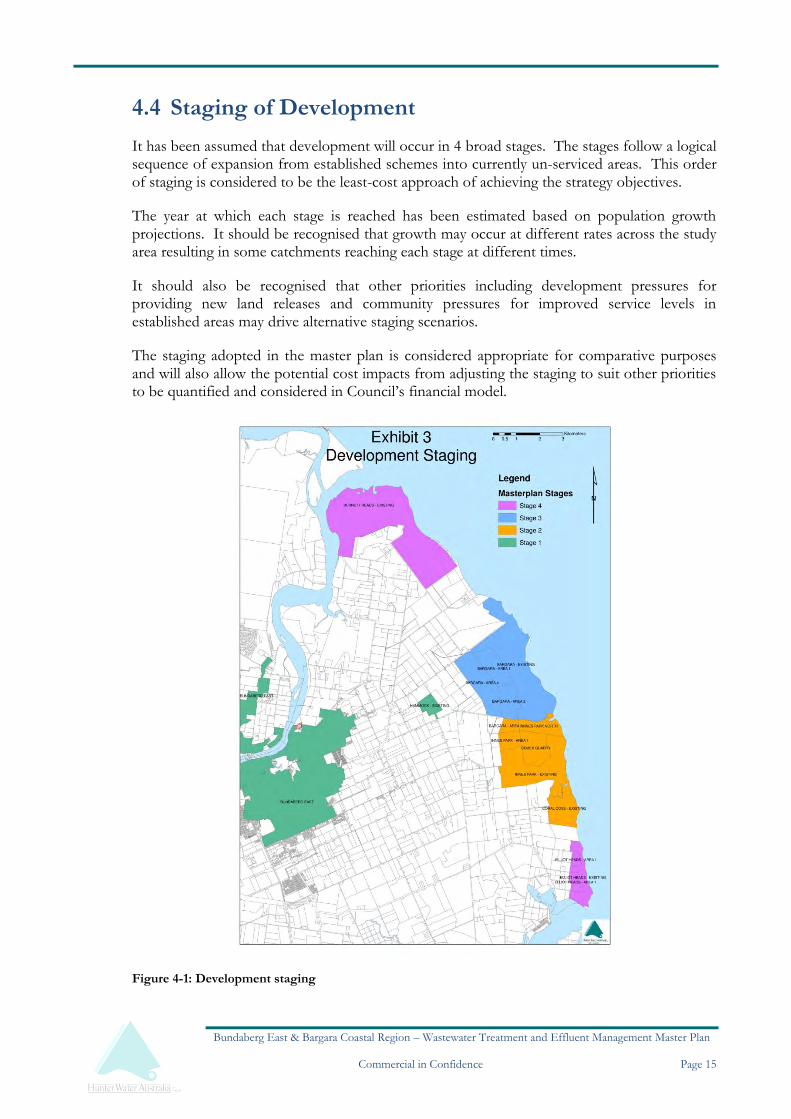
4.4 Staging of Development
It has been assumed that development will occur in 4 broad stages. The stages follow a logical sequence of expansion from established schemes into currently un-serviced areas. This order of staging is considered to be the least-cost approach of achieving the strategy objectives.
The year at which each stage is reached has been estimated based on population growth projections. It should be recognised that growth may occur at different rates across the study area resulting in some catchments reaching each stage at different times.
It should also be recognised that other priorities including development pressures for providing new land releases and community pressures for improved service levels in established areas may drive alternative staging scenarios.
The staging adopted in the master plan is considered appropriate for comparative purposes and will also allow the potential cost impacts from adjusting the staging to suit other priorities to be quantified and considered in Council’s financial model.
Figure 4-1: Development staging

Bundaberg East & Bargara Coastal Region – Wastewater Treatment and Effluent Management Master Plan
Commercial in Confidence Page 16
4.5 Effluent Management Options
Effluent management options for the master plan strategies are discussed below.
River and Ocean discharge
Under current practice, the majority of effluent produced by the Bundaberg East is discharge to the Burnett River and Bargara wastewater treatment plants discharges to ocean via an outfall near Mon Repos.
The Burnett River discharge has been retained as an important feature of the effluent management strategy for the region. Retention of the river discharge is necessary to cater for higher than average rainfall years when the capacity of effluent storage ponds is exceeded and to prevent uncontrolled overtopping of effluent storage ponds during extreme wet weather events.
The long term continuation of the discharge of effluent via the Bargara ocean outfall is not included in later Stages of the plan due to the sensitivity of the receiving waters and the proximity to a protected turtle habitat.
Crop Irrigation
Queensland EPA has developed an operational policy that targets 90% beneficial reuse of effluent in order to reduce the volume of effluent disposed to waters (Environmental Protection Agency, 2005). Council is required under the Integrated Environmental Authority to consider and where appropriate minimise release to waters through the use of water demand management, water quality improvements and reuse of treated water for irrigation.
The irrigation of crops with treated water is generally acknowledged as being the preferred treated water reuse opportunity for the region for the following reasons:
Reuse for agricultural irrigation is in line with EPA policy and the requirements of the Integrated Authority and is likely to be supported by the regulator and acceptable to the community.
The master plan study area is within a long established irrigation area and irrigation is expected to remain the major water use in the region over the study period. The pervasiveness of irrigation equipment, knowledge, and the existing distribution infrastructure presents a significant opportunity for wide-scale beneficial reuse of treated water.
Surface water allocations for irrigation are managed by Sunwater. Sunwater also supplies bulk raw water to the Bundaberg Regional Council for the production of potable water for the community. Although town water allocations are high security, all water users in the community are subject to the same security of supply limitations. The connectivity of water supply in the region offers the subsequent benefit that irrigation demand met from recycling treated water can be deemed to be substituting raw water, thus improving water security in the catchment.
On this basis, the master plan has adopted beneficial reuse of treated effluent for irrigation as the preferred reuse opportunity for the strategies developed.
It is acknowledged that there are barriers to achieving the target of 90% reuse through

Bundaberg East & Bargara Coastal Region – Wastewater Treatment and Effluent Management Master Plan
Commercial in Confidence Page 17
irrigation, not least of which are readily available sources of irrigation water already within the district. Achieving this aim will require careful negotiation with a broad range of stakeholders over a number of years.
Alternative reuse opportunities
A number of alternative reuse opportunities have been identified for the region. Previous reports discounted these opportunities due to the complexity of gaining the necessary approvals and community consensus. These alternative opportunities are not included in the development of the strategies outlined in this master plan, however consideration has been given to providing sufficient flexibility to allow for the future investigation and implement these more complex reuse opportunities as the effluent management strategy for the region is further developed.
Managed Aquifer Recharge
Artificial recharge (AR) using infiltration basins, vadose zone wells and deep injection wells is a proven water management technique with extensive application in California and the Netherlands. AR has been used for stormwater, effluent and surface water recharge of aquifers with beneficial uses of potable water supply and irrigation. Experience indicates that issues relating to clogging, pathogen attenuation and water quality changes can be overcome through effective planning and management. Water quality improvements during AR due to soil aquifer treatment (SAT) include pathogen attenuation, THM degradation and organic carbon reduction.
A major concern for coastal aquifers is salt water intrusion, the induced flow of salt water into fresh water aquifers caused by groundwater depletion. Many coastal aquifers with hydrologic connections to the sea have been over-drafted for decades, resulting in a reversal of the ground-water gradient. This causes salt water to flow inland, and water in the affected aquifers can become unsuitable for most uses. The key to controlling this problem is to maintain the proper balance between water being pumped from the aquifer and the amount of water recharging it.
Exhibit 2 shows the extent of the Elliott Formation Aquifer that underlays a significant land area to the west of Coral Cove. This aquifer supports existing agricultural uses as well as contributing to the town water supply of Bundaberg. The aquifer and has been suffering from increased salinity due to saltwater intrusion caused by over extraction.
MAR may be an option for reducing stress on the Elliott Formation aquifer through construction of strategically located infiltration ponds, infiltration trenches or injection wells designed to recharge the aquifer and prevent salt water intrusion. Further investigation is required to understand the hydro-geochemical issues and engage stakeholders with regard to planning, permitting and operational monitoring requirements.
Aquifer Storage and Recovery (ASR)
ASR involves storage of available water into aquifers through deep injection wells, with later retrieval from the same wells during dry periods (USGS, 2003) and the term is most often associated with confined aquifer systems where the soil above and below the aquifer is impermeable.
While most ASR systems are designed to store water during the wet season and recover it during the following dry season, some are established for water banking, where recovery may

Bundaberg East & Bargara Coastal Region – Wastewater Treatment and Effluent Management Master Plan
Commercial in Confidence Page 18
not take place for many years. While ASR does not provide a new source of water, it does provide an effective method of storing large volumes of surface water underground for subsequent use at costs that are much less than the equivalent storage in surface reservoirs.
Whilst ASR undertaken with suitably treated effluent may provide an opportunity cost effectively storage water for irrigation, further work would be required to understand the groundwater hydrology and the impacts of effluent injection on the sustainability of future extractions. Careful community consultation supported by rigorous technical work would also be required to mitigate the potential risk of cross-contamination of the town water supplies from the aquifer.
Managed Wetland Schemes
Managed wetland schemes involve the creation of wetland environments that are sustained by treated effluent flows. Discussions during the stakeholder consultation revealed some support for this type of scheme at two potential sites within the region. These sites were
the Pasturage Reserve; a 312 Ha cattle grazing and recreation reserve west of Bargara managed by Council, and
at rehabilitation sites within the strategic port lands.
Both sites would require detailed technical evaluation of the feasibility of creating a managed wetland scheme and careful community consultation before a scheme could be implemented.
Dual Reticulation
Dual reticulation schemes involve the provision of a dedicated reticulation system for recycled water that can be used to substitute potable water demand in residences. Established schemes are generally driven either by the perceived marketing advantage of developing land with an unrestricted outdoor water supply. Dual reticulation is generally only considered viable in new developments with the strong support of the developer.

Bundaberg East & Bargara Coastal Region – Wastewater Treatment and Effluent Management Master Plan
Commercial in Confidence Page 19
4.6 Land availability for irrigation
The availability of land for irrigation is of prime importance to the development of options. An analysis of land availability has been carried out and is discussed in three separate categories below. Land availability is shown graphically in Exhibit 2.
Sunwater supplied irrigation district
The northern part of the study area features extensive pipe and channel irrigation infrastructure managed by Sunwater which supplies irrigation water from surface water sources to approximately 3800 Ha of productive irrigation land. This land has been improved over many years and is well equipped with irrigation equipment and supports a thriving agricultural industry.
Groundwater irrigation district
The southern part of the study area is underlain by extensive groundwater aquifers which are intensively harvested to support agriculture on the land above. This groundwater aquifer is known to be stressed and is becoming increasingly affected by saline intrusion. Whilst the increasing salinity levels do not appear to be constraining agriculture at this time the imposition of a groundwater allocation regime in the Burnett Basin – Water Resources Plan (2007), and low announced allocations since, has seen a decrease in agricultural production.
In recent years there have been efforts to develop a scheme to extend the surface water network operated by Sunwater in to this southern area to reduce groundwater extractions. These efforts have been unsuccessful primarily due to costs and the difficulties in gaining agreement from the many irrigators. This precedent, however, provides a potential opportunity in that a need has already been established to reduce pressure on the groundwater resource.
Council owned land
Traditionally, management schemes involving effluent irrigation have involved the purchase of large land areas to ensure the viability of the process over time. This approach requires significant capital outlay which is tied up for long periods, and additionally, the land typically requires improvements and equipment before irrigation can commence.
Other schemes enter agreements with landowners for the supply of effluent on terms which suit both parties. Schemes of this type require lower capital outlay, as land purchase is not required, but present other risks which need careful management. Foremost of these risks is the difficulty of balancing flows over the long run as irrigator’s land management priorities change; gaining long term commitment to receive minimum flow volumes is difficult. Council also retain the obligation to ensure the effluent provided does not reduce environmental values; leading to difficulties in monitoring farm management on third party land.
Non residential land within the master plan area is highly productive due to the presence of rich, fertile volcanic soils and is able to support a wide range of profitable agricultural endeavours. This means that the land is more valuable, and hence more expensive, than land on the urban fringes across much of Australia which is typically employed in effluent irrigation schemes.

Bundaberg East & Bargara Coastal Region – Wastewater Treatment and Effluent Management Master Plan
Commercial in Confidence Page 20
4.7 Irrigation Modelling
A monthly irrigation model developed by HWA has been used to evaluate various reuse scenarios. For a given land area and crop type, the model uses long-term average climate data to calculate the irrigation and storage requirements.
Irrigation demand
The variation of irrigation demand through the year is caused by the plant’s growth cycle and harvesting and planting schedules. Areas with a dominant single crop compound this phenomena due to having similar planting and harvesting times and growth cycles.
Sugar cane growing is the dominant agricultural endeavour in the study area. There are approximately 20,000 Ha of sugar cane harvested annually with indicative crop water demands of 6 ML/Ha/annum.
The last 10 years has seen a doubling in the land used for horticultural production including fruit, vegetable, nut and herb crops. Average crop water use ranges from 1.5 ML/Ha/annum for annuals through to 11 ML/Ha/annum for permanent trees. The horticultural industry typically needs water often in large volumes for short periods to suit the specific growing cycle of the crop. The industry encounters significant commercial risk due to growing seasons typically overlapping water allocation years which can lead to crops being lost or yield reduced if water allocations are reduced.
Estimate of land area
As an initial assessment of the scheme, the irrigation demand model was used to calculate the irrigation area requirements for a centralised disposal scheme receiving the entire effluent stream of the study area. The total land area requirement was calculated for two cases:
Maximum reuse - where storage is used to ensure that the entire effluent stream is irrigated, and
Minimum storage - where any effluent not required for irrigation is discharged.
The results from the model are summarised in Table 4-3.
The minimum storage calculations require a significantly smaller irrigable area and minimal balancing storage whilst still achieving in the order of 75% beneficial reuse.
Table 4-3 Irrigation Demand Planning Model Results
Maximum Reuse Minimum Storage
Year Effluent Inflow (ML/a)
Irrigable Land (Ha)
Irrigation Demand (ML/a)
Storage Volume
(ML)
Irrigable Land (Ha)
Irrigation Demand (ML/a)
Discharge Volume (ML/a)
2006 3551 592 3551 340 443 2662 890 2011 4021 726 4021 386 544 3266 1007 2016 5150 858 5150 494 643 3860 1289 2021 6030 1005 6030 580 753 4520 1509 2026 6631 1105 6631 636 828 4971 1660 2036 7715 1285 7715 740 963 5783 1931

Bundaberg East & Bargara Coastal Region – Wastewater Treatment and Effluent Management Master Plan
Commercial in Confidence Page 21
It should be noted that the irrigation model is based on average climatic data. Non-average years will affect irrigation demand and storage and discharge calculations, therefore a more detailed model will be needed to confirm the values adopted in the strategy.
The land area calculations assume an average annual irrigation demand of 6.0 ML/Ha/annum which is the original basis for sizing the Bundaberg Irrigation Scheme. Discussions with Irrigators groups during the stakeholder consultation suggested that reliable access to 6.0 ML/Ha/annum of irrigation water would be a sound basis for varied and flexible agriculture in the region.
The irrigation demand model assumes that crop water demand is the long term limiting factor in defining application rates. In reality, nutrient levels in the effluent and the soil profile may lead to applications being limited by long term nutrient build up in the soils. The potential for this to occur can be managed by careful agronomy and soil monitoring. Whilst irrigators are likely to be already carrying out some soil monitoring and engaging with agronomists to ensure efficient use of fertilisers, it is suggested that a broad scale land suitability assessment be carried out in the region to assist in developing sustainable effluent application rates.
The irrigation demand model has also been applied to the detailed options developed for evaluation and used to calculate land area and storage requirements. The results developed are included in the strategy options outlined in this master plan.
4.8 Reused Effluent Quality Requirements
From 1 July 2008, all recycled water providers in Queensland must meet the requirements of the Water Supply (Safety and Reliability) Act 2008 (the Act). The regulator for the Act is the Office of the Water Supply Regulator (OWSR), which forms part of the Department of Environment and Resource Management.
Health aspects of recycled water use are regulated separately by Queensland Health. The Public Health Regulation 2005 prescribes the minimum standards for water quality for recycled water used for dual reticulation or the irrigation of minimally processed food crops. The regulation also defines the requirements of the different recycled water classes (A+, A, B, C & D).
Whereas previously, the requirements for recycled water schemes were outlined in guideline documents, the Act and Public Health Regulation 2005 bring these requirements into law. Both the Act and the Public Health Regulation relate to the water quality requirements to protect human health; the requirements to protect the environment remain the responsibility of the EPA.
OWSR may recommend that council prepare a basic Recycled Water Management Plan for the scheme for their use as a management tool. The RWMP could be developed to contain council’s obligations on monitoring and reporting, support programs etc in the one place.
Most horticultural crops grown in the region are classified as minimally processed food crops and require wastewater to be treated to a Class A+ standard prior to irrigation. Sugar cane is not classified as a minimally processed food crop and the does not have a disinfection standard specified by the QLD Public Health Regulation.
For sugar cane irrigation there are no prescribed water quality requirements under the Public Health Regulation 2005. In this case, BRC are required to prepare a risk assessment of the

Bundaberg East & Bargara Coastal Region – Wastewater Treatment and Effluent Management Master Plan
Commercial in Confidence Page 22
scheme. The risk assessment is to be used to establish the level of disinfection to be provided by the treatment plant, taking into account the intended uses of recycled water and other control measures that reduce the likelihood of exposure that form part of the scheme (e.g. restrictions on public access during irrigation). Other sugar cane irrigation schemes in Queensland have adopted a Class B effluent standard.
In order to be compatible with the existing irrigation practices and to maximise reuse options, the strategies developed in this master plan are based on providing a Class A+ standard. This standard of effluent is expected to be suitable for both sugar can and irrigation of horticultural crops.
4.9 Cost Estimating Methodology
High level cost estimates have been developed for the master plan for comparative purposes. The costs have been developed using HWA’s proprietary cost estimating models, which are supported by recent contract values, to develop high level cost curves for the of infrastructure required. It should be noted that the costs developed are of necessity of a high level and may be significantly different from actual construction costs; this is appropriate given the strategic nature of the master plan where the primary consideration is to compare total option costs on a consistent basis. Detailed discussion of the approach for each infrastructure type is presented below.
Treatment Plants
Capital cost estimates have been developed for the sewage treatment infrastructure required for each of the upgrade options. Capacity indexing has been used to develop the costs from a database of previous recent tenders for similar treatment plants. The costs assume an enhanced biological nutrient removal, activated sludge process capable of producing Class A effluent.
Treatment plant costs include site amenities, inlet works, diffused aeration bioreactor, multiple clarifiers, UV disinfection and sludge digestion and handling. It has been assumed that the plant would be constructed on a green field site, with sufficient grade to avoid the need for intermittent pumping and cut and fill being balanced across the site. It has also been assumed that effluent discharge (if required) will be from the plant boundary and all services (electricity, potable water, telecommunication) are available. The developed costs are designed for indicative budgetary purposes only and are considered accurate to +/- 35%. It will be necessary to revisit cost estimates once the master plan is formulated.
Capital costs estimated for providing tertiary treatment to produce Class A+ effluent have also been developed. These costs have also been produced by capacity indexing recent tenders and assume a membrane tertiary treatment plant located at the STP site. The costs include membranes and associated tanks, chemical systems and any necessary buildings. As with the developed sewage treatment cost estimates, the tertiary treatment costs are for indicative purposes only and must be revisited during later design stages. The budget capital costs are considered accurate to +/- 35%.
Treatment plant operating cost estimates have been established by considering costs for similar activated sludge systems. Operating costs estimates include the following:
Power usage – including pumping, aeration systems, mixing energy, UV disinfection, general electricity use

Bundaberg East & Bargara Coastal Region – Wastewater Treatment and Effluent Management Master Plan
Commercial in Confidence Page 23
Disposal costs - including screenings and grit land fill costs as well as biosolids disposal costs
Chemical costs – an allowance has been made for chemical phosphorus removal and polymer dosing (no supplementary carbon or alkalinity correction dosing)
UV system lamp replacement
Civil, mechanical and electrical maintenance
Operations and support staff
Ground maintenance
Laboratory analysis.
Operating costs for membrane tertiary treatment have also been developed based on similar systems. The operating cost estimates consider design loads and include the following;
Power
Membrane chemicals
Membrane replacement
Operations and support staff
Civil mechanical and electrical maintenance.
It should be noted that operating costs will increase over the design life of the plant (i.e. operating costs will be lower during initial stages of plant operation).
The capital and operating cost estimates have been used to develop indicative Net Present Values (NPVs) for each of the treatment plant options. The NPVs have been developed considering a 30 year design horizon and a discount factor of 7% annually. All developed costs are for indicative planning purposes only and it will be necessary to validate operating costs during later design phases. Further details on the developed costs is available in Appendix A.
Trunkmains and Pumping Stations
The construction costs for each of the pipelines were calculated based on Hunter Water’s Estimating Guidelines for Water Supply and Sewerage Pipe Construction (2008).
A similar methodology to that used for estimating pipeline construction was used to estimate the pump station costs. Using Hunter Water’s Estimating Guidelines for Water and Sewage Pumping Station Construction (2008).
Maintenance costs for the pipelines and pump stations were estimated using the following:
Rising Main = 700 + 0.0005D2/km.
Sewerage Pumping Station = 4000 + 2000/pump.
Bundaberg East & Bargara Coastal Region – Wastewater Treatment and Effluent Management Master Plan
Commercial in Confidence Page 24
The operation costs of the pump stations were calculated using:
$/year =0.0098 ×𝑄 ×𝐻 ×𝑐 ×𝑡
𝑒𝑓𝑓
Where
Q = pumping rate (l/s)
H = total pumping head (m)
c = cost of electricity kWh ($)
t = operating time (s)
eff = pump efficiency
Effluent Storage Structures
Effluent storage structures were costed on a first principles basis assuming an impoundment with earth embankments constructed on level ground. The costs are based on mass haulage calculations and rely on the site having material suitable for the construction of earth embankments and sufficient space for disposal of excess material. The estimates provide a reasonable basis for comparison purposes but site specific cost estimates will be required in the preliminary design phase.
Irrigation Land
An indicative cost for the purchase of irrigation land within the district was developed from the purchase prices of three parcels of land recently acquired by Bundaberg Regional Council as shown in the table below.
Table 4-4 Recent purchase prices of land acquired by Bundaberg Council
Land Description Area (Ha) Cost ($) Cost/Ha
295 Hummock Road, Windermere Purchased 05/07/2007 7.5 $361,275 $48,200
Elliott Heads Road, Windermere Purchased 19/07/2007 9.5 $349,000 $36,600
241 Lindemans Road, Moore Park Purchased 27/11/2007. 28.8 $450,000 $15,800
For the purposes of attributing a cost to irrigation land purchases a figure of $30,000/Ha has been adopted for costing the options (1 B-D and 2) in which land ownership is required. It has also been assumed that only 50% of total land area required would need to be directly owned by Council. Further confidence in likely future land costs could be developed by consultation with specialist land valuers familiar with the agricultural real estate market in Bundaberg.
Maintenance and operating costs for land under Council control have not been estimated at this time.
Bundaberg East & Bargara Coastal Region – Wastewater Treatment and Effluent Management Master Plan
Commercial in Confidence Page 25
5 Strategy Options
A number of options for location of treatment facilities and associated effluent reuse schemes were developed in consultation with BRC. Three effluent management strategy options were identified as satisfying the objectives of the master plan. These three options were then evaluated against previously determined criteria using a multi criteria analysis (MCA) tool. The three options are
Option 1 - centralised treatment and effluent management with three sub-options to reflect potential alternative outcomes following each stage of development.
Option 2 - decentralised reuse and considers multiple treatment plants and effluent management schemes to provide maximum flexibility in staging. For comparison purposes Option 2 has been evaluated with the same staging assumptions as Option 1.
Option 3 - concerns the servicing of Moore Park in isolation and is assumed to be developed in a single stage.
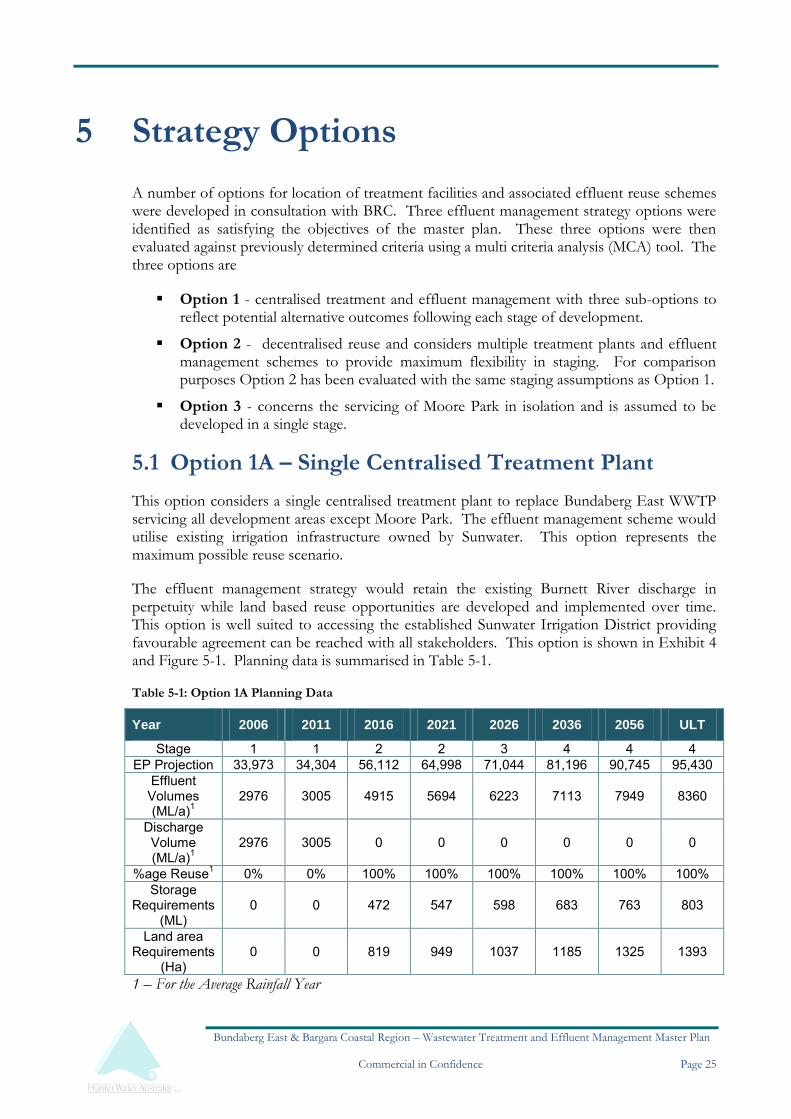
5.1 Option 1A – Single Centralised Treatment Plant
This option considers a single centralised treatment plant to replace Bundaberg East WWTP servicing all development areas except Moore Park. The effluent management scheme would utilise existing irrigation infrastructure owned by Sunwater. This option represents the maximum possible reuse scenario.
The effluent management strategy would retain the existing Burnett River discharge in perpetuity while land based reuse opportunities are developed and implemented over time. This option is well suited to accessing the established Sunwater Irrigation District providing favourable agreement can be reached with all stakeholders. This option is shown in Exhibit 4 and Figure 5-1. Planning data is summarised in Table 5-1.
Table 5-1: Option 1A Planning Data
Year 2006 2011 2016 2021 2026 2036 2056 ULT
Stage 1 1 2 2 3 4 4 4 EP Projection 33,973 34,304 56,112 64,998 71,044 81,196 90,745 95,430
Effluent Volumes (ML/a)1
2976 3005 4915 5694 6223 7113 7949 8360
Discharge Volume (ML/a)1
2976 3005 0 0 0 0 0 0
%age Reuse1 0% 0% 100% 100% 100% 100% 100% 100% Storage
Requirements (ML)
0 0 472 547 598 683 763 803
Land area Requirements
(Ha) 0 0 819 949 1037 1185 1325 1393
1 – For the Average Rainfall Year

Bundaberg East & Bargara Coastal Region – Wastewater Treatment and Effluent Management Master Plan
Commercial in Confidence Page 26
Figure 5-1: Option 1A - Single centralised treatment plant

Bundaberg East & Bargara Coastal Region – Wastewater Treatment and Effluent Management Master Plan
Commercial in Confidence Page 27
Stage 1
Stage 1 of this option involves the replacement of the Bundaberg East Plant with a new plant on a new site. This plant will be sized for the projected growth of the Bundaberg East Catchment (45,000 – 50,000EP) and allow for the extension of sewerage to the Hummock. The catchment of the Bargara plant is assumed to be subjected to infill growth only with no expansion of the developable area requiring no augmentation or replacement of the treatment facility during this stage. Effluent management for the Bargara plant during Stage 1 will require a continuation of current efforts to maximise reuse until flows are diverted to the centralised effluent management scheme during Stage 3.
Stage 1 involves discharge of the majority of effluent to the Burnett River from the new plant. The new plant will be designed to meet the effluent quality conditions on the discharge license and the total volumetric discharge will not exceed the current license during the stage.
At projected growth, the Stage 1 will have capacity for up to 10 years. This provides sufficient time for detailed investigation in to defining the requirements for connection to Sunwater’s irrigation infrastructure, detailed stakeholder consultation and gaining any necessary approvals. During this time, detailed evaluation of other effluent management opportunities can also be carried out or other forms of effluent irrigation pursued.
Stage 2
Stage 2 comprises the connection of Innes Park and Coral Cove service areas to the centralised treatment system. Projected flows for Stages 1 and 2 will exceed the volumetric limit of the Burnett River discharge requiring the revision of the licence or implementation of additional effluent reuse options before Stage 2 proceeds. Option 1A assumes that negotiations with Sunwater and other stakeholders have been successful and access to land currently serviced by Sunwater infrastructure is available from this time onwards. In the event these negotiations are unsuccessful, Options 1B and 1C present alternatives that can be pursued.
The extent of land available in the Sunwater irrigation district outlined in Exhibit 5 is sufficient to achieve 100% beneficial reuse in the average rainfall year with minimal balancing storage. From Stage 2 onwards the Burnett River discharge would be retained for balancing of storm flows.
Stage 3 and 4
Stage 3 comprises the connection of Bargara service areas to the centralised treatment plant. The Bargara treatment plant would be decommissioned during this stage and flows diverted to the centralised treatment plant. Inflows in excess of the treatment capacity at the Bargara plant would need to be diverted to the regional plant as they occur.
Stage 4 comprises the connection of Burnett Heads service areas to the centralised treatment plant.
Benefits
Easy access to a large established irrigation district with minimal upfront costs for effluent management.
Management of irrigation district remains the responsibility of Sunwater. Relationship required with a single stakeholder which may simplify operational decision making.

Bundaberg East & Bargara Coastal Region – Wastewater Treatment and Effluent Management Master Plan
Commercial in Confidence Page 28
Provides some operational flexibility to Sunwater as an alternative water source would be available to irrigators if required for operational reasons.
Benefits the wider water cycle by substituting surface water irrigation with recycled effluent irrigation. Allows diversion of surface water allocations to alternative uses or environmental flows.
Effluent reuse could be expanded in future as opportunities (MAR, ASR, dual reticulation) arise.
Risks
Proximity of irrigation system connection point to Kalkie WTP intake may cause community concern. Risk can be mitigated by careful detailing of connection arrangements to minimise risk of cross connection of sources.
Effluent reuse occurs under the control and as timed by Sunwater. Outside this arrangement, effluent must be discharged to the Burnett River unless storages are constructed to store effluent during non-irrigation periods.
Relationship with Sunwater may change over time potentially requiring alternative disposal option to be explored.
The return on investment will be limited as Sunwater’s cost structure is such that there is little opportunity for BRC to charge for effluent supplied to the irrigation district.
Effluent could be supplied to irrigators out of specification potentially threatening end use of horticultural crops. Can be mitigated by multi barrier treatment and diversion to river discharge if required.
On farm management becomes more complicated due to presence of nutrients in irrigation water supply.
5.2 Option 1B – Centralised treatment plant with second plant at School Lane Site
This option considers a regionalised treatment plant and effluent management scheme comprising two locations. A larger plant is envisaged to replace Bundaberg East and service areas to the north of Innes Park North. A smaller southern treatment plant is envisaged to service Innes Park, Coral Cove and Elliott Heads. In option 1B, this southern plant is located in the School Lane area.
The effluent management strategy would initially rely on the existing Burnett River discharge connected to the northern plant whilst local reuse opportunities were developed and implemented. The effluent management strategy for this option has been assumed to require a greater proportion of direct land holdings by Council with the remaining land requirements accessed through direct agreement with landholders. This option is also well suited to other effluent management opportunities as discussed below. Option 1B is shown in Exhibit 5 and Figure 5-2. Planning data is summarised in Table 5-2.

Bundaberg East & Bargara Coastal Region – Wastewater Treatment and Effluent Management Master Plan
Commercial in Confidence Page 29
Figure 5-2: Option 1B – Centralised treatment plant with second plant at School Lane

Bundaberg East & Bargara Coastal Region – Wastewater Treatment and Effluent Management Master Plan
Commercial in Confidence Page 30
Table 5-2: Option 1B Planning Data
Year 2006 2011 2016 2021 2026 2036 2056 ULT
Stage 1 1 2 2 3 4 4 4
Plant 1 - East Replacement
EP Projection 33,973 34,304 50,619 56,704 61,219 67,560 73,157 73,813 Effluent Volumes (ML/a)1
2976 3005 4434 4967 5363 5918 6409 6466
Discharge Volume (ML/a)1 2976 3005 0 0 0 0 0 0
%age Reuse1 0% 0% 100% 100% 100% 100% 100% 100% Storage Requirements (ML)1
0 0 426 477 515 568 615 621
Land area Requirements1 0 0 739 828 894 986 1068 1078
Plant 2 - Coastal Plant North
EP Projection 5493 8294 9825 13636 17588 21617 Effluent Volumes (ML/a)1 481 727 861 1195 1541 1894
Discharge Volume (ML/a)1 0 0 0 0 0 0
%age Reuse1
100% 100% 100% 100% 100% 100% Storage Requirements (ML)1 46 70 83 115 148 182
Land area Requirements1 80 121 143 199 257 316
1 – For the Average Rainfall Year
Stage 1
Stage 1 of Option 1B is identical to Option 1A.
Stage 2
Stage 2 comprises the construction of a second regional treatment plant in the proximity of School Lane and accessible to the land currently supplied by groundwater sources.
The regional plant delivered in Stage 1 will be retained and service growth within the Bundaberg East and Hummock catchments. River discharge will be retained however Council will need to develop reuse opportunities through direct negotiation with landowners or undertaking effluent irrigation on Council owned land..
Stages 3 & 4
Stage 3 comprises the connection of Stage 3 service areas to the southern treatment plant and the decommissioning of the existing Bargara STP. The irrigation network would be expanded to ensure access to sufficient land area to balance flows.
Stage 4 comprises the connection of the Stage 4 service areas to their respective treatment plant.

Bundaberg East & Bargara Coastal Region – Wastewater Treatment and Effluent Management Master Plan
Commercial in Confidence Page 31
Benefits
Responds to an established need for alternative water sources to relieve pressure on stressed groundwater resource.
Potentially benefits the wider water cycle by substituting ground water with recycled effluent.
Opportunity to recover costs through an access pricing regime but this must be balanced with stimulating demand from irrigators.
Access to established irrigation enterprises.
Effluent reuse could be expanded in future as opportunities (MAR, ASR, dual reticulation) arise.
Risks
Council required to manage relationship with a large number of stakeholders.
Effluent management if operated as a Council owned enterprise would be at risk if sufficient effluent cannot be supplied to meet supply agreements
The southern treatment plant will need to have a discharge to water to allow for wet weather events or prolonged wet periods. This could be to the Elliott River via a new discharge location or to the Burnett River via the existing discharge.
Effluent could be supplied to irrigators out of specification potentially threatening end use of horticultural crops. Can be mitigated by multi barrier treatment.
On farm management becomes more complicated due to increased levels of nutrients in the irrigation water supply.
5.3 Option 1C – Centralised treatment plant with second plant at Elliott Heads
This option considers a regionalised treatment plant and effluent management scheme comprising two locations. A larger plant is envisaged to replace Bundaberg East and service areas to the north of Innes Park North. A smaller southern treatment plant is envisaged to service Innes Park, Coral Cove and Elliott Heads and in option 1C is located west of Elliott Heads.
The effluent management strategy would initially rely on the existing Burnett River discharge connected to the northern plant whilst local reuse opportunities were developed and implemented. The effluent management strategy for this option has been assumed to require a greater proportion of direct land holdings by Council with the remaining land requirements accessed through direct agreement with landholders. This option is also well suited to other effluent management opportunities discussed below. Option 1C is shown in Exhibit 6 and Figure 5-3. Planning data is summarised in Table 5-3.

Bundaberg East & Bargara Coastal Region – Wastewater Treatment and Effluent Management Master Plan
Commercial in Confidence Page 32
Figure 5-3: Option 1C – Centralised treatment plant with second plant at Elliott Heads

Bundaberg East & Bargara Coastal Region – Wastewater Treatment and Effluent Management Master Plan
Commercial in Confidence Page 33
Table 5-3: Option 1C Planning Data
Year 2006 2011 2016 2021 2026 2036 2056 ULT
Stage 1 1 2 2 3 4 4 4
Plant 1 - East Replacement
EP Projection 33,973 34,304 50,619 56,704 61,219 67,560 73,157 73,813 Effluent Volumes (ML/a)1 2976 3005 4434 4967 5363 5918 6409 6466
Discharge Volume (ML/a)1 2976 3005 0 0 0 0 0 0
%age Reuse1 0% 0% 100% 100% 100% 100% 100% 100% Storage Requirements (ML)1
0 0 426 477 515 568 615 621
Land area Requirements1 0 0 739 828 894 986 1068 1078
Plant 2 - Coastal Plant South
EP Projection 5493 8294 9825 13636 17588 21617 Effluent Volumes (ML/a)1 481 727 861 1195 1541 1894
Discharge Volume (ML/a)1 0 0 0 0 0 0
%age Reuse1
100% 100% 100% 100% 100% 100% Storage Requirements (ML)1 46 70 83 115 148 182
Land area Requirements1 80 121 143 199 257 316
1 – For the Average Rainfall Year
Stage 1
Stage 1 of option 1C is identical to Option 1A.
Stage 2
Stage 2 comprises the construction of a second regional treatment plant west of Elliott Heads and accessible to the land currently supplied by groundwater sources.
The regional plant delivered in Stage 1 will be retained and service growth within the Bundaberg East and Hummock catchments. River discharge will be retained however Council will need to develop reuse opportunities through direct negotiation with landowners or undertaking effluent irrigation on Council owned land..
Stages 3 & 4
Stage 3 comprises the connection of Stage 3 service areas to the southern treatment plant and the decommissioning of the existing Bargara STP. The irrigation network would be expanded to ensure access to sufficient land area to balance flows.
Stage 4 comprises the connection of the Stage 4 land to their respective treatment plant locations.

Bundaberg East & Bargara Coastal Region – Wastewater Treatment and Effluent Management Master Plan
Commercial in Confidence Page 34
Benefits
Responds to an established need for alternative water sources to relieve pressure on stressed groundwater resource.
Provides a high quality effluent stream which could be expanded in to future uses such as MAR, ASR or dual reticulation to new developments as required.
Potentially benefits the wider water cycle by substituting ground water with recycled effluent.
Opportunity to recover some costs through an access pricing regime but this must be balanced with significant capital and operating costs and the need to stimulate demand from irrigators.
Risks
Council required to manage relationship with potentially a large number of stakeholders.
Effluent management if operated as a Council owned enterprise would be at risk if sufficient effluent cannot be supplied to meet supply agreements
The southern treatment plant will need to have a discharge to water to allow for wet weather events or prolonged wet periods. This could be to the Elliott River via a new discharge location or to the Burnett River via the existing discharge.
Effluent could be supplied to irrigators out of specification potentially threatening end use of horticultural crops. Can be mitigated by multi barrier treatment.
On farm management becomes more complicated due to increased levels of nutrients in the irrigation water supply.
5.4 Option 2 – De-centralised Strategy
This option concerns the development of 5 treatment plants and effluent management schemes comprising;
One new plant to replace Bundaberg East with the retention of the River discharge and local reuse scheme.
3 new coastal plants with land based effluent management schemes (Burnett Head, Elliott Head and Coral Cove/ Innes Park)
One new plant to replace the existing Bargara Plant and land based effluent management, and
The new plants would require the establishment of land based reuse schemes that would have access to no alternate disposal pathways. It has been assumed that Council would directly acquire 50% of the land area required for these reuse schemes with the remaining land made available through end use agreements with landholders.
This option is shown in Exhibit 7 and Figure 5-4. The sequencing of the development stages is identical for Options 1 and 2. In reality the sequencing of staging in Option 2 is more flexible, due to the independence of each treatment plant, and can be more easily adjusted to suit growth rates and funding priorities. Planning data is summarised in Table 5-4.

Bundaberg East & Bargara Coastal Region – Wastewater Treatment and Effluent Management Master Plan
Commercial in Confidence Page 35
Figure 5-4: Option 2 – Decentralised strategy

Bundaberg East & Bargara Coastal Region – Wastewater Treatment and Effluent Management Master Plan
Commercial in Confidence Page 36
Table 5-4: Option 2 Planning Data
Year 2006 2011 2016 2021 2026 2036 2056 ULT
Stage 1 1 2 2 3 4 4 4
Plant 1 - East Replacement
EP Projection 33973 34304 37145 39694 42178 44324 44429 44429 Effluent Volumes (ML/a)1 2976 3005 3254 3477 3695 3883 3892 3892
Discharge Volume (ML/a)1 2976 3005 3254 3293 3293 3293 3293 3293
%age Reuse1 0% 0% 0% 5% 11% 15% 15% 15% Storage Requirements (ML)1
0 0 0 18 39 57 58 58
Land area Requirements1 0 0 0 31 67 98 100 100
Plant 2 - Coastal Plant
EP Projection 4364 6370 7663 10830 13494 17523 Effluent Volumes (ML/a)1 382 558 671 949 1182 1535
Discharge Volume (ML/a)1 0 0 0 0 0 0
%age Reuse1 100% 100% 100% 100% 100% 100%
Storage Requirements (ML)1 37 54 64 91 114 147
Land area Requirements1 64 93 112 158 197 256
Plant 3 - Bargara
EP Projection 10441 12053 13655 16991 20327 20327 Effluent Volumes (ML/a)1 915 1056 1196 1488 1781 1781
Discharge Volume (ML/a)1 38 56 0 0 0 0
%age Reuse1
96% 95% 100% 100% 100% 100% Storage Requirements (ML)1 84 96 115 143 171 171
Land area Requirements1 146 167 199 248 297 297
Plant 4 - Burnett Heads
EP Projection 2806 4094 4094 Effluent Volumes (ML/a)1 246 359 359
Discharge Volume (ML/a)1 0 0 0
%age Reuse1
100% 100% 100% Storage Requirements (ML)1 24 34 34
Land area Requirements1 41 60 60
Plant 5 - Elliott Heads
EP Projection 6245 8401 9057 Effluent Volumes (ML/a)1 547 736 793

Bundaberg East & Bargara Coastal Region – Wastewater Treatment and Effluent Management Master Plan
Commercial in Confidence Page 37
Discharge Volume (ML/a)1 0 0 0
%age Reuse1 100% 100% 100% Storage Requirements (ML)1
53 71 76
Land area Requirements1 91 123 132
1 – For the Average Rainfall Year
Stage 1
Stage 1 comprises the replacement of the existing Bundaberg East treatment plant on a site close to the existing plant. The existing river discharge from Bundaberg East would need to be retained as a significant component of the effluent management strategy whilst local land based reuse opportunities are developed.
Stage 2
Stage 2 comprises a new plant to serve the coastal Stage 2 development area. The plant would require the establishment of a local land based reuse scheme.
Stage 3
Stage 3 comprises a new plant to serve the Stage 3 development areas which comprise the existing Bargara treatment plant catchment. The plant would require the establishment of a local land based reuse scheme.
Stage 4
Stage 4 comprises 2 new plants to serve the Burnett Heads and Elliott Heads development areas. The plant would require the establishment of local land based reuse schemes.
Benefits
Council retains control over irrigation reuse schemes ensuring compliance with environmental objectives.
Flexible implementation possible to suit changing funding, growth and development requirements.
May be possible to use simpler treatment process in line with site specific reuse effluent quality requirements.
Risks
Greater resources required to administer the effluent management schemes due to multiple locations.
Difficulty in approving and the environmental discharge mechanism for all areas.
Council required to manage relationships with a large number of reuse customers.
More difficult to demonstrate benefits to the wider water cycle.

Bundaberg East & Bargara Coastal Region – Wastewater Treatment and Effluent Management Master Plan
Commercial in Confidence Page 38
5.5 Comparative costs
Costs for comparative purposes are provided in Table 5-5.
Table 5-5: Estimate of Likely Present Value of Costs (7% discount rate over 30 years)
Option Present Value of Capital Costs ($)
Present Value of Operating &
Maintenance Costs ($)
Total Option Present Value ($)
1A $92,762,000 $47,523,000 $140,285,000
1B $112,474,000 $58,330,000 $170,804,000
1C $110,247,000 $58,308,000 $168,556,000
2 $99,747,000 $59,896,000 $159,643,000
5.6 Flexibility to Develop Effluent Management Opportunities
Whilst assumptions have been made in defining an effluent management strategy for Options 1A, 1B, and 1C to facilitate comparison, in reality, the implementation of a centralised or regionalised treatment strategy allows a great deal of flexibility in developing effluent management opportunities over time. A key advantage of Options 1A/B/C is the common Stage 1 which is the replacement of the existing plant at Bundaberg East with a regionally located plant better able to meet the current regulated requirements of the EPA. Retaining the existing Burnett River discharge for this plant allows time to investigate, negotiate and implement land based effluent management opportunities which may have wider environmental benefits.
Effluent management opportunities are discussed in some detail in Section 5 but, in summary, Options 1A/B/C allow up to 10 years for the detailed evaluation of the following effluent management opportunities, and develop a strategy comprising all or some of the following:
Continuation of discharge to the Burnett River under a sustainable discharge regime meeting concentration and load based limits of the Environmental Authority.
Supply of treated effluent though the Sunwater irrigation network for irrigation of cane and horticultural crops.
Establishment of a Council owned irrigation network in an area not currently serviced by Sunwater infrastructure.
Separate negotiated agreements with individual landholders for the supply of treated effluent for irrigation of cane or horticultural crops.
Direct purchase of land by Council and operation of one or more agricultural effluent reuse operation(s).
Managed Aquifer Recharge or Aquifer Storage and Recovery in the stressed Elliott formation aquifer west of Elliott Heads.
Creation of a salt water intrusion barrier for the Elliott formation aquifer.

Bundaberg East & Bargara Coastal Region – Wastewater Treatment and Effluent Management Master Plan
Commercial in Confidence Page 39
Dual reticulation could be provided to new developments should community/ developer demand arise and the costs of supply and treatment are in line with consumer price tolerances.
5.7 Moore Park Effluent Management Strategy
A single effluent management strategy has been developed for Moore Park which comprises a single local treatment plant adjacent to a land based effluent management scheme. It is assumed that the servicing of Moore Park will take place in a single stage with the same timing as Stage 2 in Option 1 above. Access to an alternative disposal pathway for Moore Park is considered unlikely to obtain approval given the sensitive nature of the most easily accessed receiving water, placing greater emphasis on land based reuse with significant balancing storages.
This option is shown in Exhibit 13. Planning data is summarised in Table 5-6.
Table 5-6: Moore Park Planning Data
Year 2006 2011 2016 2021 2026 2036 2056 ULT
Stage 1 1 2 2 3 4 4 4 EP Projection 2084 3785 4605 6816 6816 6816 Effluent Volumes (ML/a)1 183 332 403 597 597 597
Discharge Volume (ML/a)1 0 0 0 0 0 0
%age Reuse1 0 0 100% 100% 100% 100% 100% 100% Storage Requirements (ML)1 0 0 18 32 39 57 57 57
Land area Requirements1 0 0 30 55 67 100 100 100
1 – For the Average Rainfall Year
Table 5-7: Moore Park Cost Estimate (7% Discount Rate over 30 years)
Option Present Value of Capital Costs ($)
Present Value of Operating &
Maintenance Costs ($)
Total Option present Value ($)
Moore Park $9,595,000 $3,980,000 $13,576,000

Bundaberg East & Bargara Coastal Region – Wastewater Treatment and Effluent Management Master Plan
Commercial in Confidence Page 40
6 Multi Criteria Analysis
6.1 Assessment Criteria
Each option was assessed in terms of:
Present value analysis of likely capital, operating and maintenance costs over a 30 year period with a 7% discount factor.
Non-cost criteria as described below.
Multi-criteria analysis was used to identify the preferred strategy. Further details on the scoring methodology are given in Appendix B.
Environmental Sustainability
This refers to an options ability to operate over the long term without an overall adverse impact on the environment. It includes factors such as energy usage, impacts on recognised environmental values, nutrient build up and soil sodicity.
Affordability
This refers to the affordability of the option from the perspective of Council and the rate-paying community. This criterion covers not only the capital and operating costs of the options but also the likelihood of the option attracting external funding.
Water Cycle Impacts
This refers to the impact of the option on the wider water cycle. This criterion was used to score the option on its ability to improve water security in the region, ease pressure on other water sources and substitute raw water supply.
Customer Acceptability
This criterion refers to the likelihood of receiving the community support. Consideration of customer acceptability included an assessment of the customer’s exposure to cost through access pricing.
Irrigation Community Support
This criterion was used to gauge the perceived level of support from the irrigation community for the option.
State Government Support
This criterion gauges the perceived level of support from the Queensland Government for the option. This included an assessment of how the option addressed key policy areas regarding water recycling and sustainability.
Minimise Foreseeable Risks
This criterion gauges the ease with which the risks outlined for each option can be mitigated.
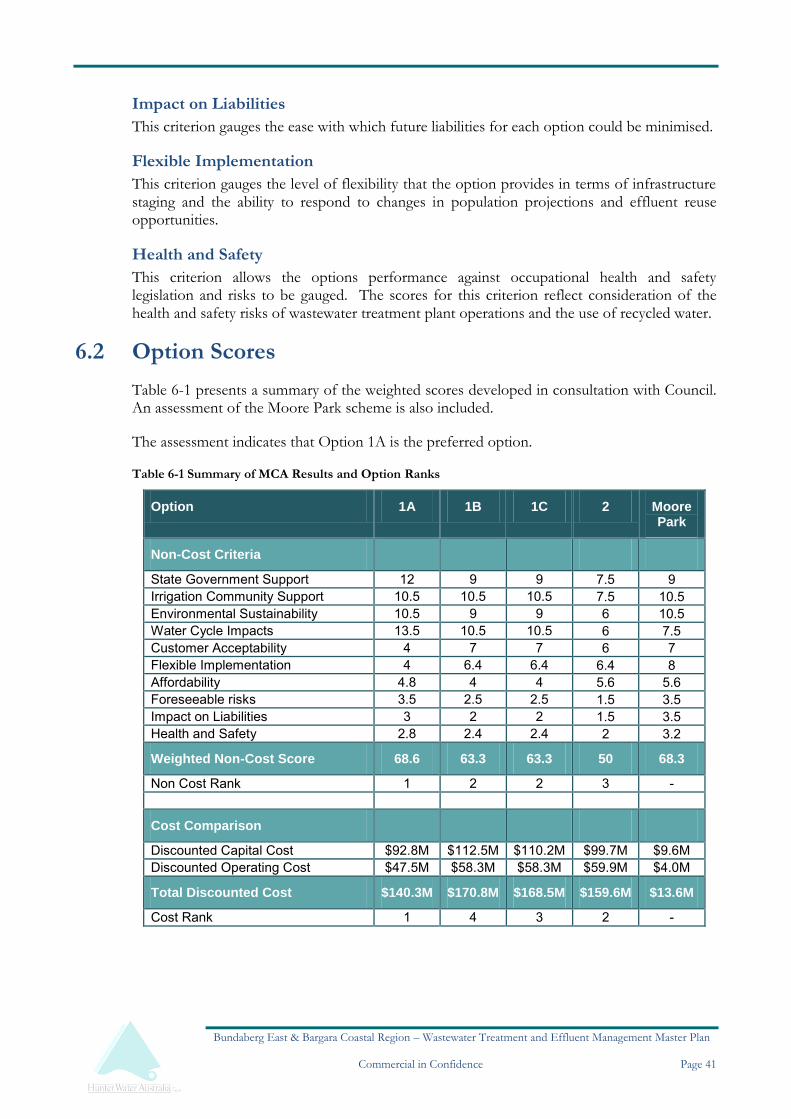
Bundaberg East & Bargara Coastal Region – Wastewater Treatment and Effluent Management Master Plan
Commercial in Confidence Page 41
Impact on Liabilities
This criterion gauges the ease with which future liabilities for each option could be minimised.
Flexible Implementation
This criterion gauges the level of flexibility that the option provides in terms of infrastructure staging and the ability to respond to changes in population projections and effluent reuse opportunities.
Health and Safety
This criterion allows the options performance against occupational health and safety legislation and risks to be gauged. The scores for this criterion reflect consideration of the health and safety risks of wastewater treatment plant operations and the use of recycled water.
6.2 Option Scores
Table 6-1 presents a summary of the weighted scores developed in consultation with Council. An assessment of the Moore Park scheme is also included.
The assessment indicates that Option 1A is the preferred option.
Table 6-1 Summary of MCA Results and Option Ranks
Option 1A 1B 1C 2 Moore Park
Non-Cost Criteria
State Government Support 12 9 9 7.5 9 Irrigation Community Support 10.5 10.5 10.5 7.5 10.5 Environmental Sustainability 10.5 9 9 6 10.5 Water Cycle Impacts 13.5 10.5 10.5 6 7.5 Customer Acceptability 4 7 7 6 7 Flexible Implementation 4 6.4 6.4 6.4 8 Affordability 4.8 4 4 5.6 5.6 Foreseeable risks 3.5 2.5 2.5 1.5 3.5 Impact on Liabilities 3 2 2 1.5 3.5 Health and Safety 2.8 2.4 2.4 2 3.2
Weighted Non-Cost Score 68.6 63.3 63.3 50 68.3
Non Cost Rank 1 2 2 3 -
Cost Comparison
Discounted Capital Cost $92.8M $112.5M $110.2M $99.7M $9.6M Discounted Operating Cost $47.5M $58.3M $58.3M $59.9M $4.0M
Total Discounted Cost $140.3M $170.8M $168.5M $159.6M $13.6M
Cost Rank 1 4 3 2 -

Bundaberg East & Bargara Coastal Region – Wastewater Treatment and Effluent Management Master Plan
Commercial in Confidence Page 42
7 Recommendations
7.1 Bundaberg East & Bargara Coastal Region
Option 1A is recommended to be used as the basis for future wastewater treatment and effluent management planning for the region. Under this option a new regional wastewater treatment plant will be constructed to serve both Bundaberg East and the coastal region. Construction of the new plant will enable Bundaberg East STP to be decommissioned and connections to be made in a staged fashion to Innes Park, Bargara, Elliott Heads and Burnett Heads. Reuse opportunities for the treated water for irrigation will be explored initially through the Sunwater irrigation channels, although alternative opportunities will be developed to provide flexibility. The treatment plant will also maintain a discharge to the Burnett River.
Implementation of this strategy will involve:
1. Commence concept design of the new regional/centralised treatment plant. 2. Selection and acquisition of a site for the treatment plant. 3. Preparation of the Environmental Impact Assessment. 4. Further development of the effluent management strategy including initial negotiations
with local agribusinesses and Sunwater. 5. Integration of network planning upgrades with this strategy. 6. Negotiation with the EPA regarding licence requirements. 7. Continuation of community and stakeholder communications.
The following additional work is recommended to assist with the implementation of the strategy:
1. The effluent management strategy for the new treatment plant should be further developed as a matter of priority. Development of an effluent management strategy which considers irrigation of effluent, wet weather storage as well as nitrogen and phosphorous removal at treatment facilities should be undertaken as required by the Integrated Authority. The effluent management strategy should include a detailed review of the effluent management requirements for the new site in terms of interim and ultimate target figures for annual effluent reuse and environmental discharge, land area requirements for base-line effluent reuse, storage requirements and operating costs. The effluent management strategy should also consider longer term reuse opportunities including dual reticulation, managed aquifer recharge and salt water intrusion barriers in addition to more traditional options. Completion of an effluent management strategy for the new regional wastewater treatment plant will form a useful planning tool for BRC and will greatly assist BRC during negotiation of effluent quality requirements for the new treatment plant.
2. The biosolids management strategy for the region should also be reviewed and revised. Biosolids produced during wastewater treatment are currently beneficially reused by a third party in the production of compost. This contract is soon due for renewal and there is uncertainly about future requirements. It is recommended that BRC develop

Bundaberg East & Bargara Coastal Region – Wastewater Treatment and Effluent Management Master Plan
Commercial in Confidence Page 43
and implement a long term, sustainable biosolids management plan.
7.2 Moore Park
A viable effluent management strategy has been developed for Moore Park which comprises a single local treatment plant adjacent to a land based effluent management scheme.
Access to an alternative disposal pathway for Moore Park is considered unlikely to obtain approval given the sensitive nature of the most easily accessed receiving water, placing greater emphasis on land based reuse with significant balancing storages.

Bundaberg East & Bargara Coastal Region – Wastewater Treatment and Effluent Management Master Plan
Commercial in Confidence
EExxhhiibbiittss

BUNDABERG EAST
BURNETT HEADS - EXISTING
BARGARA - EXISTING
INNES PARK - EXISTING
BARGARA - AREA 4
CEMEX QUARRY
BARGARA - AREA 1
CORAL COVE - EXISTING
BUNDABERG EAST
BARGARA - AREA 2
INNES PARK NORTH
ELLIOT HEADS - EXISTING
INNES PARK - AREA 1
HUMMOCK - EXISTING
BARGARA - AREA 3
ELLIOT HEADS - AREA 1
ELLIOT HEADS - AREA 1
0 1 2 30.5Kilometers
!Legend
Catchment Types
Backlog sewerage Area
Existing Scheme
Unzoned Development Area
Land Of Interest
Kalkie WTP
Sunwater Storage
Potential WWTP Locations
Exhibit 1Development Catchment Types

BUNDABERG EAST
BURNETT HEADS - EXISTING
BARGARA - EXISTING
INNES PARK - EXISTING
BARGARA - AREA 4
CEMEX QUARRY
BARGARA - AREA 1
CORAL COVE - EXISTING
BUNDABERG EAST
BARGARA - AREA 2
INNES PARK NORTH
ELLIOT HEADS - EXISTING
INNES PARK - AREA 1
HUMMOCK - EXISTING
BARGARA - AREA 3
ELLIOT HEADS - AREA 1
ELLIOT HEADS - AREA 1
0 1 2 30.5Kilometers
!Legend
Sunwater_Infrastructure
Masterplan area
Groundwater_Area
Kalkie WTP
Sunwater Storage
BRC Owned Land
Potential WWTP Locations
Exhibit 2Existing Features

BUNDABERG EAST
BURNETT HEADS - EXISTING
BARGARA - EXISTING
INNES PARK - EXISTING
BARGARA - AREA 4
CEMEX QUARRY
BARGARA - AREA 1
CORAL COVE - EXISTING
BUNDABERG EAST
BARGARA - AREA 2
INNES PARK NORTH
ELLIOT HEADS - EXISTING
INNES PARK - AREA 1
HUMMOCK - EXISTING
BARGARA - AREA 3
ELLIOT HEADS - AREA 1
ELLIOT HEADS - AREA 1
0 1 2 30.5Kilometers
!Legend
Masterplan Stages
Stage 4
Stage 3
Stage 2
Stage 1
Exhibit 3Development Staging

2800 Ha
BUNDABERG EAST
BURNETT HEADS - EXISTING
BARGARA - EXISTING
INNES PARK - EXISTING
BARGARA - AREA 4
CEMEX QUARRY
BARGARA - AREA 1
CORAL COVE - EXISTING
BUNDABERG EAST
BARGARA - AREA 2
INNES PARK NORTH
ELLIOT HEADS - EXISTING
INNES PARK - AREA 1
HUMMOCK - EXISTING
BARGARA - AREA 3
ELLIOT HEADS - AREA 1
ELLIOT HEADS - AREA 1
0 1 2 30.5Kilometers
!Legend
Masterplan Stages
Stage 4
Stage 3
Stage 2
Stage 1
Irrigation Areas
Sunwater Irrigation area
Potential WWTP Location
Exhibit 4Option1A
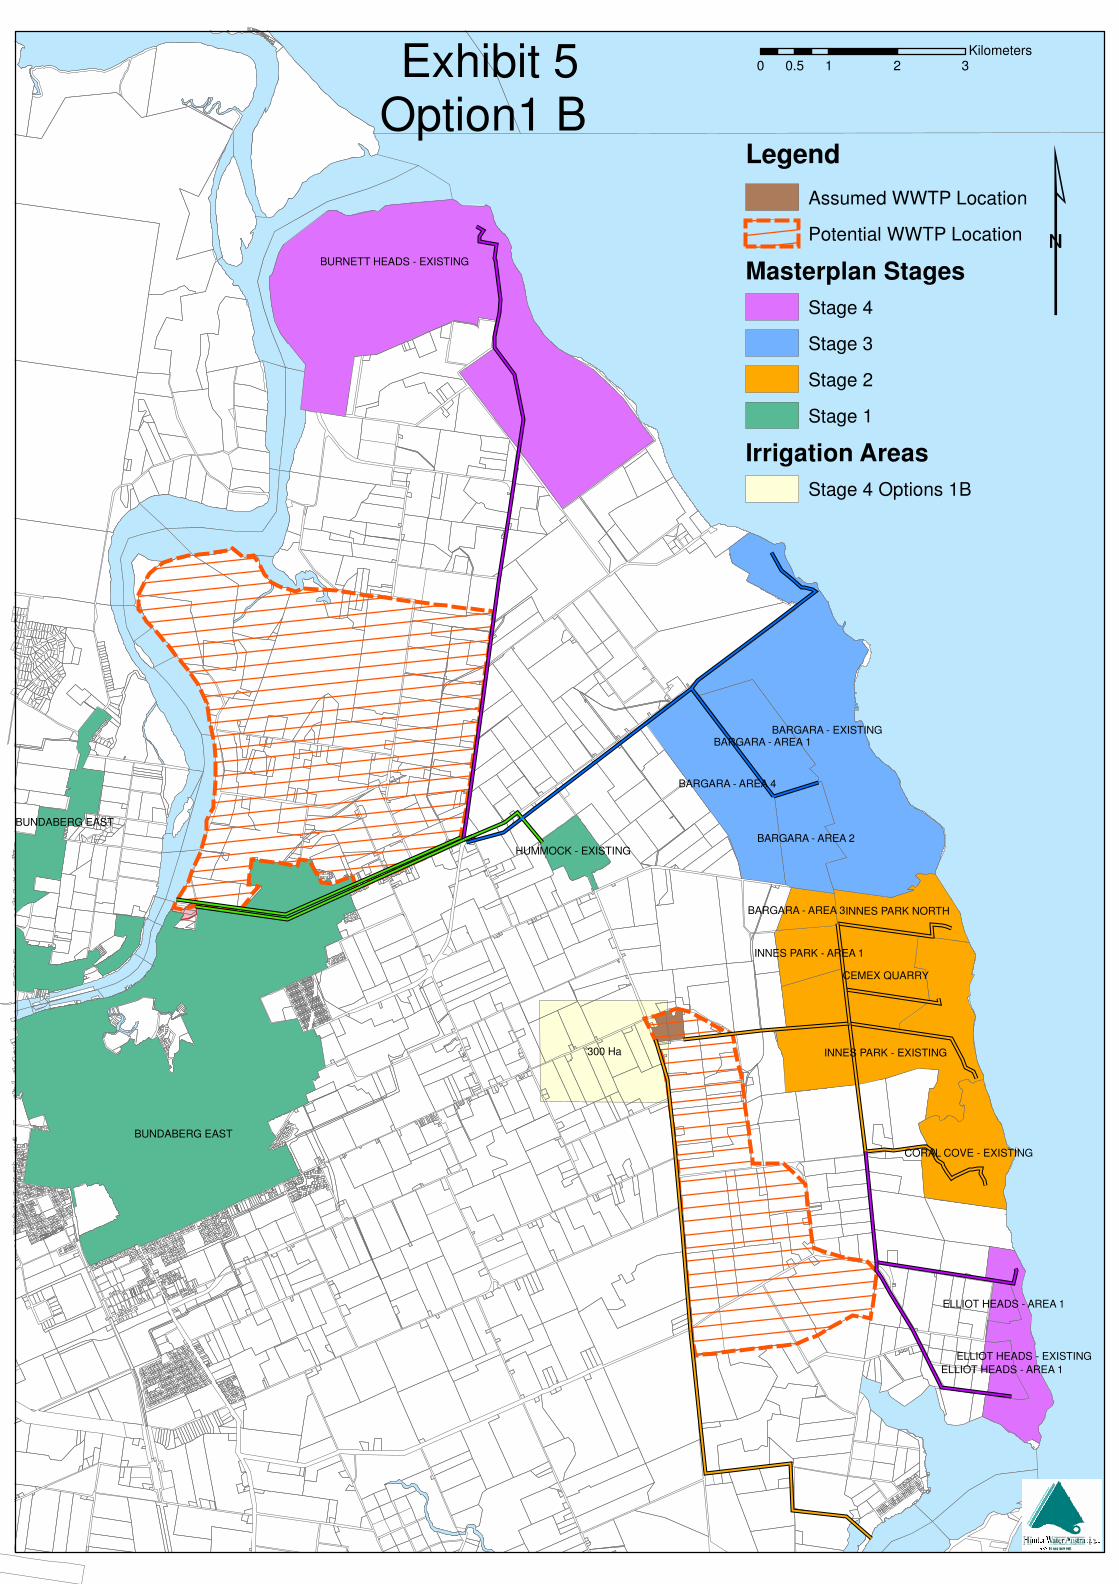
300 Ha
BUNDABERG EAST
BURNETT HEADS - EXISTING
BARGARA - EXISTING
INNES PARK - EXISTING
BARGARA - AREA 4
CEMEX QUARRY
BARGARA - AREA 1
CORAL COVE - EXISTING
BUNDABERG EAST
BARGARA - AREA 2
INNES PARK NORTH
ELLIOT HEADS - EXISTING
INNES PARK - AREA 1
HUMMOCK - EXISTING
BARGARA - AREA 3
ELLIOT HEADS - AREA 1
ELLIOT HEADS - AREA 1
0 1 2 30.5Kilometers
!Legend
Assumed WWTP Location
Potential WWTP Location
Masterplan Stages
Stage 4
Stage 3
Stage 2
Stage 1
Irrigation Areas
Stage 4 Options 1B
Exhibit 5Option1 B
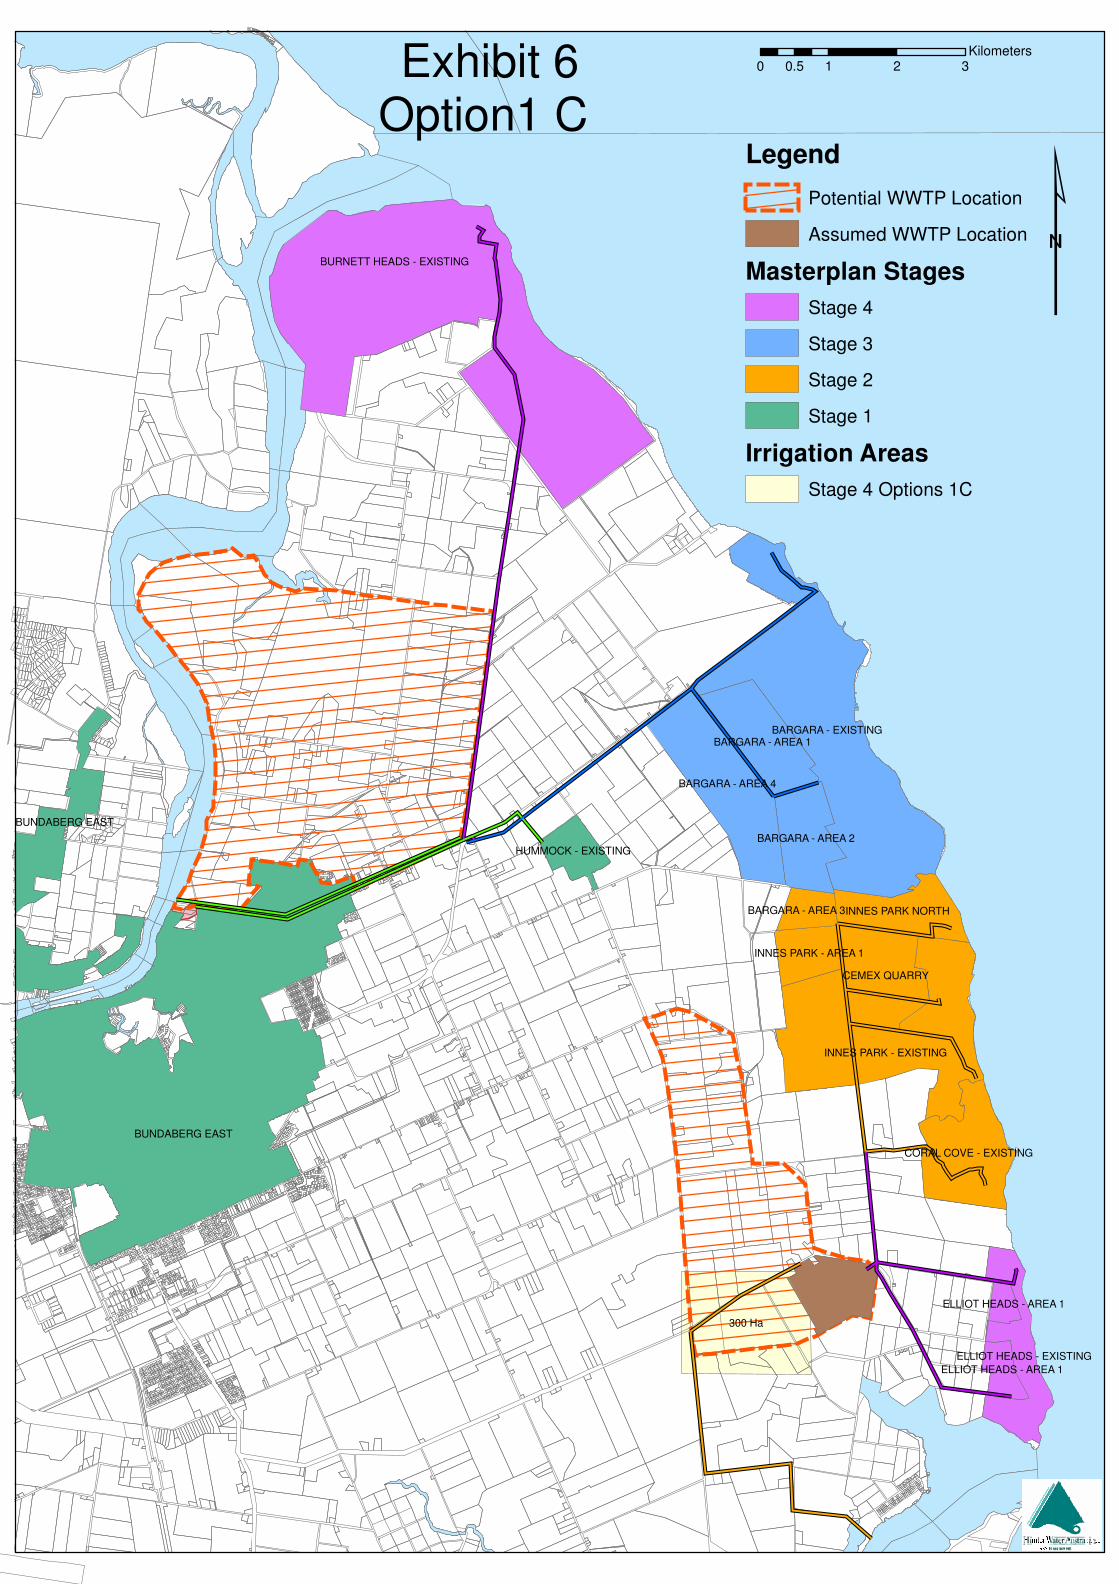
300 Ha
BUNDABERG EAST
BURNETT HEADS - EXISTING
BARGARA - EXISTING
INNES PARK - EXISTING
BARGARA - AREA 4
CEMEX QUARRY
BARGARA - AREA 1
CORAL COVE - EXISTING
BUNDABERG EAST
BARGARA - AREA 2
INNES PARK NORTH
ELLIOT HEADS - EXISTING
INNES PARK - AREA 1
HUMMOCK - EXISTING
BARGARA - AREA 3
ELLIOT HEADS - AREA 1
ELLIOT HEADS - AREA 1
0 1 2 30.5Kilometers
!Legend
Potential WWTP Location
Assumed WWTP Location
Masterplan Stages
Stage 4
Stage 3
Stage 2
Stage 1
Irrigation Areas
Stage 4 Options 1C
Exhibit 6Option1 C

550 Ha
65 Ha
130 Ha
BUNDABERG EAST
BURNETT HEADS - EXISTING
BARGARA - EXISTING
INNES PARK - EXISTING
BARGARA - AREA 4
CEMEX QUARRY
BARGARA - AREA 1
CORAL COVE - EXISTING
BUNDABERG EAST
BARGARA - AREA 2
INNES PARK NORTH
ELLIOT HEADS - EXISTING
INNES PARK - AREA 1
HUMMOCK - EXISTING
BARGARA - AREA 3
ELLIOT HEADS - AREA 1
ELLIOT HEADS - AREA 1
0 1 2 30.5Kilometers
!Legend
Masterplan Stages
Stage 4
Stage 3
Stage 2
Stage 1
Potential WWTP Location
BRC Owned Land
Irrigation Areas
Stage 3 Options 1B & 1C
Stage 4 - Option 1D
Stage 4 Options 1 B, C & D
Exhibit 7Option 2

100 Ha
MOORE PARK - EXISTING
0 1 20.5Kilometers
!Legend
Moore Park
Potential WWTP Land
Exhibit 8Moore Park

Bundaberg East & Bargara Coastal Region – Wastewater Treatment and Effluent Management Master Plan
Commercial in Confidence
AAppppeennddiixx AA –– CCoosstt EEssttiimmaatteess

Option 1A
Year 2006 2011 2016 2021 2026 2036 2056 ULT
Stage 1 1 2 2 3 4 4 4
Year No 1 6 11 16 21 31 51 60
EP Projection 33,973 34,304 41,509 46,064 63,496 74,951 82,344 86,373
Effluent Volumes (Ml/a) 2976 3005 3636 4035 5562 6566 7213 7566
Discharge Volume (Ml/a) 2976 3005 0 0 0 0 0 0
%age Reuse 0 0 100% 100% 100% 100% 100% 100%
Storage Requirements (Ml) 0 0 349 388 534 631 693 727
Land area Requirements 0 0 606 673 927 1094 1202 1261
ESTIMATED COSTS
NPV - Check
Treatment costs
Capital 56,000,000$ 56,000,000$ Treatment Operating & Maintenance 43,396,065$
-$
Transportation Costs -$
Pump stations 2,590,000$ 379,000$ 379,000$ 2,262,000$ 211,000$ 211,000$ PS Op & Maintenance 3,918,890$
Pipelines 14,157,000$ -$ 22,222,000$ -$ 3,454,000$ 10,812,000$ -$ -$ Pipelines Maintenance 213,154$
-$
Storage Costs -$
-$
Storage Lagoons -$ -$ 2,500,000$ -$ -$ -$ -$ -$ -$
-$
Land Costs -$
-$
Nil - sunwater irri district -$ -$ -$ -$ -$ -$ -$ -$ -$
-$
-$
Total Capital Costs 72,747,000$ -$ 25,101,000$ 379,000$ 61,716,000$ 11,023,000$ -$ 211,000$ 47,528,109$
Disc Rate 7% Discounted Cost 67,987,850$ -$ 11,925,304$ 128,380$ 14,905,222$ 1,353,327$ -$ 3,641$
Cumulative Cost 67,987,850$ 67,987,850$ 79,913,155$ 80,041,535$ 94,946,757$ 96,300,084$ 96,300,084$ 96,303,725$
Capital NPV 96,303,725$
Operating NPV 47,528,109$
Total NPV 143,831,834$
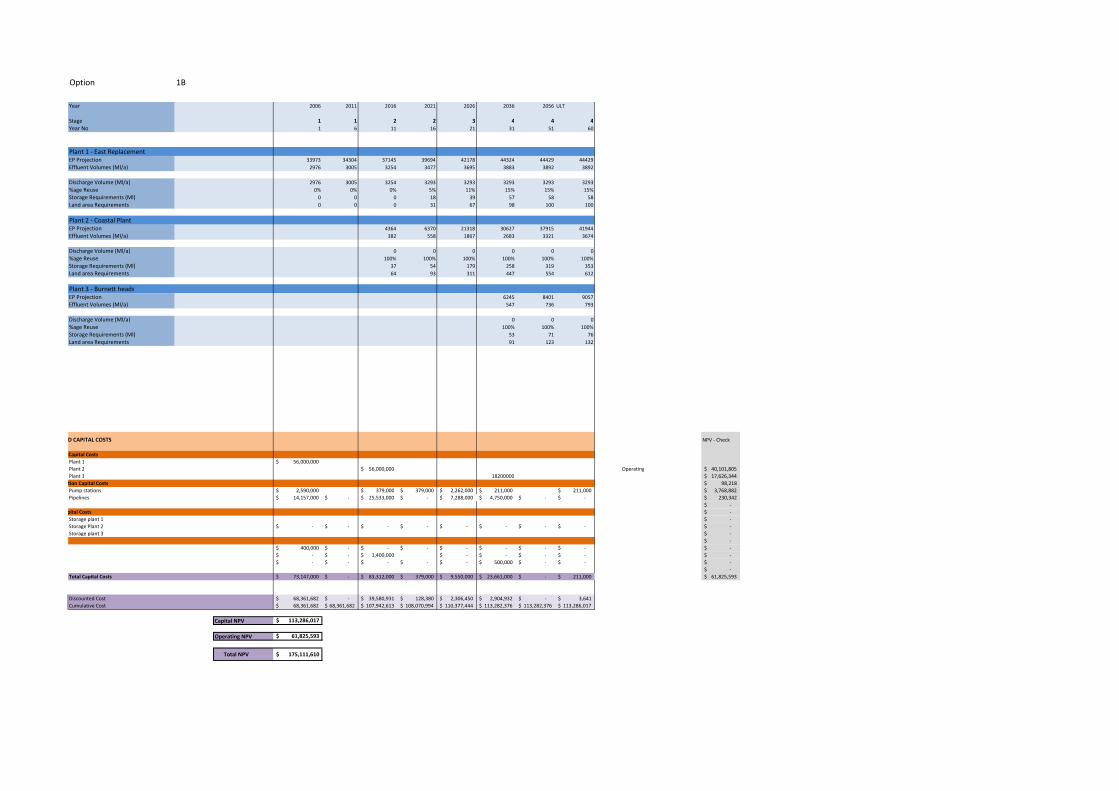
Option 1B
Year 2006 2011 2016 2021 2026 2036 2056 ULT
Stage 1 1 2 2 3 4 4 4
Year No 1 6 11 16 21 31 51 60
Plant 1 - East ReplacementEP Projection 33973 34304 37145 39694 42178 44324 44429 44429
Effluent Volumes (Ml/a) 2976 3005 3254 3477 3695 3883 3892 3892
Discharge Volume (Ml/a) 2976 3005 3254 3293 3293 3293 3293 3293
%age Reuse 0% 0% 0% 5% 11% 15% 15% 15%
Storage Requirements (Ml) 0 0 0 18 39 57 58 58
Land area Requirements 0 0 0 31 67 98 100 100
Plant 2 - Coastal PlantEP Projection 4364 6370 21318 30627 37915 41944
Effluent Volumes (Ml/a) 382 558 1867 2683 3321 3674
Discharge Volume (Ml/a) 0 0 0 0 0 0
%age Reuse 100% 100% 100% 100% 100% 100%
Storage Requirements (Ml) 37 54 179 258 319 353
Land area Requirements 64 93 311 447 554 612
Plant 3 - Burnett headsEP Projection 6245 8401 9057
Effluent Volumes (Ml/a) 547 736 793
Discharge Volume (Ml/a) 0 0 0
%age Reuse 100% 100% 100%
Storage Requirements (Ml) 53 71 76
Land area Requirements 91 123 132
ESTIMATED CAPITAL COSTS NPV - Check
Treatment Capital Costs
Plant 1 56,000,000$
Plant 2 56,000,000$ Operating 40,101,805$
Plant 3 18200000 17,626,344$
Transportation Capital Costs 98,218$
Pump stations 2,590,000$ 379,000$ 379,000$ 2,262,000$ 211,000$ 211,000$ 3,768,882$
Pipelines 14,157,000$ -$ 25,533,000$ -$ 7,288,000$ 4,750,000$ -$ -$ 230,342$
-$
Storage Capital Costs -$
Storage plant 1 -$
Storage Plant 2 -$ -$ -$ -$ -$ -$ -$ -$ -$
Storage plant 3 -$
-$
400,000$ -$ -$ -$ -$ -$ -$ -$ -$
-$ -$ 1,400,000$ -$ -$ -$ -$ -$
-$ -$ -$ -$ -$ 500,000$ -$ -$ -$
-$
Total Capital Costs 73,147,000$ -$ 83,312,000$ 379,000$ 9,550,000$ 23,661,000$ -$ 211,000$ 61,825,593$
Discounted Cost 68,361,682$ -$ 39,580,931$ 128,380$ 2,306,450$ 2,904,932$ -$ 3,641$
Cumulative Cost 68,361,682$ 68,361,682$ 107,942,613$ 108,070,994$ 110,377,444$ 113,282,376$ 113,282,376$ 113,286,017$
Capital NPV 113,286,017$
Operating NPV 61,825,593$
Total NPV 175,111,610$

Option 1B
Year 2006 2011 2016 2021 2026 2036 2056 ULT
Stage 1 1 2 2 3 4 4 4
Year No 1 6 11 16 21 31 51 60
Plant 1 - East ReplacementEP Projection 33973 34304 37145 39694 42178 44324 44429 44429
Effluent Volumes (Ml/a) 2976 3005 3254 3477 3695 3883 3892 3892
Discharge Volume (Ml/a) 2976 3005 3254 3293 3293 3293 3293 3293
%age Reuse 0% 0% 0% 5% 11% 15% 15% 15%
Storage Requirements (Ml) 0 0 0 18 39 57 58 58
Land area Requirements 0 0 0 31 67 98 100 100
Plant 2 - Coastal PlantEP Projection 4364 6370 21318 30627 37915 41944
Effluent Volumes (Ml/a) 382 558 1867 2683 3321 3674
Discharge Volume (Ml/a) 0 0 0 0 0 0
%age Reuse 100% 100% 100% 100% 100% 100%
Storage Requirements (Ml) 37 54 179 258 319 353
Land area Requirements 64 93 311 447 554 612
Plant 3 - Burnett headsEP Projection 6245 8401 9057
Effluent Volumes (Ml/a) 547 736 793
Discharge Volume (Ml/a) 0 0 0
%age Reuse 100% 100% 100%
Storage Requirements (Ml) 53 71 76
Land area Requirements 91 123 132
ESTIMATED CAPITAL COSTS
Treatment Capital Costs
Plant 1 56,000,000$
Plant 2 56,000,000$
Plant 3 18,200,000$
Transportation Capital Costs
Pump stations 2,590,000$ 379,000$ 379,000$ 2,262,000$ 211,000$ 211,000$
Pipelines 14,157,000$ -$ 25,533,000$ -$ 7,288,000$ 4,750,000$ -$ -$
Storage Capital Costs
Storage plant 1 -$ -$ 400,000$ -$ -$ -$ -$ -$
Storage Plant 2 -$ -$ 1,400,000$ -$ -$ -$ -$
Storage plant 3 -$ -$ -$ -$ -$ -$ 500,000$ -$
-$ -$ -$ -$ -$ -$ -$ -$
Land Costs
Capital -$ -$ -$ -$ -$ -$ -$ -$
Total Capital Costs 72,747,000$ -$ 83,712,000$ 379,000$ 9,550,000$ 23,161,000$ 500,000$ 211,000$
7% Discounted Cost 67,987,850$ -$ 39,770,968$ 128,380$ 2,306,450$ 2,843,546$ 15,863$ 3,641$
Cumulative Cost 67,987,850$ 67,987,850$ 107,758,819$ 107,887,199$ 110,193,649$ 113,037,195$ 113,053,058$ 113,056,699$
Capital NPV 113,056,699$
Operating NPV 60,305,296$
Total NPV 173,361,995$

Option 1B
Year 2006 2011 2016 2021 2026 2036 2056 ULT
Stage 1 1 2 2 3 4 4 4
Year No 1 6 11 16 21 31 51 60
Plant 1 - East ReplacementEP Projection 33973 34304 37145 39694 42178 44324 44429 44429
Effluent Volumes (Ml/a) 2976 3005 3254 3477 3695 3883 3892 3892
Discharge Volume (Ml/a) 2976 3005 3254 3293 3293 3293 3293 3293
%age Reuse 0% 0% 0% 5% 11% 15% 15% 15%
Storage Requirements (Ml) 0 0 0 18 39 57 58 58
Land area Requirements 0 0 0 31 67 98 100 100
Plant 2 - Coastal PlantEP Projection 4364 6370 21318 27821 33821 37850
Effluent Volumes (Ml/a) 382 558 1867 2437 2963 3316
Discharge Volume (Ml/a) 0 0 0 0 0 0
%age Reuse 100% 100% 100% 100% 100% 100%
Storage Requirements (Ml) 37 54 179 234 285 318
Land area Requirements 64 93 311 406 494 553
Plant 3 - Burnett headsEP Projection 6245 8401 9057
Effluent Volumes (Ml/a) 547 736 793
Discharge Volume (Ml/a) 0 0 0
%age Reuse 100% 100% 100%
Storage Requirements (Ml) 53 71 76
Land area Requirements 91 123 132
Plant 4 - Elliot HeadsEP Projection 2806 4094 4094
Effluent Volumes (Ml/a) 246 359 359
Discharge Volume (Ml/a) 0 0 0
%age Reuse 100% 100% 100%
Storage Requirements (Ml) 24 34 34
Land area Requirements 41 60 60
ESTIMATED COSTS
Treatment Capital Costs
Plant 1 56,000,000$
Plant 2 56,000,000$
Plant 3 18,200,000$
Plant 4 10,000,000$
Transportation Capital Costs
Pump stations 2,590,000$ 379,000$ 379,000$ 2,262,000$ 211,000$ 211,000$
Pipelines 14,157,000$ -$ 25,533,000$ -$ 7,288,000$ 4,750,000$ -$ -$
Storage Capital Costs
Storage plant 1 -$ -$ 400,000$ -$ -$ -$ -$ -$
Storage Plant 2 -$ -$ 1,300,000$ -$ -$ -$ -$
Storage plant 3 -$ -$ 500,000$ -$ -$ -$ -$ -$
Storage plant 4 -$ -$ -$ -$ -$ 500,000$ -$ -$
Storage plant 5 -$ -$ -$ -$ -$ 500,000$ -$ -$
Land Costs
Capital Cost - Assumed 50% land Council Owned -$ -$ -$ -$ -$ -$ -$ -$
Total Capital Costs 72,747,000$ -$ 84,112,000$ 379,000$ 9,550,000$ 34,161,000$ -$ 211,000$
7% Discounted Cost 67,987,850$ -$ 39,961,005$ 128,380$ 2,306,450$ 4,194,049$ -$ 3,641$
Cumulative Cost 67,987,850$ 67,987,850$ 107,948,856$ 108,077,236$ 110,383,686$ 114,577,735$ 114,577,735$ 114,581,376$
Capital NPV 114,581,376$
Operating NPV 61,863,504$
Total NPV 176,444,880$

Option 1B
Year 2006 2011 2016 2021 2026 2036 2056 ULT
Stage 1 1 2 2 3 4 4 4
Year No 1 6 11 16 21 31 51 60
Plant 1 - East ReplacementEP Projection 33973 34304 37145 39694 42178 44324 44429 44429
Effluent Volumes (Ml/a) 2976 3005 3254 3477 3695 3883 3892 3892
Discharge Volume (Ml/a) 2976 3005 3254 3293 3293 3293 3293 3293
%age Reuse 0% 0% 0% 5% 11% 15% 15% 15%
Storage Requirements (Ml) 0 0 0 18 39 57 58 58
Land area Requirements 0 0 0 31 67 98 100 100
Plant 2 - Coastal PlantEP Projection 4364 6370 7663 10830 13494 17523
Effluent Volumes (Ml/a) 382 558 671 949 1182 1535
Discharge Volume (Ml/a) 0 0 0 0 0 0
%age Reuse 100% 100% 100% 100% 100% 100%
Storage Requirements (Ml) 37 54 64 91 114 147
Land area Requirements 64 93 112 158 197 256
Plant 3 - BargaraEP Projection 10441 12053 13655 16991 20327 20327
Effluent Volumes (Ml/a) 915 1056 1196 1488 1781 1781
Discharge Volume (Ml/a) 38 56 0 0 0 0
%age Reuse 96% 95% 100% 100% 100% 100%
Storage Requirements (Ml) 84 96 115 143 171 171
Land area Requirements 146 167 199 248 297 297
Plant 4 - Burnett HeadsEP Projection 2806 4094 4094
Effluent Volumes (Ml/a) 246 359 359
Discharge Volume (Ml/a) 0 0 0
%age Reuse 100% 100% 100%
Storage Requirements (Ml) 24 34 34
Land area Requirements 41 60 60
Plant 5 - Elliot HeadsEP Projection 6245 8401 9057
Effluent Volumes (Ml/a) 547 736 793
Discharge Volume (Ml/a) 0 0 0
%age Reuse 100% 100% 100%
Storage Requirements (Ml) 53 71 76
Land area Requirements 91 123 132
Total Land Area 0 0 210 290 378 637 776 844
ESTIMATED COSTS
Treatment Capital Costs
Plant 1 56,000,000$
Plant 2 32,300,000$
Plant 3 34,800,000$
Plant 4 10,000,000$
Plant 5 18,200,000$
Transportation Capital Costs
Pump stations 654,000$ 183,000$ 349,000$
Pipelines 1,340,000$ 1,340,000$ 4,219,500$ 4,219,500$ 3,459,000$ 1,976,500$ 1,976,500$ -$
Storage Capital Costs
Storage plant 1 -$ -$ 400,000$ -$ -$ -$ -$ -$
Storage Plant 2 -$ -$ 760,000$ -$ -$ -$ -$
Storage plant 3 -$ -$ 800,000$ -$ -$ -$ -$ -$
Storage plant 4 -$ -$ -$ -$ -$ 320,000$ -$ -$
Storage plant 5 -$ -$ -$ -$ -$ 500,000$ -$ -$
Land Costs
Capital Cost - Assumed 50% land Council Owned 30,000$ 50% -$ -$ 3,146,777$ 1,208,843$ 4,464,281$ 5,085,143$ 6,555,512$ 6,111,158$
Total Capital Costs 57,340,000$ 1,340,000$ 77,080,277$ 5,428,343$ 8,106,281$ 36,430,643$ 8,532,012$ 6,111,158$
7% Discounted Cost 53,588,785$ 892,899$ 36,620,284$ 1,838,768$ 1,957,773$ 4,472,700$ 270,694$ 105,462$
Cumulative Cost 53,588,785$ 54,481,684$ 91,101,968$ 92,940,736$ 94,898,508$ 99,371,208$ 99,641,902$ 99,747,364$
Capital NPV 99,747,364$
Operating NPV 59,895,606$
Total NPV 159,642,970$
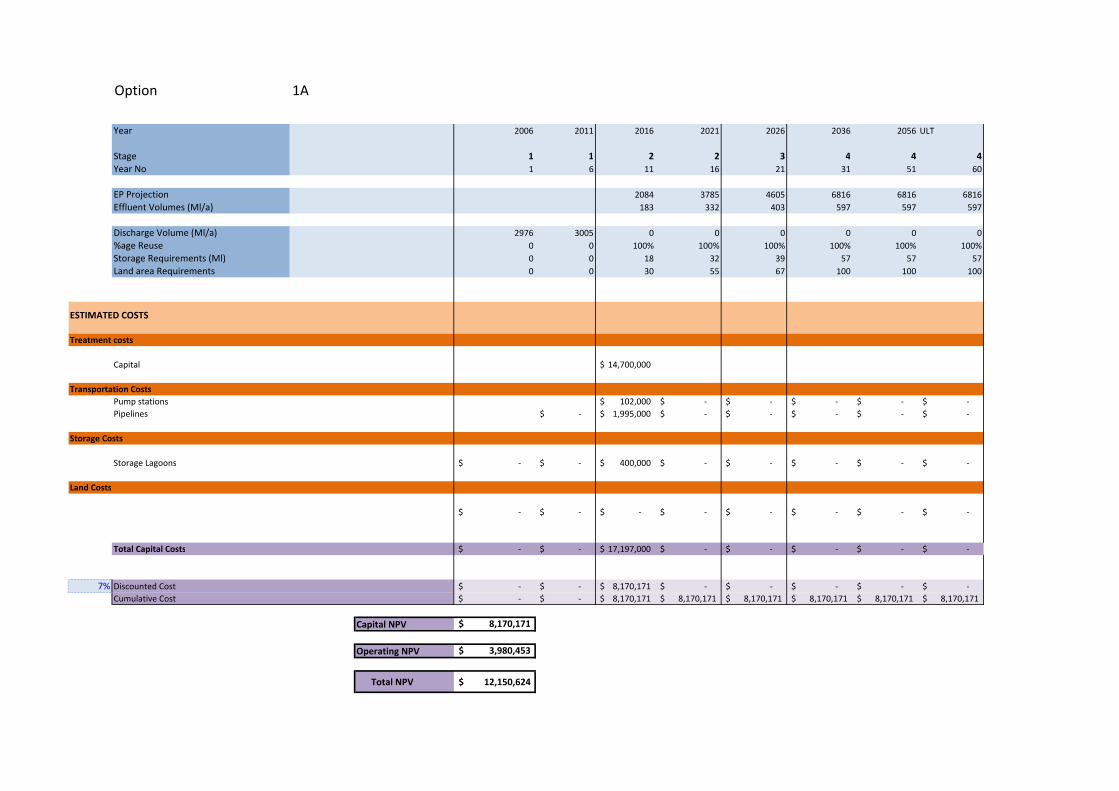
Option 1A
Year 2006 2011 2016 2021 2026 2036 2056 ULT
Stage 1 1 2 2 3 4 4 4
Year No 1 6 11 16 21 31 51 60
EP Projection 2084 3785 4605 6816 6816 6816
Effluent Volumes (Ml/a) 183 332 403 597 597 597
Discharge Volume (Ml/a) 2976 3005 0 0 0 0 0 0
%age Reuse 0 0 100% 100% 100% 100% 100% 100%
Storage Requirements (Ml) 0 0 18 32 39 57 57 57
Land area Requirements 0 0 30 55 67 100 100 100
ESTIMATED COSTS
Treatment costs
Capital 14,700,000$
Transportation Costs
Pump stations 102,000$ -$ -$ -$ -$ -$
Pipelines -$ 1,995,000$ -$ -$ -$ -$ -$
Storage Costs
Storage Lagoons -$ -$ 400,000$ -$ -$ -$ -$ -$
Land Costs
-$ -$ -$ -$ -$ -$ -$ -$
Total Capital Costs -$ -$ 17,197,000$ -$ -$ -$ -$ -$
7% Discounted Cost -$ -$ 8,170,171$ -$ -$ -$ -$ -$
Cumulative Cost -$ -$ 8,170,171$ 8,170,171$ 8,170,171$ 8,170,171$ 8,170,171$ 8,170,171$
Capital NPV 8,170,171$
Operating NPV 3,980,453$
Total NPV 12,150,624$

Bundaberg East & Bargara Coastal Region – Wastewater Treatment and Effluent Management Master Plan
Commercial in Confidence
AAppppeennddiixx BB –– MMuullttii--ccrriitteerriiaa
AAsssseessssmmeenntt MMeetthhooddoollooggyy
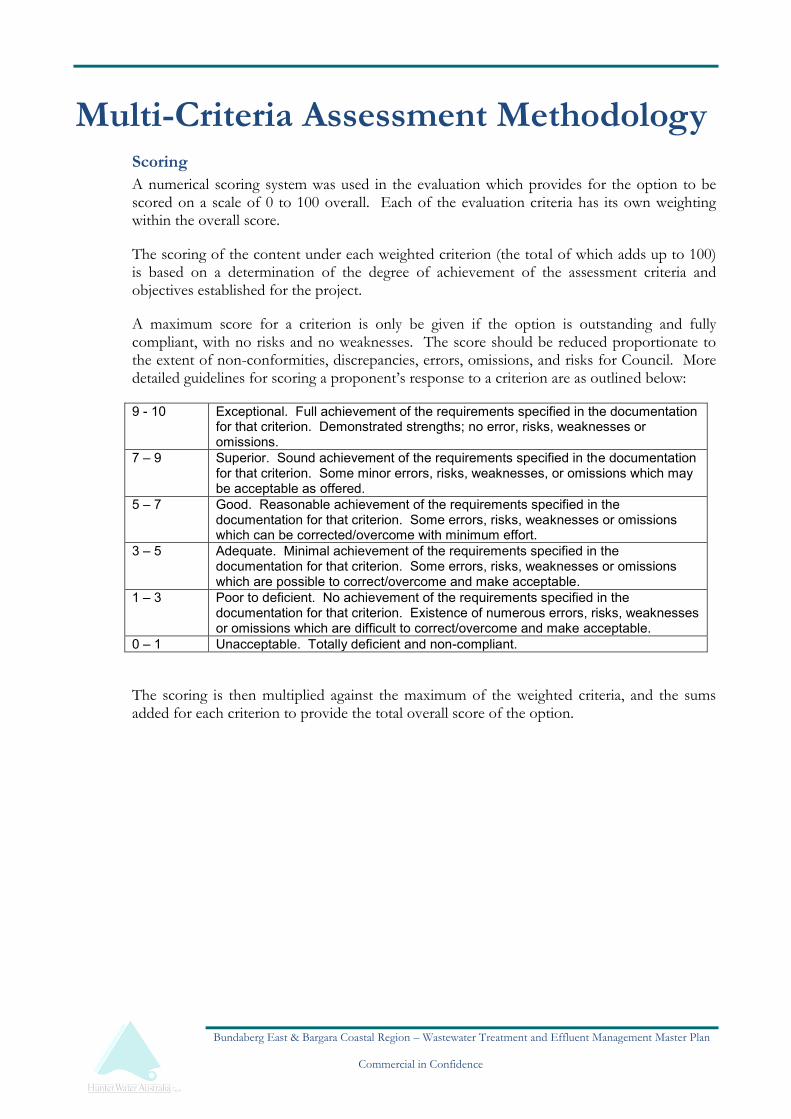
Bundaberg East & Bargara Coastal Region – Wastewater Treatment and Effluent Management Master Plan
Commercial in Confidence
Multi-Criteria Assessment Methodology Scoring
A numerical scoring system was used in the evaluation which provides for the option to be scored on a scale of 0 to 100 overall. Each of the evaluation criteria has its own weighting within the overall score.
The scoring of the content under each weighted criterion (the total of which adds up to 100) is based on a determination of the degree of achievement of the assessment criteria and objectives established for the project.
A maximum score for a criterion is only be given if the option is outstanding and fully compliant, with no risks and no weaknesses. The score should be reduced proportionate to the extent of non-conformities, discrepancies, errors, omissions, and risks for Council. More detailed guidelines for scoring a proponent’s response to a criterion are as outlined below:
9 - 10 Exceptional. Full achievement of the requirements specified in the documentation for that criterion. Demonstrated strengths; no error, risks, weaknesses or omissions.
7 – 9 Superior. Sound achievement of the requirements specified in the documentation for that criterion. Some minor errors, risks, weaknesses, or omissions which may be acceptable as offered.
5 – 7 Good. Reasonable achievement of the requirements specified in the documentation for that criterion. Some errors, risks, weaknesses or omissions which can be corrected/overcome with minimum effort.
3 – 5 Adequate. Minimal achievement of the requirements specified in the documentation for that criterion. Some errors, risks, weaknesses or omissions which are possible to correct/overcome and make acceptable.
1 – 3 Poor to deficient. No achievement of the requirements specified in the documentation for that criterion. Existence of numerous errors, risks, weaknesses or omissions which are difficult to correct/overcome and make acceptable.
0 – 1 Unacceptable. Totally deficient and non-compliant.
The scoring is then multiplied against the maximum of the weighted criteria, and the sums added for each criterion to provide the total overall score of the option.
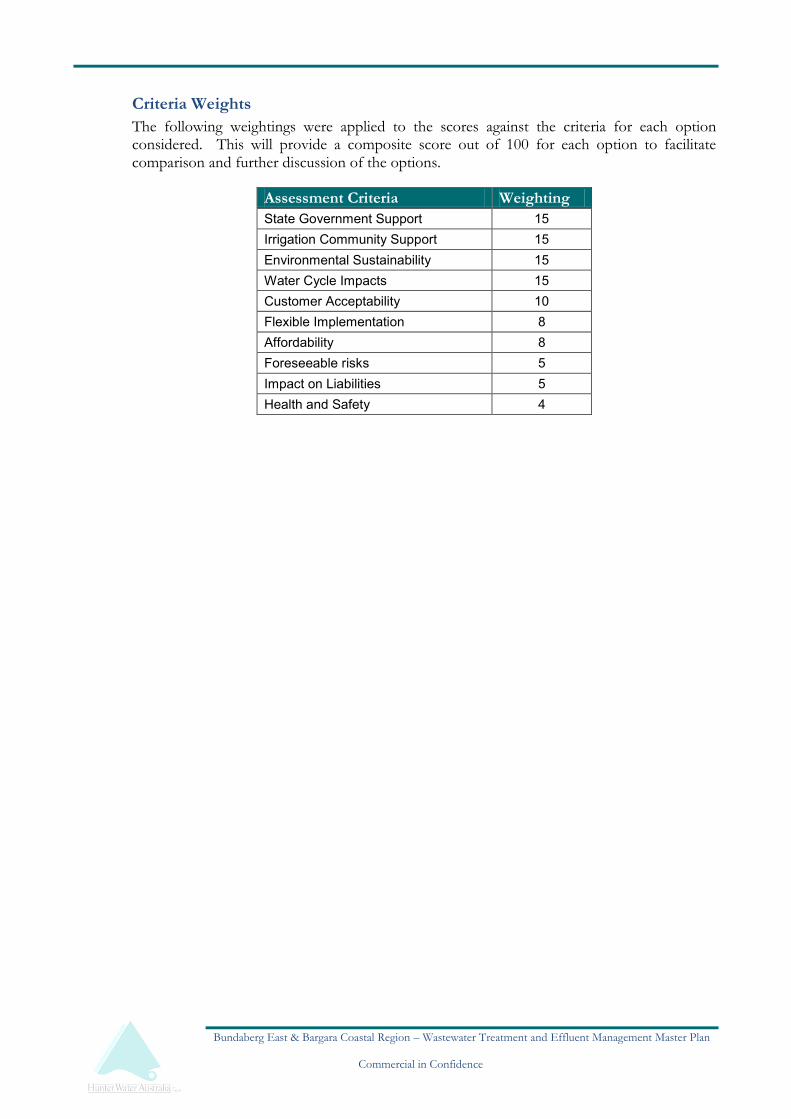
Bundaberg East & Bargara Coastal Region – Wastewater Treatment and Effluent Management Master Plan
Commercial in Confidence
Criteria Weights
The following weightings were applied to the scores against the criteria for each option considered. This will provide a composite score out of 100 for each option to facilitate comparison and further discussion of the options.
Assessment Criteria Weighting
State Government Support 15 Irrigation Community Support 15 Environmental Sustainability 15 Water Cycle Impacts 15 Customer Acceptability 10 Flexible Implementation 8 Affordability 8 Foreseeable risks 5 Impact on Liabilities 5 Health and Safety 4


