16
WASTEWATER
| Date post: | 10-Apr-2018 |
| Category: |
Documents |
| Upload: | nguyenhuong |
| View: | 213 times |
| Download: | 0 times |
SECTION TITLE | CHAPTER THREE | 288
WASTEWATER
289 | CHAPTER THREE | WASTEWATER
OVERVIEWOur long term goal for wastewater is to ensure that wastewater treatment and disposal systems are sustainable and continue to meet environmental and health and safety standards. We will continue to encourage households to explore and implement measures that reduce wastewater volume per person.Increasing demand for wastewater services is driven by population growth, environmental degradation and public health issues. Waihi Beach experiences additional seasonal demand driven by holiday-makers. Developers pay financial contributions (subdivision fees) which are used to repay the costs of building future capacity into our District’s wastewater schemes.
URBAN CENTRES • Katikati
• Maketu/Little Waihi
• Omokoroa
• Te Puke
• Waihi Beach
We have five wastewater treatment plants at Katikati, Omokoroa, Maketu/Little Waihi, Te Puke and Waihi Beach. Resource Consents for three of the wastewater treatment plants must be renewed during the ten year period of this plan and the capital works programme may be influenced by resource consent requirements.
By calculating residential flows we are able to measure the capacity of our existing treatment plants. The following method is used for this purpose:
• Population based on an average of 2.7 people per house or dwelling
• Average dry weather flow (ADWF) of 220 litres per person per day in area water supply
• Design for populations of 1,000 people or more.
Based on this method with provision for our current structure plans we are near to or at capacity in all treatment plants. An increase in urban development outside our existing structure plans during the life of this plan would require expansions of the treatment plants.
There are a number of households in each wastewater scheme that can be connected but have currently chosen not to. We have a programme to actively encourage these households to connect for public health reasons. If these households were to connect to the schemes this would bring forward the timing of expansions.
Levels of service relating to the quality and quantity of discharges from treatment plants are prescribed by legislation and resource consent conditions. All our treatment plants comply with these service levels and no changes are anticipated in the short to medium term. There are no significant variations between the assessment of water services and this Wastewater Strategy.
MAKETU AND LITTLE WAIHI SCHEMEThe construction of the Maketu/Little Waihi wastewater treatment scheme was completed in 2012. There are 534 connections to the scheme with the potential to connect vacant lots as they are developed. The scheme uses a grinder pump system to connect individual households to the treatment plant on Arawa Avenue for land-based disposal. A new onsite holding tank for the primary treatment of solids will be installed at each property, the cost of which is included in the cost of the scheme.
The scheme can be expanded through a series of modular upgrades to add capacity to connect the infill growth expected over the next 25 years and the future residential subdivision on the Te Arawa Lakes Trust land. A Memorandum of Understanding is in place between the Trust and Council that outlines their future commitments to wastewater treatment at Maketu.
SMALL COASTAL COMMUNITIESFor areas of our District where a reticulated wastewater scheme is unavailable wastewater must be managed onsite. The Bay of Plenty Regional Council is responsible for the consenting and management of onsite schemes.
We will continue to work with the Regional Council and our small coastal communities to investigate options for sustainable onsite wastewater treatment.
Our investigations have indicated that the communities at Kauri Point, Plummers Point and Tuapiro Point are compatible with the Regional Council’s Operative Onsite Effluent Treatment Plan, as individual properties are large enough to provide sufficient areas for effective land-based treatment. At Tanners Point we have upgraded the public facilities to an advanced septic tank system. No further Council expenditure has been allocated for these coastal communities in this Long Term Plan.
Sewerage systems at Ongare Point and Te Puna West currently provide inadequate treatment and the resulting discharges are adversely affecting water quality in the Tauranga Harbour. By 1 December 2015 conventional systems in these communities must be either upgraded to advanced systems, connected to a Western Bay of Plenty District Council or approved community sewage reticulation system or apply for resource consent to continue operating. On-site treatment options are limited at Ongare Point and Te Puna West and we will continue working with these communities to find acceptable and affordable wastewater treatment solutions.
RURAL COMMUNITIESFor rural areas of our District where reticulated schemes are unavailable the Bay of Plenty Regional Council is responsible for the consenting and management of onsite wastewater schemes.
WASTEWATER

WASTEWATER | CHAPTER THREE | 290
WHAT WE PROVIDE
MAKETU34.4 KILOMETRES
of pipes
522 HOUSEHOLD PUMPS
2 BOOSTER PUMPS
• treatment plant with two sequential batch reactor tanks and emergency pond
• discharge to land via subsurface drip irrigation
14 PUMP STATIONS
• sewage is pumped to the Tauranga City Chapel Street plant for treatment
7 PUMP STATIONS
• treatment plant with a sequentially activated sludge system, ultraviolet disinfection and wetland
14 PUMP STATIONS
• treatment plant with aerated lagoons, ultraviolet disinfection and wetland
23 PUMP STATIONS
• treatment plant with aerated lagoons, ultraviolet disinfection and wetland
OMOKOROA62.1 KILOMETRES
of pipes TE PUKE68.6 KILOMETRES
of pipes
KATIKATI69.2 KILOMETRES
of pipes
WAIHI BEACH76.0 KILOMETRES
of pipes
291 | CHAPTER THREE | WASTEWATER
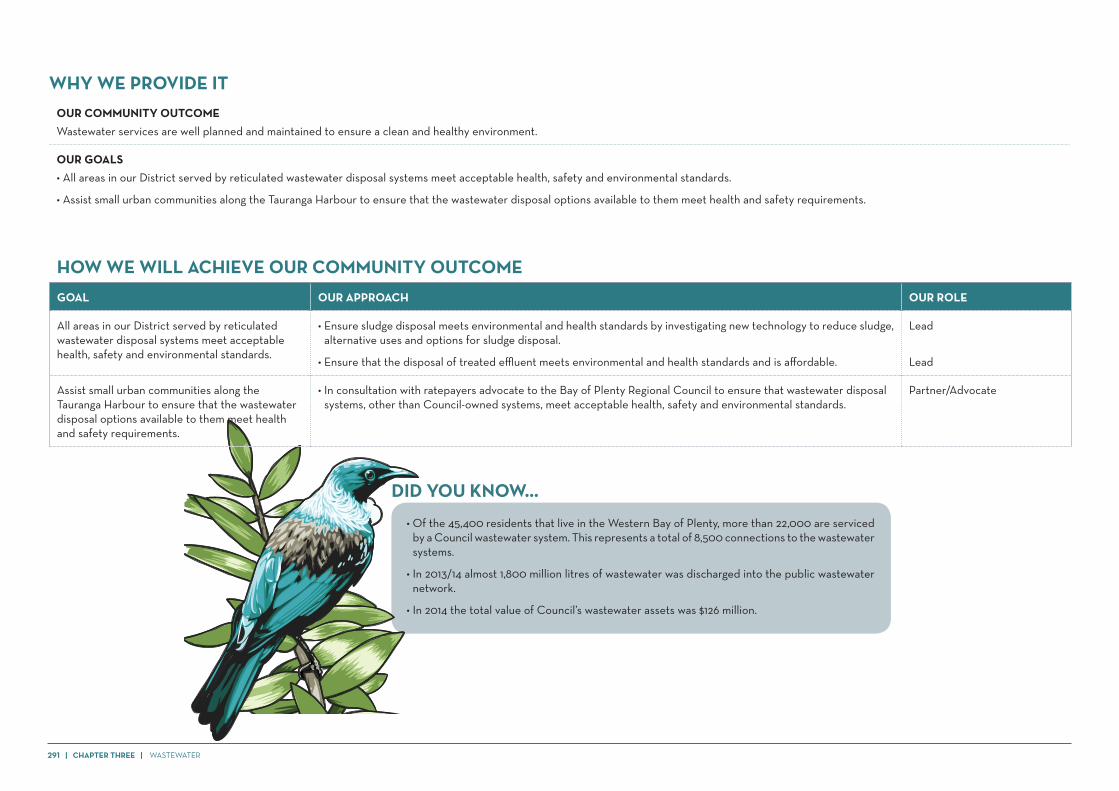
• Of the 45,400 residents that live in the Western Bay of Plenty, more than 22,000 are serviced by a Council wastewater system. This represents a total of 8,500 connections to the wastewater systems.
• In 2013/14 almost 1,800 million litres of wastewater was discharged into the public wastewater network.
• In 2014 the total value of Council’s wastewater assets was $126 million.
DID YOU KNOW...
WHY WE PROVIDE ITOUR COMMUNITY OUTCOMEWastewater services are well planned and maintained to ensure a clean and healthy environment.
OUR GOALS• All areas in our District served by reticulated wastewater disposal systems meet acceptable health, safety and environmental standards.
• Assist small urban communities along the Tauranga Harbour to ensure that the wastewater disposal options available to them meet health and safety requirements.
HOW WE WILL ACHIEVE OUR COMMUNITY OUTCOMEGOAL OUR APPROACH OUR ROLE
All areas in our District served by reticulated wastewater disposal systems meet acceptable health, safety and environmental standards.
• Ensure sludge disposal meets environmental and health standards by investigating new technology to reduce sludge, alternative uses and options for sludge disposal.
• Ensure that the disposal of treated effluent meets environmental and health standards and is affordable.
Lead
Lead
Assist small urban communities along the Tauranga Harbour to ensure that the wastewater disposal options available to them meet health and safety requirements.
• In consultation with ratepayers advocate to the Bay of Plenty Regional Council to ensure that wastewater disposal systems, other than Council-owned systems, meet acceptable health, safety and environmental standards.
Partner/Advocate

WASTEWATER | CHAPTER THREE | 292
WHAT WE ARE PLANNING TO DO All information from 2017 – 2025 includes an adjustment for inflation.
PROJECT NUMBER PROJECT NAME
$’000
2016 2017 2018 2019 2020 2021 2022 2023 2024 2025
168603 Waihi Beach Wastewater Treatement Plant Renewals
25 104 106 281 114 197 82 175 129 275
168604 Waihi Beach Wastewater Treatment Plant Fixed Generator
- - - - - - - - 158 -
168605 Waihi Beach Wastewater Treatment Plant Mechanical Separator for Wetlands
- - - - 160 - - - - -
226001 Waihi Beach Pump Station Renewals 68 101 107 153 137 155 158 169 185 183
226025 Waihi Beach Treatment Plant Upgrade Additional Aeration Capacity
- - 374 - - - - - - -
310902 Waihi Beach Asset Validation 5 5 5 6 6 6 6 6 7 7
317001 Waihi Beach Structure Plan Utilities Wastewater - - - - 541 - - - - -
319502 Waihi Beach Infiltration Investigation - 42 32 - - - - - - -
331301 Waihi Beach, Otawhiwhi Wastewater Connection
- 171 476 - - - - - - -
336301 Waihi Beach Wastewater Treatment Plant Monitoring and Review
30 - - 11 - - - - - -
340501 Wastewater Modelling 80 83 - - 34 - - - - -
225723 Katikati Wastewater Pump Station Renewals 55 66 69 87 76 77 127 101 178 185
225724 Katikati Wastewater Treatment Plant Renewals 65 78 80 123 399 212 122 107 85 44
225727 Katikati Wastewater Treatment Plant Renewals of Resource Consent
150 - 107 - - - - - 264 -
225742 Katikati Pump Station Additional Storage - 311 - - - - - - - -
293 | CHAPTER THREE | WASTEWATER
PROJECT NUMBER PROJECT NAME
$’000
2016 2017 2018 2019 2020 2021 2022 2023 2024 2025
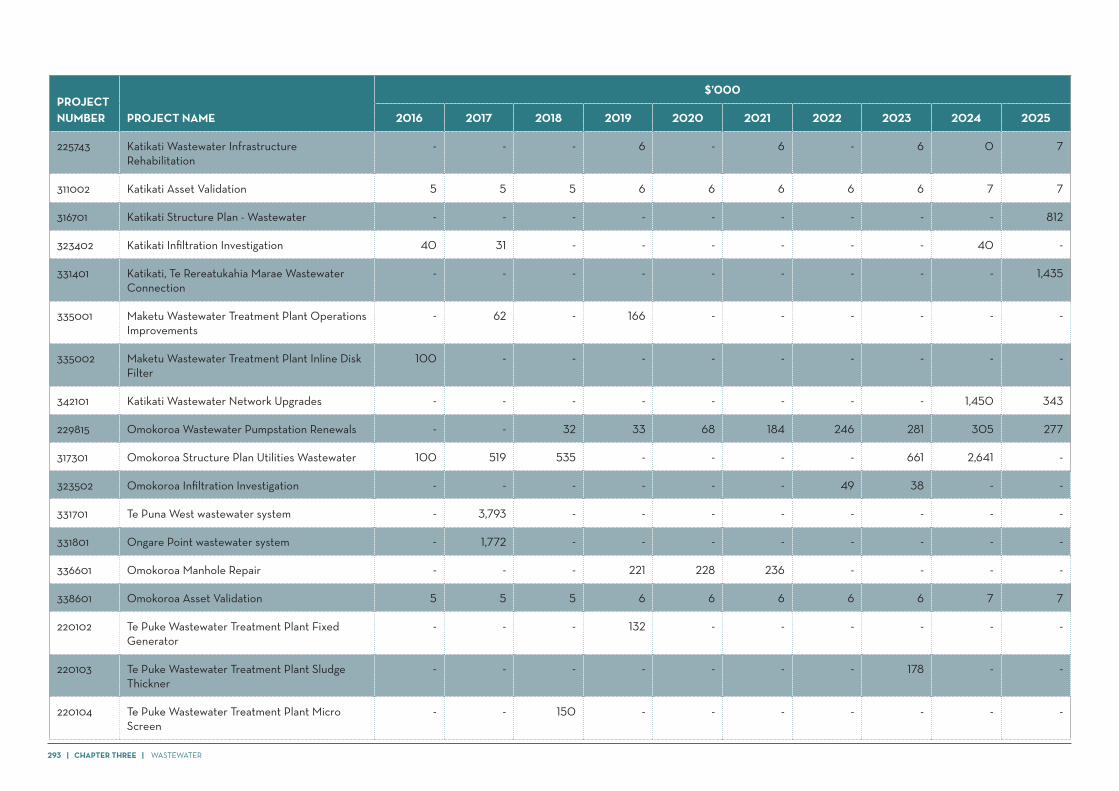
225743 Katikati Wastewater Infrastructure Rehabilitation
- - - 6 - 6 - 6 0 7
311002 Katikati Asset Validation 5 5 5 6 6 6 6 6 7 7
316701 Katikati Structure Plan - Wastewater - - - - - - - - - 812
323402 Katikati Infiltration Investigation 40 31 - - - - - - 40 -
331401 Katikati, Te Rereatukahia Marae Wastewater Connection
- - - - - - - - - 1,435
335001 Maketu Wastewater Treatment Plant Operations Improvements
- 62 - 166 - - - - - -
335002 Maketu Wastewater Treatment Plant Inline Disk Filter
100 - - - - - - - - -
342101 Katikati Wastewater Network Upgrades - - - - - - - - 1,450 343
229815 Omokoroa Wastewater Pumpstation Renewals - - 32 33 68 184 246 281 305 277
317301 Omokoroa Structure Plan Utilities Wastewater 100 519 535 - - - - 661 2,641 -
323502 Omokoroa Infiltration Investigation - - - - - - 49 38 - -
331701 Te Puna West wastewater system - 3,793 - - - - - - - -
331801 Ongare Point wastewater system - 1,772 - - - - - - - -
336601 Omokoroa Manhole Repair - - - 221 228 236 - - - -
338601 Omokoroa Asset Validation 5 5 5 6 6 6 6 6 7 7
220102 Te Puke Wastewater Treatment Plant Fixed Generator
- - - 132 - - - - - -
220103 Te Puke Wastewater Treatment Plant Sludge Thickner
- - - - - - - 178 - -
220104 Te Puke Wastewater Treatment Plant Micro Screen
- - 150 - - - - - - -

WASTEWATER | CHAPTER THREE | 294
PROJECT NUMBER PROJECT NAME
$’000
2016 2017 2018 2019 2020 2021 2022 2023 2024 2025
220105 Te Puke Wastewater Treatment Plant Inlet Grit Trap
- - 160 - - - - - - -
220106 Te Puke Wastewater Treatment Plant Effluent Monitoring Equipment
- - - - - - - 127 - -
220107 Te Puke Wastewater Treatment Plant Screen - - - - - - - - - 220
225615 Te Puke Wastewater Pump Station Renewals 73 77 53 72 68 88 98 38 85 111
225619 Te Puke Wastewater Treatment Plant Renewals 213 326 176 81 66 283 75 66 - 110
225620 Te Puke Wastewater Treatment Plant Renewals of Resource Consent
80 - - - - - - - - -
225632 Te Puke Wastewater Treatment Plant Upgrade - 282 - - - - 514 - - -
225633 Te Puke Wastewater Pipe Renewls - - - 61 - - - - - -
295702 Te Puke Structure Plan Area 3 Phase 2 - - - - 353 - - - - -
311102 Te Puke Asset Validation 5 5 5 6 6 6 6 6 7 7
323602 Te Puke Infiltration Investigation - - - - 46 35 - - - -
MAJOR PROJECTS PLANNED FOR 2015 - 2025 • Building community schemes for Ongare Point and Te Puna West in 2016 and 2017.
• Wastewater treatment plant renewals at Te Puke, Katikati and Waihi Beach.
• Wastewater pump station renewals at Te Puke, Katikati and Waihi Beach.
• Te Rereatukahia Marae wastewater connection.
All information from 2017 - 2025 includes an adjustment for inflation.
HOW OUR PLANS HAVE CHANGEDThe timing and costs of some of our projects have been updated since we adopted our 2012 - 2022 Long Term Plan (LTP). To see how our plans have changed click here for the complete list of the projects/programmes that have been revised or alternatively visit our website www.westernbay.govt.nz.
295 | CHAPTER THREE | WASTEWATER
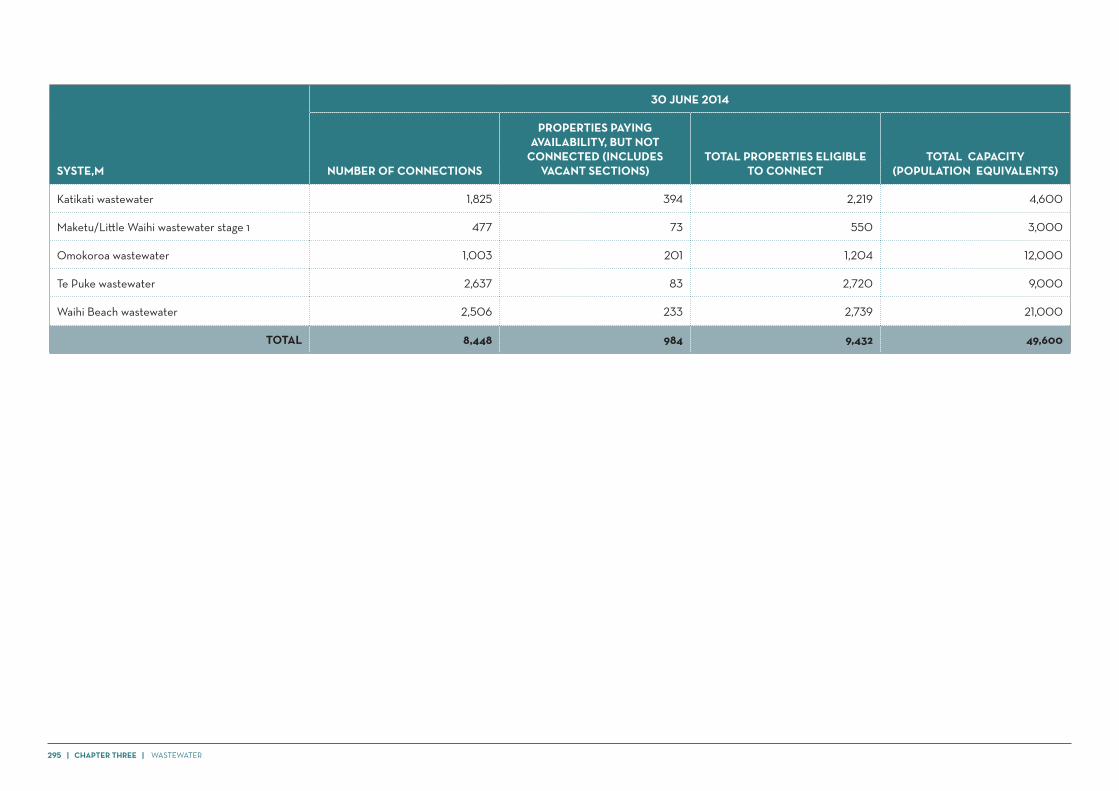
SYSTE,M
30 JUNE 2014
NUMBER OF CONNECTIONS
PROPERTIES PAYING AVAILABILITY, BUT NOT
CONNECTED (INCLUDES VACANT SECTIONS)
TOTAL PROPERTIES ELIGIBLE TO CONNECT
TOTAL CAPACITY (POPULATION EQUIVALENTS)
Katikati wastewater 1,825 394 2,219 4,600
Maketu/Little Waihi wastewater stage 1 477 73 550 3,000
Omokoroa wastewater 1,003 201 1,204 12,000
Te Puke wastewater 2,637 83 2,720 9,000
Waihi Beach wastewater 2,506 233 2,739 21,000
TOTAL 8,448 984 9,432 49,600
WASTEWATER | CHAPTER THREE | 296
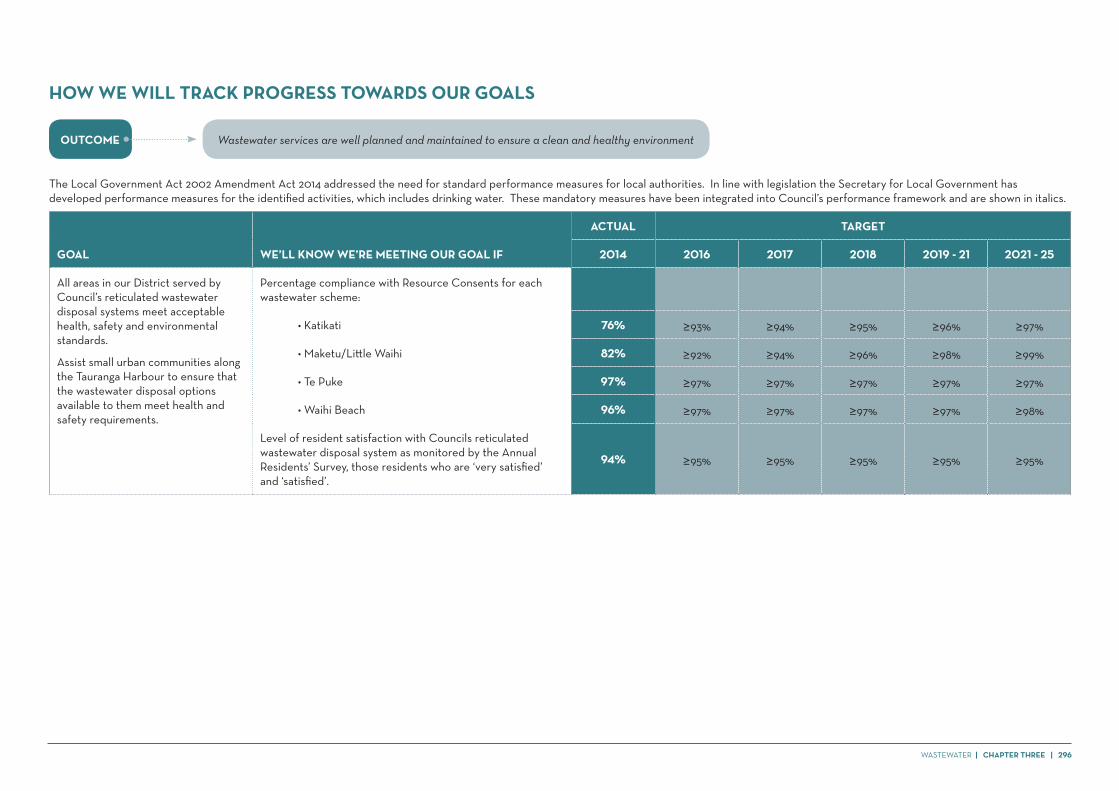
HOW WE WILL TRACK PROGRESS TOWARDS OUR GOALS
OUTCOME Wastewater services are well planned and maintained to ensure a clean and healthy environment
The Local Government Act 2002 Amendment Act 2014 addressed the need for standard performance measures for local authorities. In line with legislation the Secretary for Local Government has developed performance measures for the identified activities, which includes drinking water. These mandatory measures have been integrated into Council’s performance framework and are shown in italics.
GOAL WE’LL KNOW WE’RE MEETING OUR GOAL IF
ACTUAL TARGET
2014 2016 2017 2018 2019 - 21 2021 - 25
All areas in our District served by Council’s reticulated wastewater disposal systems meet acceptable health, safety and environmental standards.
Assist small urban communities along the Tauranga Harbour to ensure that the wastewater disposal options available to them meet health and safety requirements.
Percentage compliance with Resource Consents for each wastewater scheme:
• Katikati 76% ≥93% ≥94% ≥95% ≥96% ≥97%
• Maketu/Little Waihi 82% ≥92% ≥94% ≥96% ≥98% ≥99%
• Te Puke 97% ≥97% ≥97% ≥97% ≥97% ≥97%
• Waihi Beach 96% ≥97% ≥97% ≥97% ≥97% ≥98%
Level of resident satisfaction with Councils reticulated wastewater disposal system as monitored by the Annual Residents’ Survey, those residents who are ‘very satisfied’ and ‘satisfied’.
94% ≥95% ≥95% ≥95% ≥95% ≥95%

297 | CHAPTER THREE | WASTEWATER
HOW WE WILL TRACK PROGRESS - LEVELS OF SERVICE
WHAT WE PROVIDE WE’LL KNOW WE’RE MEETING THE SERVICE IF
ACTUAL TARGET
2014 2016 2017 2018 2019 - 21 2022 - 25
Maintain wastewater systems and have capacity to meet demand.
The number of dry weather sewerage overflows from Council’s sewerage system, expressed per 1000 sewerage connections to that sewerage system.
NOTE: only applies when, 1mm of rain has fallen in a 24 hr period.
NEW ≤2 ≤2 ≤2 ≤2 ≤2
Compliance with resource consents for discharge from the sewerage system measured by the number of; • Abatement notices
• Infringement notices
• Enforcement orders
• Convictions
received in relation to those resource consents.
NEW 0 0 0 0 0
Provide wastewater services that meet customer needs.
The median response time for Council to attend to sewerage overflows resulting from a blockage or other fault in the Council sewerage system.
• Attendance time: from the time that Council receives notification to the time that service personnel reach the site.
NEW ≤1 hour ≤1 hour ≤1 hour ≤1 hour ≤1 hour
• Resolution time: from the time that Council receives notification to the time that service personnel confirm resolution of the blockage or other fault.
NEW ≤24 hours ≤24 hours ≤24 hours ≤24 hours ≤24 hours
The total number of complaints received by Council about:
• Sewerage odour
• Sewerage system faults
• Sewerage system blockages
• Council’s response to issues with sewerage system
NEW ≤45 ≤45 ≤45 ≤45 ≤45
Expressed per 1000 connections to the Councils sewerage system.
WASTEWATER | CHAPTER THREE | 298
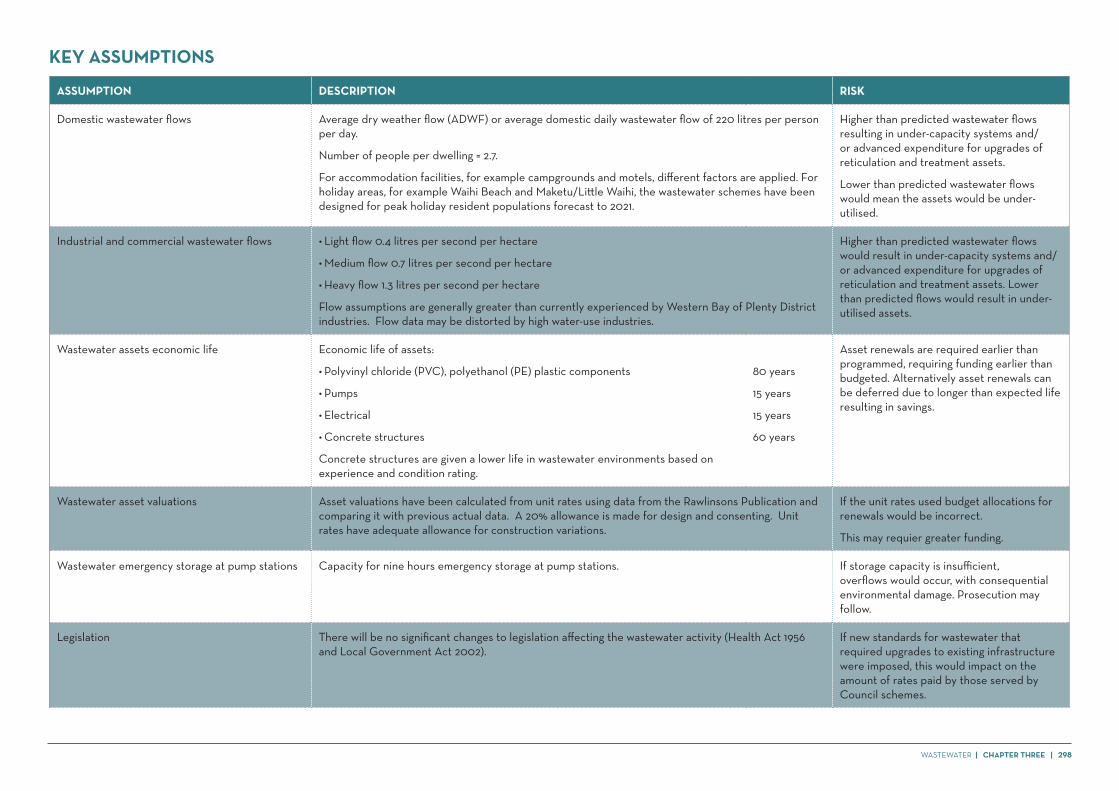
KEY ASSUMPTIONS
ASSUMPTION DESCRIPTION RISK
Domestic wastewater flows Average dry weather flow (ADWF) or average domestic daily wastewater flow of 220 litres per person per day.
Number of people per dwelling = 2.7.
For accommodation facilities, for example campgrounds and motels, different factors are applied. For holiday areas, for example Waihi Beach and Maketu/Little Waihi, the wastewater schemes have been designed for peak holiday resident populations forecast to 2021.
Higher than predicted wastewater flows resulting in under-capacity systems and/or advanced expenditure for upgrades of reticulation and treatment assets.
Lower than predicted wastewater flows would mean the assets would be under-utilised.
Industrial and commercial wastewater flows • Light flow 0.4 litres per second per hectare
• Medium flow 0.7 litres per second per hectare
• Heavy flow 1.3 litres per second per hectare
Flow assumptions are generally greater than currently experienced by Western Bay of Plenty District industries. Flow data may be distorted by high water-use industries.
Higher than predicted wastewater flows would result in under-capacity systems and/or advanced expenditure for upgrades of reticulation and treatment assets. Lower than predicted flows would result in under-utilised assets.
Wastewater assets economic life Economic life of assets:
• Polyvinyl chloride (PVC), polyethanol (PE) plastic components
• Pumps
• Electrical
• Concrete structures
Concrete structures are given a lower life in wastewater environments based on experience and condition rating.
80 years
15 years
15 years
60 years
Asset renewals are required earlier than programmed, requiring funding earlier than budgeted. Alternatively asset renewals can be deferred due to longer than expected life resulting in savings.
Wastewater asset valuations Asset valuations have been calculated from unit rates using data from the Rawlinsons Publication and comparing it with previous actual data. A 20% allowance is made for design and consenting. Unit rates have adequate allowance for construction variations.
If the unit rates used budget allocations for renewals would be incorrect.
This may requier greater funding.
Wastewater emergency storage at pump stations Capacity for nine hours emergency storage at pump stations. If storage capacity is insufficient, overflows would occur, with consequential environmental damage. Prosecution may follow.
Legislation There will be no significant changes to legislation affecting the wastewater activity (Health Act 1956 and Local Government Act 2002).
If new standards for wastewater that required upgrades to existing infrastructure were imposed, this would impact on the amount of rates paid by those served by Council schemes.
299 | CHAPTER THREE | WASTEWATER
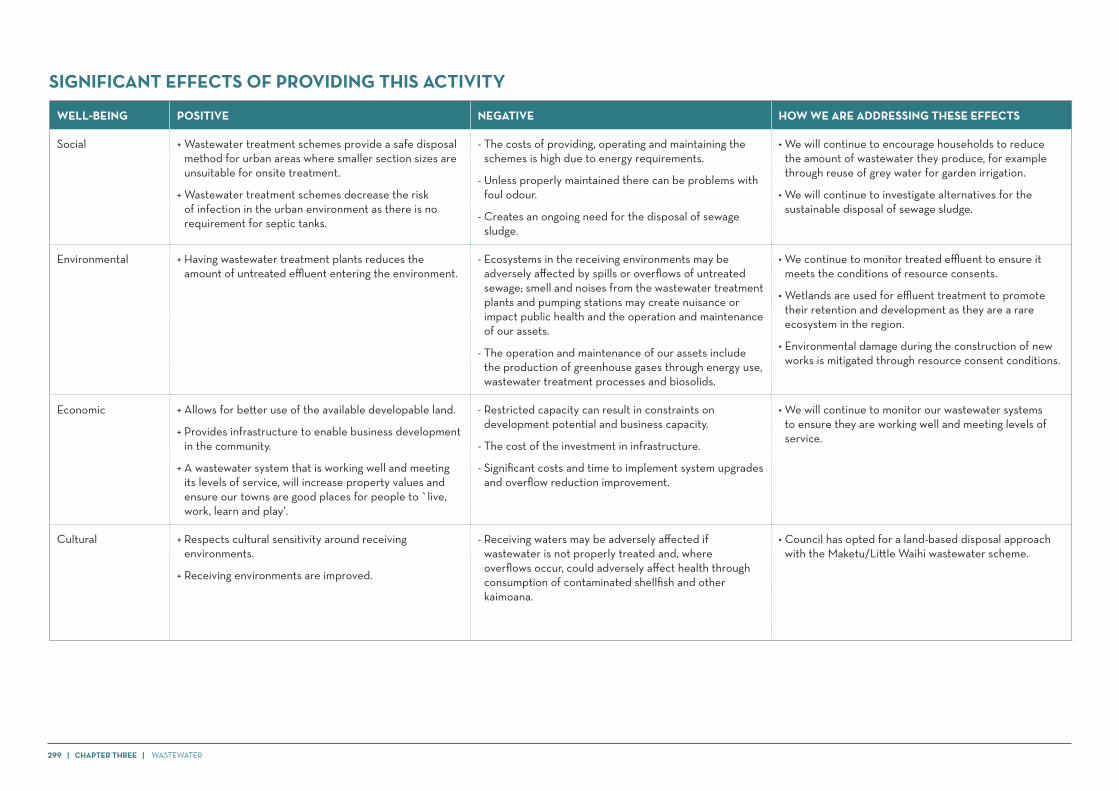
SIGNIFICANT EFFECTS OF PROVIDING THIS ACTIVITY
WELL-BEING POSITIVE NEGATIVE HOW WE ARE ADDRESSING THESE EFFECTS
Social + Wastewater treatment schemes provide a safe disposal method for urban areas where smaller section sizes are unsuitable for onsite treatment.
+ Wastewater treatment schemes decrease the risk of infection in the urban environment as there is no requirement for septic tanks.
- The costs of providing, operating and maintaining the schemes is high due to energy requirements.
- Unless properly maintained there can be problems with foul odour.
- Creates an ongoing need for the disposal of sewage sludge.
• We will continue to encourage households to reduce the amount of wastewater they produce, for example through reuse of grey water for garden irrigation.
• We will continue to investigate alternatives for the sustainable disposal of sewage sludge.
Environmental + Having wastewater treatment plants reduces the amount of untreated effluent entering the environment.
- Ecosystems in the receiving environments may be adversely affected by spills or overflows of untreated sewage; smell and noises from the wastewater treatment plants and pumping stations may create nuisance or impact public health and the operation and maintenance of our assets.
- The operation and maintenance of our assets include the production of greenhouse gases through energy use, wastewater treatment processes and biosolids.
• We continue to monitor treated effluent to ensure it meets the conditions of resource consents.
• Wetlands are used for effluent treatment to promote their retention and development as they are a rare ecosystem in the region.
• Environmental damage during the construction of new works is mitigated through resource consent conditions.
Economic + Allows for better use of the available developable land.
+ Provides infrastructure to enable business development in the community.
+ A wastewater system that is working well and meeting its levels of service, will increase property values and ensure our towns are good places for people to `live, work, learn and play’.
- Restricted capacity can result in constraints on development potential and business capacity.
- The cost of the investment in infrastructure.
- Significant costs and time to implement system upgrades and overflow reduction improvement.
• We will continue to monitor our wastewater systems to ensure they are working well and meeting levels of service.
Cultural + Respects cultural sensitivity around receiving environments.
+ Receiving environments are improved.
- Receiving waters may be adversely affected if wastewater is not properly treated and, where overflows occur, could adversely affect health through consumption of contaminated shellfish and other kaimoana.
• Council has opted for a land-based disposal approach with the Maketu/Little Waihi wastewater scheme.
WASTEWATER | CHAPTER THREE | 300
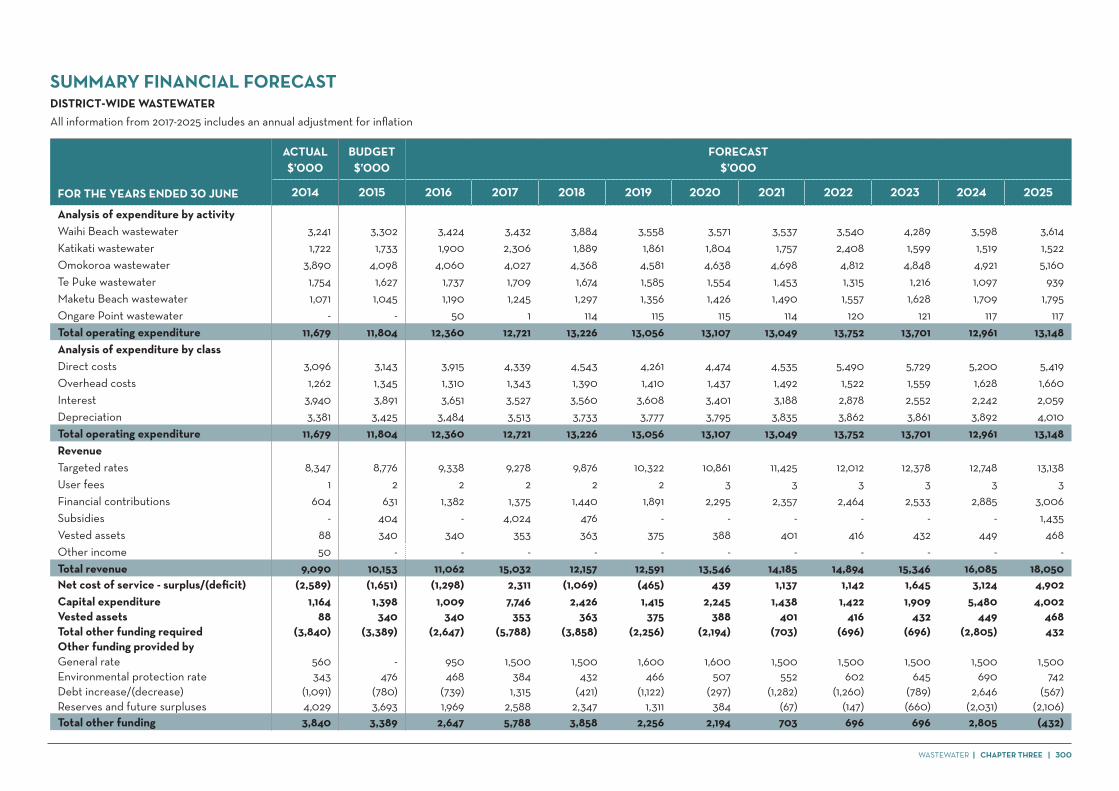
SUMMARY FINANCIAL FORECASTDISTRICT-WIDE WASTEWATERAll information from 2017-2025 includes an annual adjustment for inflation
FOR THE YEARS ENDED 30 JUNE
ACTUAL$’000
BUDGET$’000
FORECAST$’000
2014 2015 2016 2017 2018 2019 2020 2021 2022 2023 2024 2025
Analysis of expenditure by activityWaihi Beach wastewater 3,241 3,302 3,424 3,432 3,884 3,558 3,571 3,537 3,540 4,289 3,598 3,614Katikati wastewater 1,722 1,733 1,900 2,306 1,889 1,861 1,804 1,757 2,408 1,599 1,519 1,522Omokoroa wastewater 3,890 4,098 4,060 4,027 4,368 4,581 4,638 4,698 4,812 4,848 4,921 5,160Te Puke wastewater 1,754 1,627 1,737 1,709 1,674 1,585 1,554 1,453 1,315 1,216 1,097 939Maketu Beach wastewater 1,071 1,045 1,190 1,245 1,297 1,356 1,426 1,490 1,557 1,628 1,709 1,795Ongare Point wastewater - - 50 1 114 115 115 114 120 121 117 117Total operating expenditure 11,679 11,804 12,360 12,721 13,226 13,056 13,107 13,049 13,752 13,701 12,961 13,148Analysis of expenditure by classDirect costs 3,096 3,143 3,915 4,339 4,543 4,261 4,474 4,535 5,490 5,729 5,200 5,419Overhead costs 1,262 1,345 1,310 1,343 1,390 1,410 1,437 1,492 1,522 1,559 1,628 1,660Interest 3,940 3,891 3,651 3,527 3,560 3,608 3,401 3,188 2,878 2,552 2,242 2,059Depreciation 3,381 3,425 3,484 3,513 3,733 3,777 3,795 3,835 3,862 3,861 3,892 4,010Total operating expenditure 11,679 11,804 12,360 12,721 13,226 13,056 13,107 13,049 13,752 13,701 12,961 13,148RevenueTargeted rates 8,347 8,776 9,338 9,278 9,876 10,322 10,861 11,425 12,012 12,378 12,748 13,138User fees 1 2 2 2 2 2 3 3 3 3 3 3Financial contributions 604 631 1,382 1,375 1,440 1,891 2,295 2,357 2,464 2,533 2,885 3,006Subsidies - 404 - 4,024 476 - - - - - - 1,435Vested assets 88 340 340 353 363 375 388 401 416 432 449 468Other income 50 - - - - - - - - - - -Total revenue 9,090 10,153 11,062 15,032 12,157 12,591 13,546 14,185 14,894 15,346 16,085 18,050Net cost of service - surplus/(deficit) (2,589) (1,651) (1,298) 2,311 (1,069) (465) 439 1,137 1,142 1,645 3,124 4,902Capital expenditure 1,164 1,398 1,009 7,746 2,426 1,415 2,245 1,438 1,422 1,909 5,480 4,002Vested assets 88 340 340 353 363 375 388 401 416 432 449 468Total other funding required (3,840) (3,389) (2,647) (5,788) (3,858) (2,256) (2,194) (703) (696) (696) (2,805) 432Other funding provided byGeneral rate 560 - 950 1,500 1,500 1,600 1,600 1,500 1,500 1,500 1,500 1,500Environmental protection rate 343 476 468 384 432 466 507 552 602 645 690 742Debt increase/(decrease) (1,091) (780) (739) 1,315 (421) (1,122) (297) (1,282) (1,260) (789) 2,646 (567)Reserves and future surpluses 4,029 3,693 1,969 2,588 2,347 1,311 384 (67) (147) (660) (2,031) (2,106)Total other funding 3,840 3,389 2,647 5,788 3,858 2,256 2,194 703 696 696 2,805 (432)
301 | CHAPTER THREE | WASTEWATER
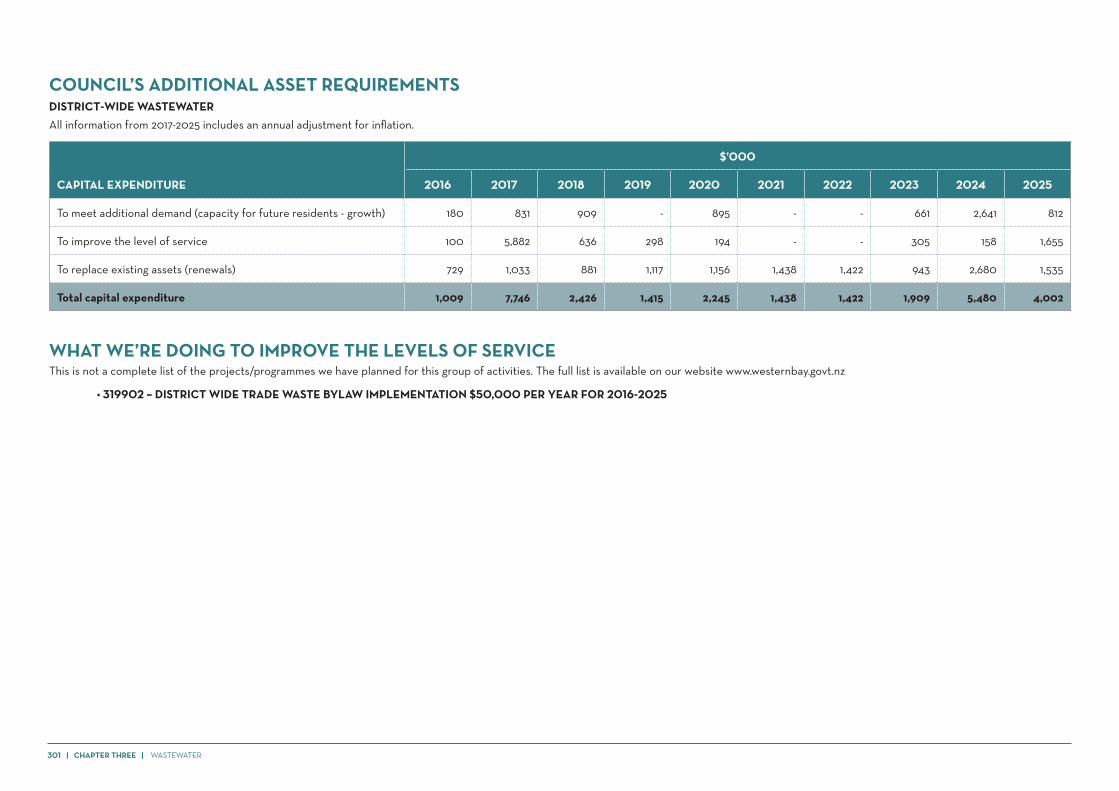
COUNCIL’S ADDITIONAL ASSET REQUIREMENTSDISTRICT-WIDE WASTEWATERAll information from 2017-2025 includes an annual adjustment for inflation.
CAPITAL EXPENDITURE
$’000
2016 2017 2018 2019 2020 2021 2022 2023 2024 2025
To meet additional demand (capacity for future residents - growth) 180 831 909 - 895 - - 661 2,641 812
To improve the level of service 100 5,882 636 298 194 - - 305 158 1,655
To replace existing assets (renewals) 729 1,033 881 1,117 1,156 1,438 1,422 943 2,680 1,535
Total capital expenditure 1,009 7,746 2,426 1,415 2,245 1,438 1,422 1,909 5,480 4,002
WHAT WE’RE DOING TO IMPROVE THE LEVELS OF SERVICEThis is not a complete list of the projects/programmes we have planned for this group of activities. The full list is available on our website www.westernbay.govt.nz
• 319902 – DISTRICT WIDE TRADE WASTE BYLAW IMPLEMENTATION $50,000 PER YEAR FOR 2016-2025

WASTEWATER | CHAPTER THREE | 302
WASTEWATER
COMMUNITY OUTCOMEWastewater services are well planned and maintained to ensure a clean and healthy environment.
GOALS• All areas in our District served by our reticulated wastewater disposal systems meet acceptable health, safety and environmental standards.• Assist small urban communities along the Tauranga Harbour to ensure that the wastewater disposal options available to them meet health and safety requirements.
DISCUSSION / RATIONALE FUNDING APPROACH
Provision of reticulated wastewater systems in the district provides public health and sanitation benefits to the community. If adequate wastewater disposal systems were unavailable economic development may be constrained or environmental standards may be compromised, which would affect the community as a whole.Individuals provided with reticulated wastewater can be identified and charged for the service. Wastewater reticulation systems, treatment facilities and disposal systems have surplus capacity designed to cater for growth. Developers who take advantage of this capacity by subdividing can be identified and charged.Increased volumes of wastewater produced by some commercial and industrial users (trade waste) require that the capacity of the system be larger. Higher toxicity of the wastewater produced by some users requires more treatment in order to meet consents for disposal.Many ratepayers are not connected to our wastewater systems and construct and maintain their own septic tanks.Actions that result in increased expenditure on this activity include: • Illegal disposal of stormwater into the wastewater systems via illegal private connections and
sub-standard private connections • Infiltration and inflow into reticulation systems through poorly maintained or badly
constructed reticulation systems • Illegal discharges of trade waste into domestic sewers • Trade waste discharges which are not measured or charged • Pollution of the harbour and coastal areas from poorly maintained septic tanks • Pollution caused by septic tank de-sludging • Contractors disposing of septage at non-conforming disposal sites.Wastewater infrastructure typically has a long life: • Reticulation and manholes 60 to 100 years, depending on pipe material • Pumps and pump stations 25 years on average • Wastewater treatment and disposal facilities 50 years.
Capital expenditureInitially financed from loans and serviced from: • Financial contributions, if expenditure is to accommodate growth and/or to pay for the
consumption of excess capacity in the wastewater supply system. Includes the related loan servicing (holding) costs
• Wastewater targeted rates over the applicable area of benefit for capital expenditure (excluding renewals) to service existing ratepayers.
Operational, maintenance and renewals expenditure including financing costs that relate to existing ratepayersFunding sources to cover 96% of the revenue requirement include: • Area of benefit targeted rates (uniform charges) • Availability charges • Multiple connection charges • Capital charges • Financial contributions • Fees and charges from trade waste and connections • Subsidies (if available).To fund 4% of the revenue requirement: • Environmental protection rate.General Rates may be used to service interest payments and growth related debt in times of low growth.
SUMMARY FINANCIAL FORECASTKATIKATI WASTEWATER
303 | CHAPTER THREE | WASTEWATER
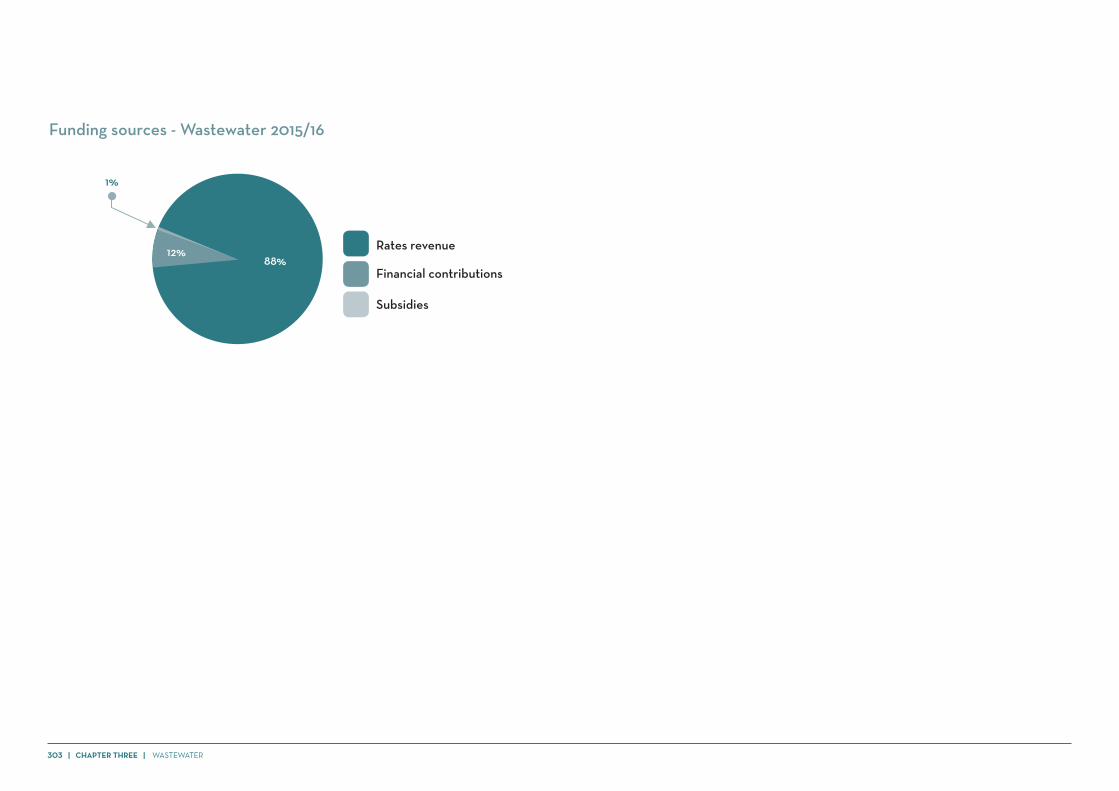
Funding sources - Wastewater 2015/16
Rates revenue
Financial contributions
Subsidies
88%12%
1%


