42
Wastewater Advisory Commi1ee Wastewater Pipeline Asset Management & Protec5on John Vetere Stephen Cullen Margery Johnson Patrick Smith October 4, 2013

Wastewater Advisory Commi1ee
Wastewater Pipeline Asset Management & Protec5on
John Vetere Stephen Cullen Margery Johnson Patrick Smith
October 4, 2013

Today’s Agenda
• Overview of MWRA Sewer System • Asset ProtecKon • Pipeline InspecKon
• Pipeline Maintenance • I/I Local Financial Assistance Program
• Pipeline Renewal
• QuesKons
2
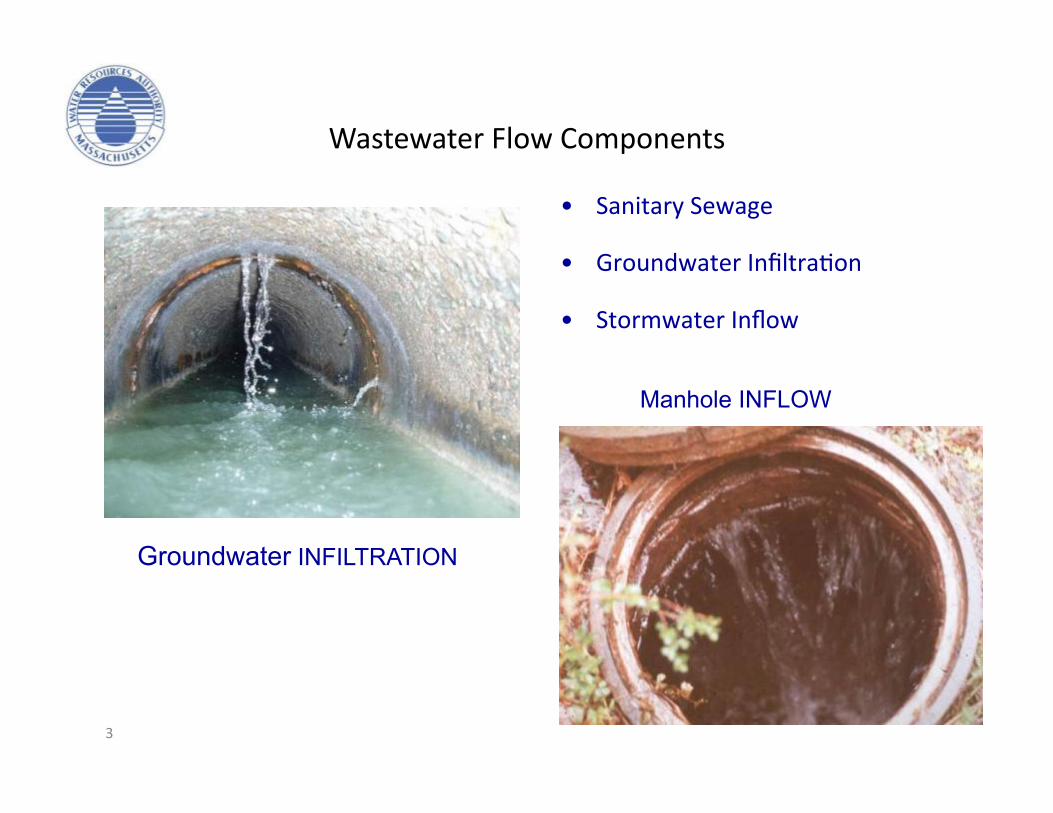
Wastewater Flow Components
Manhole INFLOW
Groundwater INFILTRATION
3
• Sanitary Sewage
• Groundwater InfiltraKon
• Stormwater Inflow

Wastewater Flow Components
Downspout Inflow
Sump Pump Inflow
4
• Stormwater inflow from private property
• IdenKfy private inflow sources using smoke tesKng, dye tracing, and house-‐to-‐house inspecKons

5

Sewers by Type
Sewer Type Miles Percent
Gravity Sewers 227 82.4% Cross-‐Harbor Tunnels 18.1 6.6%
Force Mains 20 7.3%
Siphons 7 2.5%
CSO Ou]alls 3.4 1.2%
Total 275.5 100%
6

Wastewater Pipeline Work Order History
66%
34%
0%
TV INSPECTION Work orders by Type
PM
CM
EM 79%
21% 0%
MAINTENANCE Work order by type
PM
CM
EM
PM – Preventa@ve Maintenance CM – Correc@ve Maintenance EM – Emergency Maintenance

InspecKon Goals Gravity Pipeline, Siphon Barrels, Structures
• CCTV Inspect 32 Miles/13% of the system annually.
The en5re gravity system(227 miles) is inspected once every 7 years.
• Inspect 20 Siphons(48 individual barrels)/44% of the system annually.
The en5re siphon system(61 siphons, 109 individual barrels) is inspected once every 3 years.
• Inspect 650 structures/16% of the system annually.
The en5re structure system(4,000 structures) is inspected once every 6 years.
8

9

Wastewater Pipeline TV InspecKon/Maintenance
Wastewater Pipeline Performance Measure
TV InspecKons FY14
Sewer Line CCTV InspecKons (Miles) 32
Siphon InspecKons (Number of Barrels) 48 (2.3 miles)
Structure InspecKons (Includes Manholes, Head Houses, 650
Diversion, Tide Gate and JuncKon Structures)
Wastewater Pipeline
Interceptor Cleaning (Miles) 36
Siphon Cleaning (Number of Barrels) 36 (1.7 miles)
Manhole Frame and Cover Replacement 108
10

Maintenance Goals
Gravity Pipeline, Siphon Barrels, Structures
• Maintain 36 Miles/16% of the system annually.
The en5re gravity system(227 miles) is inspected once every 7 years.
• Replace 108 Structure Frames and Covers/2.7% of the system annually.
The en5re structure system(4,000 structures) is inspected once every 6 years.
• Maintain 20 Siphons(36 individual barrels)/33% of the system annually.
The en5re siphon system(61 siphons, 109 individual barrels) is cleaned once every 3 years.
11

Wastewater Pipeline and Structure Inspections and Maintenance August 2013, FY 14
Inspections
Maintenance
0
5
10
15
20
25
30
35
40
J A S O N D J F M A M J
Mile
s
Pipeline Inspections
Monthly Inspections
0
5
10
15
20
25
30
35
40
J A S O N D J F M A M J
Mile
s
Pipeline Cleaning
Hydraulic Cleaning Mechanical Cleaning
YTD Actual
Target = 3 miles monthly or 36 miles annually
0
100
200
300
400
500
600
700
J A S O N D J F M A M J
# of
Str
uctu
res
Structure Inspections
Monthly
YTD Actual
Target = 54 monthly or 650 annually
0
20
40
60
80
100
120
J A S O N D J F M A M J
# of
Man
hole
s
Manhole Rehabilitation
Monthly Inspections
YTD Actual
F&C Target = 9 monthly or 108/10% of the system annually
0
10
20
30
40
50
60
J A S O N D J F M A M J
# of
Sip
hon
Bar
rels
Inverted Siphon Inspections
Monthly Inspections
Target = 4 monthly or 48 / 38% of the system annually
YTD Actual
0
5
10
15
20
25
30
35
40
J A S O N D J F M A M J
# of
Sip
hon
Bar
rels
Inverted Siphon Cleaning
Monthly Cleaning
YTD Actual
Target = 3 monthly or 36 / 33% of the system annually
YTD Actual
Target = 2.67 miles monthly or 32 miles/13% of the system annually
Staff inspected 4 siphon barrels during the month of August. Year to date total is 9 inspections.
Staff internally inspected 3.20 miles of MWRA sewer pipeline during the month of August. The year to date total is 4.71 miles. No Community Assistance was provided this month.
Staff inspected the 12 CSO structures and performed 28 additional manhole/structure inspections during the month of August. The year to date total is 152 inspections.
Staff cleaned 1.50 miles of MWRA's sewer system and removed 9 yards of grit and debris during the month of August. The year to date total is 3.18 miles. No Community Assistance was provided this month.
Staff replaced 15 frames & covers during the month of August. The year to date total is 40.
Staff cleaned 12 siphon barrels during the month of August. The year to date total remains at 22 barrels.
Wastewater Pipeline and Structure InspecKons and Maintenance August 2013, FY 14
12

Wastewater Pipeline TV InspecKon
FuncKon/ResponsibiliKes
TV InspecKon
• Closed Circuit Television InspecKon(CCTV) of MWRA Interceptors
• Structure InspecKons – Manhole, Tide gate, Diversion, JuncKon
& Head House – Pole Camera System
• Siphon InspecKon – Sonar Camera System • Wet Weather System Monitoring
Community Assistance
• CCTV of Member Community Sewer Systems as Requested
13

14
Closed Circuit Television InspecKon(CCTV)

Sonar System – Siphon InspecKons
15

Siphon InspecKon Equipment
16

Walpole Extension Sewer, Norwood 1 -‐ 36” Barrel Siphon
Before and Aker Cleaning
17

Wastewater Pipeline Maintenance
Maintenance
• Hydraulic Cleaning of MWRA Interceptors/Siphons –Vactor Jet
• Mechanical Cleaning of MWRA Interceptors/Siphons –Bucket Machines
• Manhole Frame and Cover Replacement
• NPDES Monthly InspecKons
• Facility Wet Well Cleaning • Spot Repair-‐ Manhole/Head House Structures and Sewer Pipelines
• Wet Weather Monitoring
18

Maintenance Equipment
19

Grease/Debris Removal
20

Maintenance Equipment
21

Grease/Debris Removal
22

Grease/Debris Removal
23

Maintenance Equipment
24

Grease/Debris Removal
25

Manhole Frame and Cover Replacement
26

Maintenance/TV InspecKon Training
• Right of Way -‐ MBTA
• Railroad Safety – MBCR • Confined Space Entry
• CPR/AED/First Aide
• Right to Know
• Work Zone Safety/Flagger
• Crane & Derrick Rigging/Signal • ARC Map 9
• OSHA 40 Hour Hazardous Waste
• OSHA 8 Hour Annual Review
• OSHA 10 Hour ConstrucKon
27

I/I Local Financial Assistance Program
• Community allocaKon based on percent sewer charge • $256M distributed through August 2013
• 45 percent grant / 55 percent interest-‐free loan • Loan repayment over 5 years
• All 43 communiKes parKcipaKng – over 450 projects funded
• 75% of funds to construcKon projects
• 25% of funds to planning and design projects
28

Long-‐Term Regional Flow Data
29
0
10
20
30
40
50
60
70
80
90
0
50
100
150
200
250
300
350
400
450
1989 1990 1991 1992 1993 1994 1995 1996 1997 1998 1999 2000 2001 2002 2003 2004 2005 2006 2007 2008 2009 2010 2011 2012
Rain
(inc
hes)
MG
DMWRA Long-Term Regional Flow Data
5-year Running Averages5 year running average NOAA Rainfall at Logan Airport
Rain Total System 5 year average North System 5 year average South System 5 year average

Pipeline Renewal Overall Goals
• PrioriKze CondiKon of all Pipelines • ProacKve Replacement/RehabilitaKon of Pipelines • Minimize Pipeline System Risk and Consequence of Failure
30

Interceptor Renewal Decision Support Model
31

A' Rated Pipe 52 MI, 23%
B' Rated Pipe 139 MI, 61%
C' Rated Pipe 18 MI, 8%
Unrated Gravity Pipe 18 MI, 8%
Pipeline CondiKon RaKngs (Pipeline Miles %)
32

MWRA Sewer System Pipelines (by material)
Vitrified Clay (VC) & Akron5%
Reinforced Concrete (RC)32%
Poured in Place Concrete (PIP)22%
Cast Iron (CI) & Ductile Iron (DI)10%
Brick (BR)26%
Prestressed Concrete Cylinder Pipe (PCCP)
2%
Plastic (PL) & Fiberglass3%
33

“C” Rated Pipe
34

RehabilitaKon of SecKon 156 (MDC 17.5) Evere1, MA
CIPP air/steam process
35

36
Sewer Siphon/ Manhole RehabilitaKon

Manhole Structure Replacement
37

Manhole Structure Replacement
38

39
Sewer RehabilitaKon
Completed Rehabilitation of Sections 83 (Arlington) and 160 (Winchester/Medford) using Cured-in-Place Technology

Completed Projects (2004-‐2013)
Sec@on No. 2006 Size Length Cost Method Substan@al
Contract MWRA MDC Rank Loca@on (in) (P) ($million) Comple@on Comment
6798 172 93A N/A Lexington 36
4,000 $ 1.5 CIPP 2004
Advanced deterioraKon moved project Up (project awarded before ranking list)
6840 37 37 3 East Boston 41x36
6,000 $ 5.1 CIPP 2005 Scheduled ConstrucKon/CondiKon and Hydraulic Relief
6842 80/82/83 80/82/83 15/25/14
0 Arlington 20
4,500 $ 1.2 CIPP 2007 Deformed secKon moved project Up
6843 160/153part MVS 123/49 Winchester/Medford 28x26
9,500 $ 1.6 CIPP 2008 Deformed secKon moved project up
6629 529/530
(new686/688) 29/30 115/120 Newton/West Roxbury 15 to 45x48
11,100 $ 8.3
Cut and cover 2008
Scheduled ConstrucKon/CondiKon and Hydraulic Relief (new 685/687)
6191 526/527/528
(new 685/687) 26/27/28 13/22/27 West Roxbury 42
18,500 $ 37.9 Jacking / cut
and cover 2008 Scheduled ConstrucKon/CondiKon and Hydraulic Relief (new 685/687)
6841 38/208/207 38/38BR/37BR 34/2/35 East Boston 15
5,300 $ 7.0 Pipe Burst 2010 Scheduled ConstrucKon/CondiKon and Hydraulic Relief
6257 39
(new255/256) 39 1 East Boston 36/48/66
13,000 $ 59.0 MicroTunnel 2011 Scheduled ConstrucKon/CondiKon and Hydraulic Relief (new 255/256)
5310 624 124 283 Weymouth 60x57
2,100 $ 2.5 CIPP 2011 Scheduled ConstrucKon/ B-‐W Hydraulic Relief and poor condiKon
7393 156 17.5 14 Evere1 61x56
1,700 $ 2.5 CIPP 2012 DeterioraKng Pipe moved project Up
Total 75,700 $ 126.6
40

FUTURE PROGRAMS FOR REHABILITATION
Sec@on Total Built Material Project Es@mated Construc@on
MWRA(MDC) Pipe Size (yr) Community Name No. Cost ($M) NTP
27 4,793 69x62 1893 Brick Somerville Metro Cambridge Branch 1 Aug-‐16
26 4,233 78x69 1893 Brick Somerville Metro Cambridge Branch 1 10.5 Aug-‐16
240(9) 3,582 48x36 1895 Brick Dorchester Dorchester IntercepKng Sewer 2 Sep-‐18
241(10) 1,557 48x36 1895 Brick Dorchester Dorchester IntercepKng Sewer 2 Sep-‐18
242(11) 1,361 42x28 1896 Brick Dorchester Dorchester IntercepKng Sewer 2 Sep-‐18
73 3,600 18 1919 VC/CI Woburn North Met Relief Sewer 2 Sep-‐18
74 3,164 18 1919 VC Stoneham North Met Relief Sewer 2 Sep-‐18
75 5,456 18 1919 VC Stoneham North Met Relief Sewer 2 8.0 Sep-‐18
62 2,788 48 1904 Brick Chelsea Metro Revere Extension Sewer 3 Sep-‐21
15 1,741 106x98 1892 Brick Chelsea Metropolitan Sewer 3 Sep-‐21
14 3,445 106x106 1893 Brick Chelsea Metropolitan Sewer 3 Sep-‐21
12 3,034 111x100 1983 Brick Chelsea Metropolitan Sewer 3 17.0 Sep-‐21
23 2,268 80x72 1893 Brick Evere1 Metro Cambridge Branch 4 Sep-‐24
24 2,162 80x72 1892 Brick Evere1 Metro Cambridge Branch 4 Sep-‐24
164 8,027 62x54 1892 Brick Brighton Charles River Valley Sewer 4 Sep-‐24
163 5,300 62x54 1892 Brick Brighton Charles River Valley Sewer 4 12.5 Sep-‐24
607(107) 3,568 75x72 1930 PIP Milton New Neponset Valley Sewer 5 Sep-‐27
608(108) 3,568 75x72 1930 PIP Milton New Neponset Valley Sewer 5 Sep-‐27
608(108) 4,450 75x72 1930 PIP Milton New Neponset Valley Sewer 5 Sep-‐27
610(110) 3,180 75x72 1932 PIP Milton New Neponset Valley Sewer 5 11.0 Sep-‐27
Total 71,277 =13.54 miles $ 59.0

QuesKons?
42


